

Abstract
Purpose:
To evaluate the performance of a novel ultra-high resolution multi-detector CT scanner (Canon Aquilion Precision UHR CT), capable of visualizing ~150 μm details, in quantitative assessment of bone microarchitecture. Compared to conventional CT, the spatial resolution of UHR CT begins to approach the size of the trabeculae. This might enable measurements of microstructural correlates of osteoporosis, osteoarthritis, and other bone disease.
Methods:
The UHR CT system features a 160-row x-ray detector with 250×250 μm pixels (measured at isocenter) and a custom-designed x-ray source with a 0.4×0.5 mm focal spot. Visualization of high contrast details down to ~150 μm has been achieved on this device, which is now commercially available for clinical use. To evaluate the performance of UHR CT in quantification of bone microstructure, we imaged a variety of human bone samples (including ulna, radius, and vertebrae) embedded in a ~16 cm diameter plastic cylinder and in an anthropomorphic thorax phantom (QRM-Thorax, QRM Gmbh). Helical UHR CT acquisitions (120 kVp tube voltage) were acquired at scan exposures of 375 mAs - 5 mAs. For comparison, the samples were also imaged using a Normal Resolution (NR) mode available on the scanner, involving 500 μm slice thickness, exposure of 50 mAs, and a focal spot of 0.6×1.3 mm. We obtained micro-CT (μCT) of the bone samples at ~28 μm voxel size as a gold-standard reference. Geometric measurements of bone microstructure were performed in 17 regions-of-interests (ROIs) distributed throughout the bones of the phantoms; image registration was used to place the ROIs at corresponding locations in the UHR CT and NR CT. Trabecular thickness Tb.Th, spacing Tb.Sp, and Bone Volume fraction BvTv were obtained. The UHR and NR imaging protocols were compared terms of correlations to μCT and error of trabecular measurements. The effect of dose on trabecular morphometry was also studied for the UHR CT. Furthermore, we evaluated the sensitivity of texture features of trabecular bone (recently proposed as an alternative to geometric indices of microstructure) to imaging protocol. Image texture evaluation was performed using ~150 regions of interest (ROIs) across all bone samples. Three-dimensional Gray Level Co-occurrence Matrix (GLCM) and Gray Level Run Length Matrix (GLRM) features were extracted for each ROI. We analyzed correlation and concordance correlation coefficient (CCC) of the mean ROI values of texture features obtained using the UHR and NR modes.
Results:
UHR CT reconstructions of bone samples clearly demonstrated improved visualization of the trabeculae compared to NR CT. UHR CT achieved substantially better correlations for all three metrics of bone microstructure, in particular for BvTv (correlation coefficient of 0.91 for UHR CT compared to 0.84 for NR CT) and TbSp (correlation of 0.74 for UHR CT and 0.047 for NR CT). The error obtained with UHR CT was generally smaller than that of NR CT. For TbSp, the mean deviation from μCT (averaged across all bone samples) was only ~0.07 for UHR CT, compared to 0.25 for NR CT. Analysis of reproducibility of texture features of trabecular bone between UHR CT and NR CT revealed fair correlations (>0.7) for the majority of GLCM features, but relatively poor CCC (e.g. 0.02 for Energy and 0.04 for Entropy). The magnitude of texture metrics is particularly affected by the enhanced spatial resolution of UHR CT.
Conclusion:
The recently introduced UHR CT achieves improved correlation and reduced error in measurements of trabecular bone microstructure compared to conventional resolution CT. Future development of diagnostic strategies based on textural biomarkers derived from UHR CT will need to account for potential sensitivity of texture features to image resolution.
Keywords: bone microstructure, high resolution CT, quantitative CT, bone imaging
1. INTRODUCTION
It is well recognized that measurements of Bone Mineral Density (BMD) do not provide a complete picture of bone health. Ideally, BMD should be augmented with quantitative metrics of bone microarchitecture to obtain a more comprehensive diagnosis in e.g. osteoporosis or osteoarthritis. However, trabecular features are typically on the order of 80 – 100 μm, beyond the resolution of conventional imaging modalities.
The emerging Ultra High Resolution CT (UHR CT) technologies present an opportunity to achieve improved quantification of trabecular microstructure. Scanners such as the Somatom Force (Siemens) and Aquilion Precision (Canon) offer 1.5× – 2× finer spatial resolution compared to current standards, achieving visualization of ~150 μm details [1–3]. This features size approaches that of the trabeculae [4], motivating the feasibility studies reported here.
We assess the performance of Canon Aquilion Precision UHR CT in trabecular measurement known from micro-CT (μCT), e.g. Bone Volume Fraction (BvTv), Trabecular Thickness (Tb.Th), and Trabecular Spacing (Tb.Sp). We also investigate the reproducibility of image texture-based features of trabecular bone [5–8]. Such features have recently been investigated as quantitative biomarkers of bone quality/fracture risk (“bone radiomics”), potentially better suited to the spatial resolution of diagnostic CT scanners than the geometric measurements discussed above.
The evaluation studies involve cadaveric human bone samples imaged over a range of imaging doses using UHR CT and compared to a CT protocol representative of the current clinical standard (Normal Resolution, NR).
2. METHODS
The UHR CT system is based on an innovative 160-row x-ray detector. The pixel size at the isocenter is only 250×250 μm pixels. To further enhance spatial resolution, the scanner implements a custom-designed x-ray source with a 0.4×0.5 mm focal spot, approx. 1/3 of the focal spot area of conventional CT tubes. The scanner can be operated both in the UHR mode and in an NR mode, where the detector is read out at 500 μm slice thickness and the x-ray focal spot is 0.6×1.3 mm.
Figure 1 compares NR CT and UHR CT reconstructions of two sections of one of the experimental phantoms used in the current study. The phantom consisted of a ~18 cm plastic cylinder containing samples of human radius, ulna, hamate, tibial plateau, and vertebrae. We used this test object to compare the performance of the UHR and NR modes in quantitative assessment of trabecular microstructure. Furthermore, we embedded the same bone samples in an anthropomorphic thorax phantom (QRM-Thorax, QRM Gmbh) to study the effects of imaging dose on UHR-based metrics of trabecular microarchitecture. The scans were obtained at 375mAs - 5mAs in the UHR mode and at 50mAs in the NR mode. The reconstructions were performed using an analytical algorithm (Filtered Back Projection) with the following kernels: FC30 (sharp reference images), FC30 with iterative denoising, FC50, and FC81. Here we report results for with the sharpest convolution kernel (FC30) and in-plane voxel size of ~0.09 mm for UHR CT (2048 matrix) and 0.35 mm for NR CT (512 matrix). The NR CT volumes were resampled onto a ~0.09 mm grid (matching the UHR volumes) for the analysis below. Reference micro-CT (μCT) scans of the bone samples were obtained using a SkyScan 1172 system at 28 μm voxel size.
Figure 1.

Example sections of the experimental phantom (top slice includes a vertebra, bottom includes radius and hamate) imaged using Normal Resolution (NR) and Ultra High Resolution (UHR) CT, both at 50 mAs exposure.
The trabecular measurements were obtained in 17 cylindrical regions of interest (ROIs) of approx. 10 mm × 10 mm × 3 mm: 5 ROIs in the ulna, 7 ROIs in the radius, 2 ROIs in the hamate, and 3 ROIs in the spine. The μCT scans was registered to the UHR CT and NR CT scans using MITK and the corresponding transformation matrix was saved. The ROIs were selected in the μCT scans and transferred to the UHR and NR CT volumes using the transformation matrix obtained from MITK. The ROIs were then binarized into the bone and background voxels using Otsu segmentation for μCT and local Bernsen thresholding for UHR and NR CT. The parameters of the Bernsen segmentation were established through an exhaustive search (sweep) to identify settings that provided balanced performance across all trabecular metrics (Bv/Tv, Tb.Th, and Tb.Sp) in terms of correlations with μCT.
Image texture evaluation was performed after the UHR and NR reconstructions were converted to 8-bit grayscale. Three-dimensional Gray Level Co-occurrence Matrix (GLCM) and Gray Level Run Length Matrix (GLRM) features were extracted for each ROI using the ITKTextureFeatures package (http://hdl.handle.net/10380/3574). Texture feature maps was generated throughout the entire trabecular volumes of the bones. For analysis, we measured the mean values of the features in 142 square ROIs (~0.35 mm3): 22 ROIs for ulna, 14 ROIs for hamate, and 106 ROIs for radius. The reproducibility was assessed in terms of correlation and concordance of the mean ROI values of the GLRM and GLCM features.
3. RESULTS AND BREAKTHROUGH WORK
Fig. 2 illustrates the visualization of trabecular detail on UHR and NR CT. UHR CT reveals more of the fine structures than NR CT. This improved resolution is apparent even at the low exposure level of 5 mAs, despite the increased noise. As shown in the bottom row of Figure 2, the bone segmentations generated from UHR CT generally agree better with reference μCT than those obtained from NR CT.
Figure 2.

Top row (from left to right): Reconstructions of human radius obtained using gold-standard μCT, UHR CT at two exposure levels, and NR CT. Bottom row shows example slice through one of the ROIs used for trabecular analysis, as well as a segmentation of that ROI (red overlay). The metrics of bone microstructure were computed from this segmentation.
Figure 3 examines the correlations between the two CT modalities and μCT at a matched exposure of 50 mAs. Each data point represents mean ROI value of a given trabecular measurement. UHR CT achieved substantially better correlations for the metrics of BvTv (correlation coefficient of 0.91 for UHR CT compared to 0.84 for NR CT) and TbSp (correlation of 0.74 for UHR CT and 0.047 for NR CT). For TbTh, both the UHR CT and NR CT protocols achieved satisfactory correlations of 0.8. Note that for both modalities, the settings of Bernsen segmentation might affect the values of correlation coefficients of the trabecular measurements. However, we investigate a broad range of parameters of the segmentation algorithm and the relative performance of UHR CT compared to NR CT (UHR CT providing improved correlations for at least a subset of the metrics) remained the same.
Figure 3.
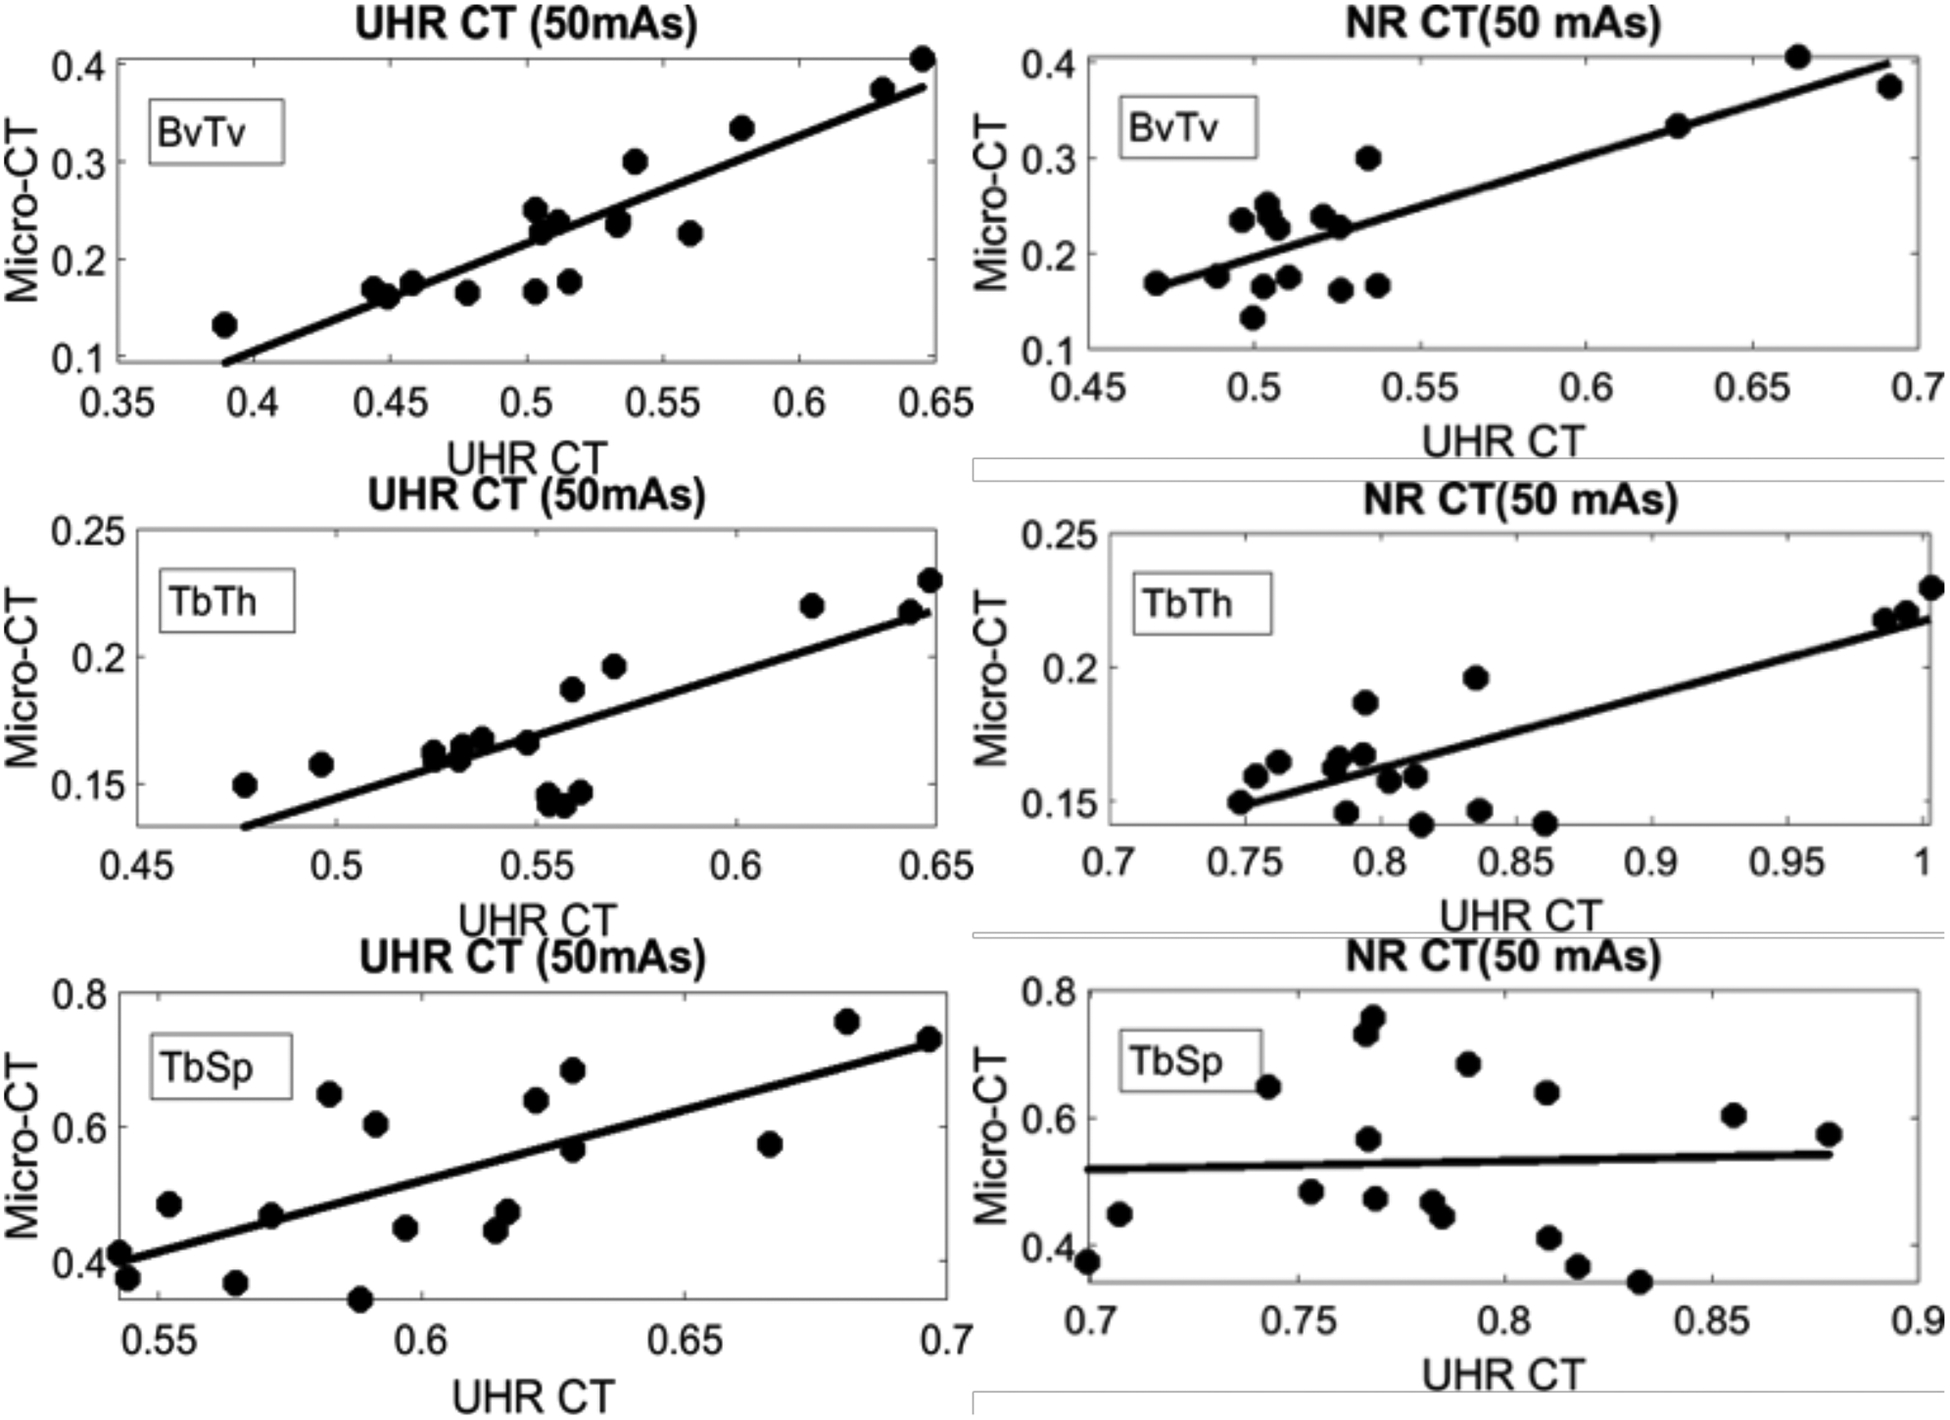
Correlations between reference μCT and UHR CT (left) and NR CT (right) for three common geometric measurements of bone microstructure. The correlation coefficients for UHR CT were 0.91 for BvTv, 0.74 for TbSp, and 0.8 for TbTh. The coefficients for NR CT were 0.85 for BvTv, 0.047 for TbSp, and 0.8 for TbTh.
Figure 4 investigates the agreement between the CT- and μCT-based measurements. While high correlation indicates that a given modality will be able to track changes in the bone metrics similarly to μCT, it does not necessarily imply a quantitative agreement in the measured magnitudes. As shown in Figure 4, both UHR CT and NR CT deviate substantially from reference μCT. However, the error obtained with UHR CT is generally smaller than that of NR CT, in particular for TbSp, where the mean deviation from μCT (averaged across all bone samples) was only ~0.07 for UHR CT, compared to 0.25 for NR CT.
Figure 4.

Deviations from reference μCT for the microstructural measurements obtained with the CT modalities. The formatting is similar to Bland-Altman plot: reference μCT on the horizontal axis, difference between the UHR CT (left) or NR CT (right) measurement and μCT on the vertical axis, the points represent different ROIs, and the solid line is the average difference of all ROIs. UHR CT exhibits lower errors of the trabecular metrics compared to NR CT.
Figure 5 illustrates the impact of scan exposure on UHR CT trabecular measurements in the anthropomorphic chest phantom. The correlations between In-Body UHR CT and μCT did not show a strong dependence on exposure down to approx. 100 mAs: the correlation coefficient of BvTv was ~0.9 or better, for TbTh it was ~ 0.8 or better, and for TbSp it was ~0.7 or better. At 50 mAs and below, the correlation coefficient of TbSp was markedly reduced (~0.4 or worse), suggesting the confounding effects of noise on the extraction of trabecular parameters.
Figure 5.

Impact of scan exposure on UHR CT trabecular morphometrics.
Figure 6 compares the GLCM texture features obtained from UHR CT (100 mAs) and NR CT (50 mAs) scans of the cylindrical phantom. The correlations between the mean ROI values of the texture measurements were fairly high for the majority of the features. We also investigated the concordance correlation coefficient (CCC) between NR CT and UHR CT. The CCC was fairly poor (~0.05) for Energy, Entropy, Correlation, Inverse Difference Moment (IDM), and Cluster Shades; only for Cluster Prominence and Haralick’s Correlation was the CCC in the 0.2 – 0.3 range. The example maps of Energy and Entropy (measured in the radius) shown in Fig. 6 indicate that the change in resolution between the two scan modes leads to a change in overall magnitude of the two texture features. Since CCC takes into account both correlation and agreement of the two variables, it is not surprising that the concordance analysis implies a fairly poor reproducibility of texture features between the NR and UHR modes. However, the high correlation of the features might be sufficient for translation of some of the predictive algorithms based on texture analysis from NR CT to UHR CT.
Figure 6.

Comparison of texture features measured in trabecular bone using UHR CT and NR CT.
4. CONCLUSIONS
The high spatial resolution provided by the new generation of UHR CT systems yields improved performance in the geometric indices of bone microstructure compared to conventional CT. Texture features extracted from UHR CT differ in magnitude from those measured in NR CT, reflecting the change in image appearance due to improved spatial resolution. However, the textural metrics appear to be well correlated between UHR and NR CT. Therefore, some of the predictive models (e.g. of fracture risk) established in earlier studies using conventional resolution CT might be still applicable in UHR CT.
Ongoing work involves further evaluation of UHR CT on bone samples from additional body sites (including vertebrae). We are also investigating the reproducibility of UHR-based trabecular measurements and texture features across reconstruction algorithms, including model-based and deep learning-based methods. It is well recognized that texture features, including those of bone [9], might generally be sensitive to the imaging protocol. Therefore, development of robust diagnostic strategies based on image texture requires systematic assessment of the effects of imaging parameters on texture features, as well as multi-scale investigations of how those features emerge from the underlying microstructure.
Future efforts will involve pre-clinical and clinical studies to establish whether the improved quantification of bone microstructure provided by UHR CT is sufficient to substantially enhance diagnostic performance compared to current standards, such as volumetric bone mineral density measurements from CT or dual-energy CT. This will include application of UHR CT-based metrics of trabecular bone (including textural biomarkers) in prediction of bone strength and fracture risk. The impact of high-resolution image data on the accuracy of Finite Element Models of bone derived from those images will also be evaluated.
Overall, the emergence of UHR CT is a significant step towards the development of microstructural bone biomarkers for clinical practice. The improved spatial resolution of this device provides more accurate assessment of trabecular microarchitecture compared to conventional CT.
ACKNOWLEDGEMENTS
This work was supported by NIH Grant R01-EB-018896 and Canon Medical Systems.
REFERENCES
- [1].Yanagawa M et al. , “Subjective and objective comparisons of image quality between ultra-high-resolution CT and conventional area detector CT in phantoms and cadaveric human lungs,” Eur. Radiol 28(12), 5060–5068 (2018). [DOI] [PMC free article] [PubMed] [Google Scholar]
- [2].Kakinuma R, Moriyama N, Muramatsu Y, and Gomi S, “Ultra-High-Resolution Computed Tomography of the Lung : Image Quality of a Prototype Scanner,” PLoS One, 10(9), e0137165, doi: 10.1371/journal.pone.0137165 [DOI] [PMC free article] [PubMed] [Google Scholar]
- [3].Chen C et al. , “Quantitative Imaging of Peripheral Trabecular Bone Micro-architecture Using MDCT.,” Med Phys. 2018. January;45(1):236–249 [DOI] [PMC free article] [PubMed] [Google Scholar]
- [4].Burghardt AJ, Link TM, and Majumdar S, “High-resolution computed tomography for clinical imaging of bone microarchitecture,” Clin. Orthop. Relat. Res 469(8), 2179–2193 (2011) [DOI] [PMC free article] [PubMed] [Google Scholar]
- [5].Nagarajan MB et al. , “Characterizing trabecular bone structure for assessing vertebral fracture risk on volumetric quantitative computed tomography,” Proc SPIE Med. Imaging 9417, 94171E (2015). [DOI] [PMC free article] [PubMed] [Google Scholar]
- [6].Boyd SK, Müller R, and Zernicke RF, “Mechanical and architectural bone adaptation in early stage experimental osteoarthritis.,” J. Bone Miner. Res 17(4), 687–694 (2002). [DOI] [PubMed] [Google Scholar]
- [7].Link TM et al. , “Assessment of trabecular structure using high resolution CT images and texture analysis,” J. Comput. Assist. Tomogr 22(1), 15–24 (1998). [DOI] [PubMed] [Google Scholar]
- [8].Valentinitsch A et al. , “Computational identification and quantification of trabecular microarchitecture classes by 3-D texture analysis-based clustering,” Bone 54(1), 133–140 (2013). [DOI] [PubMed] [Google Scholar]
- [9].Li Q, Kamona N, Berman BP, Sahiner B, and Petrick NA, “Reproducibility of CT-based texture feature quantification of simulated and 3D-printed trabecular bone: influence of noise and reconstruction kernel,” SPIE Proc. 10950, Medical Imaging 2019: Computer-Aided Diagnosis; 109501S (2019), 10.1117/12.2512571 [DOI] [Google Scholar]