TECHNIQUES
While the potential of 7T MRI to elucidate novel insights into the pathology of disease has been demonstrated 1,2,3, the translation of existing 3T techniques to higher field strength requires certain considerations. In this section, we will introduce the primary tools used in clinical imaging at 3T today and discuss the underlying physics of the sequences, the primary considerations at 7T, and recent promising developments using each technique at 7T.
Gradient echo (GRE)
Gradient echo (GRE) sequences are a versatile class of sequences relying on a gradient echo generated by the frequency-encoding gradient, which allows transverse dephasing during readout, with contrast coming from the local field inhomogeneity as reflected in dephased protons. The versatility of the GRE sequences comes from its ability to be acquired in 2D or 3D and to utilize either single or multi-echo gradient refocusing, which allows acquisition of both T2*-weighted magnitude images, as well as images with magnetic susceptibility contrast, such as susceptibility weighted images (SWI), R2*mapping, and quantitative susceptibility mapping (QSM), enabling sensitivity to myelin and iron.
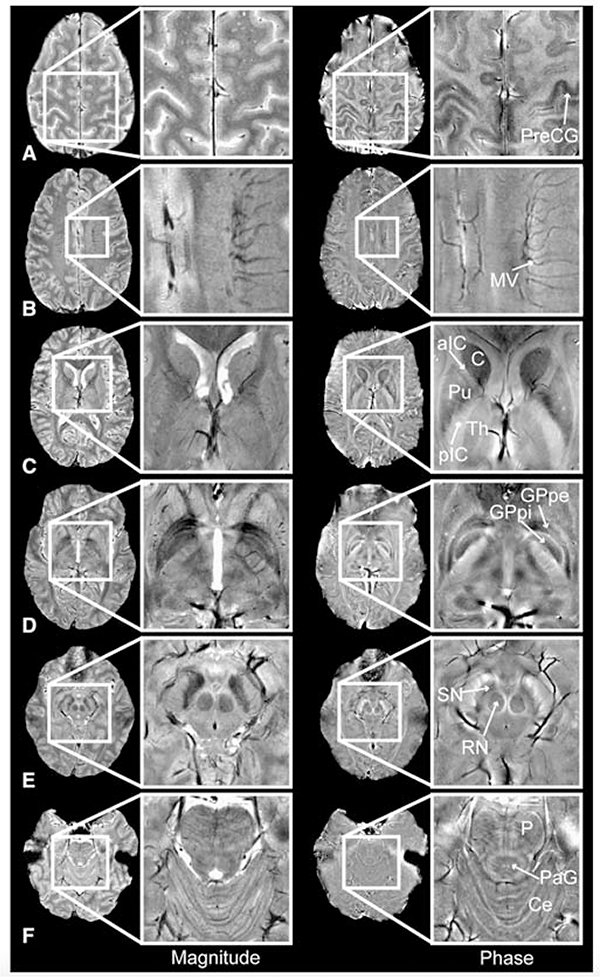
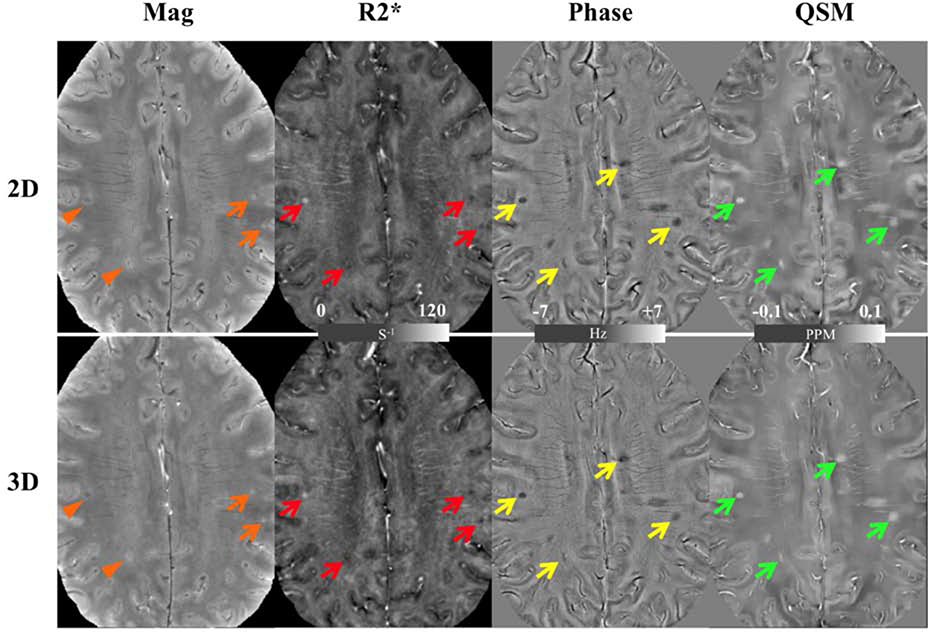
Performing GRE imaging at 7T has been shown to provide enhanced spatial resolution of deep grey structures 4,5,6 (Figure 1), enabling better segmentation and characterization of normal anatomy and pathology. High resolution GRE at 7T has generally been performed with 3D sequences to maintain high SNR by exciting an entire imaging volume for each readout, but recent work has developed a novel 2D simultaneous multislice sequence to serve as an alternative, with the added benefit of higher image contrast and sensitivity to lesions in multiple sclerosis (Figure 2).7
Figure 1: An example of magnitude and phase imaging contrast at 7T providing clear visualization of deep grey structures.
Magnitude (left) and phase (right) images of the pre-central gyrus (PreCG), medullary veins (MV), caudate (C), putamen (Pu), anterior and posterior limbs of the internal capsule (aIC/pIC), thalamus (Th), globus pallidus pars interna/pars externa (GPpi/GPpe), red nucleus (RN), substantia nigra (SN), pons (P), periaqueductal grey matter (PaG) and cerebellum (Ce). From Hammond KE, Lupo JM, Xu D, et al. Development of a robust method for generating 7T multichannel phase images of the brain with application to normal volunteers and patients with neurological diseases. Neuroimage. 2008 Feb 15; 39(4): 1682–1692; with permission.
Figure 2: Images from the 2D SMS gradient-echo (top row) and 3D gradient-echo imaging (bottom row) demonstrating improved lesion detection in the 2D magnitude images and comparable detection in R2*, phase, and QSM images a patient with multiple sclerosis.
Overall MS lesions (with typical example highlighted with arrows) are visualized almost equally on the R2* (red arrows), phase (yellow arrows) and QSM (green arrows) images. On the magnitude images, two lesions (orange arrows) have similar visibility while the other two (orange arrowhead) are better visualized on the 2D image. In addition, the 2D magnitude image shows a sharper edge between gray and white matter. From Bian W, Kerr AB, Tranvinh E, Parivash E, et al. MR susceptibility contrast imaging using a 2D simultaneous multi-slice gradient-echo sequence at 7T. PLoS One. 2019; 14(7); with permission.
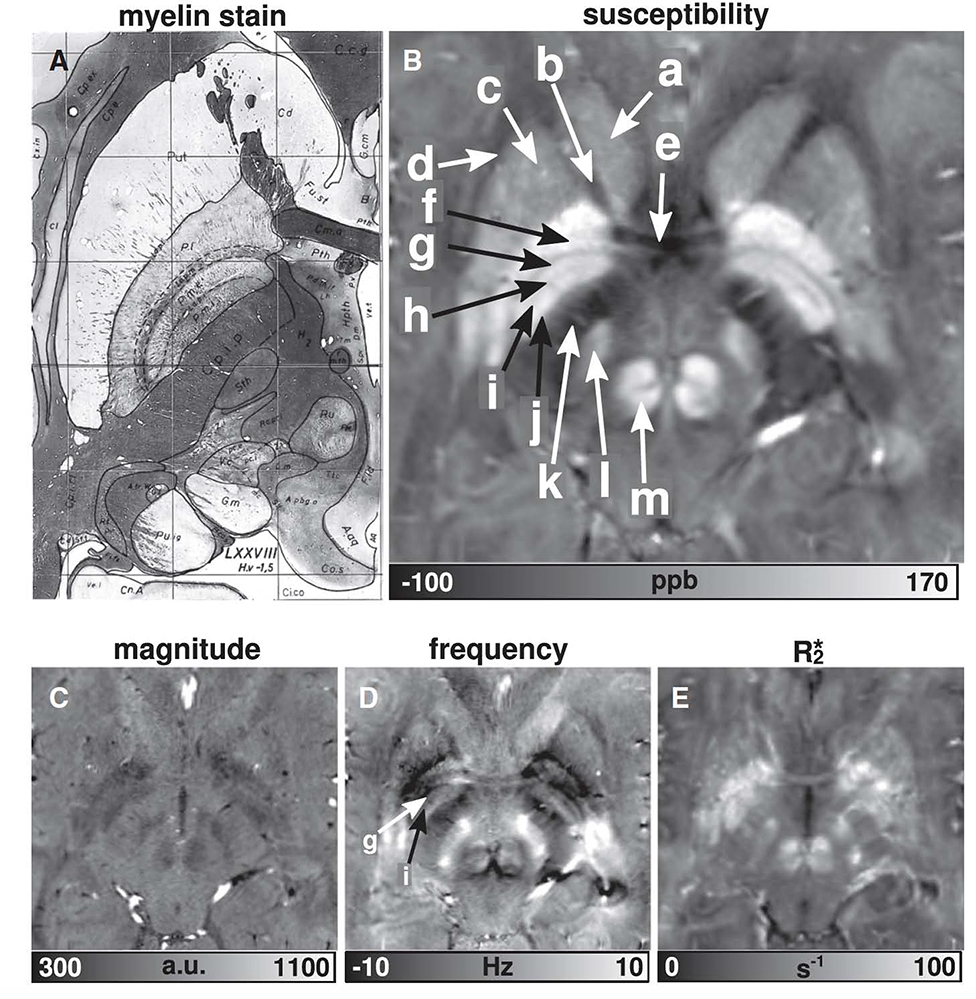
QSM uses the frequency shift in the MRI signal to map the magnetic field profile within the tissue to determine the spatial distribution of the underlying magnetic susceptibility by solving an inverse problem utilizing the known point spread function of a magnetic dipole 8,9 (Liu et al 2009; Liu et al 2011). Since susceptibility contrast scales with the magnetic field strength, it provides an opportunity to perform higher resolution susceptibility contrast imaging with higher sensitivity to myelin and iron (Figure 3).10 Likewise, recent work utilizing 7T has shown the potential to reduce scan time 11 and provide higher resolution imaging than at 3T 12, which may facilitate better delineation of deep grey matter structures for neurosurgical applications 10 and higher resolution angiography (Figure 4), 12 enhanced grading of brain tumors 13, and improved lesion characterization in multiple sclerosis (Figure 5).14
Figure 3: High resolution susceptibility imaging compared to myelin stain.
The susceptibility map clearly reveals: a — head of the caudate nucleus (Cd), b — anterior limb of internal capsule (Cp.i.a), c — putamen (Put), d — external capsule (Cp.e), e — anterior commissure (Cm.a), f — external globus pallidus (P.l), g — lamina pallidi medialis (La.p.m), h — pallidum mediale externum (P.m.e), i — lamina pallidi incompleta (La.p.i), j — pallidum mediale internum (P.m.i), k — posterior limb of internal capsule (Cp.i.p), l — subthalamic nucleus (Sth), and m — red nucleus (Ru). From Deistung A, Schäfer A, Schweser F, et al. Toward in vivo histology: a comparison of quantitative susceptibility mapping (QSM) with magnitude-, phase-, and R2*-imaging at ultra-high magnetic field strength. Neuroimage. 2013 Jan 15;65:299–314; with permission.
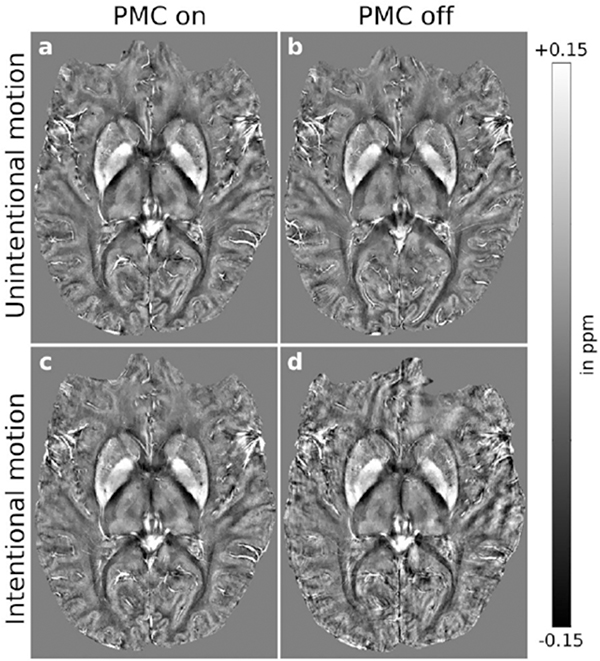
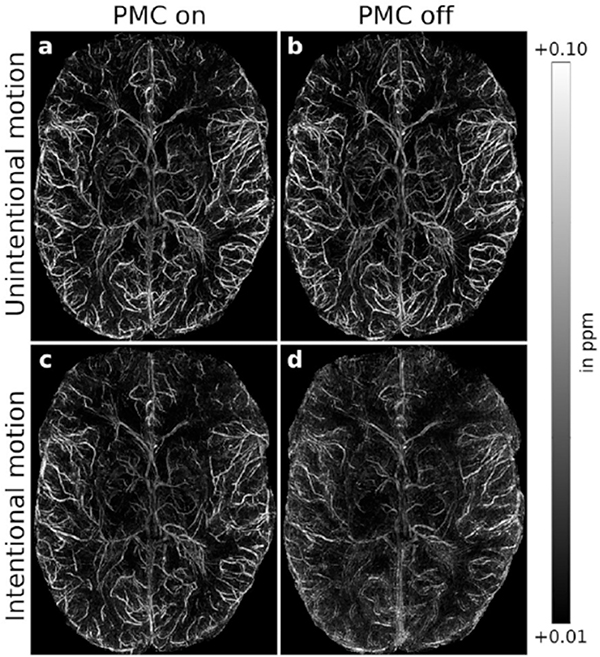
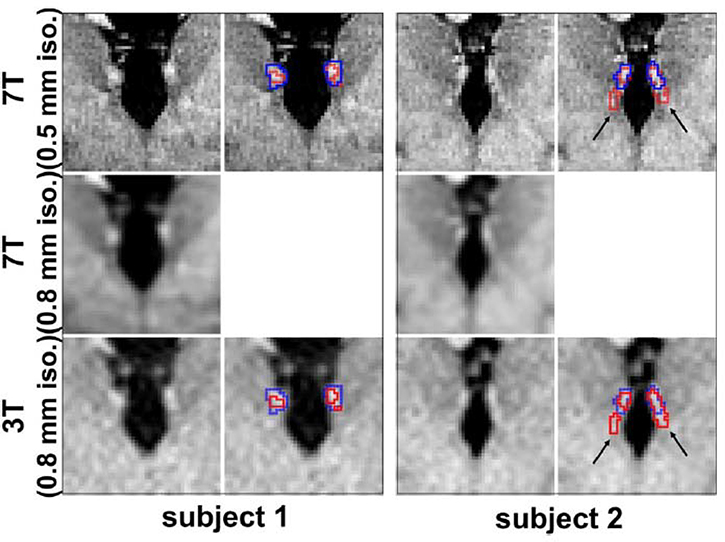
Figure 4: High-resolution QSM and QSM-based venograms at 7T.
(Left) Intra-subject comparison (subject 3) of (A and C) motion-corrected and (B and D) uncorrected QSM, (A and B) without and (C and D) with intentional motion. For small-scale motion, corrected and uncorrected QSM showed no apparent motion artifacts. For large-scale motion, uncorrected maps were degraded; this effect was reduced with motion correction leading to minor residual artifacts. (Right) Intra-subject comparison (subject 3) of (A and C) motion-corrected and (B and D) uncorrected QSM-based venograms, (A and B) without and (C and D) with intentional motion. For small-scale motion, corrected and uncorrected QSM showed no apparent motion artifacts. Without correction, large-scale motion degraded vessel depiction considerably; this effect was largely prevented by motion correction leading to minor residual artifacts. From Mattern H, Sciarra A, Lüsebrink F, et al. Prospective motion correction improves high-resolution quantitative susceptibility mapping at 7T. Magn Reson Med. 2019 Mar;81(3):1605–1619; with permission.
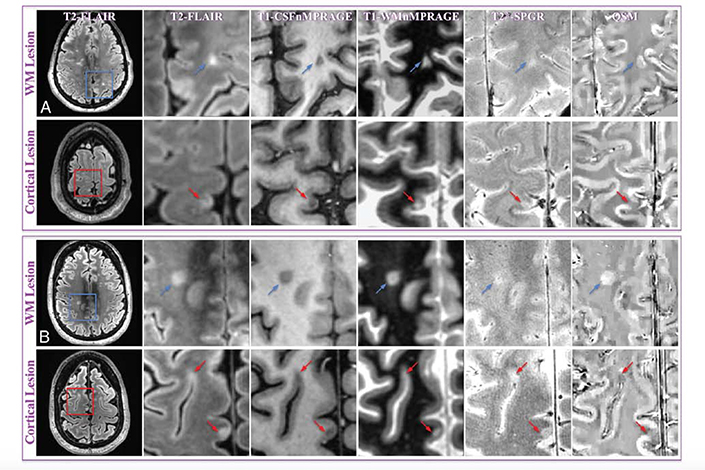
Figure 5: Example of WM and cortical MS lesions at 7T, with clear visualization using QSM.
MR images of representative WM and cortical lesions from patients 4 (A) and 5 (B). A whole section of the T2-MPFLAIR image is displayed on the left column with a zoomed-in region (blue/red square) for all image contrasts. Two WM lesions (blue arrows) and 3 cortical lesions (red arrows) are shown. WM and cortical lesions are hyper- and hypointense relative to their adjacent parenchyma on QSM images, respectively, while both types of lesions show an identical contrast on all other images. CSFnMPRAGE indicates CSF-nulled T1-weighted MPRAGE; WMnMPRAGE, WM-nulled MPRAGE. From Bian W, Tranvinh E, Tourdias T, et al. In Vivo 7T MR quantitative susceptibility mapping reveals opposite susceptibility contrast between cortical and white matter lesions in multiple sclerosis. Am J Neuroradiol. 2016;37(10):1808–1815; with permission.
Fast spin echo (FSE)
Fast spin echo imaging (FSE), or turbo spin echo (TSE), utilizes several refocusing RF pulses delivered during each TR interval with a phase-encoding gradient briefly switched on between echoes to allow fast scan times. With high signal-to-noise ratio and good contrast, it is a workhorse in clinical imaging at all field strengths. However, FSE is susceptible to B1-inhomogeneities, which are amplified at 7T due to the shortened wavelength of RF pulses at 7T and can result in signal loss (Figure 6). 15 Additionally, FSE is limited by RF power deposition, which becomes significantly exacerbated at 7T. However, given the short scan times and the potential to enable high-resolution T2 mapping 16 to discern fine anatomical detail in diseases such as hippocampal subfields in Alzheimer’s disease 7 (Figure 7), facilitate high-resolution tissue segmentation 17 and provide strong gray-white contrast 18, developing strategies to address these issues of FSE at 7T is critical. Adiabatic FSE sequences have been developed and have been shown to provide improved image quality compared to traditional FSE in the brain and neck. 19
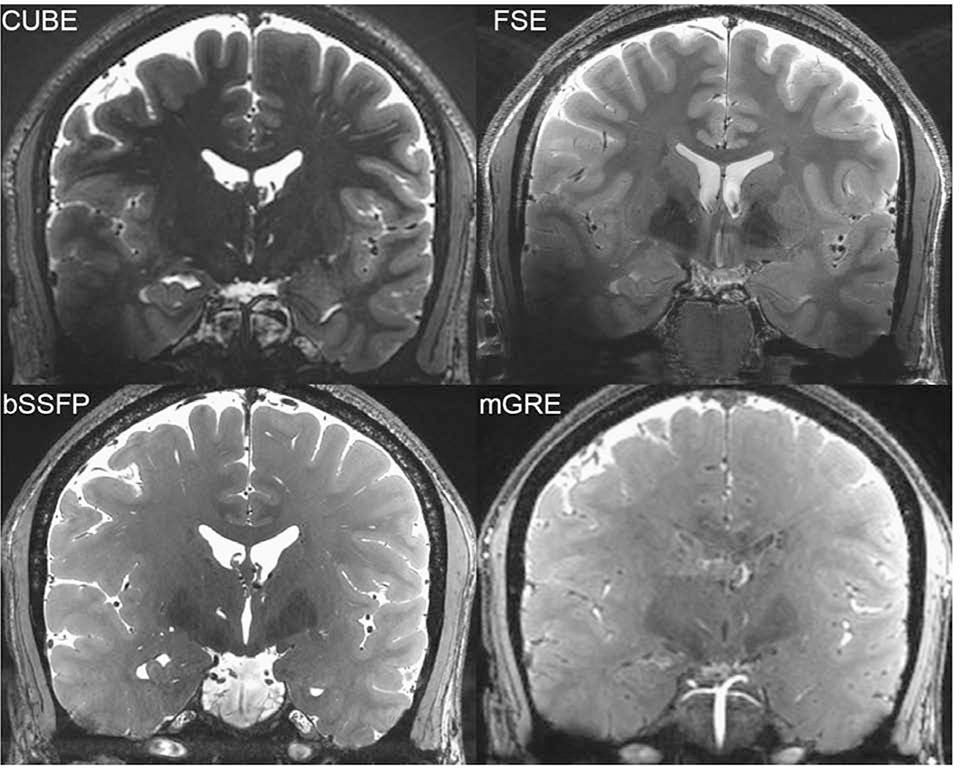
Figure 6: Relative homogeneity of bSSFP compared to FSE and CUBE.
From Zeineh M, Parekh M, Zaharchuk G, et al. Ultrahigh-resolution imaging of the human brain with phase-cycled balanced steady-state free precession at 7 T. Invest Radiol. 2014;49(5):278–289; with permission.
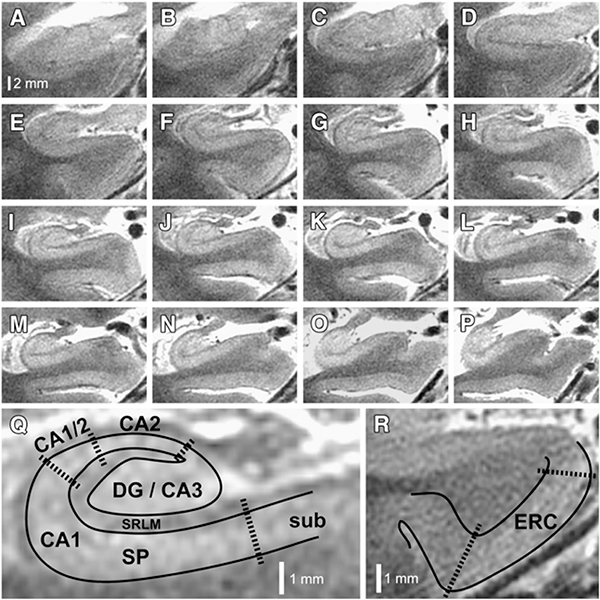
Figure 7: Substructures of hippocampus and atrophy specific to AD.
7 T hippocampal microstructural imaging. (A–P) Serial oblique coronal slices, zoomed to the right hippocampus, are illustrated for one of the patients enrolled in this study. Slices are arranged anterior to posterior, using the same scale represented by the bar in panel (A). (Q) Higher magnification view of panel (I), illustrating how subfields are demarcated. Areas containing dense collections of neuronal cell bodies (e.g., CA1-SP) appear bright on this T2-weighted image, whereas neuropil areas (e.g., CA1-SRLM), which contain dense axons, dendrites, myelin, and synapses, appear relatively hypointense. DG, dentate gyrus; CA1–3, cornu ammonis subfields 1–3; SP, stratum pyramidale; SRLM, stratum radiatum/stratum lacunosum-moleculare; sub, subiculum. (R) Higher magnification of the parahippocampal gyrus from panel (E), illustrating how the entorhinal cortex (ERC) is demarcated. From Bian W, Kerr AB, Tranvinh E, et al. MR susceptibility contrast imaging using a 2D simultaneous multi-slice gradient-echo sequence at 7T. PLoS One. 2019; 14(7); with permission.
T1-weighted volumetric imaging
Magnetization prepared rapid gradient echo (MPRAGE) sequence, which relies on a non-selective inversion pulse followed by rapidly acquired gradient echoes, allows lower SAR than traditional FSE sequences. In clinical imaging, MPRAGE and variants are used for anatomic imaging given its high gray-white contrast; in research or quantitative clinical studies, they are the standard for performing brain segmentation. Subsequent work has developed accelerated versions 20 to enable more rapid clinical scanning as well as modified versions. MPRAGE shows extensive susceptibility artifact related to inhomogeneous B0, so a variant called MP2RAGE was developed, where two images with different inversion times are combined to suppress dependencies of the receive field (Figure 8).21 MP2RAGE has been used for T1 structural imaging and morphometry 22,23 as well as whole-brain segmentation.24 Additionally, MPRAGE imaging at 7T has shown the ability to delineate intracranial vasculature. 25
Figure 8: 3T MPRAGE, 7T MPRAGE, and 7T MP2RAGE acquired on a single subject. 7T MPRAGE exhibits a strong bias field, giving low signal intensities in temporal and basal regions. 7T MP2RAGE sequence accounts for this bias field and delivers good contrast properties between gray and white matter more homogeneously throughout the brain, though still with some regions of inhomogeneity inferiorly.
From Seiger R, Hahn A, Hummer A, et al. Voxel-based morphometry at ultra-high fields: A comparison of 7T and 3T MRI data. Neuroimage. 2015 Jun; 113: 207–216; with permission.
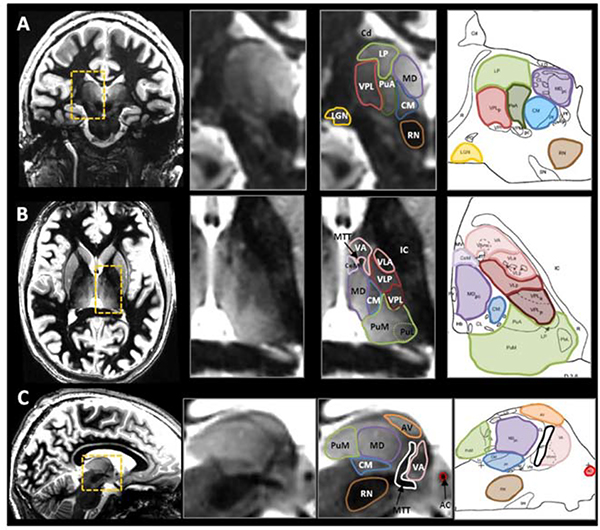
The white matter nulled MPRAGE (WMnMPRAGE) generates additional contrast by suppressing signal from white matter, with inversion times chosen such that fluid is bright, and gray-white contrast is even better than with MPRAGE. This is optimized specifically to visualize the thalamus and intra-thalamic nuclei (Figure 9). 26 Specifically, it relies on an inversion time close to the white matter null regime, a lengthened time between successive inversion pulses and a low flip angle to increase thalamic signal and contrast. 26 This sequence has been used for automatic thalamic nuclei segmentation to highlight thalamic lesions and improve measurements of thalamic atrophy in patients with multiple sclerosis. 27
Figure 9: Representative examples of white-matter nulled (WMnMPRAGE) scans in coronal, axial, and sagittal places (each orientation shown in a different volunteer) and presented with the corresponding histological plates (Morel et al., 1997).
Several nuclei can be identified with the enhanced intrinsic contrast between adjacent structures, particularly with the hypointense bands that isolate structures that are close in signal intensity. For example, see the thin boundaries around the pulvinar anterior (PuA, green) in coronal (A), around the ventral anterior nucleus (VA, pink) in axial (B), and around the anterior ventral nucleus (AV, orange) in sagittal (C). From Tourdias T, Saranathan M, Levesque IR, et al. Visualization of intra-thalamic nuclei with optimized white-matter-nulled MPRAGE at 7T. Neuroimage. 2014;84:534–545; with permission.
Balanced Steady-State Free Precession (bSSFP)
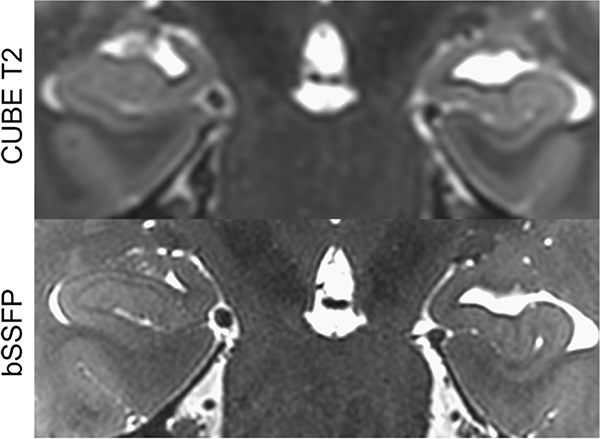
Balanced steady-state free precession (bSSFP) is a variant of GRE in which a steady, residual transverse magnetization is maintained between successive cycles. Gradients are balanced in all axes such that gradient-induced dephasing within TR is exactly zero, offering a very high SNR and relative insensitivity to motion. At 7T, bSSFP has demonstrated SNR benefits compared to GRE per unit imaging time.28 While bSSFP suffers from bands of signal hypointensity due to B0 inhomogeneity, these can be remedied by phase cycling.29,30,31 Additionally, bSSFP can be performed with low flip angles to avoid the limitations on SAR that can often be prohibitive at 7T. bSSFP has a relatively homogeneous signal profile (Figure 6). These features of bSSFP make it a compelling sequence to utilize at 7T and prior work has shown the potential of bSSFP to provide superior anatomical visualization of the hippocampus (Figure 10), cerebellum, and skull base, as well as strong iron contrast.18,32
Figure 10: Improved imaging of the hippocampus using bSSFP compared to CUBE T2.
Hippocampal heads in a healthy volunteer in time-matched Cube T2 (top) and bSSFP (bottom). The left-right asymmetry is caused by a slight head rotation. From Zeineh M, Parekh M, Zaharchuk G, et al. Ultrahigh-resolution imaging of the human brain with phase-cycled balanced steady-state free precession at 7 T. Invest Radiol. 2014;49(5):278–289; with permission.
Motion Correction
Despite the promising results of each of these above techniques, achieving both high SNR and high resolution at 7T requires long scan times, which often result in image artifacts due to subject motion. These motion artifacts limit the clinical interpretability of images and the reliability of quantitative analyses.
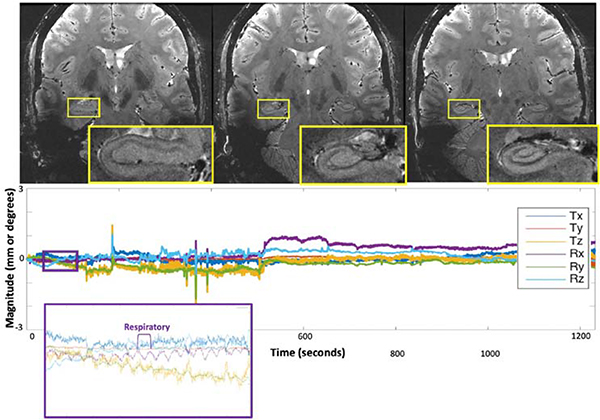
Retrospective methods for motion correction are available 33,34,35, but require longer post-processing time and may be insufficient, due to overlaps and gaps in k-space. 36 Prospective motion correction can overcome this limitation by using measured head position and orientation to update the imaging volume position and orientation within the bore in real-time. The necessary real-time head pose information can be obtained using several techniques, including active markers 37 field probes 38,39 (Haeberlin et al 2014; Vannesjo et al 2015), sequence-navigator-based methods 40, or optical tracking using a camera system. 41,42 Early optical camera systems relied on multiple cameras external to the bore of the MRI scanner 43,44, making line-of-sight for long or narrow-bore magnets, enclosed head coils, or large subjects a challenge. The development of MR-compatible cameras has made it possible to use cameras within the B0 field of the scanner, for example, attached to the inner surface of the bore or to a rig placed around the receive-only head coil.42 Prior work at 3T used a single camera mounted directly on the receive-only head coil, such that an unimpeded view of an optical marker to the subject’s head can be achieved between the rungs of the coil. 45,46 However, since most commercial head coils at 7T are enclosed within an RF transmit shell, reliable line-of-sight to a head-mounted marker is not possible, leading to the use of mouthpiece-mounted markers which extend beyond the head coil.47,48 These systems have achieved higher resolution structural imaging in volunteers than would otherwise be achievable (Figure 11) 47 and can provide improved quantitative susceptibility maps.48 More recent work has used an optical tracking system for 7T using a custom-built, within-coil camera to track a marker mounted on a subject’s forehead, demonstrated the ability to perform ultra-high-resolution imaging of the hippocampus (Figure 12) and may improve accessibility of motion correction during 7T exams and enable more robust use of all of the above techniques.49
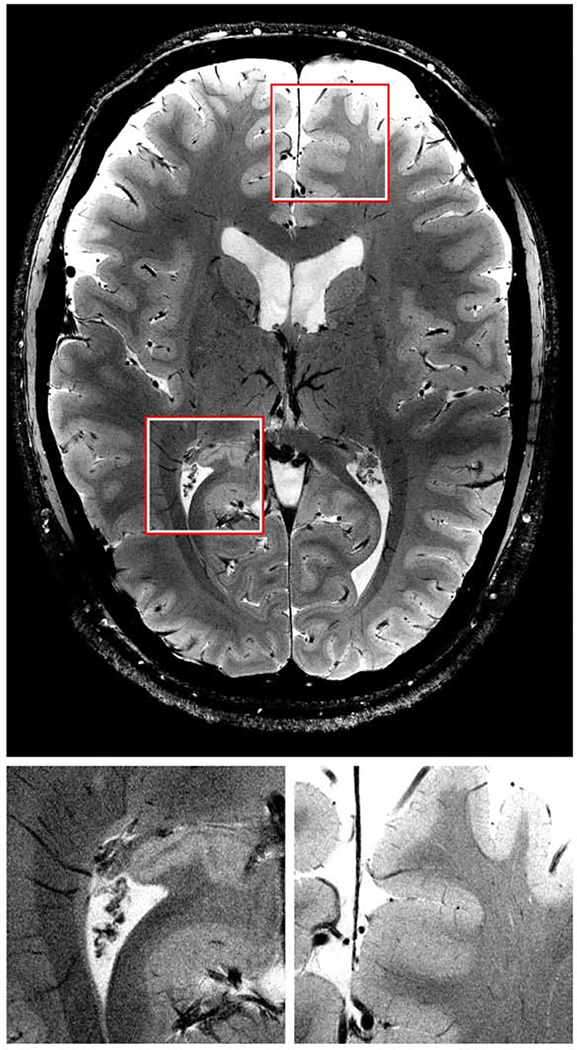
Figure 11: Single slice high resolution GRE scan enabled by motion correction.
At a resolution of 0.12 × 0.12 × 0.6 mm structures of one to two pixel in width are identifiable and clearly defined. Magnifications of the marked regions are shown below. From Stucht D, Danishad KA, Schulze P, et al. Highest Resolution In Vivo Human Brain MRI Using Prospective Motion Correction. PLoS One. 2015;10(7); with permission.
Figure 12: High resolution imaging of hippocampus enabled by prospective motion correction.
Results of the 20-min ultrahigh-resolution 2D GRE sequence, demonstrating exquisite quality imaging of the hippocampus and the remainder of the visualized brain. The plots below each image display the translational and rotational motion across time, with the vertical axis showing mm and degrees of displacement or rotation, respectively, and the horizontal showing time in seconds. Each direction of motion was normalized to the subject’s initial position for this scan to visualize only net motion during the acquisition. The purple and orange insets show detection of physiologic respiratory motion, respectively, in addition to rigid-head motion. From DiGiacomo P, Maclaren J, Aksoy M, et al. A within-coil optical prospective motion-correction system for brain imaging at 7T. Magn Reson Med. 2020 Sep;84(3):1661–1671; with permission.
ANATOMIC APPLICATIONS OF THE ABOVE METHODS
LIMBIC SYSTEM
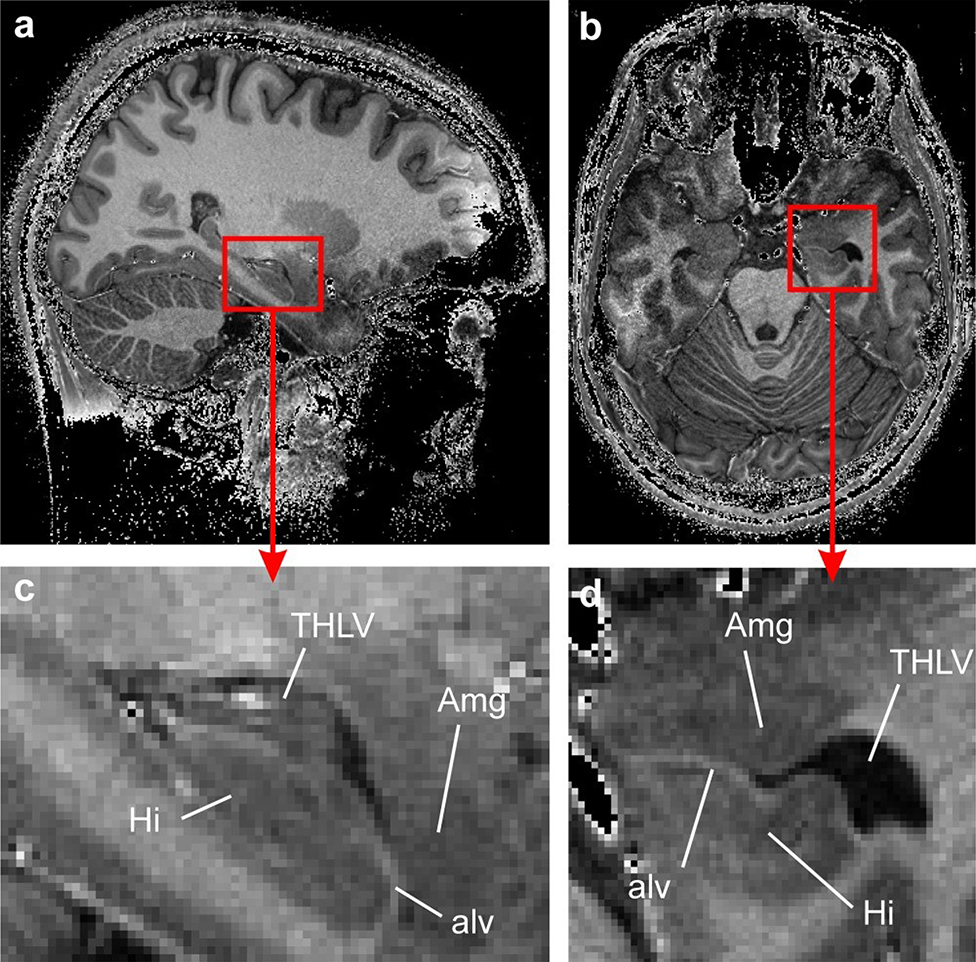
The limbic system is fundamental to our emotion, memory, and cognitive function.50,51,52 It is comprised of multiple structures, including the hippocampus, amygdala, parahippocampal gyrus, mammillary bodies, anterior thalamic nuclei, and the cingulate gyrus.50 As one of the most intricate circuits in the brain, neuroimaging plays an essential role in understanding the anatomic and functional role of this system in particular. The superior signal to noise ratio (SNR) of high resolution structural 7T can give us a greater detail into the architecture of the structures of this system for clinical application (Figure 13).51
Figure 13: Highlighting the increased anatomic detail of the anteromedial temporal lobe on 7T MPRAGE (divided by a short-TE GRE for better signal homogeneity) compared to 3T.
The amygdala (Amg) and the hippocampus (Hi) in the mediotemporal lobe of S1. (a) T1-weighted in vivo MRI in the sagittal plane. The amygdalo-hippocampal area, marked by a red square, is magnified in (c). The corresponding axial view is displayed in (b) and the magnified AHB area is shown in (d). The border between the amygdala and the hippocampus formed by the temporal horn of the lateral ventricle (THLV) and the alveus (alv) can be clearly seen. From Derix J, Yang S, Lüsebrink F, et al. Visualization of the amygdalo–hippocampal border and its structural variability by 7T and 3T magnetic resonance imaging. Human Brain Mapping. 2014 March 12; 35(9): p. 4316–4329; with permission.
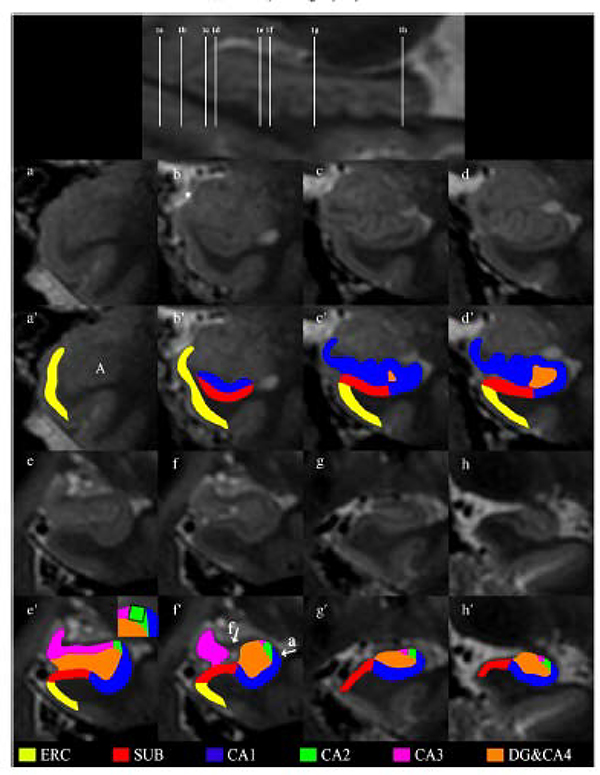
The hippocampus and amygdala have been the most exhaustively explored for 7T evaluation within the limbic system, giving us exquisite detail on these small structures.51,52 These structures are crucial to memory encoding/retrieval and emotion, respectively, and pathology in these regions can have significant clinical implications. The basic hippocampal subfields are the dentate gyrus (DG), Cornu Ammonis 1–4 (CA1–4), subiculum (SUB), and entorhinal and perirhinal cortices, as well as the key white matter pathways including the fornix (starting at alveus, then to fimbria, and finally to fornix) and parahippocampal gyrus (PHG) (Figure 14).52 Given that these structures are small and tightly interpositioned, 7T better delineates these structures with the improved resolution compared to 3T. This could be particularly helpful in the hippocampal head, which is extensively folded 53,54. One reason is the improved SNR allows for higher resolution imaging. Additionally, the increased susceptibility corresponding to the deoxyhemoglobin within the veins creates shorter T2* weighting of the surrounding tissues, which in turn, increases contrast resolution.52 This also allows visualization of submillimeter venous structures, which would not be detectable on 3T. 52
Figure 14: Highlighted subfields of the hippocampal formation at 7T 3D T2W FSE.
The upper figure shows a sagittal view with references to all the coronal images. Coronal images of the hippocampal formation are shown in 1a–1h in an anterior-to-posterior direction from 1a to 1h. The head is displayed in Figs. 1b–f, the body in Fig. 1g and the tail in Fig. 1h. The asterisk in 1b indicates the sulcus semiannularis. The segmentation of the hippocampal formation is shown in 1a’–1h’. The zoom-in in picture 1e’ shows the construction of the border between CA2 and CA3 by drawing a virtual square. The arrows in 1f’ point to the alveus and fimbria which were excluded from segmentation. These hypointense structures are also visible on 1e’, 1g’ and 1h’. From Wisse L E M, Gerritsen L, Zwanenburg JJM, et al. Subfields of the hippocampal formation at 7T MRI: In vivo volumetric assessment. Neuroimage. 2012;61(4):1043–1049; with permission.
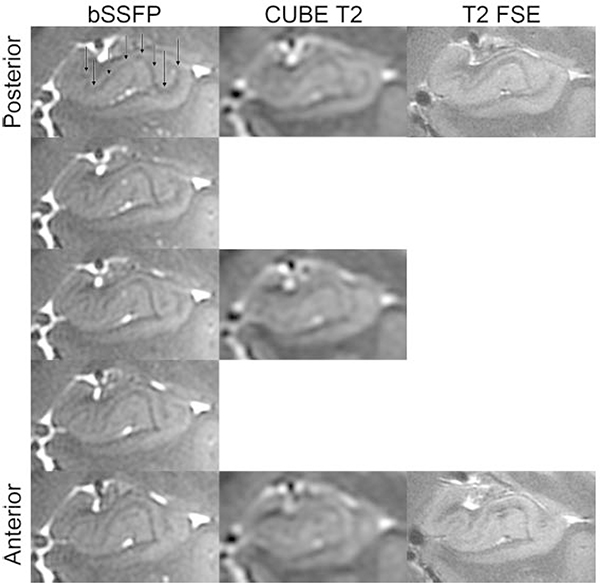
Although the basic hippocampal units can be seen on 3T, 7T gives us a greater understanding of the subfield anatomy. Zeineh et al elucidated the hippocampal subfield architecture on balanced steady state free precession (bSSFP), where they further at ultra-high resolution the appearance of the striatum radiatum and lacunosum moleculare (SRLM) which corresponding to the hypointense T2 band seen within CA1 (Figure 15).18 Parekh et al used a similar approach by segmenting the white matter pathways involving the hippocampus, with special attention to the hilus and the previously invisible endfolial pathway, which was validated histologically and expanded upon through ex vivo polarized light microscopy.54,32 Wisse et al55,56 delineated the hippocampal subfield architecture through automated segmentation of CA1, DG, and SUB in order to achieve an easy, applicable protocol.56
Figure 15: Comparison of the left hippocampal head on bSSFP with the SLRM highlighted (black arrows). CUBE T2 and T2 FSE images also displayed in native space without interpolation.
From Zeineh M, Parekh M, Zaharchuk G, et al. Ultrahigh-resolution imaging of the human brain with phase-cycled balanced steady-state free precession at 7 T. Invest Radiol. 2014;49(5):278–289; with permission.
In addition to the hippocampus, the amygdala has also been explored on high resolution 7T acquisition. The amygdala contains many nuclei which are connected to the prefrontal cortex, insula, thalami in addition to other parts of the limbic system, where it plays a major role in emotional processing particularly with fear and anxiety.57 On 3T, some of these nuclei, such as the medial (Me), lateral (La), and basolateral ventral medial (BLVM) can be faintly separated, though not nearly as good as pathology.58 Yet, as with other structures, 7T provides superior anatomic detail (Figure 13).57
Given the close anatomic relationship between the hippocampus and amygdala and their synergistic function with emotion and memory, the amygdalo-hippocampal border (AHB) has also become an area of interest. Derix et al explored the AHB on 7T where they found better delineation and improved contrast of the shape and extent of the alveus, which comprises the majority of the AHB, on T1 weighted (T1W) image, when compared to 3T.51
Alzheimer’s Disease
Alzheimer’s Disease (AD) is the most common type of neurodegenerative disease and is thought to be caused by accumulation of cortical amyloid plaque and neurofibrillary tangle deposition leading to progressive and unrelenting dementia.1,59 High resolution 7T in the limbic system, when compared to 3T, has made several advancements in our understanding of neurodegenerative diseases and potentially improve timely diagnosis and management.1 3T evaluation has been exhaustively explored, giving us some insights on neuroanatomical abnormalities in AD, particularly within the hippocampus. These 3T studies have shown a characteristic atrophy pattern in AD with thinning of the entorhinal cortex (EC).60 With the increased SNR at 7T, the extent and detail of this EC thinning has been further investigated. In multiple studies, Kerchner et. al. reported atrophy in CA1 – which includes the SRLM – as well as the EC in AD patients, while also showing correlation with delayed recall performance (Figure 7). Subsequently, they found that the CA1-SRLM atrophy was disproportionately seen in patients with the APOE-e4 allele. 61,1,62,63
Other groups have also corroborated the EC’s role within AD on high resolution 7T evaluation. Tangle deposition occurs early within the entorhinal cortex (EC), which is a part of the anterior PHG and affected in early preclinical stages of AD.64 Wisse et al also used 7T to evaluate AD in early stages where they found volume loss in multiple subfields including CA1, SUB, CA4,and DG in 17 patients.65 Similarly, Boutet et al assessed differences in hippocampal subfield volume on 7T, demonstrating reduction in CA1–3 and SUB in 11 patients.66
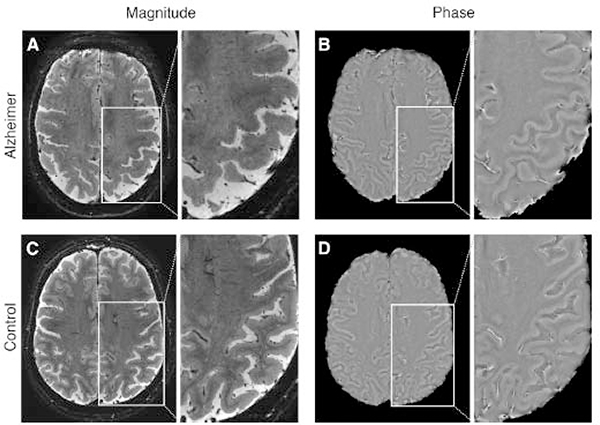
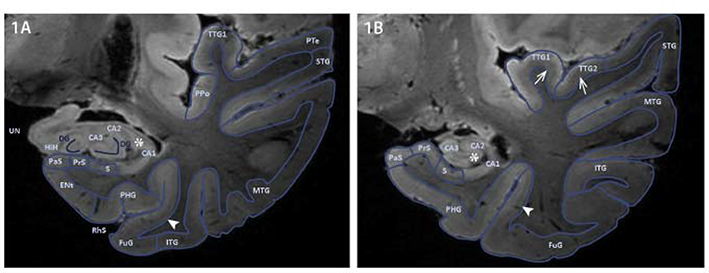
In addition to morphometric analyses of the hippocampal subfields, high resolution 7T has allowed further exploration of AD, and neurodegenerative diseases in general, on other conventional sequences. T2* imaging on 7T was also used by van Rooden et al in a 16 patients cohort, where they found increased phase shift within the frontal, temporal and parietal cortices corresponding to regions of amyloid plaque deposition (Figure 16).67 High resolution 7T has also elucidated other potential radiological-pathological correlations. Zeineh et al identified T2* hypointensities within the subiculum in AD patients on high resolution ex vivo 7T evaluation, showing the role of microglia-mediated iron deposition as opposed to tau or amyloid deposition.68 Other ex vivo explorations that may be translated to human imaging include Kenkhuis et al also utilized T2* on 7T where they demonstrated cortical lamination disruption in AD, especially in advanced stages, within the temporal and fusiform gyri in addition to overall severe atrophy (Figure 17).69
Figure 16: Axial 2D GRE images show a patient with AD (A, B) and a one normal control patient (C, D). A and C represent magnitude images. B and D represent phase images. The phase images show the enhanced contrast between gray and white matter in the AD patient when compared to the control subject, as indicated by the larger cortical phase shift.
From van Rooden S, Versluis MJ, Liem MJ, et al. Cortical phase changes in Alzheimer’s disease at 7T MRI: a novel imaging marker. Alzheimers Dement. 2014 Jan;10(1):e19–26; with permission.
Figure 17: Contours of the anterior and mid hippocampus on coronal plane on 7T T1W ex vivo imaging.
Control brain segmented for the areas of interest in two coronal planes displaying the hippocampus anterior and mid; MTL subregions were segmented based on contours of the sulci and gyri and signal intensity of cortical lamination on MRI. Contrast appears similar to T2-weighted images because of formalin fixation. Hyperintense band of CA3, CA2 and CA1 (Asterix, 1AB). Thin band of Baillarger (Arrowhead, 1AB). Broad band of Baillarger (Open arrows, 1B). Abbreviations: Anterior Transverse Temporal Gyrus (TTG1), Cornu Ammonis 1/2/3 (CA1/2/3) (Substructures of the Hippocampus), Dentate Gyrus (DG), Entorhinal cortex (Ent), Fascia Dentata (FD), Fusiform Gyrus (FuG), Hippocampal Head (HiH), Inferior Temporal Gyrus (ITG), Middle Temporal Gyrus (MTG), Parahippocampal Gyrus (PHG), Parasubiculum (PaS), Planum Polare (PPo), Planum Temporale (Pte), Posterior Transverse Temporal Gyrus, (TTG2), Presubiculum (PrS), Rhinal Sulcus (RhS), Subiculum (S), Superior Temporal Gyrus (STG) and Uncus (UN). From Kenkhuis B, Jonkman LE, Bulk M, et al. 7T MRI allows detection of disturbed cortical lamination of the medial temporal lobe in patients with Alzheimer’s disease. Neuroimage Clin. 2019;21:101665; with permission.
Epilepsy
7T evaluation has also aided in our understanding of other pathologies that affect the hippocampus, namely entities causing epilepsy. Approximately 60% of patients with epilepsy are symptomatic due to a localized lesion,70 with hippocampal sclerosis (HS)71 and focal cortical dysplasia70 being some of the more common entities. 3T evaluation is most widely used for identifying a localized epileptogenic focus, but some studies showing a rather low detection rate of 26%.72 This can have far reaching consequences for such patients as they are less likely to undergo surgery and in the event they do, due to the incompletely localization, this epileptogenic focus is missed or incompletely resected.73 7T on the other hand, with its exquisite anatomic details, has been shown in several studies to improve detection and overall understanding of epileptogenic foci.2 In doing so, 7T could aid not only in lesion detection but also presurgical planning as well.74
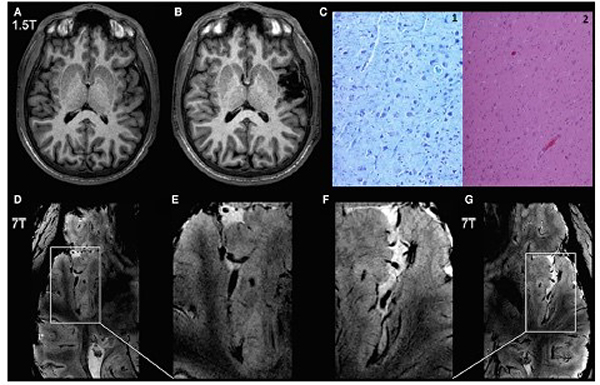
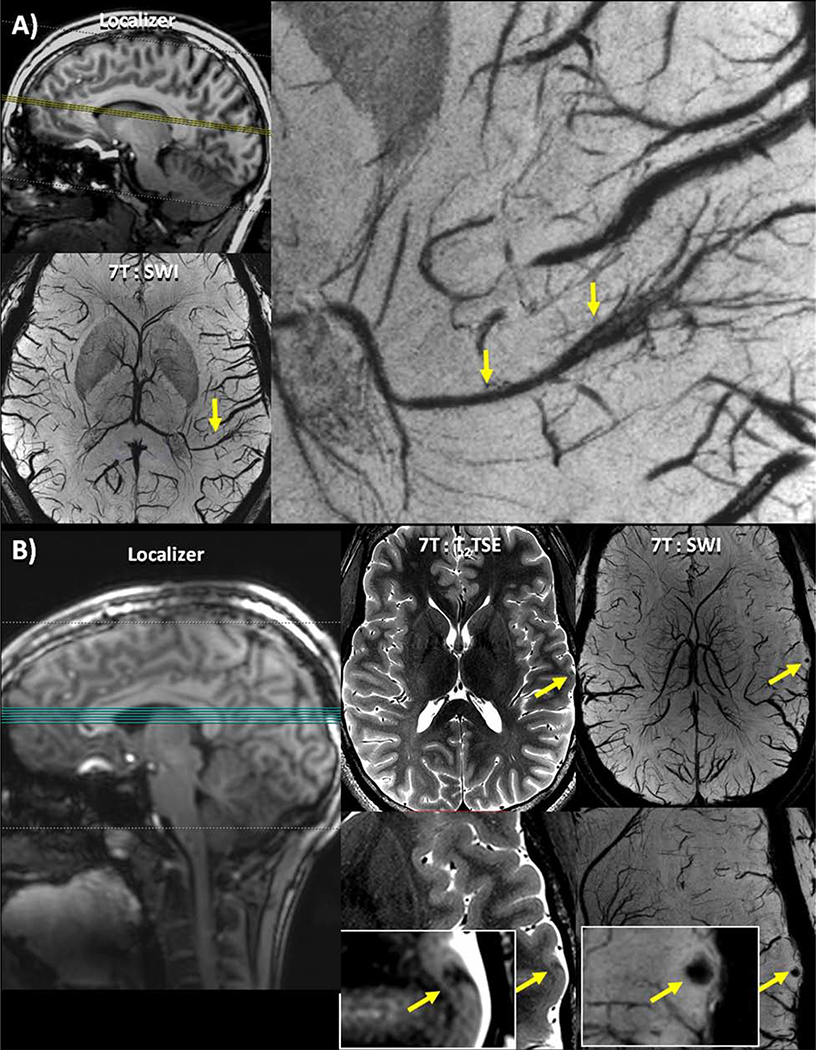
Increases in field strength have shown improved localized lesion detection in epilepsy. At clinical strengths, 3T is superior to 1.5T at both detecting new lesions as well as improving visualization of known lesions.75 Many studies to date have focused on improved detection of lesions on 7T with previously normal exams on clinical strengths. For instance, in patients with a normal conventional 3T or 1.5T MRI, in a twenty one patient cohort, De Ciantis et al reported that 7T GRE and FLAIR sequences detected localized structural abnormalities in 29% of these patients, all of which were deemed unremarkable at 3T. Four of these six patients were found to have pathology proven FCD upon resection (Figure 18). Examples of such lesions include hippocampal abnormalities, polymicrogyria, and cortical irregularities.76 Other studies have also shown similar results in the superiority of 7T in lesional detection compared to 3T.77,78 A number of studies have also shown superior detail or increased diagnostic confidence of known localized epileptogenic lesions on 7T when compared to 3T. Feldman et al demonstrated superior visualization of asymmetric perivascular spaces (PVS) in patients with focal epilepsy.79 A previous study also reported increased diagnostic confidence of multiple pathologies, including epileptogenic foci, with interrater agreement of 93.3% on 7T compared to 69.7% on 3T (Figure 19).80
Figure 18: 1.5 and 7T evaluation for a patient with intractable epilepsy. 1.5T preoperative 3D SPGR (A); 1.5T postoperative 3D SPGR (B;) histopathology (C); 7T 2D GRE, right hemisphere (D); magnification of panel D (E); 7T axial 3D GRE (F); Magnification of panel F (G).
A, D, and E reveal no structural abnormalities. B is a postoperative MRI showing the extent of resection. C is histologic section (C1: Kluver 200×; C2: Hematoxylin and eosin 100×) demonstrating cortical laminar disruption and dysmorphic neurons, consistent with FCD IIa. Of note, D, and its magnified image E show normal distinction between white and gray matter in the right superior temporal gyrus and the insula. Conversely, G, and its magnified image F show blurring of the gray–white matter junction in the anterior part of the left superior temporal gyrus and in the insular gyri. From De Ciantis A, Barba C, Tassi L, et al. 7T MRI in focal epilepsy with unrevealing conventional field strength imaging. Epilepsia. 2016 Mar;57(3):445–54; with permission.
Figure 19: Lesions identified on SWI. (A) Patient 17 –clockwise from top left: Localizer image showing the location of the axial slices; an enlarged view of a DVA associated with the suspected seizure onset zone identified on the SWI; full axial slice of 7T SWI minimum intensity projection showing a DVA.(B) Patient 10 –left to right: Localizer image showing the location of the axial slices; T2 TSE slice (full slice above, enlarged image below) showing a cortical thickness defect indicated by a yellow arrow, initially identified on SWI; SWI slice (full slice above, enlarged image below) showing a punctate focus of susceptibility indicated by a yellow arrow co-localized with a cortical thickness defect.
From Feldman RE, Delman BN, Pawha PS, et al. 7T MRI in epilepsy patients with previously normal clinical MRI exams compared against healthy controls. PLoS One. 2019;14(3); with permission.
Hippocampal sclerosis (HS) is one such example of a detectable epileptogenic focus. Initially, Breyer et al demonstrated the utility of 7T in detecting HS, which was confirm in their pilot study with six patients.71,74 Additional studies have further elucidated the role of the hippocampal architecture in epilepsy. For example, Stefanits et al showed the clinical feasibility of 7T in detecting HS, where they found a sensitivity and specificity of 100%.81 Gillman et al expanded on this histological correlation by demonstrating that HS subtypes can be distinguished on 7T evaluation in their ex vivo analysis.82 Voets et al then extended this morphometric evaluation in re-examining clinically normal MRIs, which were initially scanned on either 1.5 or 3T. Upon re-examination on 7T with MR spectroscopy (MRS), they found hippocampal subfield atrophy, mostly affecting CA3, in 75% of the cases. They also found that SUB atrophy correlated with verbal memory dysfunction. Lastly, they also reported decreased glutamine levels in the majority of these patients, which was also implicated in decreased verbal memory performance as well.83
MIDBRAIN
Anatomy
The midbrain is affected in a number of disease entities such as neuropsychiatric and neurodegenerative motor diseases. The intricate anatomy of the midbrain has been crucial in our understanding of these pathologies, particularly with respect to the dopaminergic system – mainly comprised of the substantia nigra (SN) and the ventral tegmental area (VTA).84 This system has been specifically implicated in reward, motivation, and attention, amongst other functions.84 However, most of the current work has been performed on clinical magnet strengths (either 1.5 or 3T), which has provided some anatomic detail, but the greater resolution on 7T has expanded our knowledge of the anatomy.84
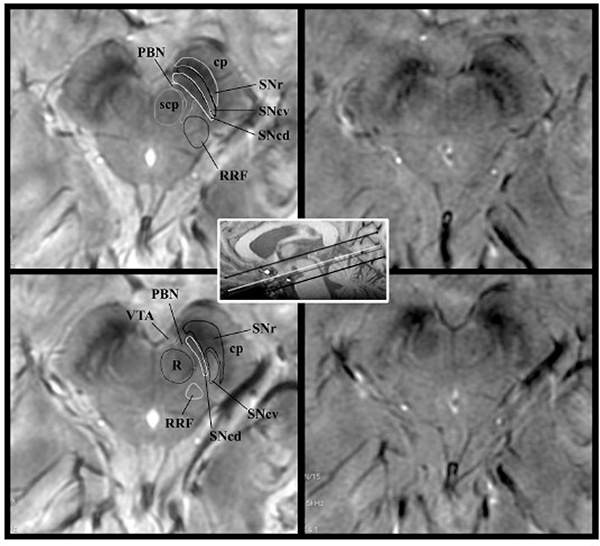
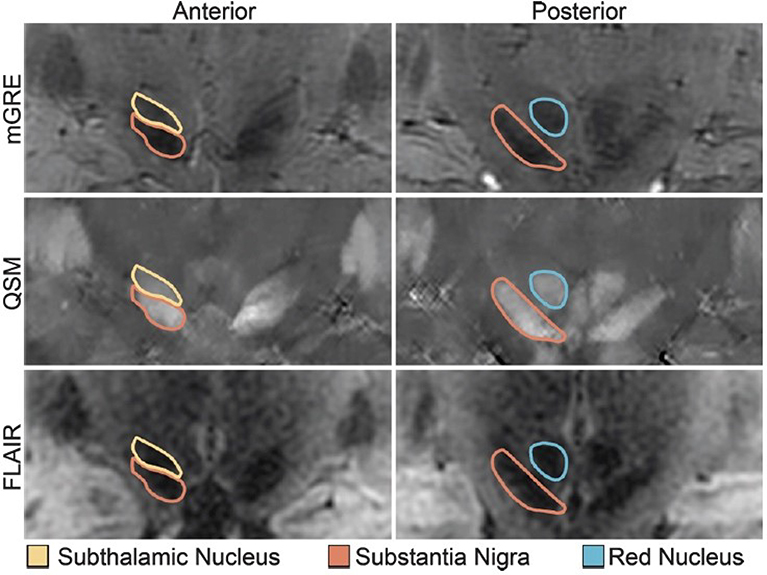
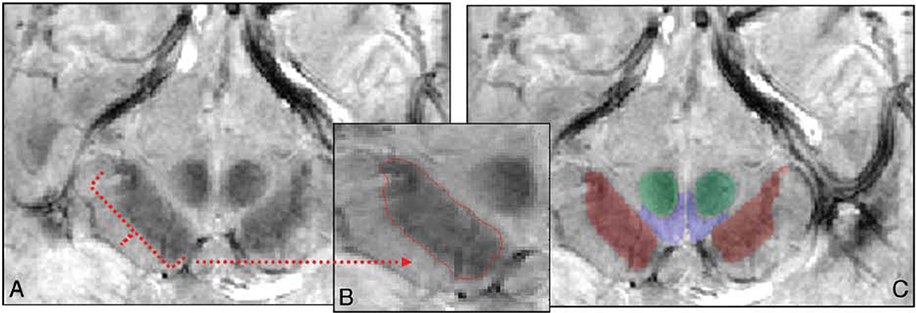
A number of relevant midbrain structures can be visualized on clinical strengths, including the SN, VTA, and the red nucleus (RN). Currently, on such strengths, the SN can be delineated into its subparts on clinical T2 weighted imaging, where the medial and lateral aspects represent the pars reticulata (SNr) and pars compacta (SNc).2,85 However, the small inner structures of the SN, and VTA, cannot be seen on these strengths.2 Many of these small structures contain neuromelanin or iron, which allows for increased visualization, delineation, and quantification on higher resolution 7T, most notably on SWI and QSM (Figures 4, 20, and 21).2 The vascularization of these structures, particularly in the SN and RN, is also difficult to visualized on clinical strengths, and is another area where 7T provides more anatomic details.84 Eapen et al demonstrated that the boundaries, substructure, and different vascularization patterns of the SN, VTA, and RN were more distinctly visible on T2W and T2*W sequences on 7T (Figure 22).84
Figure 20:
SWAN-targeted axial image of the midbrain in a healthy subject evaluated at 3T (right column) and at 7T (left column). The trilaminar organization of the SN at level II (upper row) and the nigrosome formation at level I (lower row) are clearly shown with 3T and 7T magnets. Levels I and II of image acquisition are represented by white and gray lines in the scout image. On 7T images, we overlaid a diagram of the trilaminar structure of the SN derived by anatomic atlases.41 The diagnostic accuracy is elevated for both high- and ultra-high-field strength magnets. cp indicates cerebral peduncle; PBN, parabrachial nucleus; RRF, retrorubral field; scp, superior cerebellar peduncle; SNcv, substantia nigra pars compacta ventralis; SNcd, substantia nigra pars compacta dorsalis; SNr, substantia nigra pars reticularis; VTA, ventral tegmental area; R, red nucleus. From Cosottini M, Frosini D, Pesaresi I, et al. Comparison of 3T and 7T susceptibility-weighted angiography of the substantia nigra in diagnosing Parkinson disease. AJNR Am J Neuroradiol. 2015 Mar;36(3):461–6; with permission.
Figure 21: Midbrain nuclei segmentation. Coronal images of the STN, SN, and RN on GRE (top), QSM (middle), and FLAIR (bottom).
From Poston KL, Ua Cruadhlaoich MAI, Santoso LF, et al. Substantia Nigra Volume Dissociates Bradykinesia and Rigidity from Tremor in Parkinson’s Disease: A 7 Tesla Imaging Study. J Parkinsons Dis. 2020;10(2):591–604; with permission.
Figure 22: A, Sample segmented section in the midbrain in both GRASE and FEE scans at the level of the mammillary bodies. B, Segmented SN traced in red in the midbrain. C, Segmented structures (SN is red; VTA, blue; and RN, green) overlaid on the anatomic FFE image.
From Eapen M, Zald DH, Gatenby JC, et al. Using high-resolution MR imaging at 7T to evaluate the anatomy of the midbrain dopaminergic system. Am J Neuroradiol. 2011;32(4):688–694; with permission.
Parkinson Disease
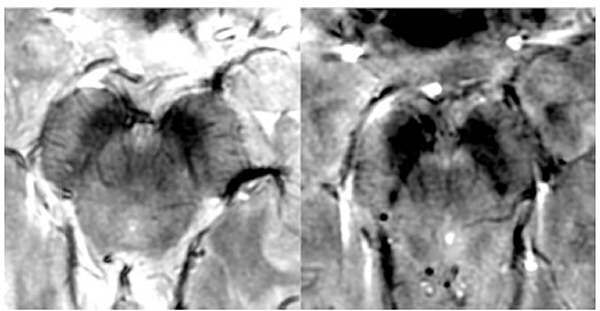
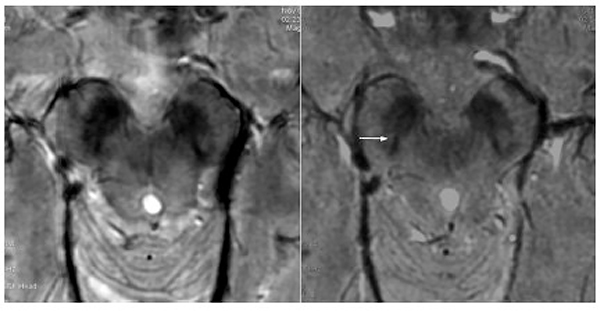
High resolution 7T has shown promise in neurogenerative diseases affecting the midbrain, such as Parkinson Disease (PD). Dysfunction within the previously detailed dopaminergic pathway manifests as symptoms of PD, specifically involving the SN. With the lower SNR and contrast resolution, clinical field strengths are insufficient in definitively delineating inner structures of the SN for diagnosis of PD.86 Identification of the central hyperintense component in the lateral aspect of the normal mid SN, for example, is less certain on 3T.2 Although the lower SNR decreases accuracy, 3T can still have utility in identifying true negative studies with the high specificity.2 On 7T, however, the three layer organizational structure of the SN, specifically the iron containing components, can be more readily distinguished, allowing for improved accuracy in diagnosis and follow up.86 For instance, one such abnormal finding in which 7T has superior accuracy compared to 3T is the loss of nigrosome 1 within the SN, which is an iron containing inner structure. Cosottini et al specifically showed that 7T is highly accurate in detecting normal appearing SNs in non PD patients and SN abnormalities in patients with known PD (Figure 23).86 In a subsequent study by the same group, they found higher accuracy of true positive cases of PD on 7T compared to 3T on SWI.2 They concluded that 3T is sufficient for clinical practice given the high specificity. However, in patients with high probability of PD with negative imaging on 3T, 7T would be warranted.2
Figure 23: Top - Axial SWAN images in a normal healthy patient at the midbrain at 7T (left) and 3T (right) shows visualization of the nigrosome complex on 7T but is lost at 3T (false positive). Bottom – Axial SWAN images in a PD patient at 7T (left) and 3T (right) showing loss of the nigrosome formation on 7T while the hyperintense band (white arrow) was erroneously interpreted as nigrosome (false negative).
From Cosottini M, Frosini D, Pesaresi I, et al. Comparison of 3T and 7T susceptibility-weighted angiography of the substantia nigra in diagnosing Parkinson disease. AJNR Am J Neuroradiol. 2015 Mar;36(3):461–6; with permission.
SN volume is also an important characteristic within PD. Poston et al correlated SN atrophy with longer disease duration as well as both bradykinesia and rigidity, thus demonstrating that SN volume could serve as a potential biomarker in diagnosis and prognosis of PD.87
Major Depressive Disorder
High resolution 7T has made progress in neuropsychiatric disorders as well, where early detection can also improve both diagnosis and prognosis. Of the neuropsychiatric disorders, major depressive disorder (MDD), which is characterized by loss of pleasure (anhedonia), lack of concentration, appetite, sleep, and memory disturbances, hopelessness, etc is one of the most common, with 1 in 6 adults affected.88,89
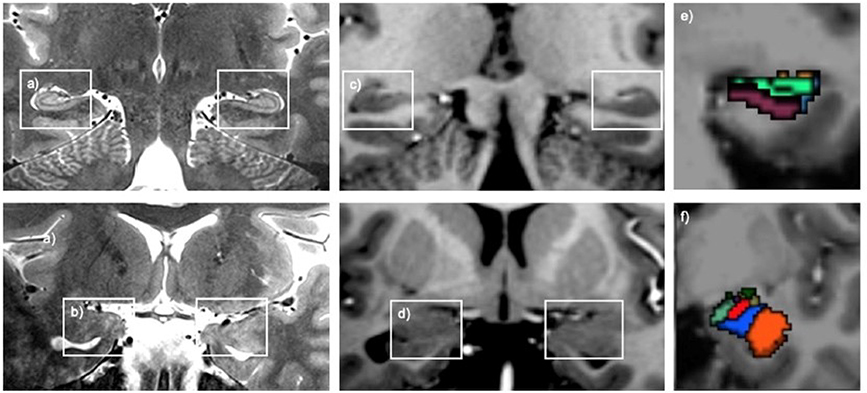
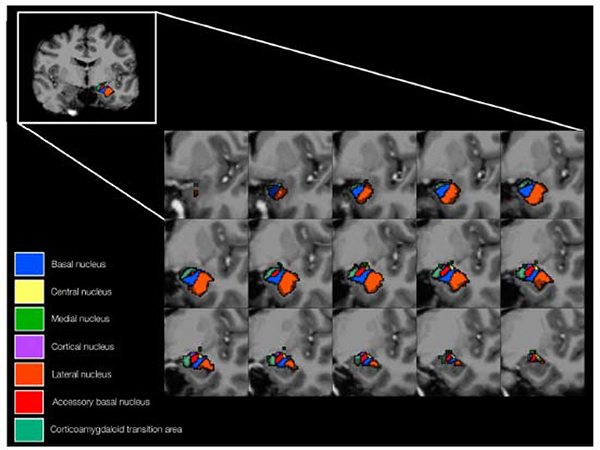
Studies on clinical strengths have shown anatomic abnormalities in patients with MDD with the amygdala, hippocampus, and insula being most affected.89 As previously discussed in detail, the SNR on 7T allows for greater anatomic visualization of the amygdala, hippocampus, and their inner structures. This has been especially relevant on 7T as studies have found more accurate volumetric evaluation of these regions in correlation with MDD symptoms. Brown et al, specifically, performed a volumetric evaluation of the limbic system and correlated their findings to MDD symptom severity, where they found volume reduction of the amygdala corresponds to increased MDD symptomatic severity (Figure 24).88
Figure 24: Top - T2W coronal images of the hippocampal head and amygdala (A and B) with corresponding T1W coronal images (C and D). Segmented hippocampal and amygdala nuclei (E and F). Bottom – Anatomic representation of the segmented amygdala nuclei.
From Brown SG, Rutland JW, Verma G, et al. Structural MRI at 7T reveals amygdala nuclei and hippocampal subfield volumetric association with Major Depressive Disorder symptom severity. Sci Rep. 2019;9(1):1–10; with permission.
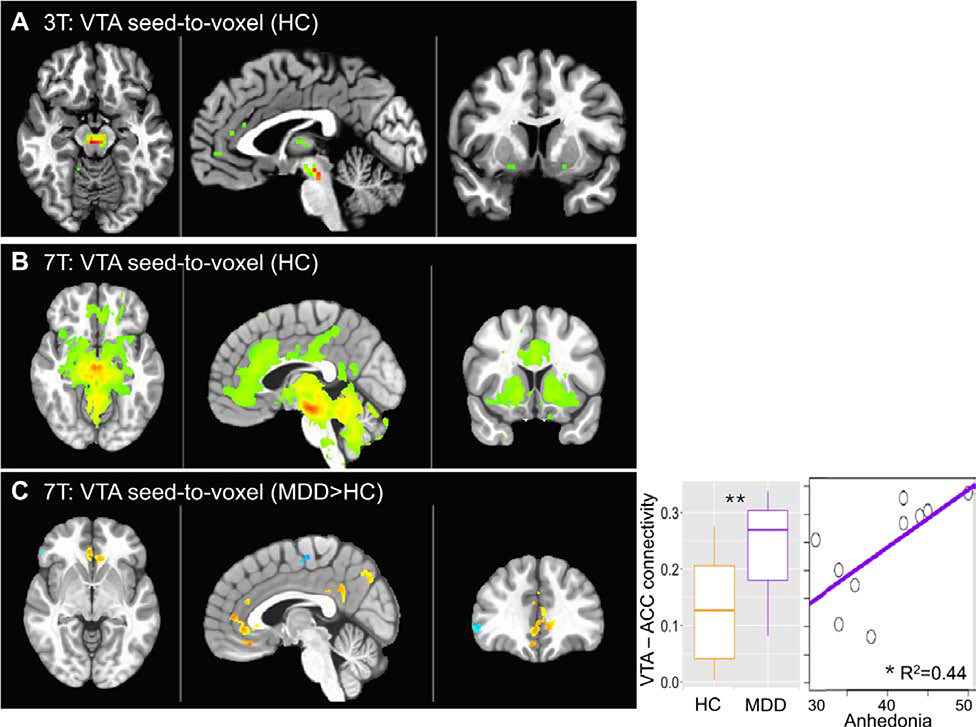
Although classically the limbic system is affected in MDD, recent studies have also identified circuitry disturbances involving the ventral tegmental area (VTA) of the midbrain.90 At clinical strengths, the VTA is difficult to delineate.90 However, Morris et al reported that the increased temporal SNR on 7T allows for improved visualization of the several implicated brain regions, including the VTA.90 Specifically, on 7T, they found hyperconnectivity between the VTA and anterior cingulate cortex, consistent with early findings of MDD (Figure 25). These findings were not detected on 3T.90
Figure 25: Connectivity of the VTA with whole brain is shown for 3T (a) and 7T (b) in healthy controls (HC) (voxelwise p < 0.001 for illustration).
c VTA-to-whole brain functional connectivity comparison between patients with major depressive disorder (MDD) and HC (p < 0.01 voxelwise, Cluster > 200). Seed-to-seed VTA-ACC connectivity is plotted for MDD and HC and against anhedonia in the MDD group. From Morris LS, Kundu P, Costi S, et al. Ultra-high field MRI reveals mood-related circuit disturbances in depression: a comparison between 3-Tesla and 7-Tesla. Transl Psychiatry. 2019;9(1):94; with permission.
THALAMUS
Anatomy
The thalamus and its adjacent structures, such as the sub- and epithalamus, play important roles as relay centers within the brain, transmitting both sensory and motor signals between different regions.91 The diencephalon consists of the thalamus, epithalamus (which includes the habenula), hypothalamus, and subthalamus. These are important clusters, serving as the focal points of signal transmission and have been implicated in a number of disease processes such as PD, essential tremor (ET) schizophrenia, MDD, etc.91 Therefore, accurate identification of these substructures is crucial for neuroanatomical mapping and potential neurosurgical intervention.
A number of thalamic and epithalamic nuclei have been identified and have been shown to play critical roles in disease processes. Clinical strengths are, however, insufficient for accurate targeting. Internal references, such as the anterior and posterior commissures, are currently necessary for more precise localization in these cases. With the higher SNR and increased contrast, high resolution 7T has shown great promise in delineation of these small thalamic substructures without the need for internal references, particular on WMnMPRAGE sequences (Figure 9).92,93,26 Although many of these substructures have been identified, this subsection will focus on the clinical relevant nuclei implicated in neurodegenerative diseases – namely the subthalamic nucleus (STN) and ventral thalamic nuclei - as well as the epithalamic nuclei in neuropsychiatric disease.
Movement Disorders
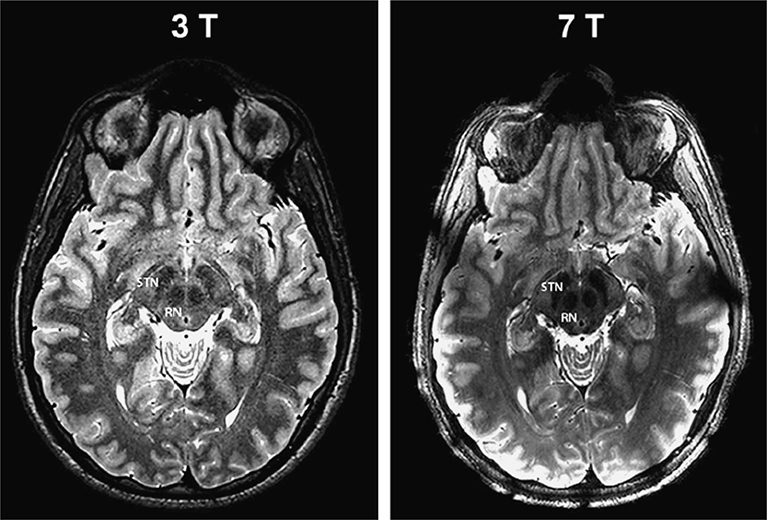
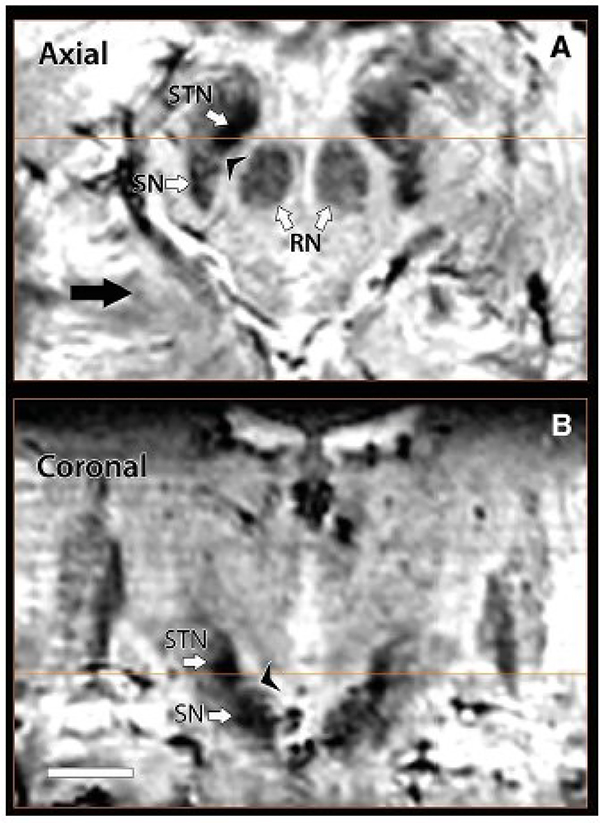
Movement disorders, such as PD, can benefit from invasive procedures such as deep brain stimulation (DBS) which target specific nuclei.94 In order to both maximize efficacy and minimize unnecessary complications; these procedures require precise anatomic localization of the target regions within the thalamus.94 The STN, which is a motor nucleus ventral to the thalamus, is the most frequent target in DBS for movement disorders. 93,94,95 The STN, in particular, cannot be adequately differentiated from the SN on clinical strengths, but can be distinguished on 7T (Figure 21, 26).93 One group reported that the increased contrast allowed for definitive delineation of the STN from the SN on 7T SWI in a small cohort (Figure 27).93 Similar findings were also demonstrated in prior animal studies as well.96
Figure 26: 3T (left) and 7T (right) T2W evaluation at the level of the STN showing more anatomic distinction on 7T.
From Abasch A, Yacoub E, Ugurbil K, et al. An assessment of current brain targets for deep brain stimulation surgery with susceptibility-weighted imaging at 7 tesla. Neurosurgery. 2010;67(6):1745–1756; with permission.
Figure 27: Axial (top) and coronal (bottom) SWI images on 7T demonstrating distinction boundaries between the STN and SN.
From Abasch A, Yacoub E, Ugurbil K, et al. An assessment of current brain targets for deep brain stimulation surgery with susceptibility-weighted imaging at 7 tesla. Neurosurgery. 2010;67(6):1745–1756; with permission.
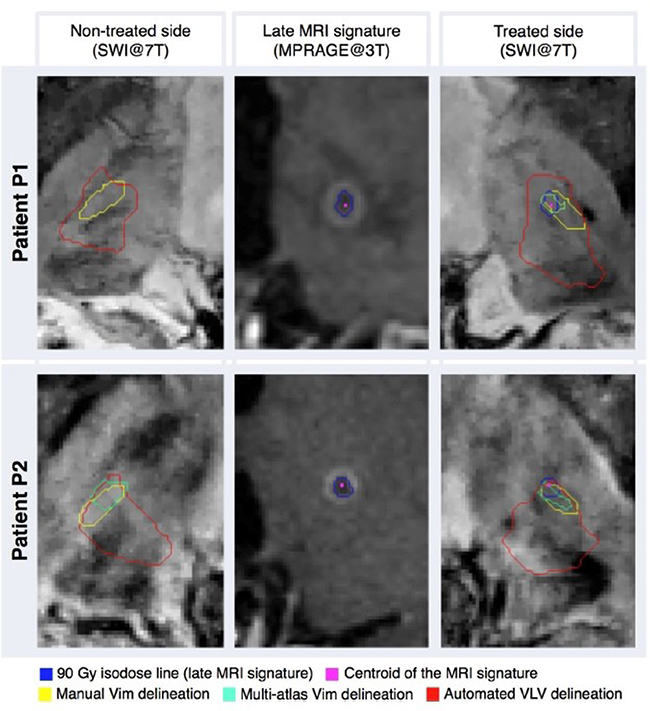
In addition to PD, drug resistant ET is a movement disorder that benefits from invasive procedures such as DBS or other forms of stereotactic radiosurgery.94 In such cases, the ventro-intermediate nucleus (Vim), which primarily relays motor information from the thalamus to the basal ganglia and motor cortex, is often the target.94 However, this small nucleus cannot be adequately visualized on clinical strengths, necessitating the use of adjacent anatomic landmarks, such as the quadrilatere of Guiot.94 However, multiple studies have shown the value of 7T where they reported definitive delineation of the Vim (Figure 28).94,95
Figure 28: Illustration of tremor patients. Both were treated with the left thalamus with left Vim radiosurgery for right sided refractory tremor.
From Najdenovska E, Tuleasca C, Jorge J, et al. Comparison of MRI-based automated segmentation methods and functional neurosurgery targeting with direct visualization of the Ventro-intermediate thalamic nucleus at 7T. Sci Rep. 2019;9(1):1119; with permission.
Neuropsychiatric disorders
The habenula, which is part of the epithalamus, and adjacent to the dorsomedial thalamus is an important structure previously implicated in MDD and addiction as a part of the reward pathway.97 The lateral habenula, which receives input from the basal ganglia and is overactivated in MDD, is often targeted for DBS in order to treat drug resistant cases of MDD.98 However, due to the small size, the habenula is difficult to delineate on clinical strength magnets, making it challenging for cases where DBS is warranted.97,98 The increased SNR and contrast that 7T provides for better delineation of these epithalamic nuclei within the habenula. Strotmann et al, for example, reported that the medial and lateral habenula were reliably distinguished on 7T using DWI and convention T1W, T2W, and GRE sequences.97 Kim et al furthered this analysis in a segmentation comparison of the habenular boundaries and volumes on 3T and 7T. They determined that the habenular boundaries were overestimated and volumes were underestimated on 3T compared to 7T (Figure 29).98 These findings could lead to inaccuracies in DBS and have significant ramifications, showing the value that 7T can provide in a clinical setting.
Figure 29: Coronal co-registered 7T MP2RAGE (top), down sampled 7T MP2RAGE (middle), and 3T T1W (bottom) of the habenula with segmentation (blue and red outlines represent 7T and 3T segmentation respectively).This shows subtle overestimation on 3T compared to 7T. The black arrows show 3T overestimation of the fascicula retroflexus.
From Kim JW, Naidich TP, Joseph J, et al. Reproducibility of myelin content-based human habenula segmentation at 3 Tesla. Hum Brain Mapp. 2018;39(7):3058–3071; with permission.
Limitations
Although these advances with high resolution 7T show promise, there are also limitations that must be considered in clinical use. Artifacts seen with lower magnet strengths are exacerbated at 7T, resulting in further image degradation.59 For example, radiofrequency field inhomogeneities (B1) are significant at 7T but less problematic at lower magnet strengths.1 This can lead to both changes in contrast and decreased SNR.90,74 B0 inhomogeneities, which increase with increased field strength, are also a major limitation, leading to geometric distortions through susceptibility artifact. This can be mitigated through shimming and decreased voxel volumes.74 Another limitation is the design of the head coil, which, due to lack of a transmit body coil, has an increasingly complex design incorporating both transmit and receive elements. 74 Additionally, at higher field strengths, there is an increase in the specific absorption rate (SAR) which exposes the patient to increased levels of heat.74 This, in turn, can cause patient discomfort and even radiofrequency related burns.99 Other limitations include artifact caused by chemical shift, which is detrimental to MR spectroscopy (MRS), where the usable volume at 7T is decreased.90,74 Additionally, when compared to 3T there are different relaxation constants for T1, T2, and T2* weighted imaging, which can affect both SNR and contrast.74 In spite of these general limitations, 7T can be utilized for lesion detection and anatomic visualization in both neurodegenerative and neuropsychiatric disease evaluation and management.
Synopsis.
High Resolution 7T Imaging and Quantitative Susceptibility Mapping
High resolution 7T produces greater anatomic detail compared to conventional strengths due to improvements in signal-to-noise ratio and contrast. The exquisite anatomic details of deep structures, including delineation of microscopic architecture utilizing advanced techniques such as quantitative susceptibility mapping, allows for improved detection of abnormal pathology thought to be imperceptible on clinical strengths. We will review caveats and techniques for translating sequences commonly used on 1.5 or 3T to high resolution 7T imaging. We will illustrate for several broad disease categories how high resolution 7T imaging can advance our understanding of various diseases, improve timely diagnosis, and guide management.
Key points.
High resolution 7T allows for greater anatomic detail compared to conventional strengths (3T and 1.5T) due to improvements in SNR and contrast, in particular with iron-sensitive sequences such as quantitative susceptibility mapping.
Motion-compensated sequences are key to take advantage of this increased resolution.
The greater anatomic detail allows for increased detection of pathology in neurological diseases, neuropsychiatric diseases, and for neurosurgical applications, which may be undetected or otherwise thought to be normal on conventional strengths.
Acknowledgments
Funding sources: NIH, PAC-12, GE Healthcare, ASNR
Disclosures: Michael Zeineh, M.D.-Ph.D. receive research funding from GE Healthcare.
Footnotes
Vivek Yedavalli, M.D., M.S. No Disclosures
Phillip DiGiacomo, M.S. No Disclosures
Elizabeth Tong, M.D. No Disclosures
Publisher's Disclaimer: This is a PDF file of an unedited manuscript that has been accepted for publication. As a service to our customers we are providing this early version of the manuscript. The manuscript will undergo copyediting, typesetting, and review of the resulting proof before it is published in its final form. Please note that during the production process errors may be discovered which could affect the content, and all legal disclaimers that apply to the journal pertain.
Contributor Information
Vivek Yedavalli, Johns Hopkins University, Department of Radiology and Radiological Sciences, Division of Neuroradiology, 600 N. Wolfe St. Phipps Building, Room B112-D, Baltimore, MD 21287.
Phillip DiGiacomo, Dept. of Bioengineering, Stanford University, Lucas Center for Imaging, Rm. P271, 1201 Welch Road, Stanford CA 94305-5488.
Elizabeth Tong, Dept. of Radiology, 300 Pasteur Drive, Room S031, Stanford, CA 94305-5105.
Michael Zeineh, Dept. of Radiology, Associate Chief of Neuroradiology for Operations and IT, Stanford University, Lucas Center for Imaging, Rm. P271, 1201 Welch Road, Stanford CA 94305-5488.
REFERENCES
- 1.Kerchner GA. Ultra-high field 7T MRI: A new tool for studying Alzheimers Disease. J Alzheimer’s Dis. 2011;26(SUPPL. 3):91–95. doi: 10.3233/JAD-2011-0023 [DOI] [PubMed] [Google Scholar]
- 2.Cosottini M, Frosini D, Pesaresi I, et al. Comparison of 3T and 7T susceptibility-weighted angiography of the substantia nigra in diagnosing Parkinson disease. Am J Neuroradiol. 2015;36(3):461–466. doi: 10.3174/ajnr.A4158 [DOI] [PMC free article] [PubMed] [Google Scholar]
- 3.Wisse LEM, Gerritsen L, Zwanenburg JJM, et al. Subfields of the hippocampal formation at 7 T MRI: in vivo volumetric assessment. Neuroimage. 2012;61(4):1043–1049. doi: 10.1016/j.neuroimage.2012.03.023 [DOI] [PubMed] [Google Scholar]
- 4.Hammond KE, Metcalf M, Carvajal L, et al. Quantitative in vivo magnetic resonance imaging of multiple sclerosis at 7 Tesla with sensitivity to iron. Ann Neurol. 2008;64(6):707–713. doi: 10.1002/ana.21582 [DOI] [PubMed] [Google Scholar]
- 5.Abosch A, Yacoub E, Ugurbil K, Harel N. An Assessment of Current Brain Targets for Deep Brain Stimulation Surgery With Susceptibility-Weighted Imaging at 7 Tesla. Neurosurgery. 2010;67(6):1745–1756. doi: 10.1227/NEU.0b013e3181f74105 [DOI] [PMC free article] [PubMed] [Google Scholar]
- 6.Goubran M, Rudko DA, Santyr B, et al. In vivo normative atlas of the hippocampal subfields using multi-echo susceptibility imaging at 7 Tesla. Hum Brain Mapp. 2014;35(8):3588–3601. doi: 10.1002/hbm.22423 [DOI] [PMC free article] [PubMed] [Google Scholar]
- 7.Bian W, Kerr AB, Tranvinh E, et al. MR susceptibility contrast imaging using a 2D simultaneous multi-slice gradient-echo sequence at 7T. PLoS One. 2019;14(7). doi: 10.1371/journal.pone.0219705 [DOI] [PMC free article] [PubMed] [Google Scholar]
- 8.Liu T, Spincemaille P, De Rochefort L, Kressler B, Wang Y. Calculation of susceptibility through multiple orientation sampling (COSMOS): A method for conditioning the inverse problem from measured magnetic field map to susceptibility source image in MRI. Magn Reson Med. 2009;61(1):196–204. doi: 10.1002/mrm.21828 [DOI] [PubMed] [Google Scholar]
- 9.Liu T, Liu J, De Rochefort L, et al. Morphology enabled dipole inversion (MEDI) from a single-angle acquisition: Comparison with COSMOS in human brain imaging. Magn Reson Med. 2011;66(3):777–783. doi: 10.1002/mrm.22816 [DOI] [PubMed] [Google Scholar]
- 10.Deistung A, Schäfer A, Schweser F, Biedermann U, Turner R, Reichenbach JR. Toward in vivo histology: A comparison of quantitative susceptibility mapping (QSM) with magnitude-, phase-, and R2*-imaging at ultra-high magnetic field strength. Neuroimage. 2013;65:299–314. doi: 10.1016/j.neuroimage.2012.09.055 [DOI] [PubMed] [Google Scholar]
- 11.Spincemaille P, Anderson J, Wu G, et al. Quantitative Susceptibility Mapping: MRI at 7T versus 3T. J Neuroimaging. October 2019:jon.12669. doi: 10.1111/jon.12669 [DOI] [PMC free article] [PubMed] [Google Scholar]
- 12.Mattern H, Sciarra A, Lüsebrink F, Acosta-Cabronero J, Speck O. Prospective motion correction improves high-resolution quantitative susceptibility mapping at 7T. Magn Reson Med. 2019;81(3):1605–1619. doi: 10.1002/mrm.27509 [DOI] [PubMed] [Google Scholar]
- 13.Di Ieva A, Göd S, Grabner G, et al. Three-dimensional susceptibility-weighted imaging at 7 T using fractal-based quantitative analysis to grade gliomas. Neuroradiology. 2013;55(1):35–40. doi: 10.1007/s00234-012-1081-1 [DOI] [PubMed] [Google Scholar]
- 14.Bian W, Tranvinh E, Tourdias T, et al. In Vivo 7T MR quantitative susceptibility mapping reveals opposite susceptibility contrast between cortical and white matter lesions in multiple sclerosis. Am J Neuroradiol 2016;37(10):1808–1815. doi: 10.3174/ajnr.A4830 [DOI] [PMC free article] [PubMed] [Google Scholar]
- 15.Zweckstetter M, Holak TA. An Adiabatic Multiple Spin-Echo Pulse Sequence: Removal of Systematic Errors Due to Pulse Imperfections and Off-Resonance Effects. J Magn Reson. 1998;133(1):134–147. doi: 10.1006/jmre.1998.1437 [DOI] [PubMed] [Google Scholar]
- 16.Emmerich J, Flassbeck S, Schmidt S, Bachert P, Ladd ME, Straub S. Rapid and accurate dictionary-based T 2 mapping from multi-echo turbo spin echo data at 7 Tesla. J Magn Reson Imaging. 2019;49(5):1253–1262. doi: 10.1002/jmri.26516 [DOI] [PubMed] [Google Scholar]
- 17.Maruyama S, Fukunaga M, Fautz HP, Heidemann R, Sadato N. Comparison of 3T and 7T MRI for the visualization of globus pallidus sub-segments. Sci Rep. 2019;9(1). doi: 10.1038/s41598-019-54880-x [DOI] [PMC free article] [PubMed] [Google Scholar]
- 18.Zeineh MM, Parekh MB, Zaharchuk G, et al. Ultrahigh-resolution imaging of the human brain with phase-cycled balanced steady-state free precession at 7 T. Invest Radiol. 2014;49(5):278–289. doi: 10.1097/RLI.0000000000000015 [DOI] [PMC free article] [PubMed] [Google Scholar]
- 19.van Kalleveen IML, Koning W, Boer VO, Luijten PR, Zwanenburg JJM, Klomp DWJ. Adiabatic turbo spin echo in human applications at 7 T. Magn Reson Med. 2012;68(2):580–587. doi: 10.1002/mrm.23264 [DOI] [PubMed] [Google Scholar]
- 20.Polak D, Setsompop K, Cauley SF, et al. Wave-CAIPI for highly accelerated MP-RAGE imaging. Magn Reson Med. 2018;79(1):401–406. doi: 10.1002/mrm.26649 [DOI] [PMC free article] [PubMed] [Google Scholar]
- 21.Seiger R, Hahn A, Hummer A, et al. Voxel-based morphometry at ultra-high fields. a comparison of 7T and 3T MRI data. Neuroimage. 2015;113:207–216. doi: 10.1016/j.neuroimage.2015.03.019 [DOI] [PMC free article] [PubMed] [Google Scholar]
- 22.Marques JP, Kober T, Krueger G, van der Zwaag W, Van de Moortele PF, Gruetter R. MP2RAGE, a self bias-field corrected sequence for improved segmentation and T1-mapping at high field. Neuroimage. 2010;49(2):1271–1281. doi: 10.1016/j.neuroimage.2009.10.002 [DOI] [PubMed] [Google Scholar]
- 23.O’Brien KR, Kober T, Hagmann P, et al. Robust T1-Weighted Structural Brain Imaging and Morphometry at 7T Using MP2RAGE. Margulies D, ed. PLoS One. 2014;9(6):e99676. doi: 10.1371/journal.pone.0099676 [DOI] [PMC free article] [PubMed] [Google Scholar]
- 24.Choi US, Kawaguchi H, Matsuoka Y, Kober T, Kida I. Brain tissue segmentation based on MP2RAGE multi-contrast images in 7 T MRI. PLoS One. 2019;14(2). doi: 10.1371/journal.pone.0210803 [DOI] [PMC free article] [PubMed] [Google Scholar]
- 25.Umutlu L, Theysohn N, Maderwald S, et al. 7 Tesla MPRAGE imaging of the intracranial arterial vasculature: Nonenhanced versus contrast-enhanced. Acad Radiol. 2013;20(5):628–634. doi: 10.1016/j.acra.2012.12.012 [DOI] [PubMed] [Google Scholar]
- 26.Tourdias T, Saranathan M, Levesque IR, Su J, Rutt BK. Visualization of intra-thalamic nuclei with optimized white-matter-nulled MPRAGE at 7T. Neuroimage. 2014;84:534–545. doi: 10.1016/j.neuroimage.2013.08.069 [DOI] [PMC free article] [PubMed] [Google Scholar]
- 27.Planche V, Su JH, Mournet S, et al. White-matter-nulled MPRAGE at 7T reveals thalamic lesions and atrophy of specific thalamic nuclei in multiple sclerosis. Mult Scler J. February 2019:135245851982829. doi: 10.1177/1352458519828297 [DOI] [PMC free article] [PubMed] [Google Scholar]
- 28.Lee J, Fukunaga M, Duyn JH. Improving contrast to noise ratio of resonance frequency contrast images (phase images) using balanced steady-state free precession. Neuroimage. 2011;54(4):2779–2788. doi: 10.1016/j.neuroimage.2010.10.071 [DOI] [PMC free article] [PubMed] [Google Scholar]
- 29.Bieri O, Scheffler K. On the origin of apparent low tissue signals in balanced SSFP. Magn Reson Med. 2006;56(5):1067–1074. doi: 10.1002/mrm.21056 [DOI] [PubMed] [Google Scholar]
- 30.Elliott AM, Bernstein MA, Ward HA, Lane J, Witte RJ. Nonlinear averaging reconstruction method for phase-cycle SSFP. Magn Reson Imaging. 2007;25(3):359–364. doi: 10.1016/j.mri.2006.09.013 [DOI] [PubMed] [Google Scholar]
- 31.Ribot EJ, Wecker D, Trotier AJ, et al. Water selective imaging and bSSFP banding artifact correction in humans and small animals at 3T and 7T, respectively. PLoS One. 2015;10(10). doi: 10.1371/journal.pone.0139249 [DOI] [PMC free article] [PubMed] [Google Scholar]
- 32.Parekh MB, Rutt BK, Purcell R, Chen Y, Zeineh MM. Ultra-high resolution in-vivo 7.0T structural imaging of the human hippocampus reveals the endfolial pathway. Neuroimage. 2015;112:1–6. doi: 10.1016/j.neuroimage.2015.02.029 [DOI] [PMC free article] [PubMed] [Google Scholar]
- 33.Gallichan D, Marques JP, Gruetter R. Retrospective correction of involuntary microscopic head movement using highly accelerated fat image navigators (3D FatNavs) at 7T. Magn Reson Med. 2016;75(3):1030–1039. doi: 10.1002/mrm.25670 [DOI] [PubMed] [Google Scholar]
- 34.Engström M, Mårtensson M, Avventi E, Norbeck O, Skare S. Collapsed fat navigators for brain 3D rigid body motion. Magn Reson Imaging. 2015;33(8):984–991. doi: 10.1016/j.mri.2015.06.014 [DOI] [PubMed] [Google Scholar]
- 35.Gallichan D, Marques JP. Optimizing the acceleration and resolution of three-dimensional fat image navigators for high-resolution motion correction at 7T. Magn Reson Med. 2017;77(2):547–558. doi: 10.1002/mrm.26127 [DOI] [PubMed] [Google Scholar]
- 36.Federau C, Gallichan D. Motion-Correction Enabled Ultra-High Resolution In-Vivo 7T-MRI of the Brain. Lin F-H, ed. PLoS One. 2016;11(5):e0154974. doi: 10.1371/journal.pone.0154974 [DOI] [PMC free article] [PubMed] [Google Scholar]
- 37.Ooi MB, Krueger S, Thomas WJ, Swaminathan SV, Brown TR. Prospective real-time correction for arbitrary head motion using active markers. Magn Reson Med. 2009;62(4):943–954. doi: 10.1002/mrm.22082 [DOI] [PMC free article] [PubMed] [Google Scholar]
- 38.Vannesjo SJ, Wilm BJ, Duerst Y, et al. Retrospective correction of physiological field fluctuations in high-field brain MRI using concurrent field monitoring. Magn Reson Med. 2015;73(5):1833–1843. doi: 10.1002/mrm.25303 [DOI] [PubMed] [Google Scholar]
- 39.Haeberlin M, Kasper L, Barmet C, et al. Real-time motion correction using gradient tones and head-mounted NMR field probes. Magn Reson Med. 2015;74(3):647–660. doi: 10.1002/mrm.25432 [DOI] [PubMed] [Google Scholar]
- 40.White N, Roddey C, Shankaranarayanan A, et al. PROMO: Real-time prospective motion correction in MRI using image-based tracking. Magn Reson Med. 2010;63(1):91–105. doi: 10.1002/mrm.22176 [DOI] [PMC free article] [PubMed] [Google Scholar]
- 41.Schulz J, Siegert T, Reimer E, et al. An embedded optical tracking system for motion-corrected magnetic resonance imaging at 7T. Magn Reson Mater Physics, Biol Med. 2012;25(6):443–453. doi: 10.1007/s10334-012-0320-0 [DOI] [PubMed] [Google Scholar]
- 42.Maclaren J, Armstrong BSR, Barrows RT, et al. Measurement and Correction of Microscopic Head Motion during Magnetic Resonance Imaging of the Brain. PLoS One. 2012;7(11). doi: 10.1371/journal.pone.0048088 [DOI] [PMC free article] [PubMed] [Google Scholar]
- 43.Zaitsev M, Dold C, Sakas G, Hennig J, Speck O. Magnetic resonance imaging of freely moving objects: prospective real-time motion correction using an external optical motion tracking system. Neuroimage. 2006;31(3):1038–1050. doi: 10.1016/j.neuroimage.2006.01.039 [DOI] [PubMed] [Google Scholar]
- 44.Speck O, Hennig J, Zaitsev M. Prospective real-time slice-by-slice motion correction for fMRI in freely moving subjects. Magn Reson Mater Physics, Biol Med. 2006;19(2):55–61. doi: 10.1007/s10334-006-0027-1 [DOI] [PubMed] [Google Scholar]
- 45.Maclaren J, Aksoy M, Ooi MB, Zahneisen B, Bammer R. Prospective motion correction using coil-mounted cameras: Cross-calibration considerations. Magn Reson Med. 2018;79(4):1911–1921. doi: 10.1002/mrm.26838 [DOI] [PMC free article] [PubMed] [Google Scholar]
- 46.Spangler-Bickell MG, Zeineh M, Jansen F, et al. Rigid Motion Correction for Brain PET/MR Imaging Using Optical Tracking. IEEE Trans Radiat Plasma Med Sci. 2018;3(4):498–503. doi: 10.1109/trpms.2018.2878978 [DOI] [PMC free article] [PubMed] [Google Scholar]
- 47.Stucht D, Danishad KA, Schulze P, Godenschweger F, Zaitsev M, Speck O. Highest Resolution In Vivo Human Brain MRI Using Prospective Motion Correction. Kassubek J, ed. PLoS One. 2015;10(7):e0133921. doi: 10.1371/journal.pone.0133921 [DOI] [PMC free article] [PubMed] [Google Scholar]
- 48.Mattern H, Sciarra A, Godenschweger F, et al. Prospective motion correction enables highest resolution time-of-flight angiography at 7T. Magn Reson Med. 2018;80(1):248–258. doi: 10.1002/mrm.27033 [DOI] [PMC free article] [PubMed] [Google Scholar]
- 49.DiGiacomo P, Maclaren J, Aksoy M, et al. A within-coil optical prospective motion-correction system for brain imaging at 7T. Magn Reson Med. February 2020:mrm.28211. doi: 10.1002/mrm.28211 [DOI] [PMC free article] [PubMed] [Google Scholar]
- 50.Mori S, Aggarwal M. In vivo magnetic resonance imaging of the human limbic white matter. Front Aging Neurosci. 2014;6(NOV). doi: 10.3389/fnagi.2014.00321 [DOI] [PMC free article] [PubMed] [Google Scholar]
- 51.Derix J, Yang S, Lüsebrink F, et al. Visualization of the amygdalo-hippocampal border and its structural variability by 7T and 3T magnetic resonance imaging. Hum Brain Mapp. 2014;35(9):4316–4329. doi: 10.1002/hbm.22477 [DOI] [PMC free article] [PubMed] [Google Scholar]
- 52.Thomas BP, Welch EB, Niederhauser BD, et al. High-resolution 7T MRI of the human hippocampus in vivo. J Magn Reson Imaging. 2008;28(5):1266–1272. doi: 10.1002/jmri.21576 [DOI] [PMC free article] [PubMed] [Google Scholar]
- 53.Ding SL, Van Hoesen GW. Organization and detailed parcellation of human hippocampal head and body regions based on a combined analysis of Cyto- and chemoarchitecture. J Comp Neurol. 2015;523(15):2233–2253. doi: 10.1002/cne.23786 [DOI] [PubMed] [Google Scholar]
- 54.Zeineh Michael M., Nicola Palomero-Gallagher, Markus Axer2, David Gräβel, Maged Goubran, Andreas Wree, Roger Woods4 KA and KZ. Direct Visualization and Mapping of the Spatial Course of Fiber Tracts at Microscopic Resolution in the Human Hippocampus. Cerebral Cortex. doi: 10.1093/cercor/bhw010 [DOI] [PMC free article] [PubMed] [Google Scholar]
- 55.Wisse LEM, Gerritsen L, Zwanenburg JJM, et al. Subfields of the hippocampal formation at 7T MRI: In vivo volumetric assessment. Neuroimage. 2012;61(4):1043–1049. doi: 10.1016/j.neuroimage.2012.03.023 [DOI] [PubMed] [Google Scholar]
- 56.Wisse LEM, Kuijf HJ, Honingh AM, et al. Automated hippocampal subfield segmentation at 7T MRI. Am J Neuroradiol. 2016;37(6):1050–1057. doi: 10.3174/ajnr.A4659 [DOI] [PMC free article] [PubMed] [Google Scholar]
- 57.Sladky R, Baldinger P, Kranz GS, et al. High-resolution functional MRI of the human amygdala at 7 T. Eur J Radiol. 2013;82(5):728–733. doi: 10.1016/j.ejrad.2011.09.025 [DOI] [PMC free article] [PubMed] [Google Scholar]
- 58.Cavedo E, Boccardi M, Ganzola R, et al. Local amygdala structural differences with 3T MRI in patients with Alzheimer disease. Neurology. 2011;76(8):727–733. doi: 10.1212/WNL.0b013e31820d62d9 [DOI] [PMC free article] [PubMed] [Google Scholar]
- 59.McKiernan EF, O’Brien JT. 7T MRI for neurodegenerative dementias in vivo: A systematic review of the literature. J Neurol Neurosurg Psychiatry. 2017;88(7):564–574. doi: 10.1136/jnnp-2016-315022 [DOI] [PubMed] [Google Scholar]
- 60.Ali R, Goubran M, Choudhri O, Zeineh MM. Seven-Tesla MRI and neuroimaging biomarkers for Alzheimer’s disease. Neurosurg Focus. 2015;39(5). doi: 10.3171/2015.9.FOCUS15326 [DOI] [PubMed] [Google Scholar]
- 61.Kerchner GA, Hess CP, Hammond-Rosenbluth KE, et al. Hippocampal CA1 apical neuropil atrophy in mild Alzheimer disease visualized with 7-T MRI. Neurology. 2010;75(15):1381–1387. doi: 10.1212/WNL.0b013e3181f736a1 [DOI] [PMC free article] [PubMed] [Google Scholar]
- 62.Kerchner GA, Deutsch GK, Zeineh M, Dougherty RF, Saranathan M, Rutt BK. Hippocampal CA1 apical neuropil atrophy and memory performance in Alzheimer’s disease. Neuroimage. 2012;63(1):194–202. doi: 10.1016/j.neuroimage.2012.06.048 [DOI] [PMC free article] [PubMed] [Google Scholar]
- 63.Kerchner GA, Berdnik D, Shen JC, et al. APOE e4 worsens hippocampal CA1 apical neuropil atrophy and episodic memory. Neurology. 2014;82(8):691–697. doi: 10.1212/WNL.0000000000000154 [DOI] [PMC free article] [PubMed] [Google Scholar]
- 64.Khan UA, Liu L, Provenzano FA, et al. Molecular drivers and cortical spread of lateral entorhinal cortex dysfunction in preclinical Alzheimer’s disease. Nat Neurosci. 2014;17(2):304–311. doi: 10.1038/nn.3606 [DOI] [PMC free article] [PubMed] [Google Scholar]
- 65.Wisse LEM, Reijmer YD, Ter Telgte A, et al. Hippocampal disconnection in early Alzheimer’s disease: A 7 tesla MRI study. J Alzheimer’s Dis. 2015;45(4):1247–1256. doi: 10.3233/JAD-142994 [DOI] [PubMed] [Google Scholar]
- 66.Boutet C, Chupin M, Lehéricy S, et al. Detection of volume loss in hippocampal layers in Alzheimer’s disease using 7 T MRI: A feasibility study. NeuroImage Clin. 2014;5:341–348. doi: 10.1016/j.nicl.2014.07.011 [DOI] [PMC free article] [PubMed] [Google Scholar]
- 67.Van Rooden S, Versluis MJ, Liem MK, et al. Cortical phase changes in Alzheimer’s disease at 7T MRI: A novel imaging marker. Alzheimer’s Dement. 2014;10(1):e19–e26. doi: 10.1016/j.jalz.2013.02.002 [DOI] [PubMed] [Google Scholar]
- 68.Zeineh MM, Chen Y, Kitzler HH, Hammond R, Vogel H, Rutt BK. Activated iron-containing microglia in the human hippocampus identified by magnetic resonance imaging in Alzheimer disease. Neurobiol Aging. 2015;36(9):2483–2500. doi: 10.1016/j.neurobiolaging.2015.05.022 [DOI] [PMC free article] [PubMed] [Google Scholar]
- 69.Kenkhuis B, Jonkman LE, Bulk M, et al. 7T MRI allows detection of disturbed cortical lamination of the medial temporal lobe in patients with Alzheimer’s disease. NeuroImage Clin. 2019;21:101665. doi: 10.1016/j.nicl.2019.101665 [DOI] [PMC free article] [PubMed] [Google Scholar]
- 70.Colon AJ, Osch MJP va., Buijs M, et al. MEG-guided analysis of 7T-MRI in patients with epilepsy. Seizure. 2018;60:29–38. doi: 10.1016/j.seizure.2018.05.019 [DOI] [PubMed] [Google Scholar]
- 71.Breyer T, Wanke I, Maderwald S, et al. Imaging of Patients with Hippocampal Sclerosis at 7 Tesla. Initial Results. Acad Radiol. 2010;17(4):421–426. doi: 10.1016/j.acra.2009.10.013 [DOI] [PubMed] [Google Scholar]
- 72.Griffiths PD, Coley SC, Connolly DJA, et al. MR imaging of patients with localisation-related seizures: Initial experience at 3.0T and relevance to the NICE guidelines. Clin Radiol. 2005;60(10):1090–1099. doi: 10.1016/j.crad.2005.05.017 [DOI] [PubMed] [Google Scholar]
- 73.Feldman RE, Delman BN, Pawha PS, et al. 7T MRI in epilepsy patients with previously normal clinical MRI exams compared against healthy controls. PLoS One. 2019;14(3). doi: 10.1371/journal.pone.0213642 [DOI] [PMC free article] [PubMed] [Google Scholar]
- 74.Balchandani P, Naidich TP. Ultra-high-field MR neuroimaging. Am J Neuroradiol. 2015;36(7):1204–1215. doi: 10.3174/ajnr.A4180 [DOI] [PMC free article] [PubMed] [Google Scholar]
- 75.Knake S, Triantafyllou C, Wald LL, et al. 3T phased array MRI improves the presurgical evaluation in focal epilepsies: A prospective study. Neurology. 2005;65(7):1026–1031. doi: 10.1212/01.wnl.0000179355.04481.3c [DOI] [PubMed] [Google Scholar]
- 76.De Ciantis A, Barba C, Tassi L, et al. 7T MRI in focal epilepsy with unrevealing conventional field strength imaging. Epilepsia. 2016;57(3):445–454. doi: 10.1111/epi.13313 [DOI] [PubMed] [Google Scholar]
- 77.Rutland JW, Feldman RE, Delman BN, et al. Subfield-specific tractography of the hippocampus in epilepsy patients at 7 Tesla. Seizure. 2018;62:3–10. doi: 10.1016/j.seizure.2018.09.005 [DOI] [PMC free article] [PubMed] [Google Scholar]
- 78.Feldman RE, Delman BN, Pawha PS, et al. 7T MRI in epilepsy patients with previously normal clinical MRI exams compared against healthy controls. Bernhardt BC, ed. PLoS One. 2019;14(3):e0213642. doi: 10.1371/journal.pone.0213642 [DOI] [PMC free article] [PubMed] [Google Scholar]
- 79.Feldman RE, Rutland JW, Fields MC, et al. Quantification of perivascular spaces at 7 T: A potential MRI biomarker for epilepsy. Seizure. 2018;54:11–18. doi: 10.1016/j.seizure.2017.11.004 [DOI] [PMC free article] [PubMed] [Google Scholar]
- 80.Springer E, Dymerska B, Cardoso PL, et al. Comparison of Routine Brain Imaging at 3 T and 7 T. Invest Radiol. 2016;51(8):469–482. doi: 10.1097/RLI.0000000000000256 [DOI] [PMC free article] [PubMed] [Google Scholar]
- 81.Stefanits H, Springer E, Pataraia E, et al. Seven-Tesla MRI of Hippocampal Sclerosis: An in Vivo Feasibility Study with Histological Correlations. Invest Radiol. 2017;52(11):666–671. doi: 10.1097/RLI.0000000000000388 [DOI] [PubMed] [Google Scholar]
- 82.Gillmann C, Coras R, Rössler K, et al. Ultra-high field MRI of human hippocampi: Morphological and multiparametric differentiation of hippocampal sclerosis subtypes. Biagini G, ed. PLoS One. 2018;13(4):e0196008. doi: 10.1371/journal.pone.0196008 [DOI] [PMC free article] [PubMed] [Google Scholar]
- 83.Voets NL, Hodgetts CJ, Sen A, Adcock JE, Emir U. Hippocampal MRS and subfield volumetry at 7T detects dysfunction not specific to seizure focus. Sci Rep. 2017;7(1):1–14. doi: 10.1038/s41598-017-16046-5 [DOI] [PMC free article] [PubMed] [Google Scholar]
- 84.Eapen M, Zald DH, Gatenby JC, Ding Z, Gore JC. Using high-resolution MR imaging at 7T to evaluate the anatomy of the midbrain dopaminergic system. Am J Neuroradiol. 2011;32(4):688–694. doi: 10.3174/ajnr.A2355 [DOI] [PMC free article] [PubMed] [Google Scholar]
- 85.Blazejewska AI, Schwarz ST, Pitiot A, et al. Visualization of nigrosome 1 and its loss in PD: Pathoanatomical correlation and in vivo 7 T MRI. Neurology. 2013;81(6):534–540. doi: 10.1212/WNL.0b013e31829e6fd2 [DOI] [PMC free article] [PubMed] [Google Scholar]
- 86.Cosottini M, Frosini D, Pesaresi I, et al. MR imaging of the substantia nigra at 7 T enables diagnosis of parkinson disease. Radiology. 2014;271(3):831–838. doi: 10.1148/radiol.14131448 [DOI] [PubMed] [Google Scholar]
- 87.Poston KL, Ua Cruadhlaoich MAI, Santoso LF, et al. Substantia Nigra Volume Dissociates Bradykinesia and Rigidity from Tremor in Parkinson’s Disease: A 7 Tesla Imaging Study. J Parkinsons Dis. 2020;10(2):591–604. doi: 10.3233/jpd-191890 [DOI] [PMC free article] [PubMed] [Google Scholar]
- 88.Brown SSG, Rutland JW, Verma G, et al. Structural MRI at 7T reveals amygdala nuclei and hippocampal subfield volumetric association with Major Depressive Disorder symptom severity. Sci Rep. 2019;9(1):1–10. doi: 10.1038/s41598-019-46687-7 [DOI] [PMC free article] [PubMed] [Google Scholar]
- 89.Johnston BA, Steele JD, Tolomeo S, Christmas D, Matthews K. Structural MRI-based predictions in patients with treatment-refractory depression (TRD). PLoS One. 2015;10(7). doi: 10.1371/journal.pone.0132958 [DOI] [PMC free article] [PubMed] [Google Scholar]
- 90.Morris LS, Kundu P, Costi S, et al. Ultra-high field MRI reveals mood-related circuit disturbances in depression: a comparison between 3-Tesla and 7-Tesla. Transl Psychiatry. 2019;9(1). doi: 10.1038/s41398-019-0425-6 [DOI] [PMC free article] [PubMed] [Google Scholar]
- 91.Liu Y, D’Haese PF, Newton AT, Dawant BM. Generation of human thalamus atlases from 7 T data and application to intrathalamic nuclei segmentation in clinical 3 T T1-weighted images. Magn Reson Imaging. 2020;65:114–128. doi: 10.1016/j.mri.2019.09.004 [DOI] [PubMed] [Google Scholar]
- 92.Kanowski M, Voges J, Buentjen L, Stadler J, Heinze HJ, Tempelmann C. Direct visualization of anatomic subfields within the superior aspect of the human lateral thalamus by MRI at 7T. Am J Neuroradiol. 2014;35(9):1721–1727. doi: 10.3174/ajnr.A3951 [DOI] [PMC free article] [PubMed] [Google Scholar]
- 93.Abosch A, Yacoub E, Ugurbil K, Harel N. An assessment of current brain targets for deep brain stimulation surgery with susceptibility-weighted imaging at 7 tesla. Neurosurgery. 2010;67(6):1745–1756. doi: 10.1227/NEU.0b013e3181f74105 [DOI] [PMC free article] [PubMed] [Google Scholar]
- 94.Najdenovska E, Tuleasca C, Jorge J, et al. Comparison of MRI-based automated segmentation methods and functional neurosurgery targeting with direct visualization of the Ventro-intermediate thalamic nucleus at 7T. Sci Rep. 2019;9(1). doi: 10.1038/s41598-018-37825-8 [DOI] [PMC free article] [PubMed] [Google Scholar]
- 95.Lenglet C, Abosch A, Yacoub E, De Martino F, Sapiro G, Harel N. Comprehensive in vivo Mapping of the Human Basal Ganglia and Thalamic Connectome in Individuals Using 7T MRI. Bankiewicz K, ed. PLoS One. 2012;7(1):e29153. doi: 10.1371/journal.pone.0029153 [DOI] [PMC free article] [PubMed] [Google Scholar]
- 96.Xiao YZ, Zitella LM, Duchin Y, et al. Multimodal 7T imaging of thalamic nuclei for preclinical deep brain stimulation applications. Front Neurosci. 2016;10(JUN). doi: 10.3389/fnins.2016.00264 [DOI] [PMC free article] [PubMed] [Google Scholar]
- 97.Strotmann B, Heidemann RM, Anwander A, et al. High-resolution MRI and diffusion-weighted imaging of the human habenula at 7 Tesla. J Magn Reson Imaging. 2014;39(4):1018–1026. doi: 10.1002/jmri.24252 [DOI] [PubMed] [Google Scholar]
- 98.Kim JW, Naidich TP, Joseph J, et al. Reproducibility of myelin content-based human habenula segmentation at 3 Tesla. Hum Brain Mapp. 2018;39(7):3058–3071. doi: 10.1002/hbm.24060 [DOI] [PMC free article] [PubMed] [Google Scholar]
- 99.Allison J, Yanasak N. What MRI sequences produce the highest specific absorption rate (SAR), and is there something we should be doing to reduce the SAR during standard examinations? Am J Roentgenol. 2015;205(2):W140. doi: 10.2214/AJR.14.14173 [DOI] [PubMed] [Google Scholar]


