

Summary
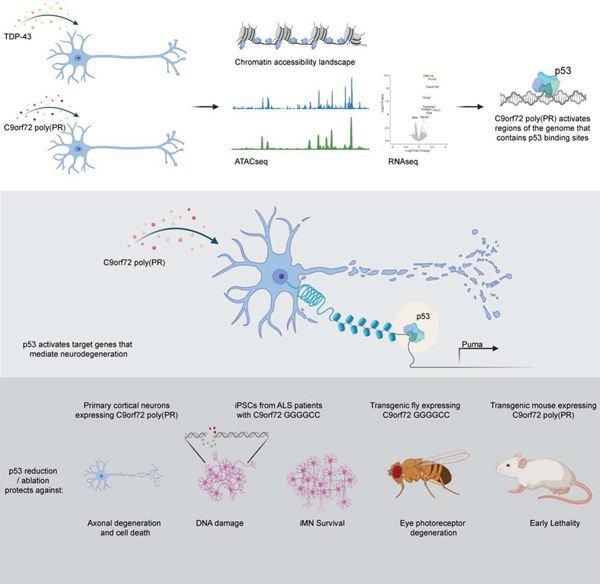
The most common genetic cause of ALS and FTD is a GGGGCC repeat expansion in the C9orf72 gene. We developed a platform to interrogate the chromatin accessibility landscape and transcriptional program within neurons during degeneration. We provide evidence that neurons expressing the dipeptide repeat protein poly(proline-arginine), translated from the C9orf72 repeat expansion, activate a highly specific transcriptional program, exemplified by a single transcription factor, p53. Ablating p53 in mice completely rescued neurons from degeneration and markedly increased survival in a C9orf72 mouse model. p53 reduction also rescued axonal degeneration caused by poly(glycine-arginine), increased survival of C9orf72 ALS/FTD patient iPSC-derived motor neurons, and mitigated neurodegeneration in a C9orf72 fly model. We show that p53 activates a downstream transcriptional program, including Puma, which drives neurodegeneration. These data demonstrate a neurodegenerative mechanism dynamically regulated through transcription factor binding events and provide a framework to apply chromatin accessibility and transcription program profiles to neurodegeneration.
Graphical Abstract
ETOC:
C9orf72 mutations associated with ALS and FTD activates a specific transcriptional program that converges on p53 to drive neurodegeneration in multiple C9orf72 models
Introduction
Amyotrophic lateral sclerosis (ALS) and frontotemporal dementia (FTD) are two devastating neurodegenerative diseases. ALS is a motor neuron disease associated with motor impairments and paralysis while FTD is associated with cognitive and behavioral impairments. Both diseases share some clinical overlap and also similar neuropathology – aggregation of the RNA-binding protein TDP-43 in the brain and spinal cord of affected individuals (Neumann et al., 2006). The two diseases are also linked by genetics, including a mutation in the C9orf72 gene as the most common cause of both FTD and ALS (DeJesus-Hernandez et al., 2011; Renton et al., 2011).
The C9orf72 mutation is a large GGGGCC repeat expansion in the first intron of the gene. There are several different ways by which this mutation might cause disease (Gitler and Tsuiji, 2016; Ling et al., 2013). One way is by loss of function, resulting from decreased C9orf72 expression (DeJesus-Hernandez et al., 2011; Kim et al., 2020). Another way is by the accumulation of GGGGCC containing RNAs (and GGCCCC RNAs produced from the antisense transcript) that sequester critical RNA-binding proteins (Cooper-Knock et al., 2014; Donnelly et al., 2013; Gendron et al., 2014; Lee et al., 2013; Mori et al., 2013a; Sareen et al., 2013) and/or interfere with essential cellular processes (Coyne et al., 2020). Finally, the repeat-containing RNAs can be translated into dipeptide repeat (DPR) proteins (Ash et al., 2013; Gendron et al., 2013; Mori et al., 2013b; Zu et al., 2013). These DPRs include glycine-alanine (GA), glycine-proline (GP), glycine-arginine (GR), proline-arginine (PR), and proline-alanine (PA) and they accumulate in the brains of patients with C9orf72 mutations and some of them are cytotoxic in cell and animal models (Gitler and Tsuiji, 2016). Notably, the arginine-rich DPRs, GR and PR, are the most toxic ones (Kwon et al., 2014; Mizielinska et al., 2014; Wen et al., 2014), but perplexingly, these two are not as abundant in patient brains as some of the other ones (Davidson et al., 2014; Mackenzie et al., 2015; Saberi et al., 2018; Sakae et al., 2018; Schludi et al., 2015), raising the question of their relevance to pathogenesis. On the other hand, these toxic DPRs could be key contributors to early facets of disease but because they are so toxic, they would not be present at detectable levels at end stage.
Emerging studies have suggested a role for alterations in epigenetic regulation in ALS and FTD, including DNA methylation, chromatin remodeling and histone post-translational modification (Barry et al., 2011; Belzil et al., 2016; Berson et al., 2017; Chesi et al., 2013; Cobos et al., 2019; Martin and Wong, 2013). To explore the epigenetic landscape and cellular mechanisms driving neurodegeneration, we sought to define the programs of gene expression and their regulators within neurons in response to pathogenic protein accumulation. Gene expression is regulated by the binding of transcription factors to specific DNA sequence motifs across the genome. Transcription factors do not always have access to these binding sites because the DNA is packaged into chromatin. The accessibility of these sites to transcription factors is tightly regulated. The assay for transposase-accessible chromatin using sequencing (ATAC-seq) is a high-throughput method that quantifies regions of the genome with open chromatin sites – ones that are accessible to transcription factors and thus transcriptionally active (Buenrostro et al., 2013; Buenrostro et al., 2015; Corces et al., 2017). This technique has been used to address a wide variety of biological questions, profiling the epigenetic features of chromatin state and DNA accessibility (Greenleaf, 2015). Owing to technical difficulties, ATAC-seq has not yet been applied to primary neurons.
To analyze the epigenomic landscape of neurodegeneration caused by ALS-associated protein aggregation, we developed a modified version of ATAC-seq that works on primary neurons. We discovered that C9orf72-ALS/FTD associated poly(PR) activated a remarkably specific signature of chromatin accessibility, involving transcriptional targets of the tumor suppressor gene p53. Our findings reveal an unexpected role of p53 as a mediator of neurodegeneration elicited by poly(PR) and provide an example of how ATAC-seq can now be applied to neurons to define mechanisms of neurodegeneration.
Results
The chromatin accessibility landscape of primary cortical neurons treated with C9orf72 (PR)50 or TDP-43
Two ALS associated proteins, TDP-43 and poly(PR) dipeptides produced from the C9orf72 hexanucleotide repeat expansion, form aggregates and cause degeneration in vitro and in vivo (Kwon et al., 2014; Neumann et al., 2006; Wen et al., 2014; Zhang et al., 2019). But do they do so by similar or different mechanisms? To obtain a comprehensive and integrative picture of the chromatin and transcriptional landscape of cortical neurons after ALS/FTD associated protein accumulation, we set up an in vitro system where we could monitor neuronal cell death and axonal degeneration elicited by either poly(PR) or TDP-43 accumulation. We cultured E16.5 mouse primary cortical neurons for 3 days to allow their processes to grow. We transduced them with lentiviruses expressing either a 50-repeat poly(PR) protein, (PR)50, TDP-43, or GFP as a negative control (Figure 1A, S1A–S1J). Both (PR)50 and TDP-43 caused marked cell death and axonal degeneration 72h after transduction. (PR)50 and TDP-43 expressing neurons formed numerous tubulin bIII puncta, indicating that microtubules disassembled, and the axons underwent degeneration (Figure 1C–1D).
Figure 1. Chromatin accessibility landscape of cortical neurons treated with GFP, C9orf72 (PR)50 or TDP-43.
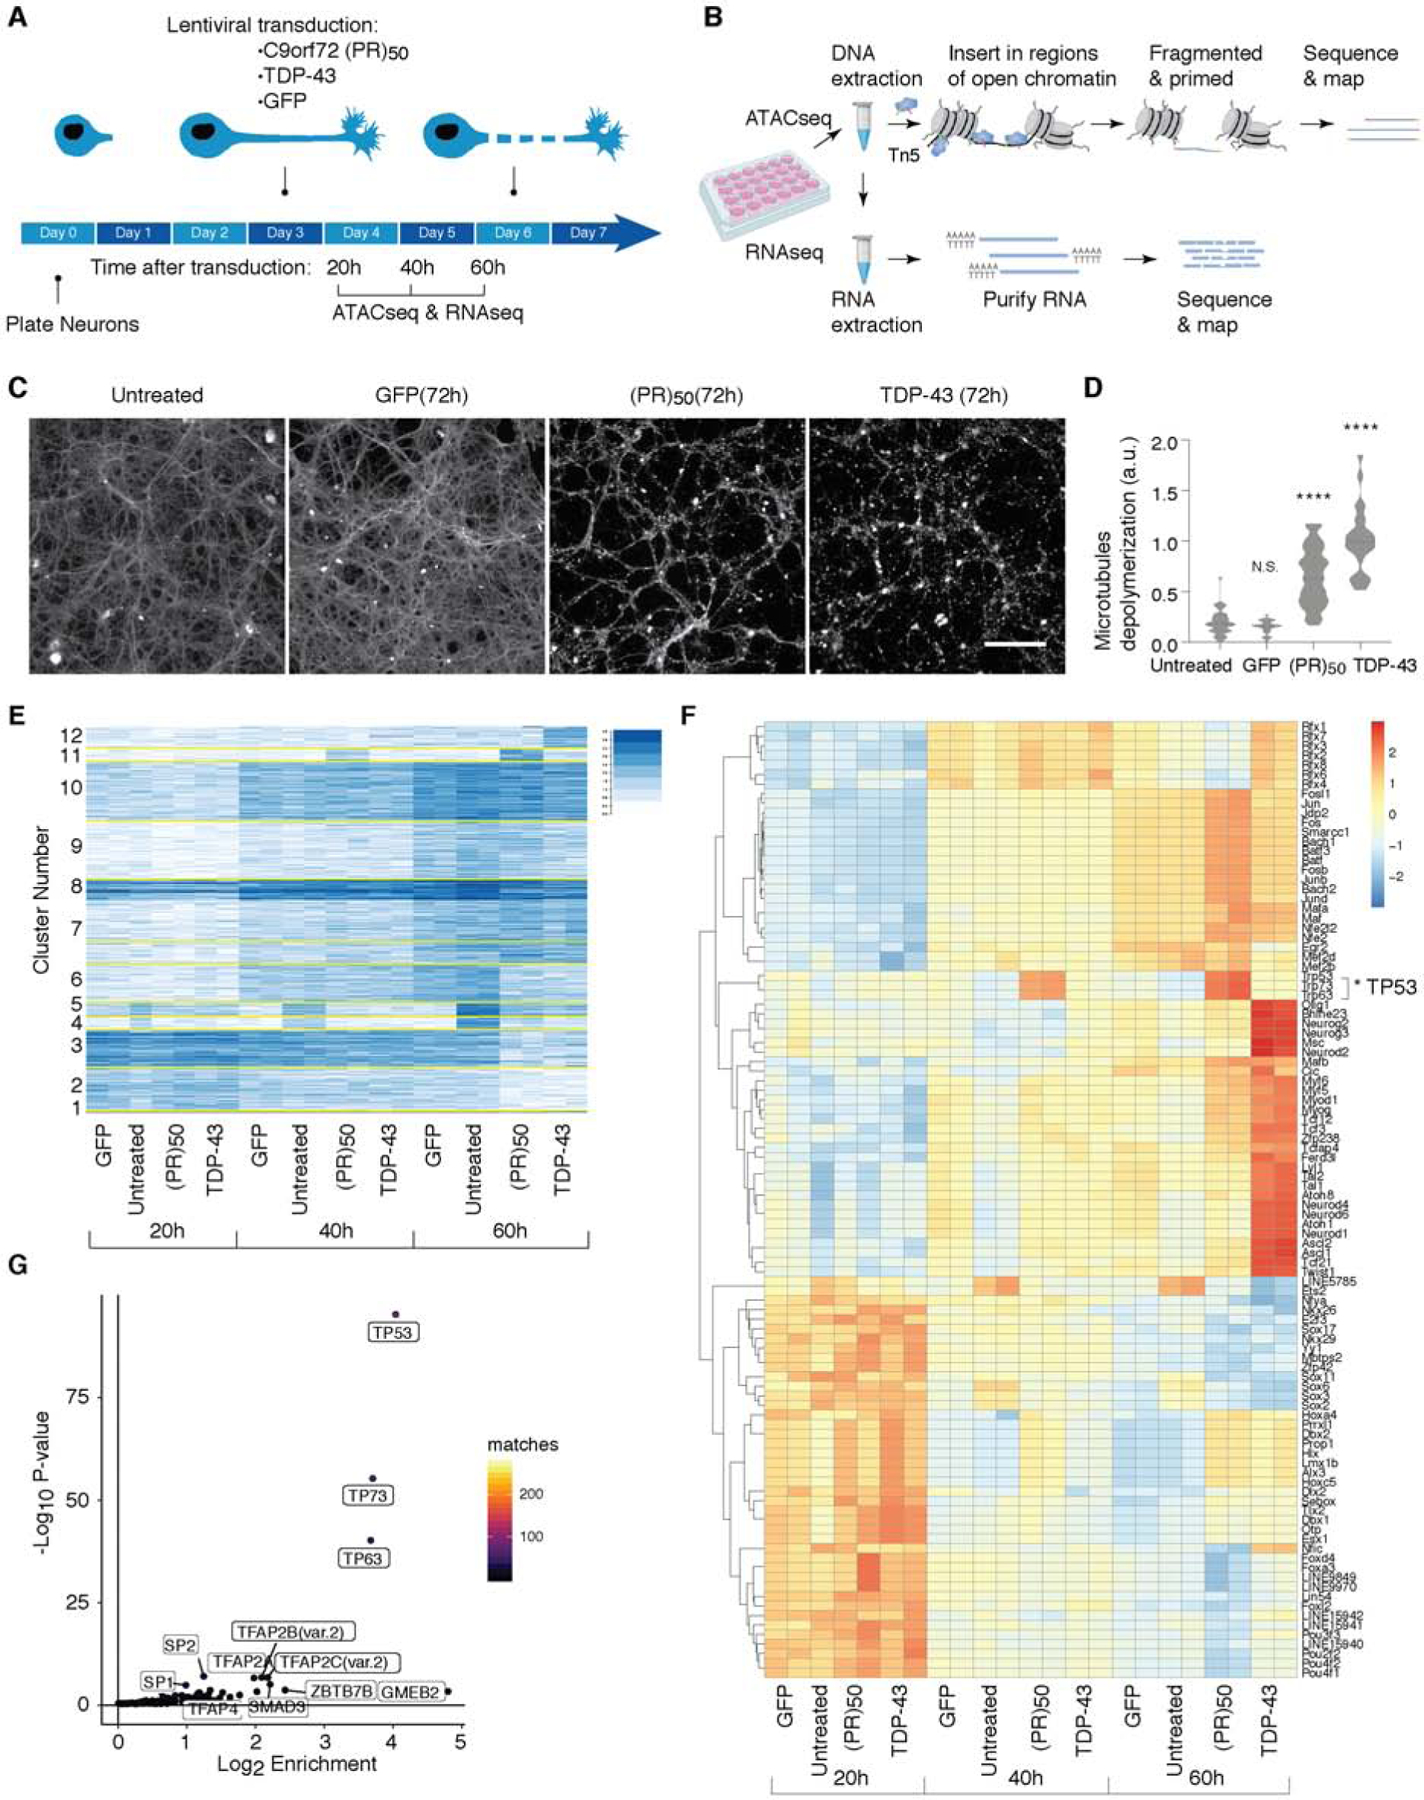
(A) Schematic illustration of the experimental design.
(B) On plate direct lysis followed by nuclei isolation was used to extract neuronal DNA. Hyperactive Tn5 transposase inserted sequencing adapters into open chromatin regions was used to prepare ATACseq libraries. A sequential RNA lysis step was performed after the direct DNA lysis to perform RNA-seq.
(C-D) Cortical primary neurons were cultured for 3 days, and either treated with GFP, C9orf72 (PR)50 or TDP-43 for additional 72h or left untreated. Axonal microtubules (MTs) were depolymerized and degraded after treatment with (PR)50 and TDP-43 (C). Quantification in (D), as described in STAR Methods (t test; ****p < 0.0001, N.S. not significant). Scale bar, 100 μm.
(E) K-means clustering (K=12) of the top 3960 variable peaks from the ATACseq analysis.
(F) Heatmap showing scaled ChromVar deviation scores across variable genes.
(G) Two-sided Fisher’s exact test enrichment p-values of Cluster 11 transcription factors from panel (E) against the background of all other clusters. Cluster 11 shows highest enrichment for p53 transcription factor and its family members (p63 and p73).
Both TDP-43 and (PR)50 elicited neurodegeneration that looked grossly similar (Figure 1C–1D), but we wondered whether the underlying chromatin regulation and gene expression programs driving degeneration were the same or different. The assay for transposase-accessible chromatin using sequencing (ATAC-seq) is a high-throughput method that quantifies regions of the genome with open chromatin sites – ones that are accessible to transcription factors and thus transcriptionally active. To probe chromatin accessibility in primary neurons, we developed a modified version of ATAC-seq. Recent methodological advances in the assay have enabled the generation of high-fidelity chromatin accessibility profiles for a variety of cell types (Corces et al., 2017). However, so far this assay has not been applied to primary neurons in vitro. The dissociation of cultured primary neurons, one of the first steps performed in the standard ATAC-seq protocol (Buenrostro et al., 2013; Buenrostro et al., 2015; Corces et al., 2017), causes neuron death, which interferes with ATAC-seq results and motivated us to optimize the protocol for use with primary neurons (see STAR Methods). Briefly, to avoid neuronal cell death as a result of dissociation, we instead used direct lysis of plated neurons, followed by isolation of released nuclei (Figure 1B, S2A–S2C). To probe chromatin accessibility, we harvested neurons 20, 40 and 60h following transduction of (PR)50, TDP-43, or GFP expressing lentiviruses. We chose these time points because they preceded the onset of neuronal morphological changes accompanying cell death and axonal degeneration. We performed sequential DNA and RNA extraction so we could obtain both regions of open chromatin (by ATAC-seq) as well as the transcriptional program of neurons in vitro (by RNA-seq) (Figure 1B).
Our ATAC-seq measurements of DNA accessibility displayed a wide array of changes during each treatment over the time course of the experiment. To track the differential DNA accessibility profiles, we used principal component analysis (PCA) (Figure S2D–S2E). The first principal component (PC1) explains the greatest possible variance in the neuronal data, reflecting the changes in chromatin accessibility that occur in neurons in culture over time. PC2 explains the second greatest proportion of variance, reflecting accessibility changes that occur only at later time points (40h and 60h) and specifically in neurons expressing TDP-43 or (PR)50 (Figure S2D–S2E). The first two PCs are used for visualization since they capture most of the variation from the dataset. These differential variations reflect the neuronal chromatin accessibility response to (PR)50 and TDP-43 over time (Figure S2F–S2L).
To characterize time-dependent modules of accessible chromatin regions, we first determined the most highly variable regions. We found 3960 different genomic regions that showed high variability both at different time points and under different treatment conditions (Figure 1E). We used k-means clustering (k=12) to identify different behaviors between the different conditions and time points. The clustering captures strong changes across time between all treatments, gain of accessibility (clusters 6–10) and loss of accessibility (clusters 1–3). We detected loss of accessibility in TDP-43, (PR)50 and GFP treated neurons (compared to untreated neurons), across all time points (clusters 4–5). We also detected regions that were more accessible for TDP-43 at 60h (cluster 12) and at 40h and 60h for (PR)50 (cluster 11) (Figure 1E). Thus, applying a modified version of the ATAC-seq protocol adapted for use with primary neurons, we generated diverse regulatory landscapes of neurodegeneration induced by the accumulation of distinct ALS-associated proteins.
In addition to quantitative genome-wide information on chromatin accessibility, ATAC-seq also affords the opportunity to identify predicted transcription factor (TF) binding events located in the open chromatin regions (Schep et al., 2017). In other words, are there any TF sequence motifs enriched in the ATAC-seq peaks? To identify TF binding motifs that are enriched at differentially accessible regions in neurons expressing TDP-43, (PR)50, or GFP, we applied chromVAR (Figure 1F). This bioinformatic approach facilitates the analysis of chromatin-accessibility data by estimating gain or loss of accessibility within peaks sharing the same motif, while controlling for technical biases (Schep et al., 2017). We clustered the top 100 differential TFs according to their deviation scores. We observed many differences in TF accessibility at 60h in neurons expressing TDP-43, but remarkably only a single family of TF was altered in C9orf72 (PR)50 treated neurons – the p53 family, comprising p53, p63 and p73 (Figure 1F). Indeed, when we examined predicted p53 family binding across the different clusters of ATAC-seq peaks, the p53, p63 and p73 binding motifs were significantly enriched only in cluster 11, the same cluster that captures the C9orf72 (PR)50 specific changes occurring after 40h and 60h of treatment (Figure 1E). Furthermore, in cluster 11 p53 was the most enriched TF predicted to bind to the C9orf72 (PR)50 open regions (Figure 1G). Thus, whereas neurodegeneration induced by TDP-43 accumulation seems to involve activation of a diverse set of regulatory elements throughout the genome, mediated by a wide range of TFs, the response to C9orf72 (PR)50 is remarkably specific to regulatory elements enriched in binding sites for a single TF family – p53.
The transcriptional program of primary cortical neurons treated with (PR)50 is mediated by p53
The enrichment of predicted p53 binding sites in regions of open chromatin in neurons expressing (PR)50 suggests p53 is mediating the neuronal response, but it does not prove it. To provide direct evidence that p53 transcriptional targets are activated (or repressed) in neurons in response to (PR)50, we performed RNA-seq on (PR)50, TDP-43, and GFP treated neurons at 20h, 40h, and 60h. Visualizing RNA-seq data using PCA (Figure S3A–S3B), reveals that the largest amount of variation reflects neuronal gene changes that occur over time. The second principal component reflects changes that occur only at later time points (40h and 60h) capturing the divergence in the neuronal responses to TDP-43 and (PR)50, from GFP and untreated (Figure S3A). Notably, the variation in gene expression between TDP-43 and (PR)50 mirrors the DNA accessibility data, underscoring unique footprints of chromatin accessibility and transcriptional programs in TDP-43 and (PR)50 treated neurons.
Analyzing the differentially expressed genes in neurons after 60h of (PR)50 treatment revealed that the most highly upregulated genes were Cdkn1a, Puma (Bbc3), Trp53inp1, Ccng1, Sulf2 and Fam212b (Figure 2A). Remarkably, these are all bona fide p53 target genes (Brady and Attardi, 2010). Importantly, the transcription program in the TDP-43 expressing neurons is not clearly associated with p53 (Figure 2B). Furthermore, KEGG pathway analysis of 6103 differentially expressed genes revealed p53 signaling to be the most enriched pathway in the gene sets specifically upregulated after (PR)50 treatment (cluster 2; Figure 2C, Figure S3C). Thus, p53 target genes are specifically activated in neurons expressing (PR)50, consistent with the DNA accessibility results.
Figure 2. The transcription program of cortical neurons treated with GFP, C9orf72 (PR)50 or TDP-43.
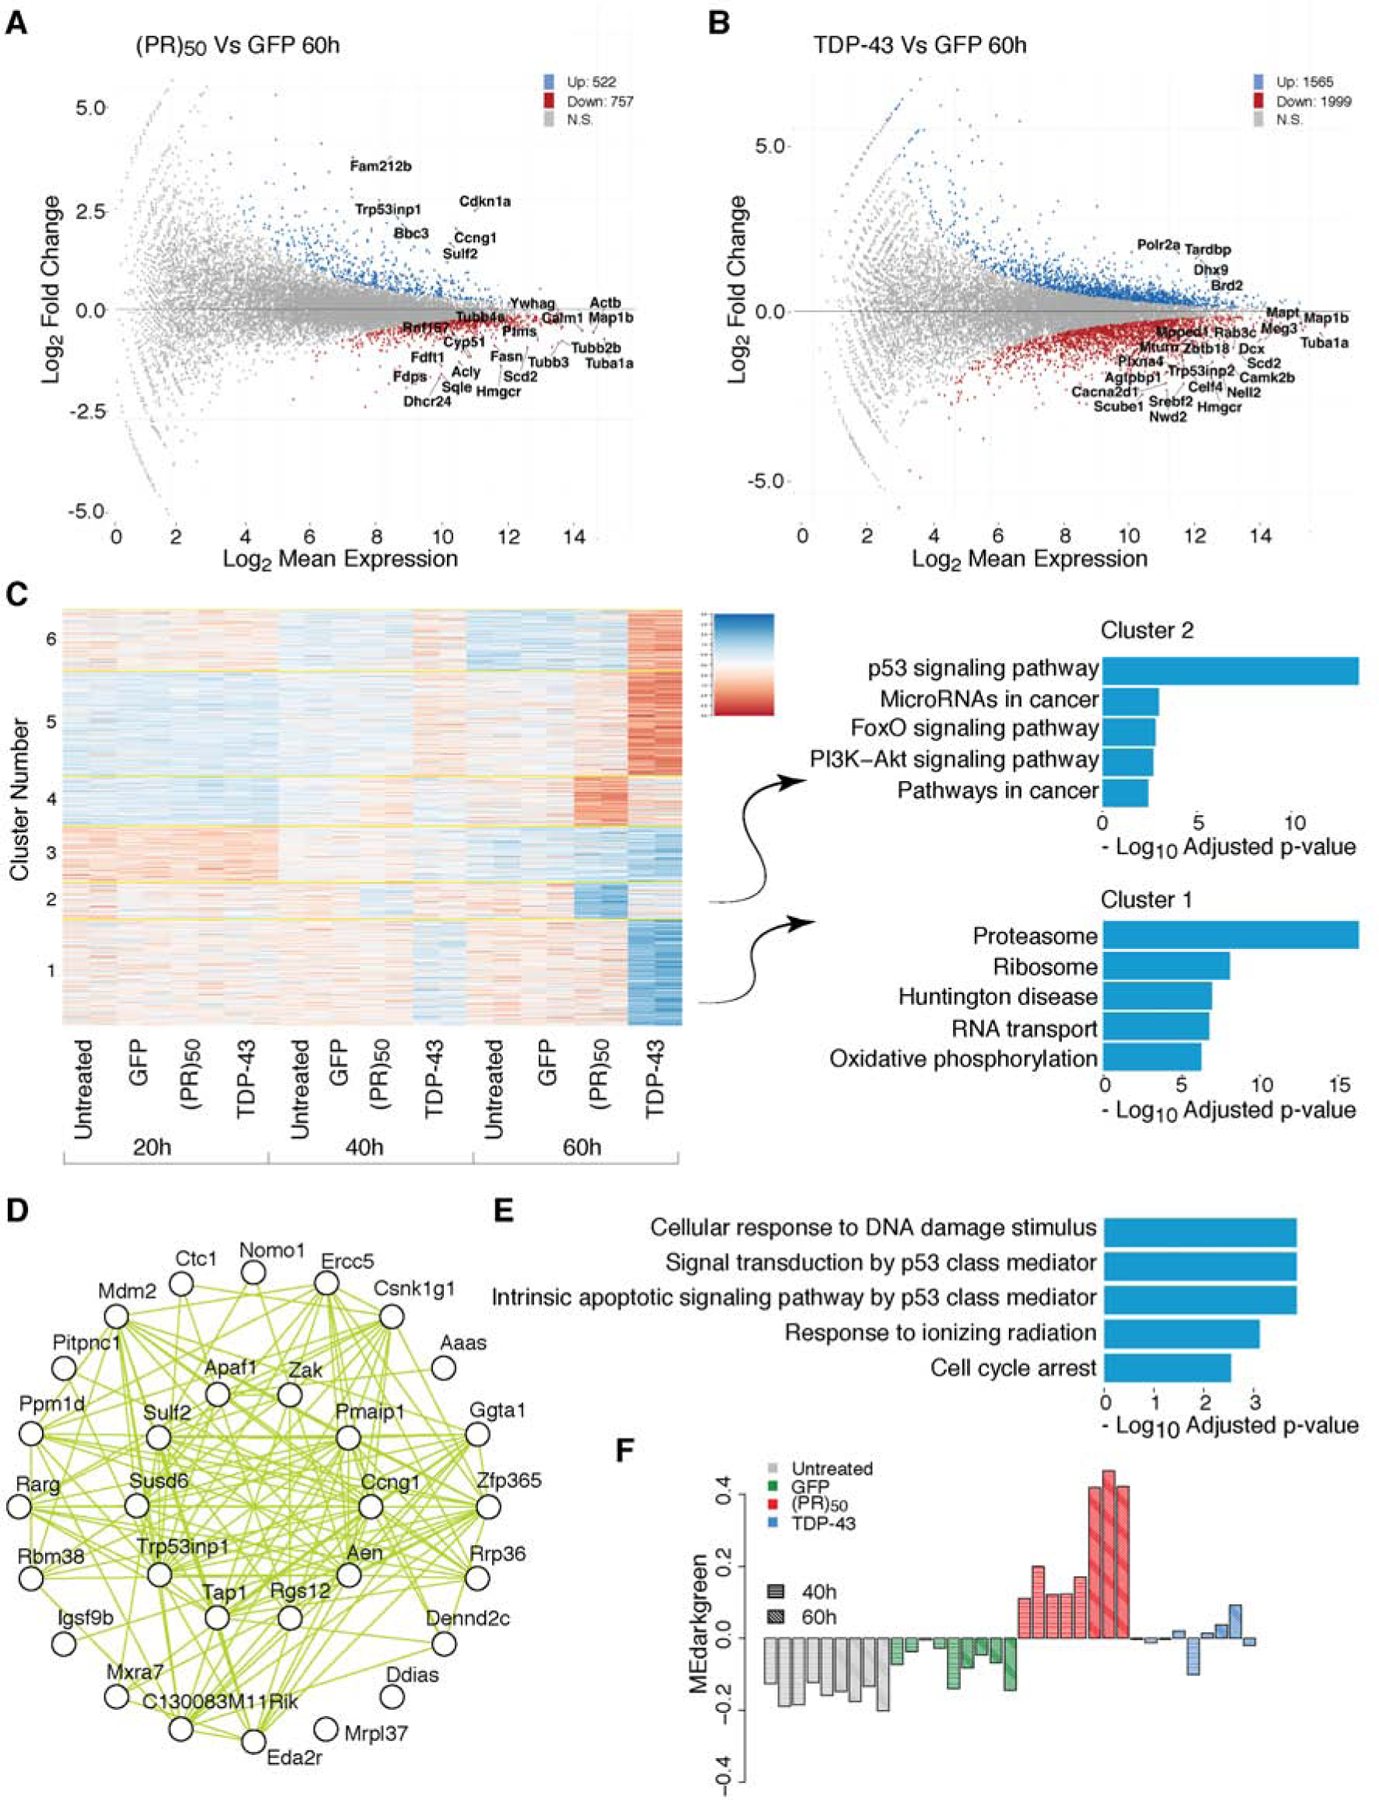
(A–B) MA Plot of 60h post treatment of (PR)50 vs GFP in (A) and TDP-43 vs GFP treated neurons in (B).
(C) K-means clustering (K=6) of the top 6109 variable transcripts. KEGG pathway gene ontology enrichment of clusters 1 and 2.
(D–F) Average linkage hierarchical clustering using the topological overlap metric for co-expression dissimilarity. Modules were identified from the dendrogram (presented in supplementary S3D) and labelled with colors. (D) Top 30 hub genes and 300 connections for co-expression module darkgreen. (E) Top gene ontology enrichments for co-expression module darkgreen. (F) Eigengene values of the darkgreen module for each individual sample.
To identify cellular pathways affected by (PR)50 and TDP-43 treatment, we utilized weighted gene co-expression network analysis (WGCNA) (Figure S3D). WGCNA is a computational approach for studying biological networks (Langfelder and Horvath, 2008). It can be applied to large, high-dimensional data sets to identify clusters (modules) of highly correlated genes. We identified 17 gene modules, 8 and 9 of which are dysregulated in (PR)50 and TDP-43, respectively (Figure S3D). One module of particular interest is the module labeled as darkgreen (Figure S3E) which is specifically upregulated in (PR)50 (Figure 2F, S3F). This module is highly enriched in genes annotated with p53 related functions, including cellular response to DNA damage, cell cycle arrest and intrinsic apoptotic signaling pathway by p53 (Figure 2E), as well as direct targets of p53 (Figure 2D), supporting the findings from the differential expression analysis. These changes in cellular pathways and gene expression together with the chromatin accessibility findings point to p53 as potentially a central regulator of the program of neurodegeneration elicited by C9orf72 (PR)50.
p53 is stabilized in neurons in response to C9orf72 (PR)50
Under normal conditions p53 is present in cells at very low levels (Boehme and Blattner, 2009; Meek and Anderson, 2009; Soussi, 2000). In response to a variety of cellular stressors, including DNA damage, p53 becomes rapidly stabilized and activated (Fielder et al., 2017). Once activated p53 helps cells to mount a response to the cellular damage by both transcription-dependent and – independent mechanisms (Culmsee and Mattson, 2005; Kastenhuber and Lowe, 2017). We performed immunoblotting of lysates of neurons treated with (PR)50, TDP-43, or GFP (Figure 3A–3B), using a p53-specific antibody (Figure S4A). Whereas p53 levels remained barely detectable in neurons expressing GFP or TDP-43, they were significantly elevated 72h after (PR)50 induction (Figure 3A–3B).
Figure 3. p53 ablation protects neurons from axonal degeneration elicited by C9orf72 DPRs.
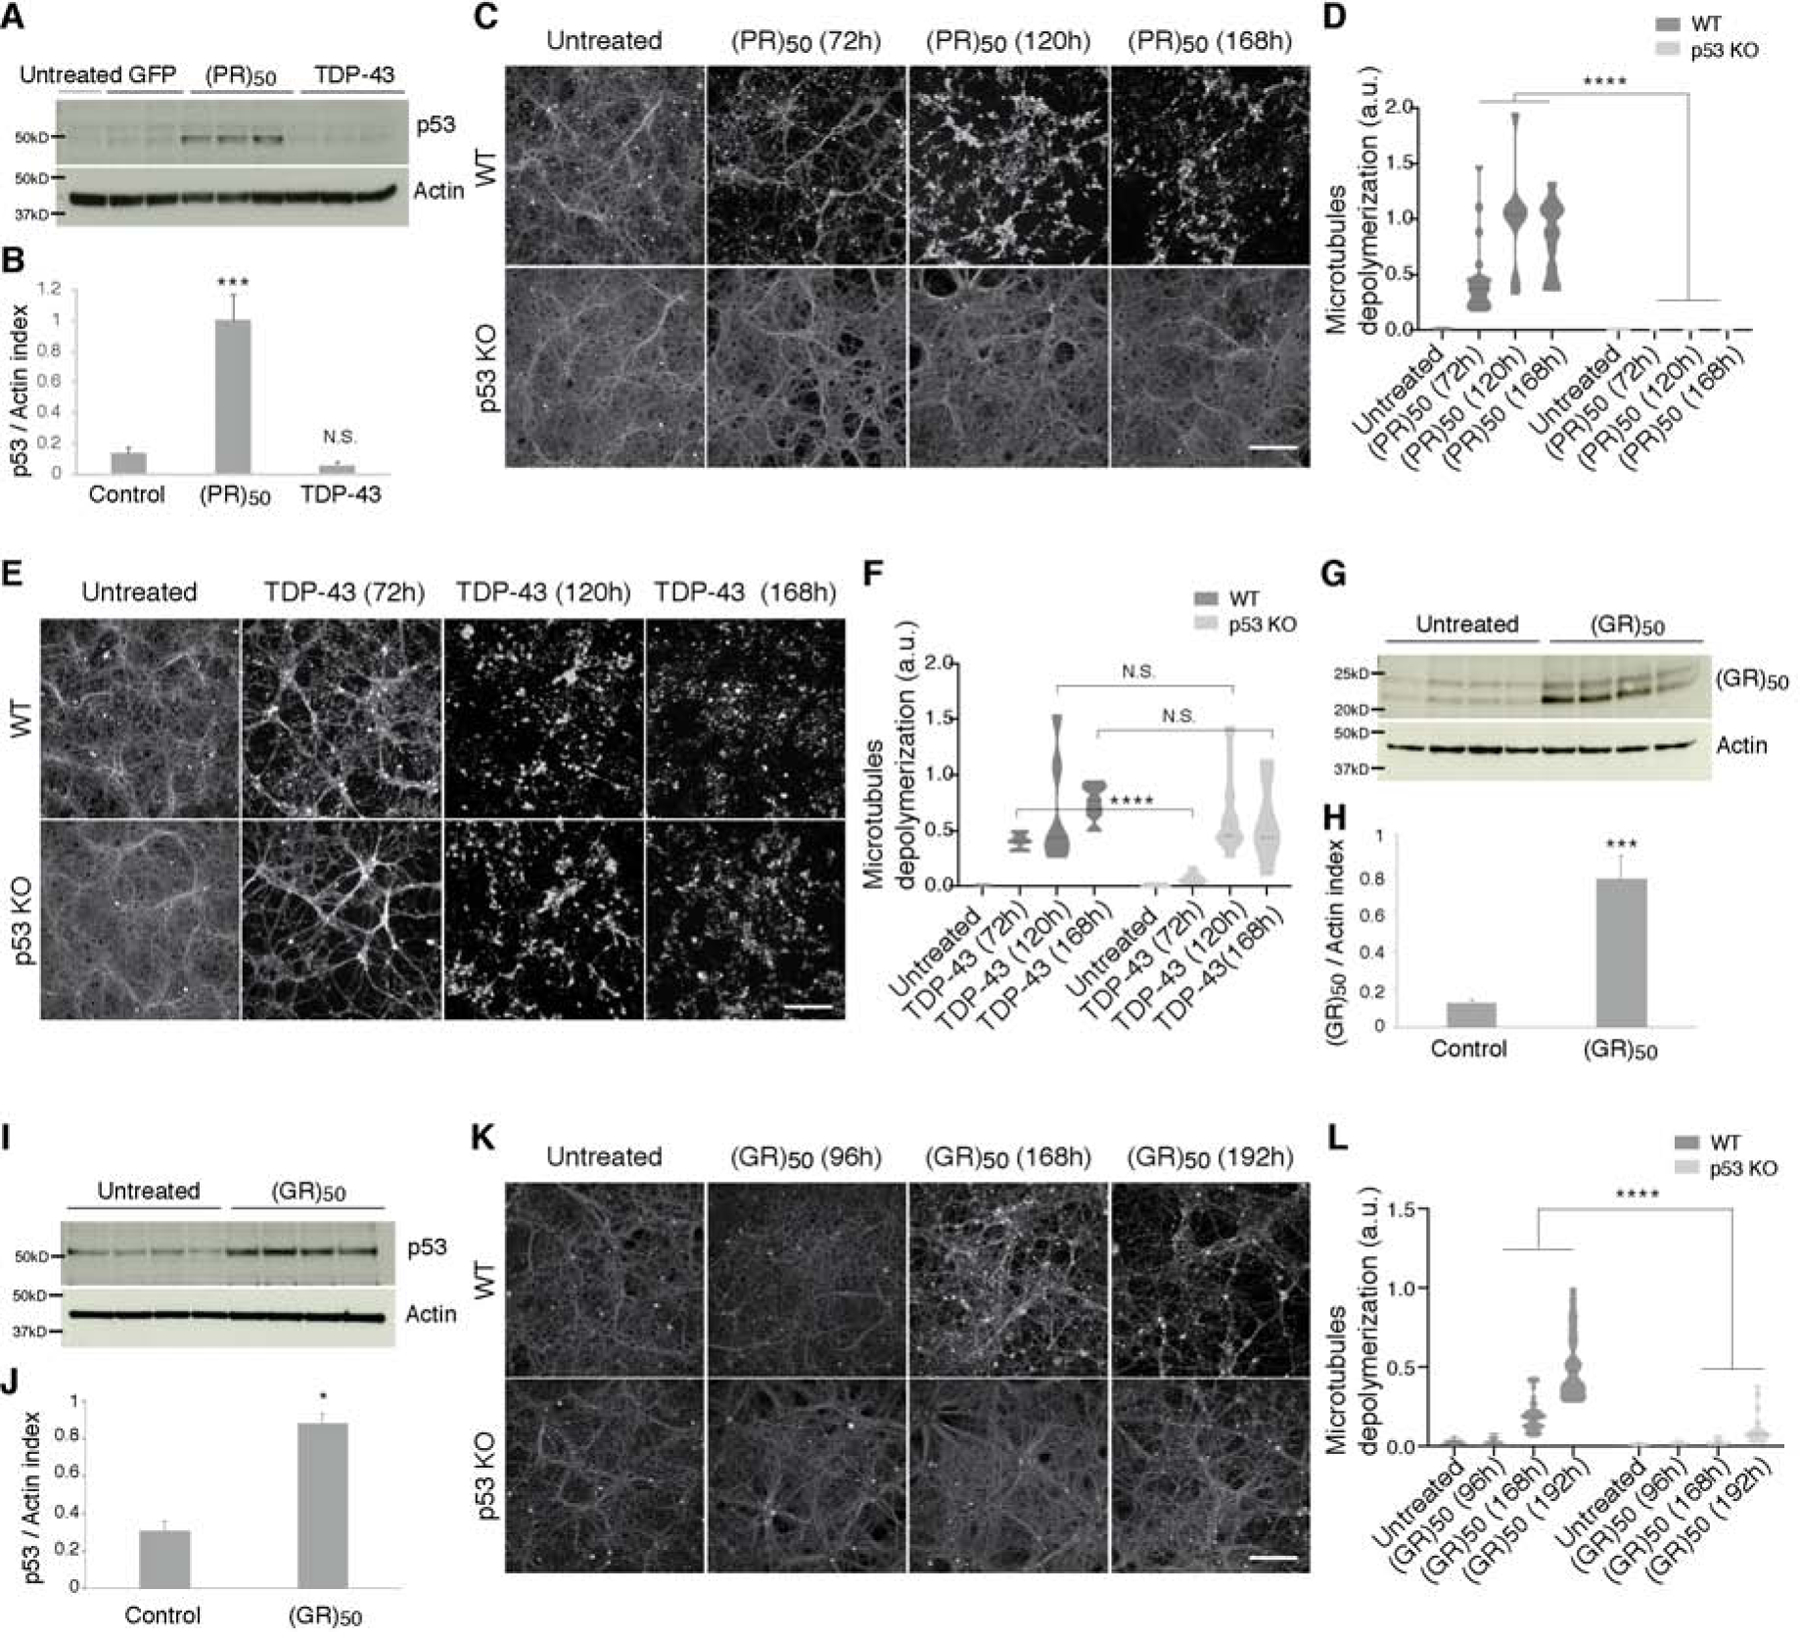
(A–B) p53 levels were elevated in (PR)50 treated neurons (A). Quantification of p53 levels by immunoblotting and normalized to actin (B). Graphs show mean ± SEM (t test; ***p < 0.001, N.S. not significant).
(C–F). Axonal microtubules (MTs) of WT cortical neurons were depolymerized and degraded after treatment with (PR)50 or TDP-43. The p53 KO cortical neurons and axons were completely protected from any degradation after (PR)50 treatment (C) but not after TDP-43 (E). Quantification shown in (D, F), as described in the STAR Methods (t test; ****p < 0.0001, N.S. not significant). Scale bar, 100 μm.
(G–J) WT cortical neurons treated with (GR)50 resulted in (GR)50 caused enhanced levels of p53, (I–J). Quantitation of (GR)50 and p53 was determined by immunoblots and normalized to actin (H and J). Graphs show mean ± SEM (t test; *p < 0.05, ***p < 0.001, N.S. not significant).
(K–L) Cortical neurons from p53 KO embryos or their WT littermates were either left untreated or treated with C9orf72 (GR)50. (K) Degeneration induced by (GR)50 was attenuated in p53 KO cortical neurons and quantified in (L), as described in STAR Methods (t test; ****p < 0.001). Scale bar, 100 μm.
To further investigate whether p53 elevated levels are due to protein stabilization or as a result of its transcriptional and or translational upregulation, we performed chase experiments with the protein synthesis inhibitor, cycloheximide. We treated neurons with cycloheximide after 48h of (PR)50 expression, a time point at which p53 RNA levels did not change (Figure S4B–S4D). Following 24h of cycloheximide treatment, we lysed neurons and analyzed p53 protein levels by immunoblotting (Figure S4B–S4D). p53 protein levels increased following (PR)50 treatment, even in the presence of cycloheximide, indicating p53 protein stabilization instead of increased synthesis. Together these data provide evidence that p53 is specifically stabilized in neurons in response to C9orf72 (PR)50.
p53 ablation protects neurons from axonal degeneration and cell death caused by C9orf72 (PR)50
Having established that C9orf72 (PR)50 expression in neurons stabilizes p53, activates regulatory elements throughout the genome that are enriched for p53 binding sites, and results in the upregulation of key p53 target genes, we next sought to directly test if p53 is required for neurodegeneration induced by C9orf72 (PR)50. We cultured primary cortical neurons from p53 knockout (KO) mice and from their wild type (WT) littermates for three days and transduced them with lentiviruses expressing TDP-43 or (PR)50. Strikingly, p53 KO neurons were completely protected from degeneration caused by (PR)50 (Figure 3C–3D). This level of protection from degeneration conferred by p53 ablation was long lasting and p53 KO neurons survived and did not show any sign of cell death or axonal degeneration for over seven days. Importantly, p53 KO neurons were not simply resistant to cell death because expression of TDP-43 caused visible microtubule disassembly and axonal degeneration (Figure 3E–3F).
We next asked whether p53 is required for neurodegeneration induced by a different DPR, poly(glycine-arginine); GR. The arginine-rich DPRs, PR and GR are the most toxic ones translated from the C9orf72 repeat expansion (Kwon et al., 2014; Mizielinska et al., 2014; Wen et al., 2014) and pathological evidence suggests GR accumulation correlates well with neurodegeneration in C9ALS/FTD (Sakae et al., 2018). Notably, GR is translated from the sense strand GGGGCC repeat, whereas PR is produced from the antisense strand (GGCCCC)(Zu et al., 2013). We cultured primary cortical neurons for three days and transduced them with lentiviruses expressing (GR)50 (Figure 3G–3L). We found elevated levels of GR in neurons by immunoblotting at 120h of (GR)50 expression (Figure 3G–3H). By 168h, we detected elevated p53 levels in neurons expressing (GR)50 (Figure 3I–3J) and the initiation of microtubule disassembly and axonal degeneration in WT neurons. These effects were strongly attenuated in p53 KO neurons (Figure 3K–3L). Thus, similar to its protective effects on (PR)50 toxicity, p53 ablation suppresses axonal degeneration induced by (GR)50.
In addition to axonal degeneration, we also tested p53’s role in neuronal cell death. Caspases are cellular mediators of programmed cell death that exist in an inactive precursor state and are activated by proteolytic cleavage (Hengartner, 2000). One of these, caspase-3 is an initiator of the cell death cascade and thus a marker of a cell’s initiation of cell death. We cultured primary cortical neurons from p53 KO mice and from their WT littermates for three days and transduced them with lentiviruses expressing (PR)50 (Figure 4A–4D). We detected elevated levels of cleaved caspase-3 in WT neurons by immunoblotting after 72h and 96h of (PR)50 expression (Figure 4A–4D). Importantly, cleaved caspase-3 was undetectable, across all time points, in p53 KO neurons, providing evidence that p53 KO neurons are completely protected from (PR)50 induced neurodegeneration (Figure 4A–4D). The difference in cell death and axonal degeneration in p53 KO neurons was not a result of reduced levels of (PR)50 expression because (PR)50 levels in neurons from both p53 KO and their WT littermates were similar at 72h (Figure 4G–4H). Interestingly, at later time points, we were only able to detect (PR)50 in p53 KO neurons, owing to the fact that nearly all of the WT neurons expressing (PR)50 had undergone degeneration by 96h (Figure 4J–4K). Thus, p53 KO neurons are able to completely resist the toxicity of C9orf72 (PR)50 accumulation.
Figure 4. p53 ablation rescues neurons from DNA damage, cell death and axonal degeneration elicited by C9orf72 (PR)50.
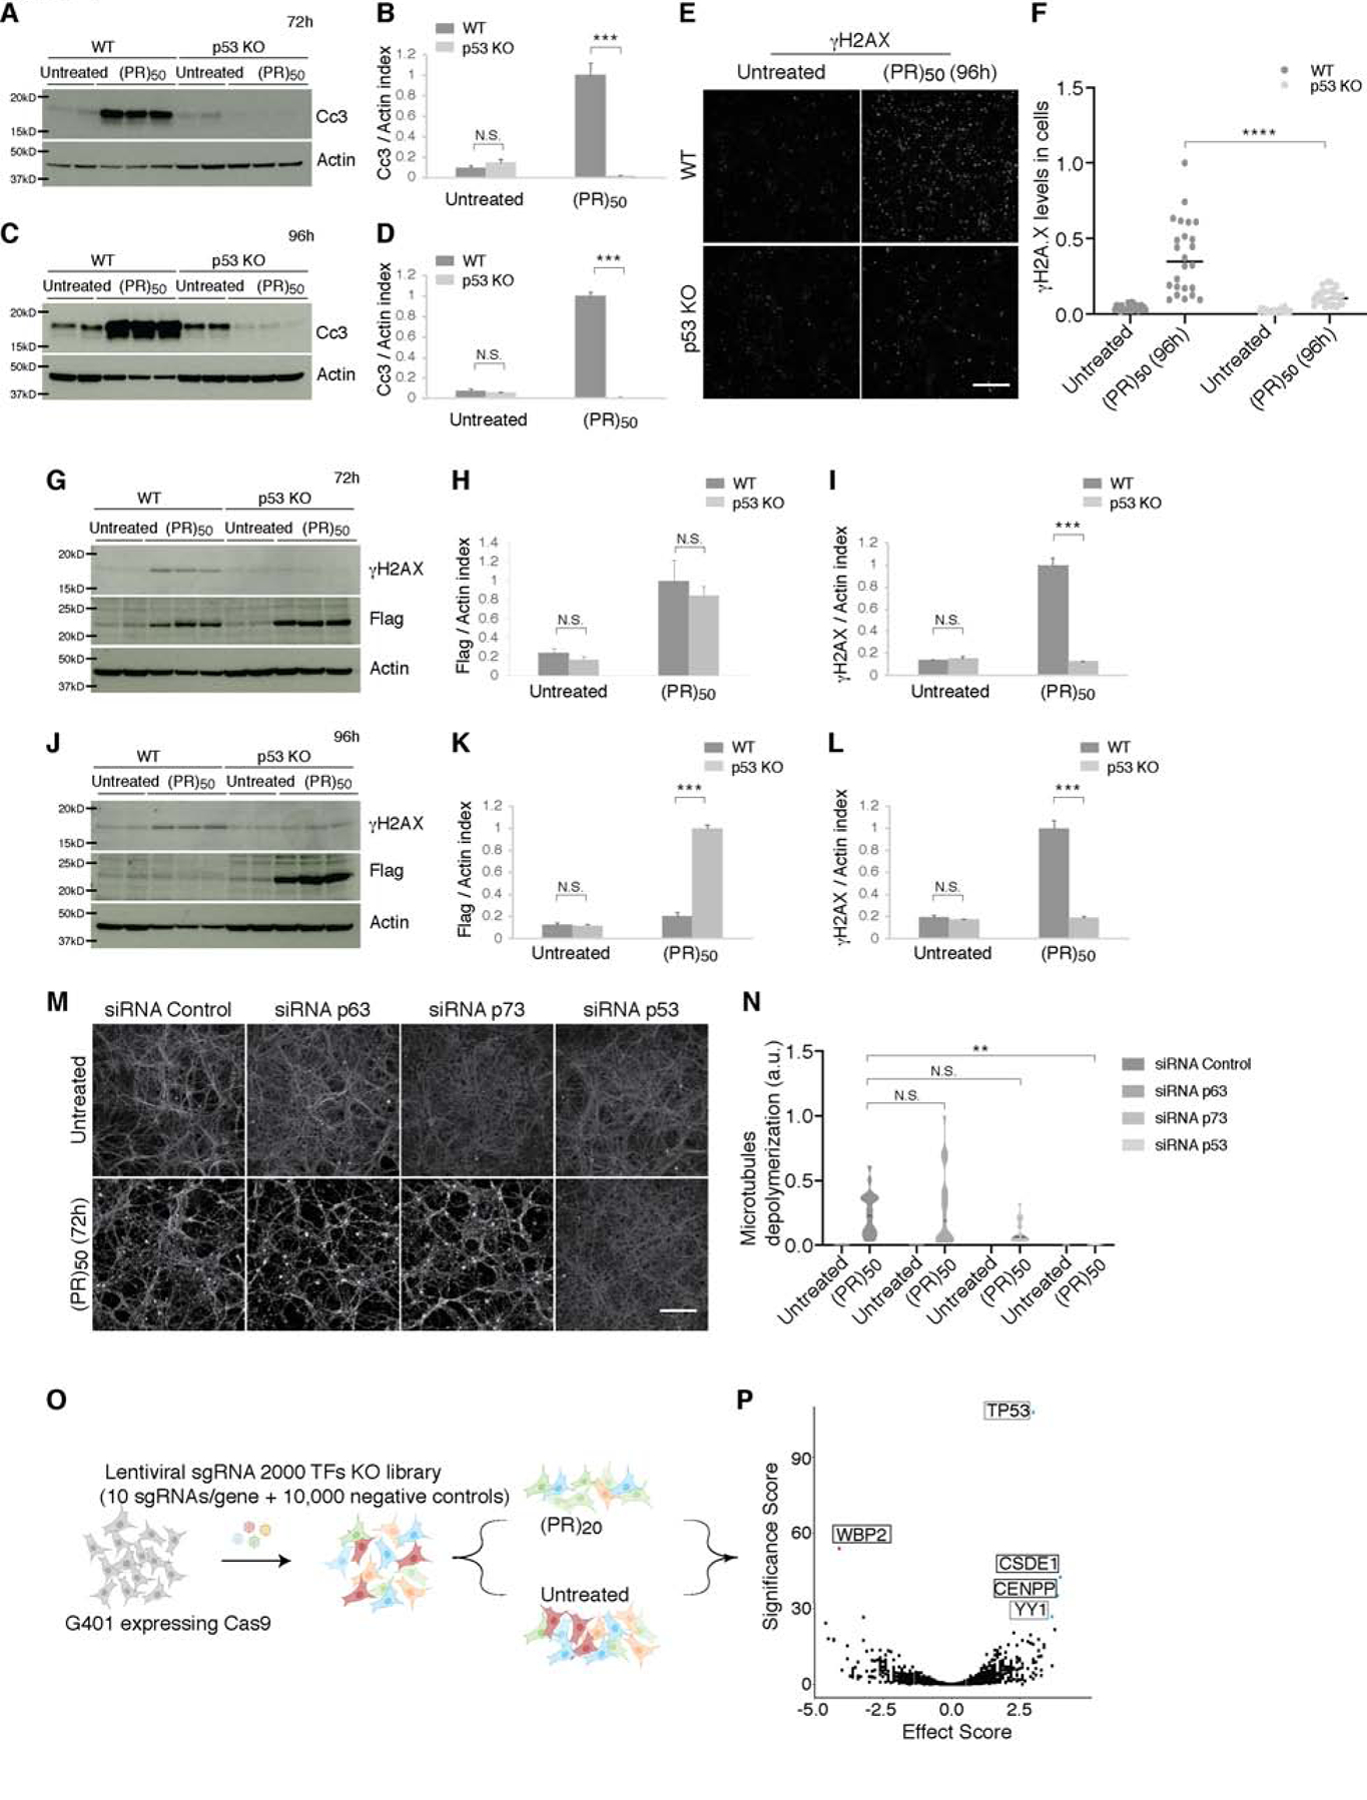
(A–D) WT neurons treated with (PR)50 resulted in enhanced activation (cleavage) of Caspase-3, as evaluated by immunoblot analysis. Genetic ablation of p53 inhibited this activation of Caspase-3. Quantitation of cleaved Caspase-3 was determined by immunoblots and normalized to actin (B and D). Graphs show mean ± SEM (t test; ***p < 0.001, N.S. not significant).
(E–L) Phosphorylated H2AX (γH2AX) levels were elevated after (PR)50 treatment, p53 ablation inhibited this induction at 72h (G and I) and 96h (E–F, J and L). Quantitation of γH2Ax following (PR)50 treatment was determined by immunoblotting and normalized to actin (I and L) and by immunostaining normalized to the number of cells (F). Graphs show mean ± SEM (t test; ***p < 0.001, ****p < 0.0001, N.S. not significant). (G-H) (PR)50 levels were elevated at 72h in both WT and p53 KO of (PR)50 treated neurons. At 96h, (PR)50 was present only at p53 KO and not at WT neurons (J–K), as detected using the anti-Flag antibody.
(M–N) WT cortical neurons treated with siRNA against p53, p63, p73 or non-targeting control siRNA treated with (PR)50. Axonal microtubules (MTs) were depolymerized and degraded after (PR)50 in the non-target control, p63 and p73, yet p53 reduction by siRNA delayed (PR)50 axonal degeneration (M). Quantification shown in (N), as described in the STAR Methods (one-way ANOVA; **p < 0.01, N.S. not significant). Scale bar, 100 μm.
(O–P) Schematic illustration of pooled CRISPR–Cas9 screening paradigm. G401 cells expressing Cas9 were transduced with a lentiviral sgRNA library (ten sgRNAs per gene), treated with (PR)20. Volcano plot for genes in the (PR)20 screen (P). Blue, all genes conferring resistance to (PR)20 when knocked out (1% FDR); red, all genes conferring sensitivity to (PR)20 when knocked out (1% FDR). p53 was the top hit conferring resistance to (PR)20.
DNA fragmentation is a hallmark of apoptosis that is induced by apoptotic stimuli and mediated by the family of caspases. Apoptotic DNA fragmentation induces phosphorylation of H2AX on Ser139. Phosphorylation of H2AX to produce γH2AX is a key event in the repair of DNA damage and the induction of DNA degradation leading to cell death (Kitazumi and Tsukahara, 2011; Rogakou et al., 2000). Consistent with previous findings where ectopic expression of poly(GR) increased γH2AX, the marker of DNA damage (Lopez-Gonzalez et al., 2016), we also detected elevated levels of γH2AX in WT neurons upon (PR)50 treatment. Strikingly, γH2AX induction was markedly reduced in p53 KO neurons (Figure 4E–4G, 4I, 4J and 4L). Beyond C9orf72, DNA damage and defects in DNA damage repair in neurons have been previously implicated in ALS caused by mutations in FUS (Qiu et al., 2014; Wang et al., 2013).
To carefully monitor axonal and cell death we used live cell imaging, coupling the power of time-lapse video microscopy, high definition phase-contrast imaging with automated image processing algorithms tailored here to analyze axonal state and neuronal fate. WT neurons exhibited fragmented axons and smaller diameter soma, reflecting axonal degeneration and cell death following expression of (PR)50 (Figure S4E–S4F). In contrast, p53 KO neurons and axons had no reduction in size nor fragmentation after (PR)50 expression (Figure S4E–S4F). p53 KO neurons and axons degenerated upon TDP-43 expression (Figure S4G–S4H). Taken together, our results show that p53 KO neurons and their axons are completely protected from the toxic effects of (PR)50 but not from TDP-43.
In addition to p53, our chromatin accessibility profiling data also highlighted p63 and p73, since they share similar binding motifs to p53 (Figure 1F and 1G). To test their role in axonal degeneration and cell death in response to (PR)50, we treated primary cortical neurons with either p53, p63, p73 or non-targeting siRNA for 48h before the addition of (PR)50. Whereas p53 knockdown conferred complete protection against axonal degeneration and cell death, p63 or p73 knockdown did not (Figure 4M–4N). Thus, p53 seems to be the key transcription factor mediating (PR)50 toxicity in this system. Interestingly, in a related study p53 (but not p63 or p73) is shown to play a central role in axonal degeneration, during the development of the peripheral nervous system, in dorsal root ganglia (DRG) following trophic deprivation (manuscript from Tessier-Lavigne and Simon submitted to Developmental Cell).
Next, we asked whether p53 reduction can prevent axonal degeneration after (PR)50 is already expressed and the degeneration cascade begins. Reducing p53 levels using siRNA, within the first 24h of (PR)50 expression is protective, and no axonal degeneration can be detected (Figure S5A–S5B). If we add the p53 siRNA after 24h, it is not protective as when added at earlier time points (Figure S5A–S5B). To test whether p53’s role in degeneration caused by (PR)50 is driven primarily by cell autonomous effects within neurons or instead by the non-neuronal cells (e.g., the glia present in the primary cultures), we treated neuronal cultures with FUdR (5-fluoro-2′-deoxyuridine). This drug interferes with DNA synthesis and inhibits cell division, resulting in depletion of glia from the culture, as detected by GFAP immunostaining (Figure S5C). Even in the absence of glia, the p53 KO neurons were protected from (PR)50 -induced degeneration (Figure S5D–S5E). Thus, p53 functions within neurons to mediate degeneration.
In a recent genomewide CRISPR-Cas9 screen for modifiers of C9orf72 DPR toxicity modifiers, we did not identify p53 (Kramer et al., 2018). For that screen we used the human chronic myelogenous leukemia (CML) K562 cell line. This cell line harbors a p53 mutation (Law et al., 1993), and these cells have likely developed p53-independent cell death mechanisms. We therefore repeated the screen in a WT p53 expressing human cell line – using the kidney rhabdoid tumor G401 cell line (Idelman et al., 2003) – screening a sgRNA library targeting ~2000 transcription factors. Remarkably, in this G401 cell line, we found p53 knockout as the strongest suppressor of (PR)50 toxicity (Figure 4O–4P). These results further underscore a central role of p53 in mediating cell death elicited by (PR)50.
p53 ablation extends lifespan in a mouse model of C9orf72 (PR)50
Given the striking resistance of p53 KO neurons to (PR)50 toxicity in vitro we next asked whether p53 ablation could also confer this protection in vivo. We used an adeno associated virus (AAV) vector-based transgenic mouse model engineered to express C9orf72 poly(PR) throughout the brain. These mice develop neuron loss, gliosis, behavioral impairments and early lethality (Zhang et al., 2019). We delivered an AAV vector expressing GFP-tagged (PR)50 via intracerebroventricular administration at postnatal day 0 (Figure 5A). Consistent with the reported toxicity of (PR)50 in this model (Zhang et al., 2019), 95% of WT GFP-(PR)50 expressing mice died by day 39 (Figure 5B, S6A). Knockout of p53 significantly improved lifespan (Logrank test for trend P = 0.0116, hazard ratio (HR) = 2.34), resulting in a 2.5-fold improvement in median lifespan, with several mice surviving more than 150 days (Figure 5B, S6A). Notably, p53 KO mice are highly predisposed to malignancy, reflected in a greatly accelerated rate of tumorigenesis compared with heterozygous or WT mice (Jacks et al., 1994). By 3 months they start developing tumors and by 6 months almost all KO mice had died (Jacks et al., 1994). Consistent with these findings, the p53 KO mice expressing (PR)50, starting from 3 months of age had died or had to be sacrificed as obvious tumors were detected (Figure 5B, S6B). This suggests that the 2.5-fold improvement in lifespan might actually be an underestimate of the ability of p53 KO to protect against (PR)50 -induced early lethality. Even heterozygous reduction of p53 conferred partial rescue of GFP-(PR)50 toxicity (Figure 5B). Thus, genetic reduction of p53 is sufficient to extend survival in an aggressive mouse model of neurodegeneration caused by C9orf72 (PR)50.
Figure 5. p53 ablation extends lifespan in C9orf72 (PR)50 mice.
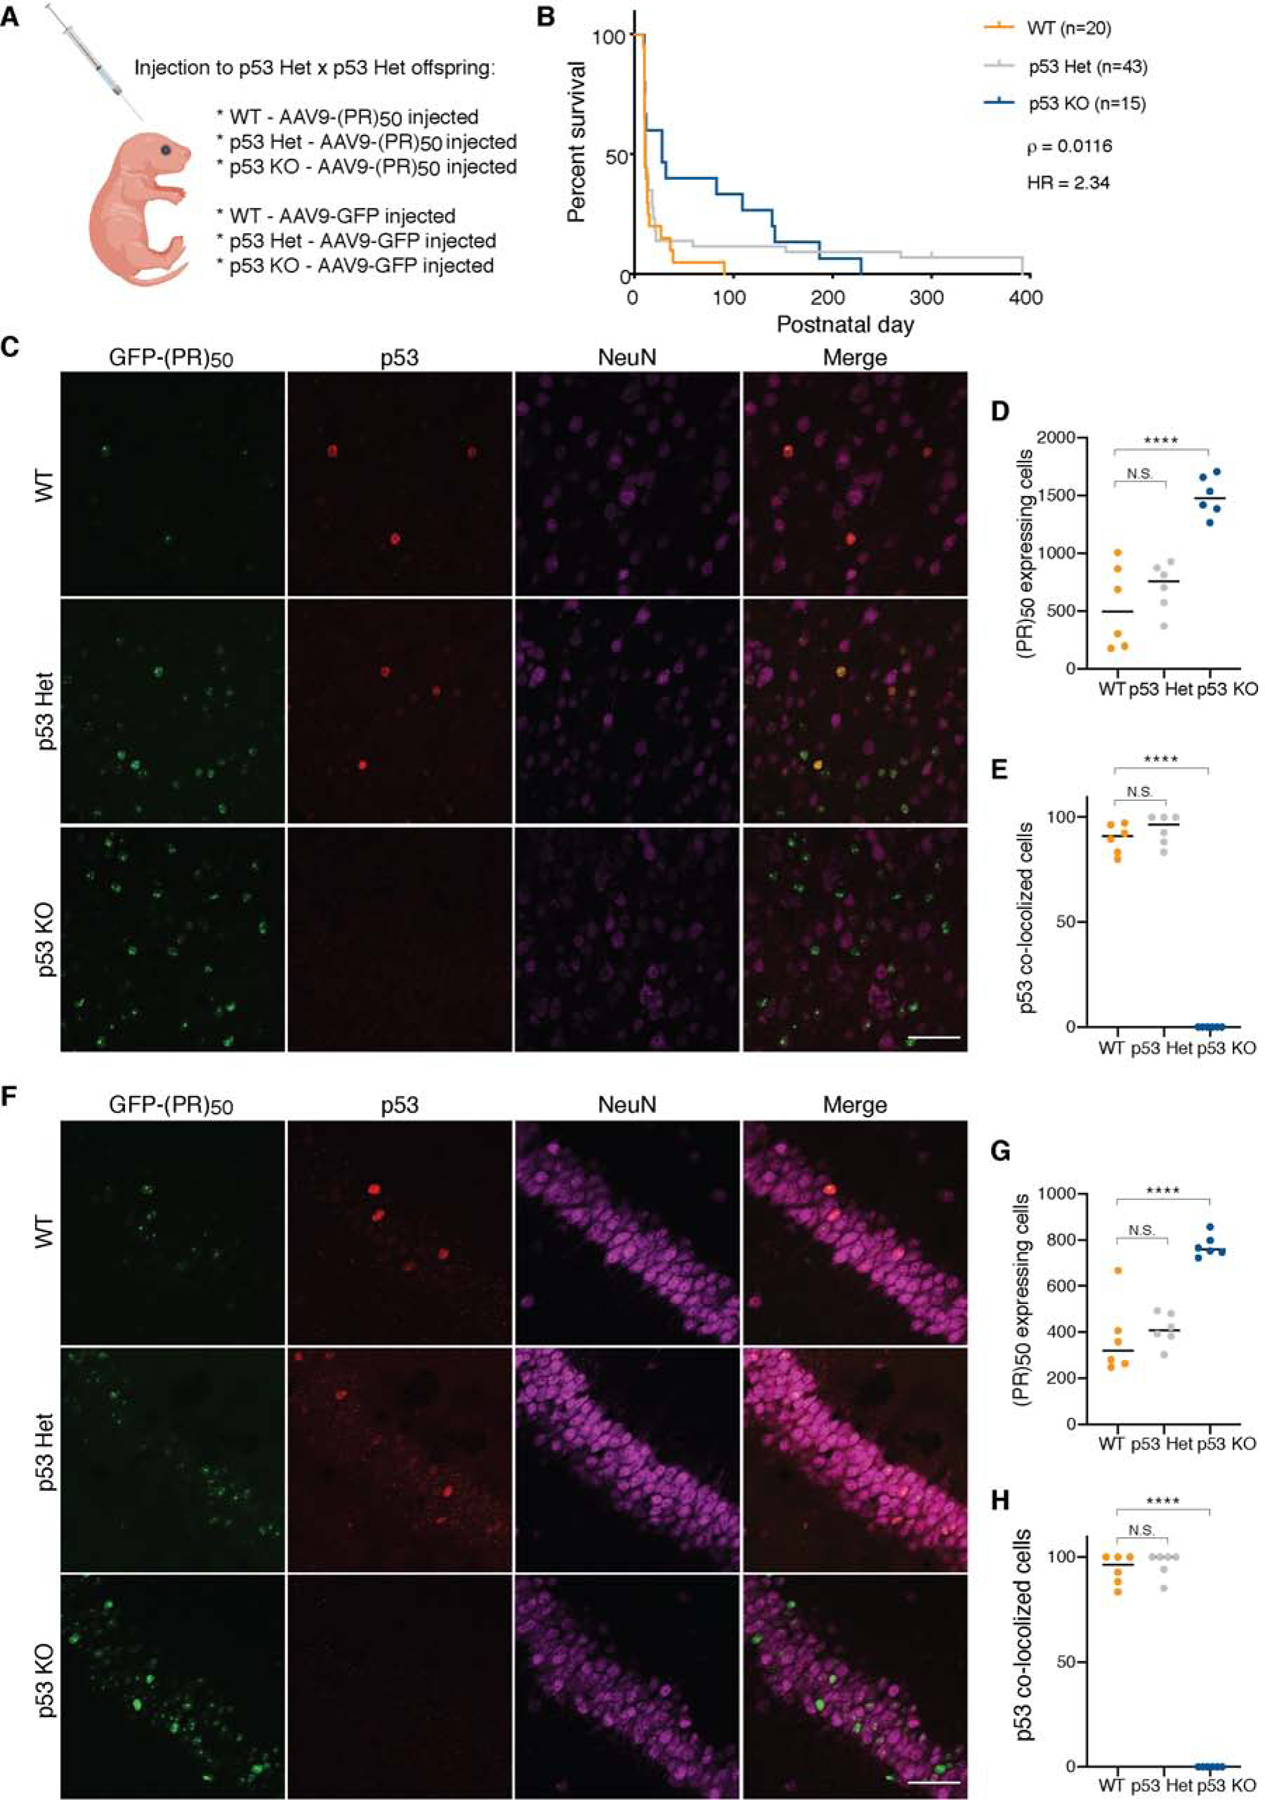
(A–B) Schematic illustration of the experimental design. newborn pups from p53 heterozygous x heterozygous crosses were injected intracerebroventricularly (ICV) with AAV encoding GFP-(PR)50 or GFP (A). Kaplan-Meier survival curves comparing survival of WT (n = 20), p53 heterozygous (n=43) and p53 KO (n=15) GFP-(PR)50 expressing mice (B). p53 KO GFP-(PR)50 expressing mice showed a 2.5-fold improvement in life span compared to WT mice. Curves were compared by log rank test and effect size was estimated by a Cox proportional hazards model (HR).
(C–H) Immunofluorescence staining of WT, p53 Het and KO 3-week-old mice show p53 activation and colocalization with GFP-(PR)50 in the cortex (C-E) and in the hippocampus (F-H) of WT mice. Three mice per genotype and condition were quantified as described in the STAR Methods, from a 10x magnification (representative pictures in Figure S6H). The values for p53 colocalization (E and H) and (PR)50 expressing cell numbers (D and G) for individual brain hemisphere sections are plotted (one-way ANOVA; **** p < 0.0001, N.S. not significant). Scale bars, 50 μm.
To test whether reducing p53 levels can rescue neurodegenerative phenotypes caused by TDP-43 accumulation in vivo, we used a genetic approach. We choose a mouse line expressing human wild type (WT) TDP-43 that displays a rapidly progressing phenotype (Wils et al., 2010). Homozygous mice harboring two copies of this TDP-43 transgene display profound motor dysfunction, resulting in an inability to walk around P21 and death around P24 (Wils et al., 2010). We crossed TDP-43 hemizygous mice with p53 heterozygous mice to produce TDP-43 hemizygous with p53 heterozygous offspring and then intercrossed these mice to produce TDP-43 homozygous p53 KO, Het or WT littermates. Decreased levels of p53 in TDP-43 homozygous transgenic mice did not improve their lifespan, nor did the complete removal of p53, (Logrank test for trend P = 0.95, hazard ratio (HR) = 1.03, Figure S6C). Thus, like the in vitro results, p53 knockout does not protect against TDP-43 in vivo in this transgenic mouse. We note that a previous study observed protection from mutant TDP-43-induced death of neural progenitors in p53 knockout embryos compared to WT embryos and in human iPS-derived cortical neurons (Vogt et al., 2018). It will be interesting to compare and contrast cell death pathways that are active in the embryo and adult and the role of p53 in activating these pathways in response to TDP-43.
To investigate p53 levels in the C9orf72 (PR)50 mouse model in vivo, we used immunostaining with a p53-specific antibody (Figure 5C, 5F, S4A and S6D–S6H). We detected strong induction of p53 in neurons in the cortex and hippocampus of GFP-(PR)50 expressing WT mice, at 3 weeks (Figure 5C–5D, 5F–5G and S6F–S6H). In contrast, we did not detect p53 in p53 KO mice (which perforce eliminates p53 expression) expressing GFP-(PR)50 nor in WT mice expressing GFP (Figure 5C–5D, 5F–5G and S6F–S6H). p53 was almost exclusively co-localized with GFP-(PR)50 in neurons of both hippocampus and cortex (94% and 90% respectively) (Figure 5C, 5E, 5F, 5H and S6H). Consistent with our in vitro findings (Figure 4J–4K), we observed a marked increase in the number of cells expressing (PR)50 in the cortex and hippocampus in p53 KO compared to WT mice (Figure 5C–5D, 5F–5G and S6D–S6H). Thus, (PR)50 is able to accumulate to high levels in the brain of p53 KO mice because they are resistant to its toxicity. These results may help explain why in human postmortem samples, levels of poly(PR) are scarce (Davidson et al., 2014; Mackenzie et al., 2015; Schludi et al., 2015); it appears it is so highly toxic that it cannot accumulate to high levels unless its toxicity is blocked – for example, by p53 inhibition.
p53 reduction rescues degeneration caused by the C9orf72 GGGGCC repeat expansion
The C9orf72 GGGGCC repeat expansion could cause disease by multiple mechanisms beyond just poly(PR) and poly(GR). For example, the other DPRs produced from the repeat by RAN translation (poly(GA), poly(GP), and poly(PA)) as well as the sense (GGGGCC) and antisense (GGCCCC) RNAs themselves could also be culprits (Gitler and Tsuiji, 2016; Kim et al., 2020). To test if p53 ablation could rescue phenotypes from expression of the expanded GGGGCC repeat itself, we first used a Drosophila model of C9-ALS/FTD (Xu et al., 2013; Zhang et al., 2015). We used the UAS/GAL4 system to direct expression of 30 GGGGCC repeats to the Drosophila eye (Figure 6A). Upregulation of 30 GGGGCC repeats in the Drosophila eye causes age-dependent photoreceptor degeneration, leading to an easily visible “rough” eye phenotype (Figure 6A and (Xu et al., 2013)). We used three different RNAi lines to knockdown Drosophila p53. These RNAi lines have been previously characterized (Ni et al., 2011; Periz et al., 2015; Zhaunova et al., 2016) and demonstrated to reduce p53 protein level (Periz et al., 2015). All three of these RNAi lines significantly suppressed this C9orf72 GGGGCC repeat eye phenotype (Figure 6A–6B). These data provide evidence that p53 reduction is also able to mitigate phenotypes from the GGGGCC repeat expansion itself.
Figure 6. p53 reduction modifies neurodegeneration in C9-ALS models.
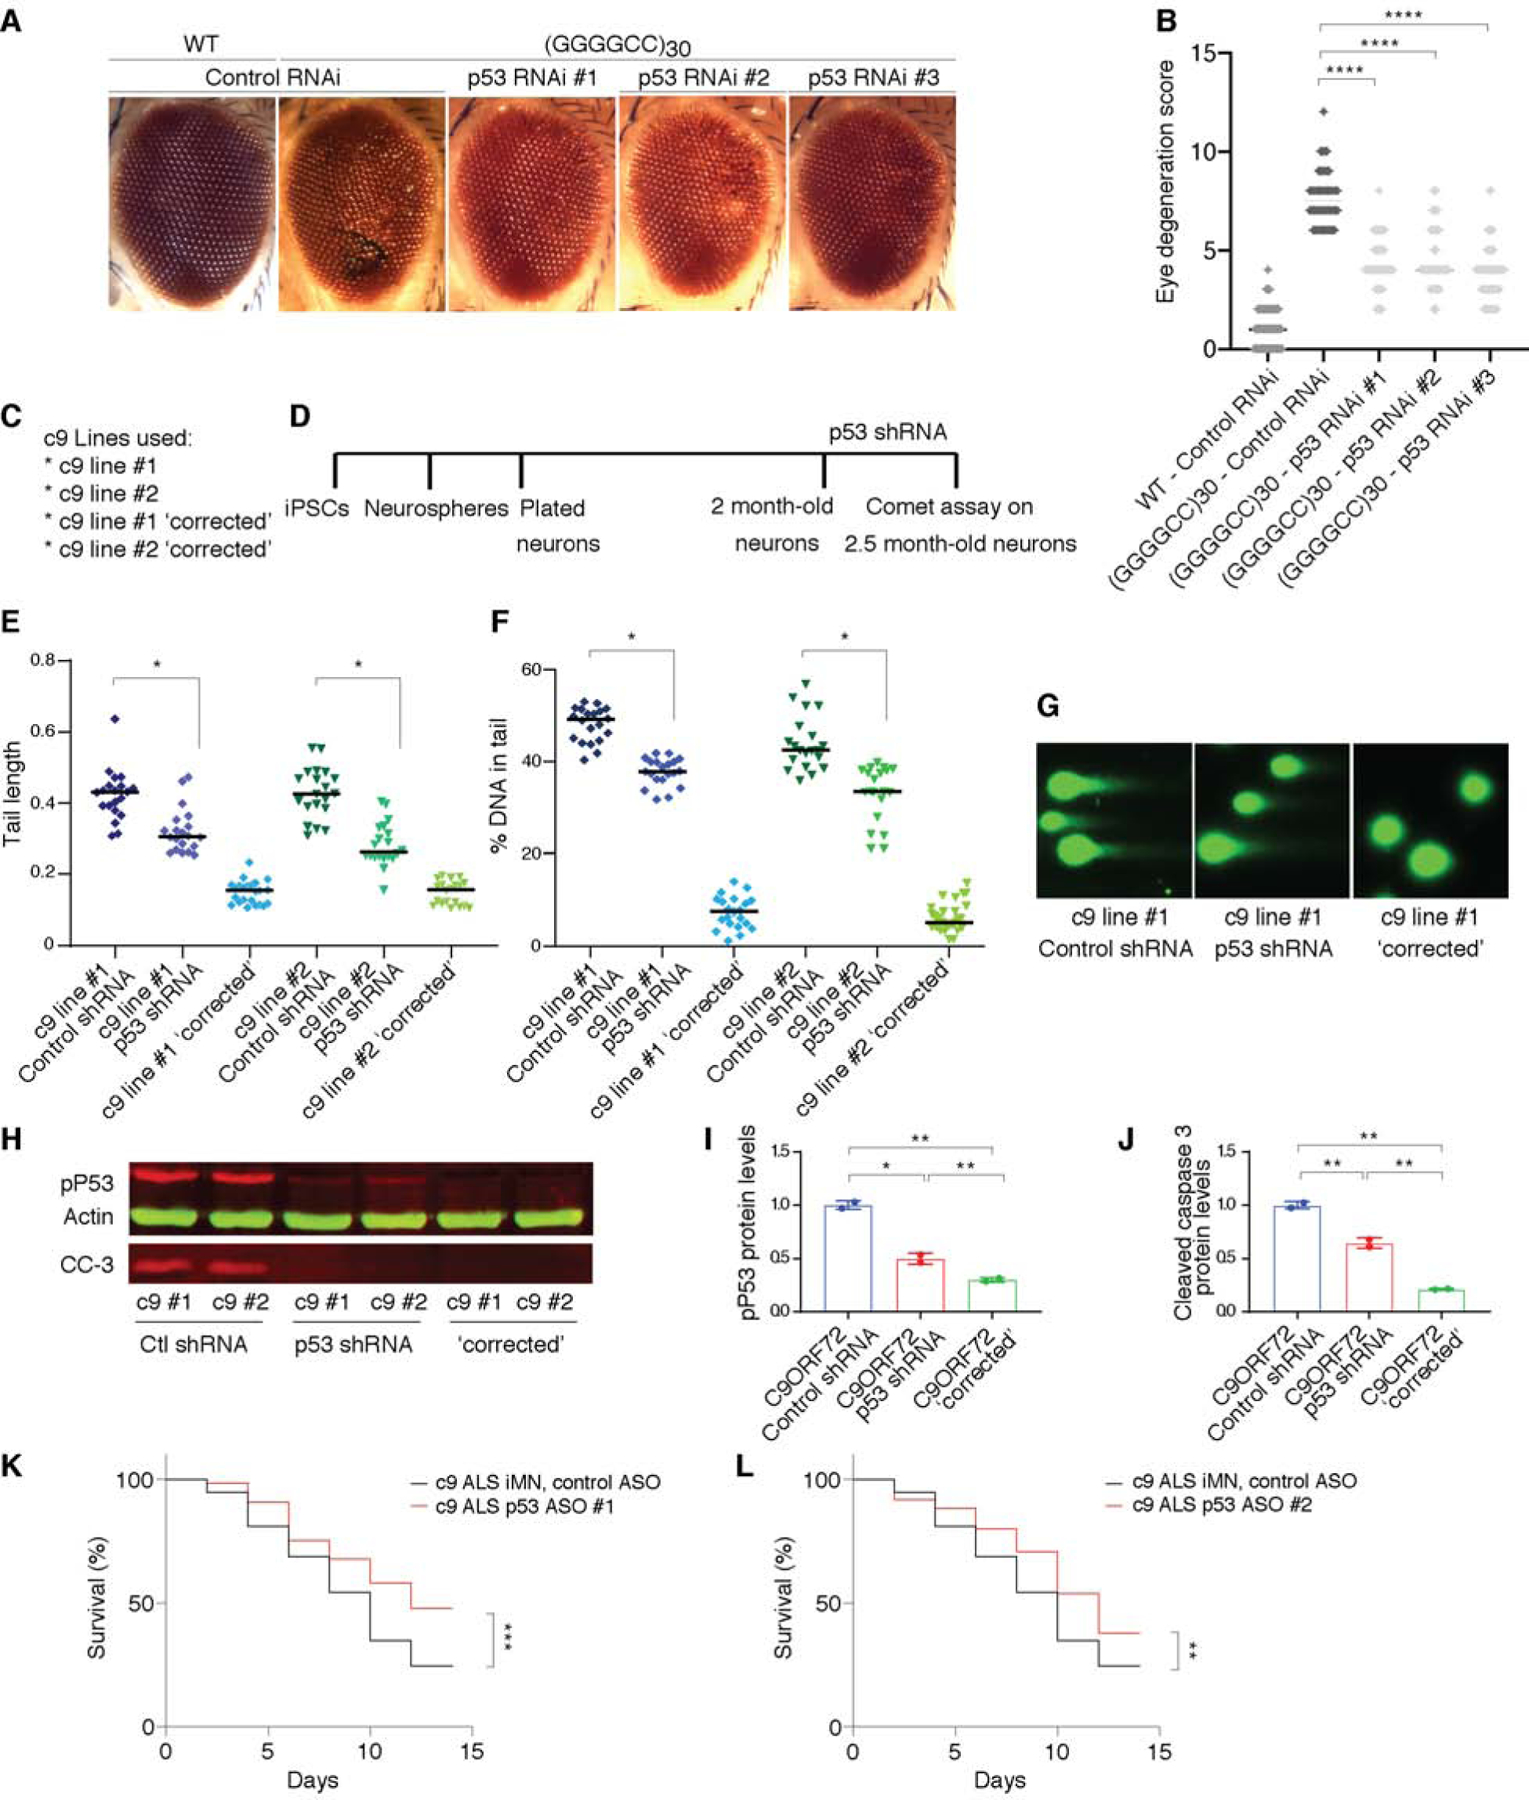
(A) Representative images of 15-day old fly eyes expressing 30 GGGGCC repeats (using GMR-GAL4) with RNAi to knockdown p53, genetically knocking down 3 RNAi lines (line #1 P{TRiP.GL01032}attP2, line#2 P{TRiP.GL01220}attP40 and line#3 P{TRiP.HMS02286}attP2). Eye degeneration quantified in (B). All data are presented as mean ± s.d. n=50, (one-way ANOVA; **** p < 0.0001, N.S. not significant).
(C–G) Comet assay analysis after p53 knockdown in iPSC-derived motor neurons from C9orf72 mutation carriers.
(C) The iPSC-derived motor neuron lines used here, differentiated from two independent C9orf72 mutation carriers and their respective isogenic controls (c9 ‘corrected’), where repeats were deleted by CRISPR-Cas9.
(D) Schematic diagram of the motor neuron differentiation and the shRNA lentivirus transduction. Representative images of the comet assay (G), the quantification of comet length tail (E) and percentage of DNA in the tail (E) in 2.5 month motor neuron cultures (D) from two independent C9ORF72 lines and their respective isogenic controls (t test; * p <0.01).
(H–J) p53 shRNA lentiviral transduction decreases phosphorylated p53 and cleaved Caspase 3 levels in iPSC-derived neurons differentiated from two independent C9orf72 mutation carriers. Quantification of phosphorylated p53 (I) and cleaved caspase 3 (J) levels following p53 shRNA treatments was determined by immunoblotting and normalized to actin. Graphs show mean ± SEM (t test; * p <0.05, ** p <0.01).
(K–L) Knockdown of p53 with ASOs extends survival of C9ORF72 ALS (c9 ALS) iMNs (log rank Mantel-Cox test; n=3 independent iMN lines with n=195 iMNs per condition per treatment; **P < 0.01,***P < 0.001).
To investigate if p53 is involved in the pathogenesis of the C9orf72 GGGGCC repeat expansion in a human model, we used induced pluripotent stem cells (iPSC) derived from C9orf72 ALS patients. DNA damage is increased in motor neurons differentiated from iPSCs of C9orf72 ALS patients (Lopez-Gonzalez et al., 2016). To determine whether the observed increase in DNA damage is p53-dependent, we analyzed the extent of DNA strand breaks by comet assay (Figure 6C–6G). We used two independent C9orf72 iPSC lines and their respective isogenic controls, where the repeats were excised by CRISPR/Cas9 editing (Figure 6C–6D). Partial reduction of p53 (Figure S7A–S7B and 6C–6D), using shRNA, decreased DNA damage in C9orf72 iPSC-derived motor neurons as indicated by the reduction in the relative tail length and in the percentage of DNA in the tail (Figure 6E–6G). We performed immunoblotting of lysates from the two independent C9orf72 iPSC-derived neurons and their isogenic controls. p53 is phosphorylated on serine 15 and activated in C9orf72 iPSC-derived neurons (Figure 6H–6J) and the apoptotic marker cleaved caspase 3 is induced. Lowering p53 levels using shRNA was sufficient to decrease the accumulation of phosphorylated p53 and cleaved caspase 3 levels (Figure 6H–6J). Taken together, p53 is activated in C9orf72 iPSC-derived neurons, inducing DNA damage and the apoptotic machinery.
Finally, we tested the impact of lowering p53 levels on survival phenotypes in motor neurons induced from iPSCs from ALS patients with C9orf72 GGGGCC expansions (iMNs) (Shi et al., 2018). As reported previously, in this in vitro culture system, even in the presence of trophic factors, both control and c9ALS iMNs exhibit decreased survival over time in culture (Shi et al., 2018). However, the c9ALS patient iMNs died more rapidly than the control iMNs (Shi et al., 2018; Yamada et al., 2019) (Figure S7D). We tested two independent antisense oligonucleotides (ASOs) that targeted p53 and one non-targeting control ASO (Figure S7C). Both p53 ASOs markedly increased the proportion of surviving iMNs in the c9ALS lines (Figure 6K–6L) but did not increase survival of control iMNs (Figure S7E and S7F). These results provide further evidence for a role of p53 in pathologies associated with the C9orf72 GGGGCC repeat expansion. We note that the protection by lowering p53 in the iPSC-derived motor neurons is not complete, like it was for the p53 knockout in the primary mouse neurons treated with poly(PR), suggesting that other disease-causing mechanisms might also contribute to decreased survival in these c9ALS iMNs (e.g., loss of C9orf72 function (Shi et al., 2018) and/or contributions from potentially toxic RNA repeats (Coyne et al., 2020).
Puma is a downstream p53 transcriptional target that mediates axonal degeneration and cell death induced by C9orf72 (PR)50
Having established that p53 is activated by expression of C9orf72 DPRs (PR)50 and (GR)50, and that this leads to the activation of a p53-dependent transcriptional program culminating in neurodegeneration, we next investigated the downstream mechanism by which p53 mediates (PR)50 toxicity. We hypothesized that in response to poly(PR) accumulation, p53 target genes mediating axonal degeneration and cell death would be upregulated. In the mouse primary neuron model, after 40h of (PR)50 expression, p53 upregulated modulator of apoptosis (Puma) was the second most upregulated gene after cyclin dependent kinase inhibitor 1A (Cdkn1a) (Figure 7A). Both Puma and Cdkn1a are known to be tightly regulated by p53 (el-Deiry et al., 1993; Han et al., 2001; Nakano and Vousden, 2001; Yu et al., 2001). Consistent with the elevated transcription levels, we identified an enrichment in ATAC-seq peaks, representing open chromatin regions, near the Puma transcriptional start site (Figure 7B), which correspond to the p53 binding sites. Based on these Puma chromatin accessibility data and increased Puma mRNA levels, together with the fact that Puma is a key player in axonal elimination during development of the peripheral nervous system (Maor-Nof et al., 2016; Simon et al., 2016), and that it has a broad role mediating p53-induced cell death (Han et al., 2001; Nakano and Vousden, 2001; Yu et al., 2001), we hypothesized that Puma may play a central role in mediating p53’s response to C9orf72 (PR)50.
Figure 7. Puma ablation protects neurons from C9orf72 (PR)50 induced cell death and axonal degeneration.
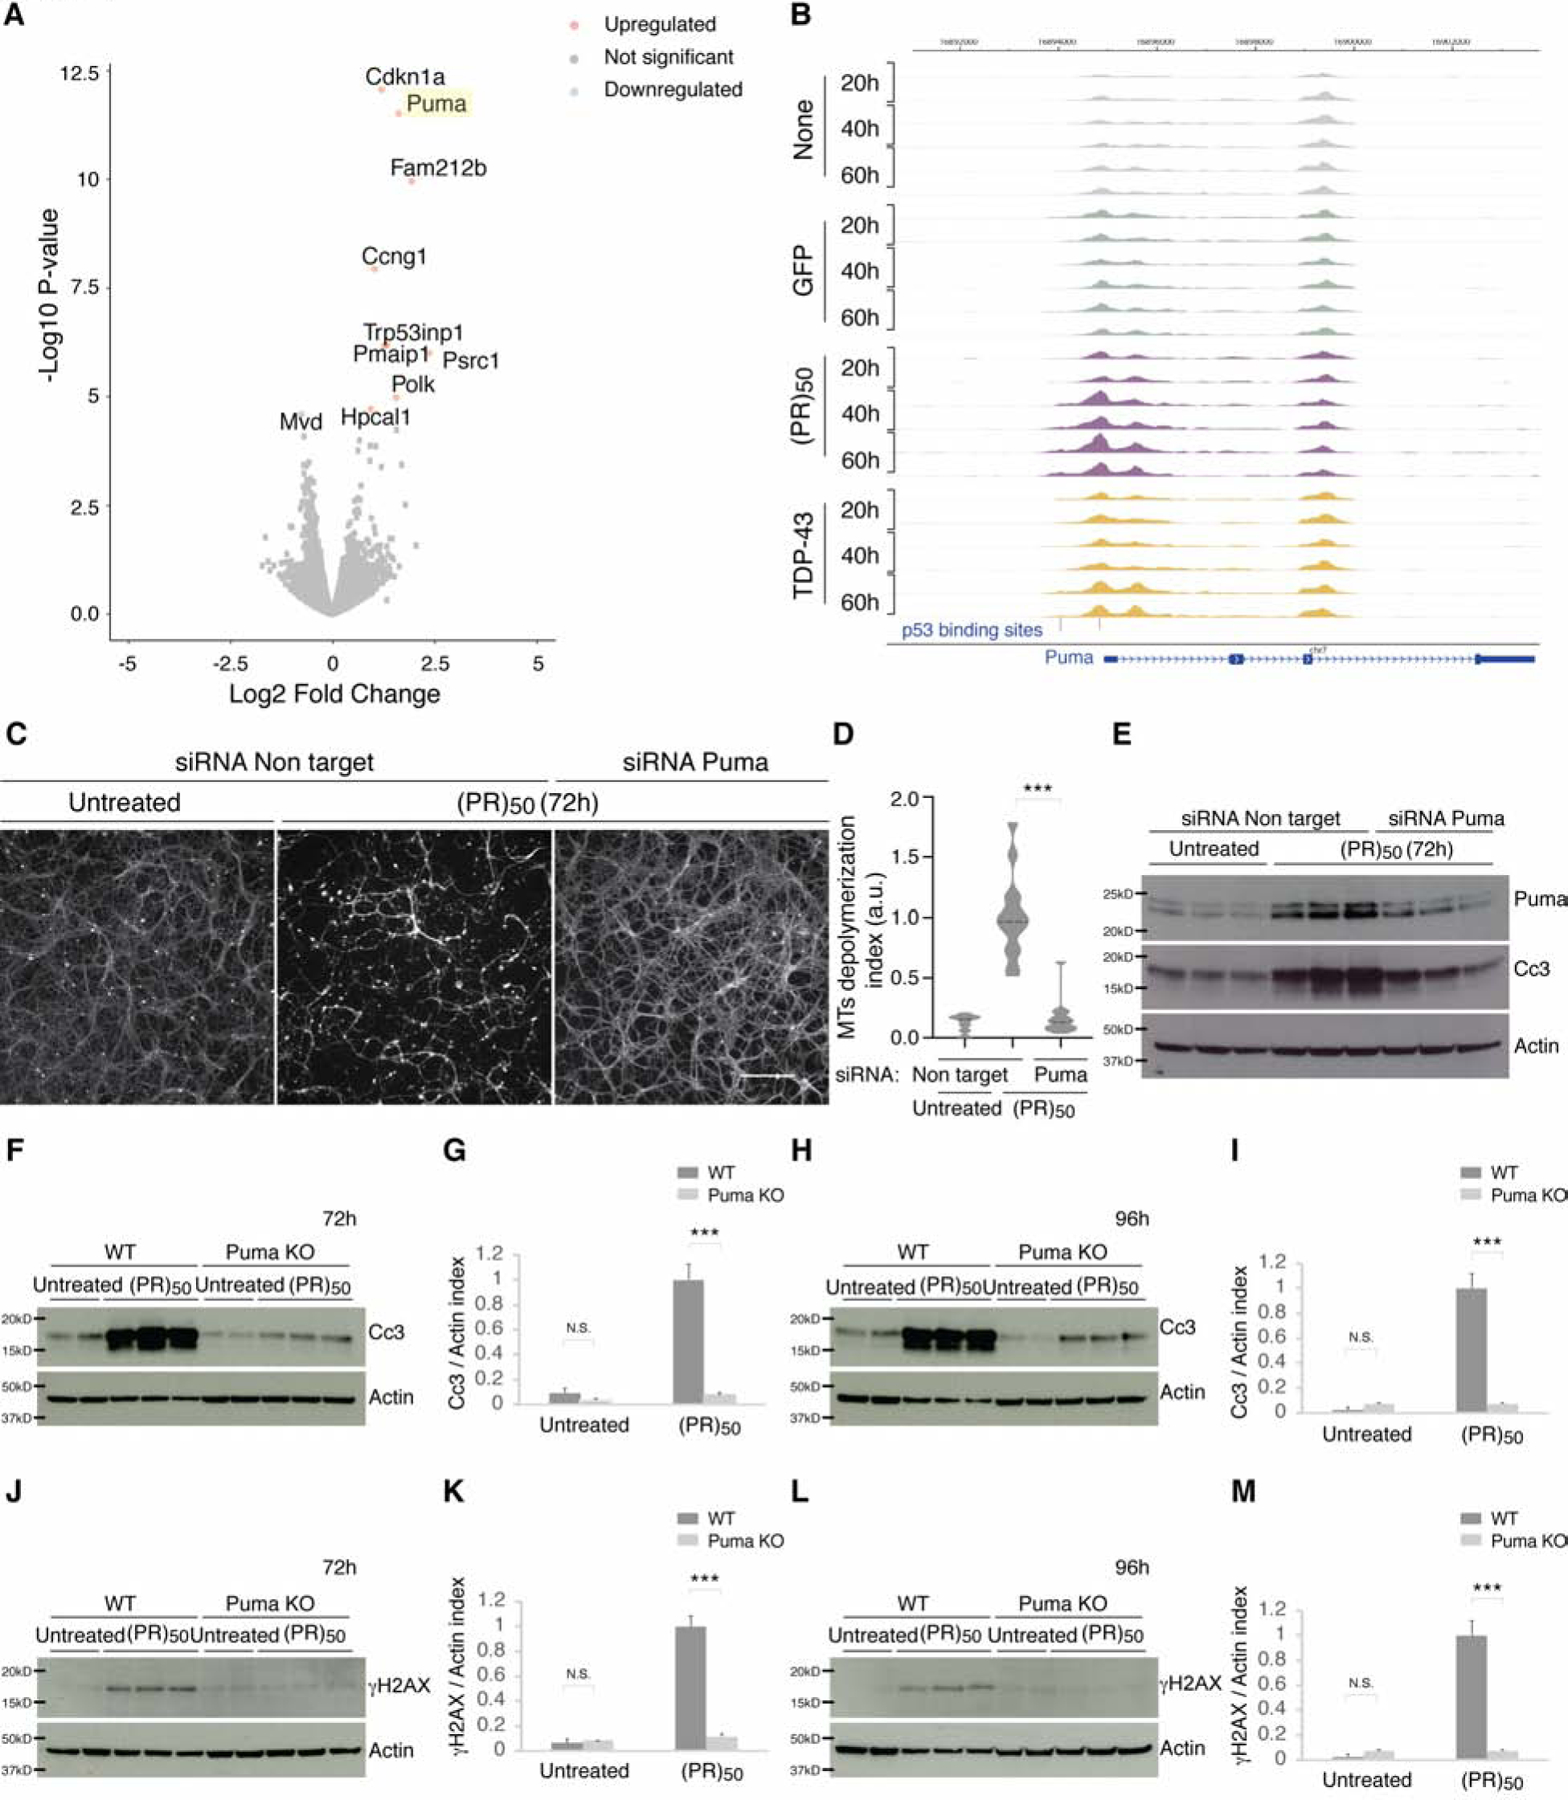
(A) Volcano plot of RNAseq results from C9orf72 (PR)50 vs GFP treated neurons at 40h post treatment.
(B) Normalized ATAC-seq tracks at the Puma locus of neurons untreated or treated with GFP, (PR)50 or TDP-43 at 20h, 40h and 60h.
(C–E) Cortical neurons were treated with siRNA against Puma or non-targeting control siRNA. Neurons were then treated with (PR)50 for or left untreated. (PR)50 induced degeneration in the non-targeting control treated neurons (C) and activated cleaved Caspase-3 (E). Puma reduction by siRNA (D) delayed (PR)50 axonal degeneration (C) and delayed cleaved Caspase-3 activation (D). The extent of microtubule depolymerization (mean index) was calculated for each condition (D), as described in the STAR Methods (t test; ***p < 0.001). Scale bar, 100 μm.
(F–I) Cortical neurons from Puma KO embryos or their WT littermates were left untreated or treated with C9orf72 (PR)50 for 72h (F-G) or 96h (H-I). WT neurons treated with (PR)50 resulted in increased cleaved Caspase-3, which was reduced in the Puma knockout neurons. Quantification of cleaved Caspase-3 following (PR)50 treatment was determined by immunoblotting and normalized to actin (G and I). Graphs show mean ± SEM (t test; ***p < 0.001, N.S. not significant).
(J–M) Cortical neurons from Puma KO embryos or their WT littermates were cultured for 3 days and either left untreated or treated with C9orf72 (PR)50 for additional 72h (J-K) or 96h (L-M). γH2AX levels were elevated after (PR)50 treatment, Puma ablation inhibited this induction at 72h (J-K) and 96h (L-M). Quantification of γH2AX following (PR)50 treatment was determined by immunoblotting and normalized to actin (K and M). Graphs show mean ± SEM (t test; ***p < 0.001, N.S. not significant).
To test a role of Puma in axonal degeneration and cell death in response to C9orf72 (PR)50 we treated primary cortical neurons with either Puma or non-targeting siRNA for 48h before the addition of (PR)50. Decreased levels of Puma significantly delayed axonal degeneration (Figure 7C–7E). Complete removal of Puma, using cortical neurons cultured from Puma KO mice, conferred even greater protection (Figure 7F–7M). Puma ablation attenuated neuronal cell death as measured by the apoptotic marker cleaved caspase-3 (Figure 7F–7I). Further, Puma ablation prevented the induction of γH2AX caused by (PR)50 expression (Figure 7J–7M). Finally, Puma KO neurons were preserved from axonal fragmentation even after 120h of (PR)50 expression, as detected by live cell imaging (Figure S4I–S4J). Together, these data provide evidence that Puma is at least one of the key downstream p53 targets involved in axonal degeneration and cell death induced by C9orf72 (PR)50.
Discussion
How does C9orf72 (PR)50 lead to p53 activation? One way that poly(PR) accumulation might cause p53 activation in neurons is by eliciting DNA damage. We observe DNA damage in (PR)50-treated neurons, but curiously it seems to be downstream of p53 (Figure 4E–4G, 4I, 4J and 4L) and Puma (Figure 7J–7M), instead of upstream. We also show that DNA damage in motor neurons differentiated from iPSCs of C9orf72 ALS patients is mediated by p53 (Figure 6E–6G). (PR)50 activates p53 leading to Puma upregulation. Puma has been previously shown to localize to mitochondria where it induces cytochrome c release, leading to a cascade of cleaved caspases and endonuclease activation resulting in DNA fragmentation. Another potential mechanism by which poly(PR) accumulation could activate p53 is via nucleolar stress, a known trigger of p53 activation (Deisenroth et al., 2016; Yang et al., 2018). It has been shown that poly(PR) can cause defects in the nucleolus (Kwon et al., 2014; Tao et al., 2015; Wen et al., 2014; White et al., 2019). Future studies will be aimed at defining the key upstream triggers of p53 activation elicited by C9orf72 mutations.
p53 was discovered 40 years ago, it is one of the most extensively studied genes (Levine and Oren, 2009) and it has previously been implicated in neurodegeneration. A significant increase in p53 levels and activity were detected in postmortem CNS tissues of patients with ALS as well as in other neurodegenerative diseases, including Alzheimer disease, Parkinson disease and Huntington disease (Bae et al., 2005; de la Monte et al., 1997; Kitamura et al., 1997; Szybinska and Lesniak, 2017). In ALS, elevated levels of p53 were found in the motor cortex and spinal ventral horn (de la Monte et al., 1998). This increase occurs in regions that are selectively vulnerable to the disease and harbor motor neurons (Martin, 2000). In ALS, expression of mutant SOD1 protein (G93A) or C9orf72 repeat expansions induce DNA damage and trigger the apoptotic response by activating p53 (Barbosa et al., 2010; Farg et al., 2017; Lopez-Gonzalez et al., 2016; Lopez-Gonzalez et al., 2019). Additional studies suggest that in ALS, motor neurons undergo an apoptotic mode of cell death (Akizuki et al., 2013; Eve et al., 2007; Martin, 2007; Ranganathan and Bowser, 2010; Sathasivam et al., 2001). Yet, this notion has also been challenged based on negative results and recently a form of programmed cell death termed “necroptosis” - programmed necrosis, was suggested to drive degeneration in ALS (He and Strong, 2000; Ito et al., 2016; Re et al., 2014; Yamazaki et al., 2005). Interestingly, ablating p53 in the SOD1 G93A transgenic mouse model had no statistically significant effect on disease onset, survival, or the extent of motor neuron degeneration (Kuntz et al., 2000). In addition, a recent study suggested that p53 plays a role in protein quality control, regulating clearance of mutant SOD1 and C9orf72 DPRs (Lu et al., 2019). Given the extensive past research, it is surprising that there is no clear and simple answer to the question of what p53 does and whether it is a primary cause driving degeneration in ALS or rather a consequence of the degenerative process. We now provide evidence that not only is p53 robustly stabilized and activates a transcriptional program in response to C9orf72 poly(PR), but that it is also required for neurodegeneration in vitro and in vivo. The ability of p53 reduction to rescue C9orf72 mouse and fly models as well as iPSC motor neurons derived from C9orf72 ALS patients, suggests that p53 is one of the drivers of neurodegeneration caused by C9orf72 mutations.
It is unlikely that activating p53 per se is sufficient to cause neurodegeneration. Because p53 is functionally inactivated in many human cancers there has been interest in strategies to boost p53 levels or restore p53 activity to tumors as a cancer therapy. One way to do this is to inhibit MDM2, a negative regulator of p53 (Kubbutat et al., 1997). But it might be dangerous to boost p53 levels in non tumor cells, especially in tissues that are particularly sensitive to radiation and p53-induced apoptosis, like the intestinal crypts and thymus (Lowe et al., 1993; Potten et al., 1997). Indeed, using a genetic approach in mouse to restore p53 in the absence of MDM2 caused rapid cell death in thymus and gut epithelia (Ringshausen et al., 2006). Other approaches to increase p53 levels or activity resulted in diverse phenotypes ranging from developmental defects to embryonic lethality (Moyer et al., 2017; Van Nostrand and Attardi, 2014). Small molecule approaches to target the MDM2/p53 interaction is another way to boost p53 levels. Two such inhibitors, Nutlin-3 (Vassilev et al., 2004) and MI-219 (Shangary and Wang, 2009) show selective toxicity to tumors. Importantly, results from both the genetic and chemical approaches suggest that systemic activation of p53 does not cause neurodegeneration in these animal models. Likewise, the consequence of systemic p53 activation has been analyzed in humans; both directly (e.g., whole-body irradiation, DNA-damage inducing chemotherapeutics) and indirectly (by participating in clinical trials of MDM2/p53 small molecule inhibitors) and so far there is no direct evidence for it causing or increasing risk of ALS or FTD. Therefore, additional factors activated by C9orf72 mutations may collaborate with p53 to drive neurodegeneration. Yet other TFs might work together with p53 or even independently to mediate C9orf72 poly(PR) toxicity. Future efforts will focus on resolving the role of additional factors in collaborating with p53 to mediate C9orf72 poly(PR) toxicity and how this collaboration converges on the genome to activate transcription that result in neuronal cell death.
The surprising ability of p53 ablation to protect neurons from the toxic effects of C9orf72 mutations – conferring complete protection in vitro from poly(PR) and partial protection from poly(GR) even after long term culture, and a >2.5-fold extension in lifespan in vivo from poly(PR) is intriguing. But is it reasonable to even consider p53 as a therapeutic target for ALS, given its important role as a tumor suppressor? There could be other ways to target p53’s function in neurodegeneration without completely disabling its important activities (for example, (Brady et al., 2011), which uncoupled p53’s function in DNA damage repair from its function in tumor suppression). A vast number of post-translational modifications and interaction partners modulate p53 levels and activity. p53 is extensively modified by phosphorylation, acetylation, methylation, ubiquitylation, sumoylation and neddylation (Boehme and Blattner, 2009; Meek and Anderson, 2009). The identification of the precise p53 modification profile in ALS will provide insights into the mechanism of p53 activity and its possible regulators and may suggest ways to target those modifications as a more specific therapeutic approach. Another approach could be to target the downstream effectors of p53-mediated neurodegeneration. We have identified at least one of these – Puma, which we show here to mediate p53-induced neurodegeneration caused by C9orf72 (PR)50. In contrast to p53, Puma knockout mice are not inherently predisposed to develop spontaneous tumors (Jeffers et al., 2003; Valente et al., 2013; Villunger et al., 2003), raising the possibility of Puma-focused therapeutics.
Our application of genome-wide chromatin accessibility profiling on primary neurons has revealed a distinct and progressive signature of TF occupancy caused by C9orf72 (PR)50 that differs from TDP-43. This platform can be applied not only towards better understanding of molecular changes in ALS but can also be extended to other neurodegenerative diseases. A common feature to this heterogenous group of disorders is the accumulation of protein aggregates and the death of neurons affecting different parts of the CNS. This approach should provide insight into chromatin regulation, transcription factor binding and epigenetic alterations that may underpin these neurodegenerative diseases.
STAR+METHODS
RESOURCE AVAILABILITY
Lead Contact
Further information and requests for resources and reagents should be directed to and will be fulfilled by the Lead Contact, Aaron D. Gitler (agitler@stanford.edu).
Materials Availability
All unique/stable reagents generated in this study are available from the Lead Contact without restriction.
Data and Code Availability
The datasets generated during this study are available at (GEO, https://www.ncbi.nlm.nih.gov/geo/query/acc.cgi?acc=GSE162048).
All code generated during this study for the ATACseq and RNAseq analysis are available at (https://github.com/zshipony/Maor_Nof_2020). All algorithms and code generated for image processing are available at (https://github.com/nofaviv/Axonal_Quantification, https://github.com/nofaviv/Axonal_Degeneration, https://github.com/nofaviv/Cells_CoLocalization).
EXPERIMENTAL MODEL AND SUBJECT DETAILS
Mouse breeding and husbandry
Animals were bred and used as approved by the Administrative Panel of Laboratory Animal Care (APLAC) of Stanford University, an institution accredited by the Association for the Assessment and Accreditation of Laboratory Animal Care (AAALAC). Mouse breeding and husbandry Mice (male and female) were between the ages of P0 and P400; Animals (5 mice per cage) were provided food and water and were maintained on a regular 12-h light–dark cycle. Embryos were harvested from pregnant dams at stage E16.5. Wild-type cultures were generated from C57BL/6 mice. For mutant strains, comparisons between wild-type and mutant embryos derive from the same pregnant female. Knockout strains used in this study are summarized in the Key Resources Table. Mice were maintained on a C57BL/6J hybrid background by crossing with F1 mice from JAX to propagate the strain (stock no: 100012, C57BL/6J).
KEY RESOURCES TABLE
| REAGENT or RESOURCE | SOURCE | IDENTIFIER |
|---|---|---|
| Antibodies | ||
| Tubulin β-III | Covance | Cat# 801201; RRID:AB_2313773 |
| p53 | Leica Biosystems | Cat# p53-CM5P-L; RRID:AB_2744683 |
| p53 | Cell Signaling | Cat# 2524; RRID: AB_331743 |
| p53 | Cell Signaling | Cat# 2527; RRID:AB_10695803 |
| Phospho-p53 (ser15) | Cell Signaling | Cat# 9284; RRID:AB_331464 |
| NeuN | Millipore Sigma | Cat# MAB377; RRID: AB_2298772 |
| Cleaved Caspase-3 | Cell Signaling | Cat# 9662; RRID:AB_331439 |
| Flag | Millipore Sigma | Cat# F1804; RRID:AB_262044 |
| phospho-Histone H2A.X (Ser139) | Millipore Sigma | Cat# 05-636; RRID:AB_309864 |
| Actin | Millipore Sigma | Cat# MAB1501; RRID:AB_2223041 |
| GAPDH | Millipore Sigma | Cat# G8795; RRID:AB_1078991 |
| C9ORF72/C9RANT (Poly-GR) | Millipore Sigma | Cat# ABN1361; |
| TDP-43 C-terminal | Millipore Sigma | Cat# T1580; RRID:AB_2532125 |
| Bacterial and Virus Strains | ||
| AAV9-CMV-enhanced chicken β-actin-GFP-(PR)50 | (Zhang et al., 2019) | N/A |
| AAV9-CMV-enhanced chicken β-actin-GFP | (Zhang et al., 2019) | N/A |
| Lenti-syn-(PR)50 | (Kramer et al., 2018) | N/A |
| Lenti-syn-(GFP) | (Kramer et al., 2018) | N/A |
| Lenti-syn-(GR)50 | This paper | N/A |
| Lenti-syn-TDP-43 | This paper | N/A |
| pLKO-p53-shRNA-427 | (Kim et al., 2007) | Addgene 25636; |
| pMDLg/pRRE | (Dull et al., 1998) | Addgene 12251; |
| pRSV-ReV | (Dull et al., 1998) | Addgene 12253; |
| pMD2.0 | (Dull et al., 1998) | Addgene 12259; |
| Chemicals, Peptides, and Recombinant Proteins | ||
| Cycloheximide | Sigma-Aldrich | 01810-1G; CAS 66-81-9 |
| Critical Commercial Assays | ||
| RNeasy Plus Micro Kit | QIAGEN | 74034 |
| SureSelect Strand-Specific RNA Library Preparation kit | Illumina | G9691-90010 |
| NextSeq 500/550 v2 Kits HighOutput 150cycles | Illumina | FC-404-2002 |
| Nextera DNA Library Preparation Kit | Illumina | FC-121-1030 |
| Deposited Data | ||
| Raw and analyzed data | This paper | GEO: GSE162048 |
| Experimental Models: Cell Lines | ||
| 293T | ATCC | CRL-3216 |
| G401 | ATCC | CRL-1441 |
| iMN generated from human lymphocytes from healthy subjects | Coriell Institute | ND03231 |
| iMN generated from human lymphocytes from healthy subjects | Coriell Institute | ND03719 |
| iMN generated from human lymphocytes from healthy subjects | Coriell Institute | ND05280 |
| iMN generated from human lymphocytes from ALS patients | Coriell Institute | ND06769 |
| iMN generated from human lymphocytes from ALS patients | Coriell Institute | ND10689 |
| iMN generated from human lymphocytes from ALS patients | Coriell Institute | ND12099 |
| C9ORF72 iPSC line #1 | (Lopez-Gonzalez et al., 2019) | 26L6 |
| C9ORF72 iPSC line #2 | (Lopez-Gonzalez et al., 2019) | 27L11 |
| C9ORF72 iPSC line #1 ‘corrected’ | (Lopez-Gonzalez et al., 2019) | 26Z90 |
| C9ORF72 iPSC line #2 ‘corrected’ | (Lopez-Gonzalez et al., 2019) | 27M91 |
| Experimental Models: Organisms/Strains | ||
| Mouse: B6.129S2-Trp53tm1Tyj/J | The Jackson Laboratory | JAX: 002101 |
| Mouse: C57BL/6-Bbc3tm1Ast/J | The Jackson Laboratory | JAX: 011067 |
| Mouse: B6;SJL-Tg(Thy1-TARDBP)4Singh/J | The Jackson Laboratory | JAX: 012836 |
| Mouse: C57BL/6J | The Jackson Laboratory | JAX:100012 |
| D. melanogaster P{TRiP.GL01032}attP2 | FlyBase | FBti0146570 |
| D. melanogaster P{TRiP.GL01220}attP40 | FlyBase | FBti0149303 |
| D. melanogaster P{TRiP.HMS02286}attP2 | FlyBase | FBti0149916 |
| Oligonucleotides | ||
| ON-TARGETplus Mouse Trp53 siRNA | Horizon Technology | L-040642-00-0005 |
| ON-TARGETplus Mouse Trp63 siRNA | Horizon Technology | L-040654-00-0005 |
| ON-TARGETplus Mouse Trp73 siRNA | Horizon Technology | L-043871-00-0005 |
| ON-TARGETplus Mouse Bbc3 siRNA | Horizon Technology | L-050032-00-0005 |
| ON-TARGETplus Non-target siRNA | Horizon Technology | D-001810-10-20 |
| ASO1 targeting sequence: mA*mG*mC*mU*mG*T*T*C*C*G*T*C*C*C*A*mG*mU*mA*mG*mA | Integrated DNA Technologies | N/A |
| ASO2 targeting sequence: mG*mU*mC*mA*mU*C*C*A*A*A*T*A*C*T*C*mC*mA*mC*mA*mC | Integrated DNA Technologies | N/A |
| ASO control sequence: mG*mC*mG* mA*mC*T* A*T*A* C*G*C* G*C*A* mA*mU*mA* mU*mG | Integrated DNA Technologies | N/A |
| Software and Algorithms | ||
| Analysis code | This paper | https://github.com/zshipony/Maor_Nof_2020 |
| Image processing (Axonal_Quantification) | This paper | https://github.com/nofaviv/Axonal_Quantification |
| Image processing (Axonal_degeneration) | This paper | https://github.com/nofaviv/Axonal_Degeneration |
| Image processing (Co-localization) | This paper | https://github.com/nofaviv/Cells_CoLocalization |
| RNAseq analysis | (Kramer et al., 2018) | https://github.com/emc2cube/Bioinformatics/blob/master/sh_RNAseq.sh |
| CRISPR screen analysis | (Kramer et al., 2018) | https://github.com/emc2cube/Bioinformatics/blob/master/sh_CRISPR.sh |
Fly stocks and culture
Flies were maintained on a cornmeal–molasses–yeast medium and at room temperature (22°C) with 60–65% humidity. The following Drosophila lines were obtained from the Bloomington Stock Center: UAS-LacZ, UAS-mCherry-RNAi, UAS-emb-RNAi, GMR-GAL4, and OK371-GAL4. The UAS-p53.ORF.3xHA was obtained from FlyORF. The UAS-(G4C2)30 lines were obtained from Dr Peng Jin’s laboratory (Xu et al., 2013). The three p53 RNAi lines used in this study are summarized in the Key Resources Table.
Cell culture
G401 cells (ATCC) were cultured in RPMI-1640 (Gibco) media with 10% fetal bovine serum (FBS) (Hyclone), penicillin (10,000 I.U./mL), streptomycin (10,000 μg/mL), and L-glutamine (2 mM). Cells were grown in log phase by maintaining the population at a concentration of 500,000 cells per mL. HEK293T (ATCC) cells were cultured in DMEM, 10% fetal bovine serum (FBS), penicillin (10,000 I.U./mL) and streptomycin (10,000 μg/mL). G401 and HEK293T cells were maintained in a controlled humidified incubator at 37°C, with 5% CO2.
Primary mouse cortical neurons
Primary mouse cortical neurons were dissociated into single-cell suspensions from E16.5 mouse cortices with a papain dissociation system (Worthington Biochemical Corporation). Neurons were seeded onto poly-L-lysine–coated plates (0.1% (wt/vol)) and grown in Neurobasal medium (Gibco) supplemented with B-27 serum-free supplement (Gibco), GlutaMAX, and penicillin–streptomycin (Gibco) in a humidified incubator at 37 °C, with 5% CO2. Half media changes were performed every 4 or 5 days, or as required. Neurons were plated on 12mm glass coverslips (Carolina Biological Supplies cat# 633009) in 24-well plates (350,000 cells/well) and in 12-well plates for DNA, RNA and protein extraction (450,000 cells/well).
Motor neuron differentiation from iPSCs
Differentiation of iPSCs into motor neurons was performed as described in (Lopez-Gonzalez et al., 2019). The C9ORF72 iPSC lines and their isogenic controls used in this study are summarized in the Key Resources Table. The iPSCs were plated and expanded in mTSER1 medium (Stem Cell Technologies) in Matrigel-coated wells. One day after plating, the culture medium was replaced with neuroepithelial progenitor (NEP) medium, DMEM/F12, neurobasal medium at 1:1, 0.5X N2, 0.5X B27, 0.1 mM ascorbic acid (Sigma), 1X Glutamax (Invitrogen), 3 μM CHIR99021 (Tocris Bioscience), 2 μM DMH1 (Tocris Bioscience), and 2 μM SB431542 (Stemgent). After 6 days, NEPs were dissociated with accutase, split 1:6 into Matrigel-coated wells, and cultured for 6 days in motor neuron progenitor induction medium (NEP with 0.1 μM retinoic acid and 0.5 μM purmorphamine, both from Stemgent). Motor neuron progenitors were dissociated with accutase to generate neurosphere suspension cultures supplemented with NEP plus 0.5 μM retinoic acid and 0.1 μM purmorphamine. After 6 days, neurospheres were dissociated into single cells, plated on laminin-coated plates/coverslips in motor neuron differentiation medium containing 0.5 μM retinoic acid, 0.1 μM purmorphamine, and 0.1 μM Compound E (Calbiochem) for 2 weeks and then in the same medium without Compound E for up to 2 and half months.
An additional panel of induced motor neurons (iMNs) was generated as previously described (Shi et al., 2018). Cells were purchased from Coriell Institute. The panel of control lines and the panel of C9ORF72 ALS lines are summarized in the Key Resources Table. Human secondary fibroblasts were transduced with a cocktail of transcription factors that consisted of Ascl1, Brn2, Isl1, Lhx3, Ngn2, NeuroD1, and Mytl1 using retrovirus. The following day Hb9::RFP+ lentivirus was added to the fibroblast cultures. On Day 4, primary glia isolated from male and female ICR mouse pups (P2–P3) were added to the cultures in glia medium. To induce the formation of neurons, the media was switched the following day to N3 media consisting of DMEM/F-12 (Life Technologies), 2% FBS, B-27 and N2 supplements (Life Technologies), 1% Penicillin/Streptomycin, 7.5 μM Rep Sox (Selleck), and 10 ng/ml each of GDNF, BDNF, CNTF, and FGF (R&D). The culture media was fully replenished every 2 days, until 14 days post-transduction.
METHOD DETAILS
Neonatal viral injections
GFP and GFP-(PR)50 were generated as described previously (Zhang et al., 2019). Intracerebroventricular (ICV) injections of AAV were performed as previously described with some minor modifications (Chew et al., 2015; Zhang et al., 2019). Briefly, a 32-gauge needle (Hamilton Company) attached to a 10 μl syringe (Hamilton Company) was inserted at approximately two-fifths the distance between lambda suture and each eye of the pups at postnatal day 0, after they were cryo anesthetized on ice for approximately 3 minutes or until pups exhibited no movement. The needle was inserted at a 30-degree angle from the surface of the head and held at a depth of approximately two millimeters. 2 μl (1E10 genomes/μl) of AAV9-GFP or AAV9-GFP-(PR)50 solution per cerebral ventricle was manually injected into each cerebral ventricle. After injections, pups were placed on a heat pad until they completely recovered from anesthesia and then were placed back into their home cages.
Mouse CNS histology
Anesthetized mice were perfused with PBS and the brain and spinal cord were carefully dissected and washed in chilled PBS. The brains as well as the cervical and lumbar enlargements of the spinal cord were placed in 4% PFA in PBS at 4°C for 48h and then stored in 30% sucrose in PBS. PFA-fixed brains were mounted in OCT and cut to a thickness of 40 μm (coronal sections) using a Leica CM3050 S Cryostat with a cryo-microtome (Leica) and stored in cryoprotective medium (30% glycerol, 30% ethylene glycol) at − 20°C. Washes were done 4 times for 5 min each in TBST (0.1% Tween-20), unless otherwise noted, at RT. Washes and incubation steps were performed with gentle rotation using an orbital rotator. The sections were stained using immunofluorescence. The sections were washed then blocked/pre-treated in TBST with 0.1% triton-X and 10% normal goat or donkey serum (depending on secondary antibody host) for 1h at RT. Primary antibodies were diluted in TBST with 10% serum at 4°C overnight. The sections were then washed, treated with Alexa Fluor conjugated secondary antibodies (Life Technologies) diluted at 1:1000 in TBST with 10% serum for 3h, and washed again with DAPI (1:5000) added to the final wash. Sections were mounted on frosted slides in PB using a paintbrush, and when the sections were no longer visibly wet, the slides were cover slipped using Prolong diamond antifade mountant (Molecular Probes). High quality images were taken on a Zeiss LSM 710 Confocal Scope.
Fly eye degeneration experiment
UAS-(G4C2)30 flies recombined with GMR-Gal4 were selected as male parental flies for crossing (♀w1118 x ♂GMR-Gal4; UAS-(G4C2)30/CyO). Overexpressing 30 Hexanucleotide Repeat Expansion (HRE) in all photoreceptors using GMR-Gal4 causes eye degeneration in adult flies during aging. Eyes degeneration score were examined based on Dr. Paul Taylor’s study (Ritson et al., 2010). It was quantified for the presence of supernumerary inter-ommatidial bristles (IOBs), IOBs with abnormal orientation, necrotic patches, a decrease in size, retinal collapse, fusion of ommatidia, disorganization of ommatidial array and loss of pigmentation in adult male progeny. Points were added if: there was complete loss of IOBs (+1), more than 3 small or 1 large necrotic patch (+1), retinal collapse extended to the midline of the eye (+1) or beyond (+2), loss of ommatidial structure in less than 50% (+1) or more than 50% (+2) of the eye, and if pigmentation loss resulted in change of eye color from red to orange (+1) or pale orange/white (+2). Images were taken on a Zeiss LSM800 Airyscan laser scanning confocal microscope. Image quantification were carried with ImageJ.
Fly survival experiment
UAS-(G4C2)30 flies recombined with OK371-Gal4 were selected as male parental flies for crossing (♀w1118 x ♂OK371-Gal4; UAS-(G4C2)30/TM6B, GAL80). Overexpressing 30 HRE in fly motor neurons using OK371-Gal4 causes lethality due to paralysis, preventing eclosion of the adult from the pupal case. According to mendelian inheritance, the theoretical ratio of progenies with 30 HRE expressions from the above crossing is 50%. A total of 100 adult flies are collected in each group.
Neuron survival assay and ASO treatment
The neuron survival assay was initiated on Day 14. At this juncture, the iMNs were maintained in N3 media that did not contain neurotrophic factors and RepSox. Baseline images were taken using the Molecular Devices Image Express prior to the addition of ASOs. The following day iMNS were treated (a single time) with 9 μM of negative control ASO, p53 ASO-1, and p53 ASO-2 for 72 hours. The ASOs were synthesized by Integrated DNA Technologies which contained Gapmer modification for increased stability and binding affinity. Longitudinal tracking of Hb9::RFP iMNs was performed by imaging the plates every 2 days and iMNs were manually counted using SVCell 3.0 (DRVision Technologies). Neurons were scored as dead when their soma were no longer visible.
Lentiviral production
HEK293T (ATCC) cells were used to package lentiviral particles according to standard protocols with third-generation packaging plasmids (pMDlg-pRRE, pRSV-ReV, pMD2.0; Addgene). Lentiviral backbone and packaging plasmids were transfected into HEK293T cells using Lipofectamine 3000 and Lentivirus-containing medium was harvested after 48 h. Viral supernatant was collected and filtered through a 0.45 μm filter to remove cellular debris. The virus was concentrated using Lenti-X concentrator (Clontech) and re-suspended in Neurobasal/B27. Lentivirus was added to cortical neurons 3 days after plating. For overexpression experiments, TDP-43 ORF from the human ORFeome collection, GFP or (PR)50-FLAG constructs were cloned into a third-generation lentiviral vector for expression of the transgenes under the control of the neuron-specific human synapsin 1 promoter (SYN). To knockdown p53 in iPSC-derived neurons, we generated lentiviral particles using the addgene plasmid 25636, pLKO-p53-shRNA-427. Then, we transduced 2-month-old iPSC-derived motor neurons from two C9orf72 carriers, for two additional weeks to perform comet assay.
Comet Assay
The comet assay was performed in iPSC-derived motor neurons from 2 independently generated C9orf72 ALS/FTD patients and their respective isogenic controls as described in (Lopez-Gonzalez et al., 2016; Olive and Banath, 2006). Briefly, motor neuron cultures were dissociated mechanically and enzymatically to obtain a single-cell suspension. Cell suspensions were mixed with a 1% low-gelling 2 hydroxyethyl agarose solution (Sigma-Aldrich) and placed on glass slides and allowed to gel. Then slides were gently submerged in lysis solution and left overnight at 4°C. Slides were transferred to an electrophoresis solution, run at 0.6 V/cm for 25 min, removed, and submerged in rinse buffer for 30 min at room temperature. Afterwards, the slides were incubated with 2.5 μg/ml SYBR Safe (Invitrogen) for 20 min and washed with distilled water. For each experimental condition, 20 cells were analyzed with Image J software, and scored based on tail length and percentage of DNA in the tail.
siRNA Treatment
siRNA oligonucleotide sequences were used to target p53, p63, p73 and Puma (Dharmacon, ONTARGETplus SMARTpool). For negative control, a nontarget sequence was used (Dharmacon, ON-TARGETplus Non-Targeting Pool, D-001810). Cortical neurons dissociated cells were transfected with siRNA 3 days after plating, using the protocol supplied with DharmaFECT 4 (Dharmacon, T-2004–03) and performed as previously described before (Maor-Nof et al., 2013) with minor modifications. Briefly, siRNA and the transfection reagent were each diluted separately into NB medium without serum and antibiotics for 5 min; then, the siRNA was added to the medium with the transfection reagent. After an additional 20 min incubation, the transfection reagent siRNA complex was added to the dissociated cells and grown in NB medium without serum and antibiotics. 16h later, the transfection reagent was removed by replacing the medium with a complete medium and the neurons were cultured for an additional 48 hr. Lentivirus transduction was performed after. The final concentration of the siRNA was 0.1 mM. The level of the target protein Puma, reduced by its specific siRNA treatment, was evaluated by western blot analysis.
Immunoblotting
Primary cortical neurons were washed with ice-cold PBS prior to lysis. Cells were lysed in 1× RIPA lysis supplemented with 1× Halt protease and phosphatase Inhibitor Cocktail (Thermo Fisher Scientific cat# 78429, 78426) and incubated for 30 min on ice. Crude RIPA lysates were centrifuged at 14,000 g for 15 min at 4°C to remove cellular debris. The remaining supernatant was transferred to a new tube and quantified with a Pierce BCA protein assay (Thermo Fisher Scientific cat# 23225). Cell lysates were mixed with 4× NuPage LDS loading buffer and beta-mercaptoethanol and incubated for 10 min at 95°C. Equal amounts of protein were subjected to SDS–PAGE, transferred to nitrocellulose membranes. Membranes were blocked with 5% BSA in tris-buffered saline with 0.1% Tween (TBST) at RT for 1h and treated over night at 4°C with primary antibodies. Following incubation overnight, horseradish peroxidase-conjugated secondary antibodies and an ECL kit (GE Healthcare/Amersham Pharmacia Biotech) were used to detect protein signals. Multiple exposures were taken to select images within the dynamic range of the film (GE Healthcare Amersham Hyperfilm ECL). Protein bands were quantified using Fiji software (NIH). For the fluorescent western images, after primary antibody incubation, the membranes were washed with PBST and incubated with IRDye anti-rabbit or anti-mouse secondary antibodies (1:5000, LI-COR Biosciences) and images were acquired with the Odyssey CLx imaging system.
Immunocytochemistry
Primary cortical neurons were grown on poly-L-lysine-coated glass coverslips [0.1% (wt/vol)] in standard multi-well cell culture plates and were stained through standard immunocytochemistry techniques. Briefly, cells were fixed with 4% formaldehyde and 15% sucrose for 1h at RT, rinsed 3 times with PBS, blocked with 1% BSA and permeabilized with 0.3% Triton X-100 for 1h at RT. After overnight primary antibody incubation, cells were rinsed 3× with PBS. Cells were incubated with fluorescently labeled secondary antibodies for 1h at room temperature. Coverslips were mounted with Prolong Diamond Antifade mount with DAPI (Thermo Fisher Scientific). Images were acquired with a Leica DMI6000B inverted fluorescence microscope.
ATAC-seq
Primary cortical neurons treated for 20, 40 and 60h with either GFP, (PR)50, TDP-43 or untreated, were pretreated with 200 U/ml DNase (Worthington) for 30 min at 37 °C to remove free-floating DNA and to digest DNA from dead cells. This medium was then washed out, and the cells were washed in cold PBS four times. To avoid neuronal cell death that is associated with trypsinization, neurons were directly lysed in 1ml of cold ATAC-seq resuspension buffer (RSB; 10mM Tris-HCl pH 7.4, 10mM NaCl, and 3mM MgCl2 in water, containing 0.1% NP40, 0.1% Tween-20, and 0.01% digitonin) on ice for 10 min. After lysis cells nuclei were collected and counted, 50,000 viable cells were centrifuged at 500xg for 5 min in a pre-chilled (4°C) fixed-angle centrifuge. After centrifugation, supernatant was carefully aspirated, with two pipetting steps; The remaining 100μl of supernatant was carefully aspirated by pipetting with a P200 pipette tip to avoid the cell pellet. Cell pellets were then resuspended in 1 ml of ATAC-seq RSB containing 0.1% Tween-20 (without NP40 or digitonin), and the tubes were inverted to mix. Nuclei were then centrifuged for 10 min at 500 RCF in a pre-chilled (4°C) fixed-angle centrifuge. Supernatant was carefully removed with two pipetting steps, as described before, and nuclei were resuspended in 50μl of transposition mix (25μl 2× TD buffer (20 mM Tris-HCl pH 7.6, 10 mM MgCl2, 20% Dimethyl Formamide), 2.5μl transposase (100 nM final), 16.5μl PBS, 0.5μl 1% digitonin, 0.5μl 10% Tween-20, and 5μl water) by pipetting up and down six times. Transposition reactions were incubated at 37°C for 30 min in a thermomixer with shaking at 1,000 r.p.m. Reactions were cleaned up with Zymo DNA Clean and Concentrator columns. The complete eluate underwent PCR, as follows. After initial extension, 5 cycles of pre-amplification using indexed primers (Buenrostro et al., 2015) and NEB Next High-Fidelity 2X PCR Master Mix (NEB) were conducted, before the number of additional cycles was assessed by quantitative PCR using SYBR Green. Typically, 7–9 additional cycles were run. The final library was purified using a MinElute PCR kit (QIAGEN) and quantified using a Qubit dsDNA HS Assay kit (Invitrogen) and a High Sensitivity DNA chip run on a Bioanalyzer 2100 system (Agilent). All libraries were sequenced using 75bp Nextseq High Output Cartridge kits and a Nextseq 500 sequencer (Illumina).
ATAC-seq Analysis
ATAC-seq libraries were trimmed to remove illumina adapters using SeqPurge (Sturm et al., 2016) and mapped to the mouse reference genome (mm9) using Bowtie2 v2.3.4.1 with the following parameters “--very-sensitive -X 2000 --no-mixed --no-discordant” (Langmead and Salzberg, 2012). PCR duplicate reads were removed using Picard MarkDuplicates v2.17.10 (http://broadinstitute.github.io/picard). The reads were filtered using samtools v1.5 for a minimum mapping quality of 10 and only properly paired reads were retained. Additionally, any reads aligning to the mitochondrial chromosome were removed. Peaks were called subsequently on each sample using macs2 v2.1.1.20160309 with the following parameters “--keep-dup all -f –nomodel –call_summits -q 0.05” (Zhang et al., 2008). Peaks were filtered against the ENCODE blacklist (https://sites.google.com/site/anshulkundaje/projects/blacklists). Combined peaks set with fixed width (500bp wide) was generated by first running IDR 2.0.4 on the replicates of each sample to find peaks that are consistent between replicates, we then merged peaks from all samples by expanding all summits to 500bp, in cases where multiple peaks merged together we split into most possible non overlapping peaks going from strongest summits to weakest. Number of fragments within peaks were counted using featureCounts (Liao et al., 2014).
To determine differential peaks, the raw counts matrix was used as input into DESeq2 (Love et al., 2014) and edgeR (Nikolayeva and Robinson, 2014) both in a pairwise way between all samples and between treatments (PR/TDP) against GFP (Figure S2G–S2L). We then took top 3960 differential peaks and clustered the log2 (CPM) values (obtained using edgeR with library size normalization) using K-means++ (K = 12) (https://github.com/tanaylab/tglkmeans). We used motifMatcher (part of chromVar package) to call TF binding sites within each of the 3960 peaks, using hypergeometric test we computed the enrichment of each TF within each cluster compared to the other 3960 differential peaks. To compute TF motif deviations, chromVAR was used in R with raw counts in all peaks and then the top 100 variable TF motifs were determined using variability scores (Schep et al., 2017).
To generate motif match matrices, motifs from the curated, high-confidence JASPAR2016 vertebrate core database were obtained. We called significant motif matches in peaks, or subsets of peaks, using JASPAR motif position weight matrices and the function “matchMotifs” from the “motifmatchr” and “chromVAR” packages v1.8.0 (https://bioconductor.org/packages/release/bioc/html/chromVAR.html), resulting in a binary peaks-by-matches matrix. To compute enrichments, we defined foreground and background peak sets according to the specific question addressed, then performed a two-sided Fisher’s Exact test for the over or under representation of each motif in the foreground set. For K-means cluster motif enrichments, we aggregated all peaks from a given K-means cluster and tallied the total number of matches for each motif in the cluster, and we used all of the other clusters as the background.
RNA-seq
RNA was isolated from primary neurons treated for 20, 40 and 60h with either GFP, (PR)50, TDP-43 or untreated. To obtain RNA from the same neurons that were used for ATAC-seq, we performed sequential lysis. Neurons were first lysed in ATAC-seq resuspension RSB buffer, followed by sequential RNA extraction and isolation in RLT buffer of the QIAGEN RNeasy Plus Micro Kit (QIAGEN), according to the manufacturer’s protocol. In brief, cells were lysed, homogenized, and loaded on a genomic DNA (gDNA) eliminator column. After removal of genomic DNA, RNA was purified using RNeasy spin columns. RNA quantity and purity were determined by optical density measurements of OD260/280 and OD230/260 using a NanoDrop spectrophotometer. Structural integrity of the total RNA was assessed using a 2200 TapeStation Instrument with RNA ScreenTapes (Agilent Technologies, Santa Clara, CA). mRNA libraries were prepared using a SureSelect Strand-Specific RNA Library Preparation kit for Illumina (G9691B) on an Agilent Bravo Automated Liquid Handling Platform, following the manufacturer’s protocol. Libraries were sequenced on an Illumina HiSeq 4000.
RNA-seq Analysis
Alignment of RNA-sequencing reads to the mouse mm10 transcriptome was performed using STAR v2.7.3a (Dobin et al., 2013) following ENCODE standard options, read counts were generated using RSEM v1.3.1, and differential expression analysis was performed in R v3.6.1 using the DESeq2 package v1.38.0 (Love et al., 2014), detailed pipeline v2.0.1 and options available on https://github.com/emc2cube/Bioinformatics/ and the Visualization Pipeline for RNA-seq (VIPER)(Cornwell et al., 2018). We took 6109 differentially expressed genes (DEG) between all samples and clustered the Z-score changes using K-means++ (K = 6) (https://github.com/tanaylab/tglkmeans). For each cluster we performed KEGG pathway enrichment between the genes found in the cluster to all DEG using gProfiler (https://biit.cs.ut.ee/gprofiler).
Next, we generated a co-expression network for samples from 40h and 60h using the WGCNA package in R (Langfelder and Horvath, 2008). We used a soft threshold power of 12 to generate a topological overlap matrix (TOM). The TOM was clustered hierarchically using average linkage hierarchical clustering (using 1 – TOM as a dissimilarity measure). The topological overlap dendrogram was used to define modules using the cutreeHybrid() function with parameters: minimum module size = 100, deep split = 4, merge threshold = 0.1, and negative pamStage. To identify modules associated with time or treatment, we fit four different linear model contrasts for the eigengenes of each module: 60h vs 40h, GFP samples vs Control samples, (PR)50 samples vs GFP and Control samples, and TDP-43 samples vs GFP and Control samples. For enrichment analysis, we downloaded p53 target genes from KEGG. We used logistic regression to test whether each module was enriched with p53 target genes. For gene ontology enrichments, we used the g:Profiler package in R (Reimand et al., 2007) with parameters: correction_method = fdr, max_set_size = 1000, and hier_filtering = moderate. We performed ordered queries with genes ordered by connectivity to the module eigengene (kME) for each co-expression module.
CRISPR-Cas9 screens in G401 cells
The 10-sgRNA per gene CRISPR/Cas9 epigenetic sublibrary was synthesized, cloned, and infected into Cas9 expressing G401 cells as previously described (Kramer et al., 2018; Morgens et al., 2017). Briefly, 100 million G401 cells stably expressing SFFV-Cas9-BFP were infected with the 10 guide/gene transcription factor sgRNA library at a MOI < 0.4. Infected cells underwent puromycin selection (1μg/mL) for 5 days after which point puromycin was removed. After selection, sgRNA infection was measured by immunofluorescence to confirm that > 90% of cells were mCherry+. Cells were maintained for three weeks at 1000× coverage (~1000 cells containing each sgRNA) at a concentration of 500,000 cells/mL for the duration of each screen. Cells were split into two conditions: one control group that remained untreated, and one group that was treated with the synthetic (PR)20 at 4μM. This treatment occurred four times over three weeks, allowing for cells to recover to ~90% viability after each round of treatment. At the end of each screen genomic DNA was extracted for all screen populations separately according to the protocol included with QIAGEN Blood Maxi Kit and deep sequencing on an Illumina Nextseq 500 was used to monitor library composition. Guide composition between PR treated conditions was compared to the untreated condition using casTLE (Morgens et al., 2016) version 1.0. Briefly, the enrichment of individual guides was calculated as log ratios between treated and untreated conditions, and gene-level effects were calculated from ten guides targeting each gene. A confidence score was then derived as a log-likelihood ratio describing the significance of the gene-level effect. P-values were then calculated by permutating the targeting guides as previously described (Morgens et al., 2016).
QUANTIFICATION AND STATISTICAL ANALYSIS
All images were quantified using the following computerized algorithms tailored to each paradigm and written in MATLAB or C++.
Axonal Quantification In Vitro
The images of cortical neurons, immuno-stained for β-tubulin, were binarized such that pixels corresponding to axons converted to white while all other regions converted to black. To perform this binarization and differentiate between axons and background in the images, a localized Otsu threshold was used. The Otsu algorithm searches for a threshold that minimizes the variance sum of two or more populations in an image (Otsu, 1979). This gives an exact threshold below which all pixels are considered background. This threshold was then applied to count the number of pixels corresponding to axons in each figure, which serves as the MTs stability index. A punctuated formation of MTs was evident from the cortical explants’ staining; these spots occupy only the higher gray levels in the image and appeared mostly in the (PR)50 and TDP-43 treated, and not in their corresponding GFP treated and the untreated neurons. The MT depolymerization index was defined as the ratio of depolymerized axon pixel number to intact axon pixel number. To detect the depolymerized axons, we used an algorithm for counting all the pixels above a certain threshold. To find this threshold, we calculated the probability density function (PDF) of the sum-controlled experiments (untreated neurons), from which the cumulative probability density function (CDF) was extracted. The threshold was set as the value above which there were almost no pixels (less than 0.1%). More than six wells were analyzed for each experimental condition.
Number of GFP, p53 positive cells and their colocalization
The number of positive p53 cells from mouse tissue was identified using a specific p53 antibody (Figure S4A) that stained in red cells expressing p53. p53 expressed cells were distinguished from the background using the statistics of the background with a 4σ threshold. The statistics were calculated using the robust statistics technique, which is less prone to errors from outliers. The result was a binarized image were the p53 expressing cells were “on”. The image was subjected to several morphological operations intended to remove noise and fill gaps. Connected components analysis was used to identify the individual connected cells and count them.
The number of positive GFP expressing cells was identified using the GFP from the construct GFP-(PR)50 in the green channel. GFP expressed cells were distinguished using the same algorithms as for p53. The binary images of p53 and GFP were co-localized by applying a logical “AND” operator between the two images. The resulting binary image shows only the locations where both p53 and GFP expressed cells were found in the same coordinates. Connected components analysis was used to identify the individual connected cells and count them.
Axonal Degeneration Index
Following (PR)50 and TDP-43 treatments, phase microscopy images of live cells revealed fragmented axons of cortical neurons. The axonal integrity index is defined as the slope of the rate of axon degradation. Images with intact axons were characterized by a higher number than those with fragmented axons. The algorithm starts by identifying the pixels in the image classified as the cell body. Those pixels will later be used as a mask and will not contribute to our result. The cell body is easily identified in the images as extremely bright/dark saturated pixels that can be identified using a double threshold. Following that we distinguished between the axons and the image background. This can be achieved via robust statistics of the image’s gray levels. Once axonal pixels are identified, morphological operations are applied to the binary image to clean it up. The cell body mask is applied, and its pixels are removed. Connected component analysis is used on the resulting binary image to find all the axons and to create the quantification number of the amount of axonal material. More than three wells were analyzed per each experimental condition.
Statistical Methods
Analyses were performed using R, Microsoft Excel or Prism 8 (GraphPad), and graphs were plotted using Microsoft Excel or Prism 8. Survival curves were compared using the survdiff function in the survival R package, which performs a log-rank test, and effect sizes are reported as the hazard ratios given by the coxph function, which fits a Cox proportional hazards model. For comparisons among different genotypes or treatment groups, pairwise analyses were conducted by unpaired t-test for two groups and one-way ANOVA were used when comparing more than two groups. Data represent mean ± SEM unless otherwise noted. Significance is indicated at the figure legends.
Supplementary Material
(A–J) Cortical WT primary neurons were cultured for 3 days and treated with either C9orf72 (PR)50 or TDP-43 for additional 24h, 48h or 72h or left untreated. (PR)50 levels were elevated at both 48h and 72h of (PR)50 treated neurons, as detected using the anti-Flag antibody (A–B). TDP-43 levels were elevated at 24h (C–D and E–F), 48h (C–D and G–H) and 72h (I–J) of TDP-43 treated neurons, as detected using the anti-Flag antibody (C) and a specific anti TDP-43 (E, G and I) antibody. Quantitation of (PR)50 and TDP-43 was determined by immunoblots and normalized to actin (B, D, F, H and J). Graphs show mean ± SEM (t test; *p < 0.05, **p < 0.01, N.S. not significant).
(A) Table with all the ATAC-seq samples used in this study.
(B–C) Quality check for the ATACseq samples presented here is one example, (PR)50 at 60h. Insert size distribution (B) and transcription start site enrichment around Refseq annotated genes(C).
(D–E) PCA analysis of all merged peaks provides an overall visualization of the data, emphasizing the variation and brings out strong patterns. PC1 vs PC2 show that PC1 (21% of the variability) is associated with time, while PC2 (12% of the variability) is associated with the different treatments (D). PC2 Vs PC3 emphasizes the variation in between the different treatments over time (E).
(F) Pearson correlation between the counts of all merged peaks.
(G–I) MA Plots of (PR)50 vs GFP treated neurons, from 20, 40 and 60h post treatment. Small changes in ATAC-seq start appearing at 40h but the majority of changes are around 60h post treatment.
(J–L) MA Plots of TDP-43 vs GFP treated neurons, from 20, 40 and 60h post treatment.
(A–B) PCA analysis of all transcripts is used to visualize the data and show an overall view of the data. (A)PC1 vs PC2 show that PC1 (61.21% of the variability) is associated with time, while PC2 (16.86% of the variability) is associated with the different treatments. (B) PC2 Vs PC3 emphasizes the variation in between the different treatments over time.
(C) KEGG pathway gene ontology enrichment of clusters 3–6 of the K-means clustering analysis (Figure 2C).
(D–F) Average linkage hierarchical clustering using the topological overlap metric for co-expression dissimilarity. (D) Modules were identified from this dendrogram. Correlations for each gene to covariates are delineated below the dendrogram (blue, negative; red, positive). Modules are labelled with colors. The grey module represents genes that are not co-expressed and was not evaluated in further comparisons. (E) Module-trait associations as computed by a linear model with four contrasts: 60h vs 40h, GFP vs Control, (PR)50 vs GFP + Control, and TDP-43 vs GFP + Control. Only p-values with a Bonferroni-corrected value < 0.05 are shown. (F) Enrichments for all of the co-expression modules with a list of p53 target genes. FDR corrected p-values are shown in parentheses.
(A) Two specific p53 antibodies were detected after (PR)50 treated WT neurons while absent in the p53 KO neurons.
(B–D) Cortical neurons from p53 KO embryos or their WT littermates were cultured for 3 days and either treated with (PR)50 or left untreated for 48h. 5 mg/ml cycloheximide or DMSO for control were added for additional 24h, followed by lysis and immunoblotting. Elevated p53 levels were detected in the presence of the protein inhibitor cycloheximide (B–C), while for puma this increase was completely blocked (B and D). Quantitation of p53 and puma was determined by immunoblots and normalized to actin (C and D). Graphs show mean ± SEM (t test; ****p < 0.0001, N.S. not significant).
(E–H) Cortical neurons from p53 KO embryos or their WT littermates were cultured for 3 days and either left untreated or treated with (PR)50 (E) or TDP-43 (G) and monitored using live cell imaging. WT cortical neurons were fragmented after (PR)50 and TDP-43. The p53 KO cortical neurons and axons were completely protected from any degradation after (PR)50 (E) but not TDP-43 (G) treatment. Axonal integrity (mean index) was calculated by measuring the slope of the degradation rate for each genotype and condition (F and H), as described in the Supplemental Experimental Procedures (t test; ***p < 0.001, N.S. not significant). Scale bars, 150 μm.
(I–J) Puma ablation protects neurons from (PR)50 toxicity. Cortical neurons from Puma KO embryos or their WT littermates were cultured for 3 days and either left untreated or treated with (PR)50 and monitored using live cell imaging (I). WT cortical neurons were fragmented after (PR)50. The Puma KO cortical neurons and axons were protected for the duration of 120h after (PR)50 treatment. Axonal integrity (mean index) was calculated by measuring the slope of the degradation rate for each genotype and condition (J), as described in the Supplemental Experimental Procedures (t test; **p < 0.01). Scale bar, 150 μm.
(A–B) WT cortical neurons were cultured for 3 days and treated with (PR)50 for additional 72h. Neurons were then either treated within the first 24h or after 24h of (PR)50 induction with siRNA against p53 or non-targeting control and immunostained for tubulin βIII. p53 siRNA addition within the first 24h of (PR)50 treatment protected against axonal degeneration (A). The extent of microtubule depolymerization (mean index) was calculated for each condition (B), as described in the Supplemental Experimental Procedures (t test; ****p < 0.0001). Scale bar, 100 μm.
(C–E) Cortical neurons from p53 KO embryos or their WT littermates were cultured for one day and 100nM FUdR was added for 8h. Following this treatment, no glial cells were present as detected by GFAP immunostainings (C). Axonal microtubules (MTs) of the WT cortical neurons were depolymerized and degraded after (PR)50. The p53 KO cortical neurons and axons were completely protected from any degradation after (PR)50 treatment (D). The extent of microtubule depolymerization (mean index) was calculated for each genotype and condition (E), as described in the Supplemental Experimental Procedures (t test; ****p < 0.0001, N.S. not significant). Scale bar, 100 μm.
(A–B) p53 shRNA lentiviral transduction decreases p53 levels in iPSC-derived neurons differentiated from two independent C9orf72 mutation carriers. Quantification of p53 levels by immunoblotting and normalized to actin. Graphs show mean ± SEM (t test; *p < 0.05).
(C–F) Relative p53 RNA expression in iMNs treated with 9 μM negative control or p53 ASOs for 24 hours, as determined by RT-PCR. (C) Mean +/−s.e.m., One-way ANOVA. n = 4 biological replicates per group. * p<0.05. The c9ALS patient-derived iMNs showed reduced survival (D). Survival of CTRL iMNs was not affected by p53 ASO treatment; log rank Mantel-Cox test; n=3 independent iMN lines with n=195 iMNs per condition per treatment; **p < 0.01, N.S. not significant (E–F).
(A) Newborn pups from p53 heterozygous x heterozygous crosses were injected with GFP.
(B) Viability of p53 KO mice (n=14) monitored for a total of 211 days.
(C) Kaplan-Meier survival curves comparing survival of WT (n = 8), p53 heterozygous (n=15) and p53 KO (n=5) TDP-43 transgenic mice. Curves were compared by log rank test and effect size was estimated by a Cox proportional hazards model (HR).
(D–E) Nucleocytoplasmic fractioning of mouse brain tissue. p53 were detected in WT nuclear fraction, reduced in p53 heterozygous and ablated in p53 KO mice (D). Samples were collected at P22. Quantitation of p53 was determined by immunoblots and normalized to actin (E). Graphs show mean ± SEM (one-way ANOVA; *p < 0.05, **p < 0.01).
(F–H) Immunofluorescence staining of WT and p53 KO 3-weeks-old mice show no activation in GFP expressing cells (G), whereas strong p53 activation in the cortex (H) of WT GFP-(PR)50 expressing cells. Three mice per each genotype and condition were quantified (F) as described in the Supplemental Experimental Procedures and the values of p53-expressing cells are plotted (one-way ANOVA; **p < 0.01, N.S. not significant). Scale bars, 200 μm.
Highlights.
ATACseq reveals chromatin accessibility signature activated by C9orf72 poly(PR).
C9orf72 poly(PR) leads to p53 stabilization and transcription of p53 target genes.
p53 ablation protects against neurodegeneration in multiple C9orf72 models
Acknowledgments
We thank Dr. Andrew Olson [Stanford Neuroscience Microscopy Service, supported by National Institutes of Health (NIH) Grant NS069375]. M.M.N is supported by the EMBO Long-Term fellowship (ALTF 301-2017), SSSI-Muscular Dystrophy Association (M.M.N) and Stanford School of Medicine Dean’s Postdoctoral Fellowships (M.M.N). This work was supported by NIH grants R35NS097263-10 (A.D.G.), R01NS094239 (T.E.L), R01NS101986 (F.-B.G.), R37NS057553 (F.-B.G.), R35NS097273-17 (L.P.), P01NS084974 (L.P.), P01NS099114 (L.P.), R01NS089786 (M.T.L.), 1F32MH114620 (G.R.), K01AG049152 (J.S.Y.), R35CA197591 (L.D.A.), R01MH109912 (D.H.G.), R01NS097850 (J.K.I.), R01NS097850-01S1 (R.L.-G.), P50HG007735 (W.J.G.), R01HG008140 (W.J.G.), U19AI057266 (W.J.G.), UM1HG009442 (W.J.G.), 1UM1HG009436 (W.J.G.). the Robert Packard Center for ALS Research at Johns Hopkins (A.D.G.), Target ALS (A.D.G., F.-B.G., J.C., L.P., and T.E.L.), Blavatnik Family Foundation (J.A.B.), the Alzheimer’s Association 2018-AARFD-592264 (G.R.L.), the Brain Rejuvenation Project of the Wu Tsai Neurosciences Institute (A.D.G.), U.S. Department of Defense grant W81XWH-15-1-0187 (J.K.I.), the Merkin Family Foundation (J.K.I.), the New York Stem Cell Foundation (J.K.I.), the John Douglas French Alzheimer’s Foundation, the Tau Consortium (J.K.I.). J.K.I. is a New York Stem Cell Foundation-Robertson Investigator and a Richard N. Merkin Scholar. W.J.G is a Chan Zuckerberg Biohub investigator. Some of the computing for this project was performed on the Sherlock cluster. We would like to thank Stanford University and the Stanford Research Computing Center for providing computational resources and support that contributed to these research results. This work used the Genome Sequencing Service Center by Stanford Center for Genomics and Personalized Medicine Sequencing Center, supported by the grant award NIH S10OD020141.
Footnotes
Publisher's Disclaimer: This is a PDF file of an unedited manuscript that has been accepted for publication. As a service to our customers we are providing this early version of the manuscript. The manuscript will undergo copyediting, typesetting, and review of the resulting proof before it is published in its final form. Please note that during the production process errors may be discovered which could affect the content, and all legal disclaimers that apply to the journal pertain.
Declaration of Interests
A.D.G. has served as a consultant for Aquinnah Pharmaceuticals, Prevail Therapeutics and Third Rock Ventures and is a scientific founder of Maze Therapeutics. W.J.G. has affiliations with 10x Genomics (consultant), Guardant Health (consultant) and Protillion Biosciences (co-founder and consultant). J.K.I. is a co-founder of Acurastem. D.H.G has served as a consultant for Acurastem, Axial Biosciences, and Roche
References
- Akizuki M, Yamashita H, Uemura K, Maruyama H, Kawakami H, Ito H, and Takahashi R (2013). Optineurin suppression causes neuronal cell death via NF-kappaB pathway. J Neurochem 126, 699–704. [DOI] [PubMed] [Google Scholar]
- Ash PE, Bieniek KF, Gendron TF, Caulfield T, Lin WL, Dejesus-Hernandez M, van Blitterswijk MM, Jansen-West K, Paul JW 3rd, Rademakers R, et al. (2013). Unconventional translation of C9ORF72 GGGGCC expansion generates insoluble polypeptides specific to c9FTD/ALS. Neuron 77, 639–646. [DOI] [PMC free article] [PubMed] [Google Scholar]
- Bae BI, Xu H, Igarashi S, Fujimuro M, Agrawal N, Taya Y, Hayward SD, Moran TH, Montell C, Ross CA, et al. (2005). p53 mediates cellular dysfunction and behavioral abnormalities in Huntington’s disease. Neuron 47, 29–41. [DOI] [PubMed] [Google Scholar]
- Barbosa LF, Cerqueira FM, Macedo AF, Garcia CC, Angeli JP, Schumacher RI, Sogayar MC, Augusto O, Carri MT, Di Mascio P, et al. (2010). Increased SOD1 association with chromatin, DNA damage, p53 activation, and apoptosis in a cellular model of SOD1-linked ALS. Biochim Biophys Acta 1802, 462–471. [DOI] [PubMed] [Google Scholar]
- Barry S, Baird G, Lascelles K, Bunton P, and Hedderly T (2011). Neurodevelopmental movement disorders - an update on childhood motor stereotypies. Dev Med Child Neurol 53, 979–985. [DOI] [PubMed] [Google Scholar]
- Belzil VV, Katzman RB, and Petrucelli L (2016). ALS and FTD: an epigenetic perspective. Acta Neuropathol 132, 487–502. [DOI] [PMC free article] [PubMed] [Google Scholar]
- Berson A, Sartoris A, Nativio R, Van Deerlin V, Toledo JB, Porta S, Liu S, Chung CY, Garcia BA, Lee VM, et al. (2017). TDP-43 Promotes Neurodegeneration by Impairing Chromatin Remodeling. Curr Biol 27, 3579–3590 e3576. [DOI] [PMC free article] [PubMed] [Google Scholar]
- Boehme KA, and Blattner C (2009). Regulation of p53--insights into a complex process. Crit Rev Biochem Mol Biol 44, 367–392. [DOI] [PubMed] [Google Scholar]
- Brady CA, and Attardi LD (2010). p53 at a glance. J Cell Sci 123, 2527–2532. [DOI] [PMC free article] [PubMed] [Google Scholar]
- Brady CA, Jiang D, Mello SS, Johnson TM, Jarvis LA, Kozak MM, Kenzelmann Broz D, Basak S, Park EJ, McLaughlin ME, et al. (2011). Distinct p53 transcriptional programs dictate acute DNA-damage responses and tumor suppression. Cell 145, 571–583. [DOI] [PMC free article] [PubMed] [Google Scholar]
- Buenrostro JD, Giresi PG, Zaba LC, Chang HY, and Greenleaf WJ (2013). Transposition of native chromatin for fast and sensitive epigenomic profiling of open chromatin, DNA-binding proteins and nucleosome position. Nat Methods 10, 1213–1218. [DOI] [PMC free article] [PubMed] [Google Scholar]
- Buenrostro JD, Wu B, Chang HY, and Greenleaf WJ (2015). ATAC-seq: A Method for Assaying Chromatin Accessibility Genome-Wide. Curr Protoc Mol Biol 109, 21 29 21–21 29 29. [DOI] [PMC free article] [PubMed] [Google Scholar]
- Chesi A, Staahl BT, Jovicic A, Couthouis J, Fasolino M, Raphael AR, Yamazaki T, Elias L, Polak M, Kelly C, et al. (2013). Exome sequencing to identify de novo mutations in sporadic ALS trios. Nat Neurosci 16, 851–855. [DOI] [PMC free article] [PubMed] [Google Scholar]
- Chew J, Gendron TF, Prudencio M, Sasaguri H, Zhang YJ, Castanedes-Casey M, Lee CW, Jansen-West K, Kurti A, Murray ME, et al. (2015). Neurodegeneration. C9ORF72 repeat expansions in mice cause TDP-43 pathology, neuronal loss, and behavioral deficits. Science 348, 1151–1154. [DOI] [PMC free article] [PubMed] [Google Scholar]
- Cobos SN, Bennett SA, and Torrente MP (2019). The impact of histone post-translational modifications in neurodegenerative diseases. Biochim Biophys Acta Mol Basis Dis 1865, 1982–1991. [DOI] [PMC free article] [PubMed] [Google Scholar]
- Cooper-Knock J, Walsh MJ, Higginbottom A, Robin Highley J, Dickman MJ, Edbauer D, Ince PG, Wharton SB, Wilson SA, Kirby J, et al. (2014). Sequestration of multiple RNA recognition motif-containing proteins by C9orf72 repeat expansions. Brain 137, 2040–2051. [DOI] [PMC free article] [PubMed] [Google Scholar]
- Corces MR, Trevino AE, Hamilton EG, Greenside PG, Sinnott-Armstrong NA, Vesuna S, Satpathy AT, Rubin AJ, Montine KS, Wu B, et al. (2017). An improved ATAC-seq protocol reduces background and enables interrogation of frozen tissues. Nat Methods 14, 959–962. [DOI] [PMC free article] [PubMed] [Google Scholar]
- Cornwell M, Vangala M, Taing L, Herbert Z, Koster J, Li B, Sun H, Li T, Zhang J, Qiu X, et al. (2018). VIPER: Visualization Pipeline for RNA-seq, a Snakemake workflow for efficient and complete RNA-seq analysis. BMC Bioinformatics 19, 135. [DOI] [PMC free article] [PubMed] [Google Scholar]
- Coyne AN, Zaepfel BL, Hayes L, Fitchman B, Salzberg Y, Luo EC, Bowen K, Trost H, Aigner S, Rigo F, et al. (2020). G4C2 Repeat RNA Initiates a POM121-Mediated Reduction in Specific Nucleoporins in C9orf72 ALS/FTD. Neuron 107, 1124–1140 e1111. [DOI] [PMC free article] [PubMed] [Google Scholar]
- Culmsee C, and Mattson MP (2005). p53 in neuronal apoptosis. Biochem Biophys Res Commun 331, 761–777. [DOI] [PubMed] [Google Scholar]
- Davidson YS, Barker H, Robinson AC, Thompson JC, Harris J, Troakes C, Smith B, Al-Saraj S, Shaw C, Rollinson S, et al. (2014). Brain distribution of dipeptide repeat proteins in frontotemporal lobar degeneration and motor neurone disease associated with expansions in C9ORF72. Acta Neuropathol Commun 2, 70. [DOI] [PMC free article] [PubMed] [Google Scholar]
- de la Monte SM, Sohn YK, Ganju N, and Wands JR (1998). P53- and CD95-associated apoptosis in neurodegenerative diseases. Lab Invest 78, 401–411. [PubMed] [Google Scholar]
- de la Monte SM, Sohn YK, and Wands JR (1997). Correlates of p53- and Fas (CD95)-mediated apoptosis in Alzheimer’s disease. J Neurol Sci 152, 73–83. [DOI] [PubMed] [Google Scholar]
- Deisenroth C, Franklin DA, and Zhang Y (2016). The Evolution of the Ribosomal Protein-MDM2-p53 Pathway. Cold Spring Harb Perspect Med 6. [DOI] [PMC free article] [PubMed] [Google Scholar]
- DeJesus-Hernandez M, Mackenzie IR, Boeve BF, Boxer AL, Baker M, Rutherford NJ, Nicholson AM, Finch NA, Flynn H, Adamson J, et al. (2011). Expanded GGGGCC hexanucleotide repeat in noncoding region of C9ORF72 causes chromosome 9p-linked FTD and ALS. Neuron 72, 245–256. [DOI] [PMC free article] [PubMed] [Google Scholar]
- Dobin A, Davis CA, Schlesinger F, Drenkow J, Zaleski C, Jha S, Batut P, Chaisson M, and Gingeras TR (2013). STAR: ultrafast universal RNA-seq aligner. Bioinformatics 29, 15–21. [DOI] [PMC free article] [PubMed] [Google Scholar]
- Donnelly CJ, Zhang PW, Pham JT, Haeusler AR, Mistry NA, Vidensky S, Daley EL, Poth EM, Hoover B, Fines DM, et al. (2013). RNA toxicity from the ALS/FTD C9ORF72 expansion is mitigated by antisense intervention. Neuron 80, 415–428. [DOI] [PMC free article] [PubMed] [Google Scholar]
- Dull T, Zufferey R, Kelly M, Mandel RJ, Nguyen M, Trono D, and Naldini L (1998). A third-generation lentivirus vector with a conditional packaging system. J Virol 72, 8463–8471. [DOI] [PMC free article] [PubMed] [Google Scholar]
- el-Deiry WS, Tokino T, Velculescu VE, Levy DB, Parsons R, Trent JM, Lin D, Mercer WE, Kinzler KW, and Vogelstein B (1993). WAF1, a potential mediator of p53 tumor suppression. Cell 75, 817–825. [DOI] [PubMed] [Google Scholar]
- Eve DJ, Dennis JS, and Citron BA (2007). Transcription factor p53 in degenerating spinal cords. Brain Res 1150, 174–181. [DOI] [PubMed] [Google Scholar]
- Farg MA, Konopka A, Soo KY, Ito D, and Atkin JD (2017). The DNA damage response (DDR) is induced by the C9orf72 repeat expansion in amyotrophic lateral sclerosis. Hum Mol Genet 26, 2882–2896. [DOI] [PubMed] [Google Scholar]
- Fielder E, von Zglinicki T, and Jurk D (2017). The DNA Damage Response in Neurons: Die by Apoptosis or Survive in a Senescence-Like State? J Alzheimers Dis 60, S107–S131. [DOI] [PubMed] [Google Scholar]
- Gendron TF, Belzil VV, Zhang YJ, and Petrucelli L (2014). Mechanisms of toxicity in C9FTLD/ALS. Acta Neuropathol 127, 359–376. [DOI] [PMC free article] [PubMed] [Google Scholar]
- Gendron TF, Bieniek KF, Zhang YJ, Jansen-West K, Ash PE, Caulfield T, Daughrity L, Dunmore JH, Castanedes-Casey M, Chew J, et al. (2013). Antisense transcripts of the expanded C9ORF72 hexanucleotide repeat form nuclear RNA foci and undergo repeat-associated non-ATG translation in c9FTD/ALS. Acta Neuropathol 126, 829–844. [DOI] [PMC free article] [PubMed] [Google Scholar]
- Gitler AD, and Tsuiji H (2016). There has been an awakening: Emerging mechanisms of C9orf72 mutations in FTD/ALS. Brain Res 1647, 19–29. [DOI] [PMC free article] [PubMed] [Google Scholar]
- Greenleaf WJ (2015). Assaying the epigenome in limited numbers of cells. Methods 72, 51–56. [DOI] [PMC free article] [PubMed] [Google Scholar]
- Han J, Flemington C, Houghton AB, Gu Z, Zambetti GP, Lutz RJ, Zhu L, and Chittenden T (2001). Expression of bbc3, a pro-apoptotic BH3-only gene, is regulated by diverse cell death and survival signals. Proc Natl Acad Sci U S A 98, 11318–11323. [DOI] [PMC free article] [PubMed] [Google Scholar]
- He BP, and Strong MJ (2000). Motor neuronal death in sporadic amyotrophic lateral sclerosis (ALS) is not apoptotic. A comparative study of ALS and chronic aluminium chloride neurotoxicity in New Zealand white rabbits. Neuropathol Appl Neurobiol 26, 150–160. [DOI] [PubMed] [Google Scholar]
- Hengartner MO (2000). The biochemistry of apoptosis. Nature 407, 770–776. [DOI] [PubMed] [Google Scholar]
- Idelman G, Glaser T, Roberts CT Jr., and Werner H (2003). WT1-p53 interactions in insulin-like growth factor-I receptor gene regulation. J Biol Chem 278, 3474–3482. [DOI] [PubMed] [Google Scholar]
- Ito Y, Ofengeim D, Najafov A, Das S, Saberi S, Li Y, Hitomi J, Zhu H, Chen H, Mayo L, et al. (2016). RIPK1 mediates axonal degeneration by promoting inflammation and necroptosis in ALS. Science 353, 603–608. [DOI] [PMC free article] [PubMed] [Google Scholar]
- Jacks T, Remington L, Williams BO, Schmitt EM, Halachmi S, Bronson RT, and Weinberg RA (1994). Tumor spectrum analysis in p53-mutant mice. Curr Biol 4, 1–7. [DOI] [PubMed] [Google Scholar]
- Jeffers JR, Parganas E, Lee Y, Yang C, Wang J, Brennan J, MacLean KH, Han J, Chittenden T, Ihle JN, et al. (2003). Puma is an essential mediator of p53-dependent and -independent apoptotic pathways. Cancer Cell 4, 321–328. [DOI] [PubMed] [Google Scholar]
- Kastenhuber ER, and Lowe SW (2017). Putting p53 in Context. Cell 170, 1062–1078. [DOI] [PMC free article] [PubMed] [Google Scholar]
- Kim G, Gautier O, Tassoni-Tsuchida E, Ma XR, and Gitler AD (2020). ALS Genetics: Gains, Losses, and Implications for Future Therapies. Neuron. [DOI] [PMC free article] [PubMed]
- Kim JS, Lee C, Bonifant CL, Ressom H, and Waldman T (2007). Activation of p53-dependent growth suppression in human cells by mutations in PTEN or PIK3CA. Mol Cell Biol 27, 662–677. [DOI] [PMC free article] [PubMed] [Google Scholar]
- Kitamura Y, Shimohama S, Kamoshima W, Matsuoka Y, Nomura Y, and Taniguchi T (1997). Changes of p53 in the brains of patients with Alzheimer’s disease. Biochem Biophys Res Commun 232, 418–421. [DOI] [PubMed] [Google Scholar]
- Kitazumi I, and Tsukahara M (2011). Regulation of DNA fragmentation: the role of caspases and phosphorylation. FEBS J 278, 427–441. [DOI] [PubMed] [Google Scholar]
- Kramer NJ, Haney MS, Morgens DW, Jovicic A, Couthouis J, Li A, Ousey J, Ma R, Bieri G, Tsui CK, et al. (2018). CRISPR-Cas9 screens in human cells and primary neurons identify modifiers of C9ORF72 dipeptide-repeat-protein toxicity. Nat Genet 50, 603–612. [DOI] [PMC free article] [PubMed] [Google Scholar]
- Kubbutat MH, Jones SN, and Vousden KH (1997). Regulation of p53 stability by Mdm2. Nature 387, 299–303. [DOI] [PubMed] [Google Scholar]
- Kuntz C.t., Kinoshita Y, Beal MF, Donehower LA, and Morrison RS (2000). Absence of p53: no effect in a transgenic mouse model of familial amyotrophic lateral sclerosis. Exp Neurol 165, 184–190. [DOI] [PubMed] [Google Scholar]
- Kwon I, Xiang S, Kato M, Wu L, Theodoropoulos P, Wang T, Kim J, Yun J, Xie Y, and McKnight SL (2014). Poly-dipeptides encoded by the C9orf72 repeats bind nucleoli, impede RNA biogenesis, and kill cells. Science 345, 1139–1145. [DOI] [PMC free article] [PubMed] [Google Scholar]
- Langfelder P, and Horvath S (2008). WGCNA: an R package for weighted correlation network analysis. BMC Bioinformatics 9, 559. [DOI] [PMC free article] [PubMed] [Google Scholar]
- Langmead B, and Salzberg SL (2012). Fast gapped-read alignment with Bowtie 2. Nat Methods 9, 357–359. [DOI] [PMC free article] [PubMed] [Google Scholar]
- Law JC, Ritke MK, Yalowich JC, Leder GH, and Ferrell RE (1993). Mutational inactivation of the p53 gene in the human erythroid leukemic K562 cell line. Leuk Res 17, 1045–1050. [DOI] [PubMed] [Google Scholar]
- Lee YB, Chen HJ, Peres JN, Gomez-Deza J, Attig J, Stalekar M, Troakes C, Nishimura AL, Scotter EL, Vance C, et al. (2013). Hexanucleotide repeats in ALS/FTD form length-dependent RNA foci, sequester RNA binding proteins, and are neurotoxic. Cell Rep 5, 1178–1186. [DOI] [PMC free article] [PubMed] [Google Scholar]
- Levine AJ, and Oren M (2009). The first 30 years of p53: growing ever more complex. Nat Rev Cancer 9, 749–758. [DOI] [PMC free article] [PubMed] [Google Scholar]
- Liao Y, Smyth GK, and Shi W (2014). featureCounts: an efficient general purpose program for assigning sequence reads to genomic features. Bioinformatics 30, 923–930. [DOI] [PubMed] [Google Scholar]
- Ling SC, Polymenidou M, and Cleveland DW (2013). Converging mechanisms in ALS and FTD: disrupted RNA and protein homeostasis. Neuron 79, 416–438. [DOI] [PMC free article] [PubMed] [Google Scholar]
- Lopez-Gonzalez R, Lu Y, Gendron TF, Karydas A, Tran H, Yang D, Petrucelli L, Miller BL, Almeida S, and Gao FB (2016). Poly(GR) in C9ORF72-Related ALS/FTD Compromises Mitochondrial Function and Increases Oxidative Stress and DNA Damage in iPSC-Derived Motor Neurons. Neuron 92, 383–391. [DOI] [PMC free article] [PubMed] [Google Scholar]
- Lopez-Gonzalez R, Yang D, Pribadi M, Kim TS, Krishnan G, Choi SY, Lee S, Coppola G, and Gao FB (2019). Partial inhibition of the overactivated Ku80-dependent DNA repair pathway rescues neurodegeneration in C9ORF72-ALS/FTD. Proc Natl Acad Sci U S A 116, 9628–9633. [DOI] [PMC free article] [PubMed] [Google Scholar]
- Love MI, Huber W, and Anders S (2014). Moderated estimation of fold change and dispersion for RNA-seq data with DESeq2. Genome Biol 15, 550. [DOI] [PMC free article] [PubMed] [Google Scholar]
- Lowe SW, Schmitt EM, Smith SW, Osborne BA, and Jacks T (1993). p53 is required for radiation-induced apoptosis in mouse thymocytes. Nature 362, 847–849. [DOI] [PubMed] [Google Scholar]
- Lu J, Periz G, Lu YN, Tang Q, Liu Y, Zhang T, Shah Y, Thombre R, Aljumaah R, Li W, et al. (2019). L3MBTL1 regulates ALS/FTD-associated proteotoxicity and quality control. Nat Neurosci 22, 875–886. [DOI] [PMC free article] [PubMed] [Google Scholar]
- Mackenzie IR, Frick P, Grasser FA, Gendron TF, Petrucelli L, Cashman NR, Edbauer D, Kremmer E, Prudlo J, Troost D, et al. (2015). Quantitative analysis and clinico-pathological correlations of different dipeptide repeat protein pathologies in C9ORF72 mutation carriers. Acta Neuropathol 130, 845–861. [DOI] [PubMed] [Google Scholar]
- Maor-Nof M, Homma N, Raanan C, Nof A, Hirokawa N, and Yaron A (2013). Axonal pruning is actively regulated by the microtubule-destabilizing protein kinesin superfamily protein 2A. Cell Rep 3, 971–977. [DOI] [PubMed] [Google Scholar]
- Maor-Nof M, Romi E, Sar Shalom H, Ulisse V, Raanan C, Nof A, Leshkowitz D, Lang R, and Yaron A (2016). Axonal Degeneration Is Regulated by a Transcriptional Program that Coordinates Expression of Pro- and Anti-degenerative Factors. Neuron 92, 991–1006. [DOI] [PubMed] [Google Scholar]
- Martin LJ (2000). p53 is abnormally elevated and active in the CNS of patients with amyotrophic lateral sclerosis. Neurobiol Dis 7, 613–622. [DOI] [PubMed] [Google Scholar]
- Martin LJ (2007). Transgenic mice with human mutant genes causing Parkinson’s disease and amyotrophic lateral sclerosis provide common insight into mechanisms of motor neuron selective vulnerability to degeneration. Rev Neurosci 18, 115–136. [DOI] [PubMed] [Google Scholar]
- Martin LJ, and Wong M (2013). Aberrant regulation of DNA methylation in amyotrophic lateral sclerosis: a new target of disease mechanisms. Neurotherapeutics 10, 722–733. [DOI] [PMC free article] [PubMed] [Google Scholar]
- Meek DW, and Anderson CW (2009). Posttranslational modification of p53: cooperative integrators of function. Cold Spring Harb Perspect Biol 1, a000950. [DOI] [PMC free article] [PubMed] [Google Scholar]
- Mizielinska S, Gronke S, Niccoli T, Ridler CE, Clayton EL, Devoy A, Moens T, Norona FE, Woollacott IOC, Pietrzyk J, et al. (2014). C9orf72 repeat expansions cause neurodegeneration in Drosophila through arginine-rich proteins. Science 345, 1192–1194. [DOI] [PMC free article] [PubMed] [Google Scholar]
- Morgens DW, Deans RM, Li A, and Bassik MC (2016). Systematic comparison of CRISPR/Cas9 and RNAi screens for essential genes. Nat Biotechnol 34, 634–636. [DOI] [PMC free article] [PubMed] [Google Scholar]
- Morgens DW, Wainberg M, Boyle EA, Ursu O, Araya CL, Tsui CK, Haney MS, Hess GT, Han K, Jeng EE, et al. (2017). Genome-scale measurement of off-target activity using Cas9 toxicity in high-throughput screens. Nat Commun 8, 15178. [DOI] [PMC free article] [PubMed] [Google Scholar]
- Mori K, Lammich S, Mackenzie IR, Forne I, Zilow S, Kretzschmar H, Edbauer D, Janssens J, Kleinberger G, Cruts M, et al. (2013a). hnRNP A3 binds to GGGGCC repeats and is a constituent of p62-positive/TDP43-negative inclusions in the hippocampus of patients with C9orf72 mutations. Acta Neuropathol 125, 413–423. [DOI] [PubMed] [Google Scholar]
- Mori K, Weng SM, Arzberger T, May S, Rentzsch K, Kremmer E, Schmid B, Kretzschmar HA, Cruts M, Van Broeckhoven C, et al. (2013b). The C9orf72 GGGGCC repeat is translated into aggregating dipeptide-repeat proteins in FTLD/ALS. Science 339, 1335–1338. [DOI] [PubMed] [Google Scholar]
- Moyer SM, Larsson CA, and Lozano G (2017). Mdm proteins: critical regulators of embry ogenesis and homeostasis. J Mol Cell Biol. [DOI] [PMC free article] [PubMed]
- Nakano K, and Vousden KH (2001). PUMA, a novel proapoptotic gene, is induced by p53. Mol Cell 7, 683–694. [DOI] [PubMed] [Google Scholar]
- Neumann M, Sampathu DM, Kwong LK, Truax AC, Micsenyi MC, Chou TT, Bruce J, Schuck T, Grossman M, Clark CM, et al. (2006). Ubiquitinated TDP-43 in frontotemporal lobar degeneration and amyotrophic lateral sclerosis. Science 314, 130–133. [DOI] [PubMed] [Google Scholar]
- Ni JQ, Zhou R, Czech B, Liu LP, Holderbaum L, Yang-Zhou D, Shim HS, Tao R, Handler D, Karpowicz P, et al. (2011). A genome-scale shRNA resource for transgenic RNAi in Drosophila. Nat Methods 8, 405–407. [DOI] [PMC free article] [PubMed] [Google Scholar]
- Nikolayeva O, and Robinson MD (2014). edgeR for differential RNA-seq and ChIP-seq analysis: an application to stem cell biology. Methods Mol Biol 1150, 45–79. [DOI] [PubMed] [Google Scholar]
- Olive PL, and Banath JP (2006). The comet assay: a method to measure DNA damage in individual cells. Nat Protoc 1, 23–29. [DOI] [PubMed] [Google Scholar]
- Otsu N (1979). A Threshold Selection Method from Gray-Level Histograms. IEEE Transactions on Systems, Man, and Cybernetics 9, 62–66. [Google Scholar]
- Periz G, Lu J, Zhang T, Kankel MW, Jablonski AM, Kalb R, McCampbell A, and Wang J (2015). Regulation of protein quality control by UBE4B and LSD1 through p53-mediated transcription. PLoS Biol 13, e1002114. [DOI] [PMC free article] [PubMed] [Google Scholar]
- Potten CS, Wilson JW, and Booth C (1997). Regulation and significance of apoptosis in the stem cells of the gastrointestinal epithelium. Stem Cells 15, 82–93. [DOI] [PubMed] [Google Scholar]
- Qiu H, Lee S, Shang Y, Wang WY, Au KF, Kamiya S, Barmada SJ, Finkbeiner S, Lui H, Carlton CE, et al. (2014). ALS-associated mutation FUS-R521C causes DNA damage and RNA splicing defects. J Clin Invest 124, 981–999. [DOI] [PMC free article] [PubMed] [Google Scholar]
- Ranganathan S, and Bowser R (2010). p53 and Cell Cycle Proteins Participate in Spinal Motor Neuron Cell Death in ALS. Open Pathol J 4, 11–22. [DOI] [PMC free article] [PubMed] [Google Scholar]
- Re DB, Le Verche V, Yu C, Amoroso MW, Politi KA, Phani S, Ikiz B, Hoffmann L, Koolen M, Nagata T, et al. (2014). Necroptosis drives motor neuron death in models of both sporadic and familial ALS. Neuron 81, 1001–1008. [DOI] [PMC free article] [PubMed] [Google Scholar]
- Reimand J, Kull M, Peterson H, Hansen J, and Vilo J (2007). g:Profiler--a web-based toolset for functional profiling of gene lists from large-scale experiments. Nucleic Acids Res 35, W193–200. [DOI] [PMC free article] [PubMed] [Google Scholar]
- Renton AE, Majounie E, Waite A, Simon-Sanchez J, Rollinson S, Gibbs JR, Schymick JC, Laaksovirta H, van Swieten JC, Myllykangas L, et al. (2011). A hexanucleotide repeat expansion in C9ORF72 is the cause of chromosome 9p21-linked ALS-FTD. Neuron 72, 257–268. [DOI] [PMC free article] [PubMed] [Google Scholar]
- Ringshausen I, O’Shea CC, Finch AJ, Swigart LB, and Evan GI (2006). Mdm2 is critically and continuously required to suppress lethal p53 activity in vivo. Cancer Cell 10, 501–514. [DOI] [PubMed] [Google Scholar]
- Ritson GP, Custer SK, Freibaum BD, Guinto JB, Geffel D, Moore J, Tang W, Winton MJ, Neumann M, Trojanowski JQ, et al. (2010). TDP-43 mediates degeneration in a novel Drosophila model of disease caused by mutations in VCP/p97. J Neurosci 30, 7729–7739. [DOI] [PMC free article] [PubMed] [Google Scholar]
- Rogakou EP, Nieves-Neira W, Boon C, Pommier Y, and Bonner WM (2000). Initiation of DNA fragmentation during apoptosis induces phosphorylation of H2AX histone at serine 139. J Biol Chem 275, 9390–9395. [DOI] [PubMed] [Google Scholar]
- Saberi S, Stauffer JE, Jiang J, Garcia SD, Taylor AE, Schulte D, Ohkubo T, Schloffman CL, Maldonado M, Baughn M, et al. (2018). Sense-encoded poly-GR dipeptide repeat proteins correlate to neurodegeneration and uniquely co-localize with TDP-43 in dendrites of repeat-expanded C9orf72 amyotrophic lateral sclerosis. Acta Neuropathol 135, 459–474. [DOI] [PMC free article] [PubMed] [Google Scholar]
- Sakae N, Bieniek KF, Zhang YJ, Ross K, Gendron TF, Murray ME, Rademakers R, Petrucelli L, and Dickson DW (2018). Poly-GR dipeptide repeat polymers correlate with neurodegeneration and Clinicopathological subtypes in C9ORF72-related brain disease. Acta Neuropathol Commun 6, 63. [DOI] [PMC free article] [PubMed] [Google Scholar]
- Sareen D, O’Rourke JG, Meera P, Muhammad AK, Grant S, Simpkinson M, Bell S, Carmona S, Ornelas L, Sahabian A, et al. (2013). Targeting RNA foci in iPSC-derived motor neurons from ALS patients with a C9ORF72 repeat expansion. Sci Transl Med 5, 208ra149. [DOI] [PMC free article] [PubMed] [Google Scholar]
- Sathasivam S, Ince PG, and Shaw PJ (2001). Apoptosis in amyotrophic lateral sclerosis: a review of the evidence. Neuropathol Appl Neurobiol 27, 257–274. [DOI] [PubMed] [Google Scholar]
- Schep AN, Wu B, Buenrostro JD, and Greenleaf WJ (2017). chromVAR: inferring transcription-factor-associated accessibility from single-cell epigenomic data. Nat Methods 14, 975–978. [DOI] [PMC free article] [PubMed] [Google Scholar]
- Schludi MH, May S, Grasser FA, Rentzsch K, Kremmer E, Kupper C, Klopstock T, German Consortium for Frontotemporal Lobar, D., Bavarian Brain Banking, A., Arzberger T, et al. (2015). Distribution of dipeptide repeat proteins in cellular models and C9orf72 mutation cases suggests link to transcriptional silencing. Acta Neuropathol 130, 537–555. [DOI] [PMC free article] [PubMed] [Google Scholar]
- Shangary S, and Wang S (2009). Small-molecule inhibitors of the MDM2-p53 protein-protein interaction to reactivate p53 function: a novel approach for cancer therapy. Annu Rev Pharmacol Toxicol 49, 223–241. [DOI] [PMC free article] [PubMed] [Google Scholar]
- Shi Y, Lin S, Staats KA, Li Y, Chang WH, Hung ST, Hendricks E, Linares GR, Wang Y, Son EY, et al. (2018). Haploinsufficiency leads to neurodegeneration in C9ORF72 ALS/FTD human induced motor neurons. Nat Med 24, 313–325. [DOI] [PMC free article] [PubMed] [Google Scholar]
- Simon DJ, Pitts J, Hertz NT, Yang J, Yamagishi Y, Olsen O, Tesic Mark M, Molina H, and Tessier-Lavigne M (2016). Axon Degeneration Gated by Retrograde Activation of Somatic Pro-apoptotic Signaling. Cell 164, 1031–1045. [DOI] [PMC free article] [PubMed] [Google Scholar]
- Soussi T (2000). The p53 tumor suppressor gene: from molecular biology to clinical investigation. Ann N Y Acad Sci 910, 121–137; discussion 137–129. [DOI] [PubMed] [Google Scholar]
- Sturm M, Schroeder C, and Bauer P (2016). SeqPurge: highly-sensitive adapter trimming for paired-end NGS data. BMC Bioinformatics 17, 208. [DOI] [PMC free article] [PubMed] [Google Scholar]
- Szybinska A, and Lesniak W (2017). P53 Dysfunction in Neurodegenerative Diseases - The Cause or Effect of Pathological Changes? Aging Dis 8, 506–518. [DOI] [PMC free article] [PubMed] [Google Scholar]
- Tao Z, Wang H, Xia Q, Li K, Li K, Jiang X, Xu G, Wang G, and Ying Z (2015). Nucleolar stress and impaired stress granule formation contribute to C9orf72 RAN translation-induced cytotoxicity. Hum Mol Genet 24, 2426–2441. [DOI] [PubMed] [Google Scholar]
- Valente LJ, Gray DH, Michalak EM, Pinon-Hofbauer J, Egle A, Scott CL, Janic A, and Strasser A (2013). p53 efficiently suppresses tumor development in the complete absence of its cell-cycle inhibitory and proapoptotic effectors p21, Puma, and Noxa. Cell Rep 3, 1339–1345. [DOI] [PubMed] [Google Scholar]
- Van Nostrand JL, and Attardi LD (2014). Guilty as CHARGED: p53’s expanding role in disease. Cell Cycle 13, 3798–3807. [DOI] [PMC free article] [PubMed] [Google Scholar]
- Vassilev LT, Vu BT, Graves B, Carvajal D, Podlaski F, Filipovic Z, Kong N, Kammlott U, Lukacs C, Klein C, et al. (2004). In vivo activation of the p53 pathway by small-molecule antagonists of MDM2. Science 303, 844–848. [DOI] [PubMed] [Google Scholar]
- Villunger A, Michalak EM, Coultas L, Mullauer F, Bock G, Ausserlechner MJ, Adams JM, and Strasser A (2003). p53- and drug-induced apoptotic responses mediated by BH3-only proteins puma and noxa. Science 302, 1036–1038. [DOI] [PubMed] [Google Scholar]
- Vogt MA, Ehsaei Z, Knuckles P, Higginbottom A, Helmbrecht MS, Kunath T, Eggan K, Williams LA, Shaw PJ, Wurst W, et al. (2018). TDP-43 induces p53-mediated cell death of cortical progenitors and immature neurons. Sci Rep 8, 8097. [DOI] [PMC free article] [PubMed] [Google Scholar]
- Wang WY, Pan L, Su SC, Quinn EJ, Sasaki M, Jimenez JC, Mackenzie IR, Huang EJ, and Tsai LH (2013). Interaction of FUS and HDAC1 regulates DNA damage response and repair in neurons. Nat Neurosci 16, 1383–1391. [DOI] [PMC free article] [PubMed] [Google Scholar]
- Wen X, Tan W, Westergard T, Krishnamurthy K, Markandaiah SS, Shi Y, Lin S, Shneider NA, Monaghan J, Pandey UB, et al. (2014). Antisense proline-arginine RAN dipeptides linked to C9ORF72-ALS/FTD form toxic nuclear aggregates that initiate in vitro and in vivo neuronal death. Neuron 84, 1213–1225. [DOI] [PMC free article] [PubMed] [Google Scholar]
- White MR, Mitrea DM, Zhang P, Stanley CB, Cassidy DE, Nourse A, Phillips AH, Tolbert M, Taylor JP, and Kriwacki RW (2019). C9orf72 Poly(PR) Dipeptide Repeats Disturb Biomolecular Phase Separation and Disrupt Nucleolar Function. Mol Cell 74, 713–728 e716. [DOI] [PMC free article] [PubMed] [Google Scholar]
- Wils H, Kleinberger G, Janssens J, Pereson S, Joris G, Cuijt I, Smits V, Ceuterick-de Groote C, Van Broeckhoven C, and Kumar-Singh S (2010). TDP-43 transgenic mice develop spastic paralysis and neuronal inclusions characteristic of ALS and frontotemporal lobar degeneration. Proc Natl Acad Sci U S A 107, 3858–3863. [DOI] [PMC free article] [PubMed] [Google Scholar]
- Xu Z, Poidevin M, Li X, Li Y, Shu L, Nelson DL, Li H, Hales CM, Gearing M, Wingo TS, et al. (2013). Expanded GGGGCC repeat RNA associated with amyotrophic lateral sclerosis and frontotemporal dementia causes neurodegeneration. Proc Natl Acad Sci U S A 110, 7778–7783. [DOI] [PMC free article] [PubMed] [Google Scholar]
- Yamada S, Gendron T, Niccoli T, Genuth N, Grosely R, Shi Y, Glaria I, Kramer N, Nakayama L, Fang S, et al. (2019). RPS25 is required for efficient RAN translation of C9orf72 and other neurodegenerative disease-associated nucleotide repeats. Nature Neuroscience 22, 1. [DOI] [PMC free article] [PubMed] [Google Scholar]
- Yamazaki M, Esumi E, and Nakano I (2005). Is motoneuronal cell death in amyotrophic lateral sclerosis apoptosis? Neuropathology 25, 381–387. [DOI] [PubMed] [Google Scholar]
- Yang K, Yang J, and Yi J (2018). Nucleolar Stress: hallmarks, sensing mechanism and diseases. Cell Stress 2, 125–140. [DOI] [PMC free article] [PubMed] [Google Scholar]
- Yu J, Zhang L, Hwang PM, Kinzler KW, and Vogelstein B (2001). PUMA induces the rapid apoptosis of colorectal cancer cells. Mol Cell 7, 673–682. [DOI] [PubMed] [Google Scholar]
- Zhang K, Donnelly CJ, Haeusler AR, Grima JC, Machamer JB, Steinwald P, Daley EL, Miller SJ, Cunningham KM, Vidensky S, et al. (2015). The C9orf72 repeat expansion disrupts nucleocytoplasmic transport. Nature 525, 56–61. [DOI] [PMC free article] [PubMed] [Google Scholar]
- Zhang Y, Liu T, Meyer CA, Eeckhoute J, Johnson DS, Bernstein BE, Nusbaum C, Myers RM, Brown M, Li W, et al. (2008). Model-based analysis of ChIP-Seq (MACS). Genome Biol 9, R137. [DOI] [PMC free article] [PubMed] [Google Scholar]
- Zhang YJ, Guo L, Gonzales PK, Gendron TF, Wu Y, Jansen-West K, O’Raw AD, Pickles SR, Prudencio M, Carlomagno Y, et al. (2019). Heterochromatin anomalies and double-stranded RNA accumulation underlie C9orf72 poly(PR) toxicity. Science 363. [DOI] [PMC free article] [PubMed] [Google Scholar]
- Zhaunova L, Ohkura H, and Breuer M (2016). Kdm5/Lid Regulates Chromosome Architecture in Meiotic Prophase I Independently of Its Histone Demethylase Activity. PLoS Genet 12, e1006241. [DOI] [PMC free article] [PubMed] [Google Scholar]
- Zu T, Liu Y, Banez-Coronel M, Reid T, Pletnikova O, Lewis J, Miller TM, Harms MB, Falchook AE, Subramony SH, et al. (2013). RAN proteins and RNA foci from antisense transcripts in C9ORF72 ALS and frontotemporal dementia. Proc Natl Acad Sci U S A 110, E4968–4977. [DOI] [PMC free article] [PubMed] [Google Scholar]
Associated Data
This section collects any data citations, data availability statements, or supplementary materials included in this article.
Supplementary Materials
(A–J) Cortical WT primary neurons were cultured for 3 days and treated with either C9orf72 (PR)50 or TDP-43 for additional 24h, 48h or 72h or left untreated. (PR)50 levels were elevated at both 48h and 72h of (PR)50 treated neurons, as detected using the anti-Flag antibody (A–B). TDP-43 levels were elevated at 24h (C–D and E–F), 48h (C–D and G–H) and 72h (I–J) of TDP-43 treated neurons, as detected using the anti-Flag antibody (C) and a specific anti TDP-43 (E, G and I) antibody. Quantitation of (PR)50 and TDP-43 was determined by immunoblots and normalized to actin (B, D, F, H and J). Graphs show mean ± SEM (t test; *p < 0.05, **p < 0.01, N.S. not significant).
(A) Table with all the ATAC-seq samples used in this study.
(B–C) Quality check for the ATACseq samples presented here is one example, (PR)50 at 60h. Insert size distribution (B) and transcription start site enrichment around Refseq annotated genes(C).
(D–E) PCA analysis of all merged peaks provides an overall visualization of the data, emphasizing the variation and brings out strong patterns. PC1 vs PC2 show that PC1 (21% of the variability) is associated with time, while PC2 (12% of the variability) is associated with the different treatments (D). PC2 Vs PC3 emphasizes the variation in between the different treatments over time (E).
(F) Pearson correlation between the counts of all merged peaks.
(G–I) MA Plots of (PR)50 vs GFP treated neurons, from 20, 40 and 60h post treatment. Small changes in ATAC-seq start appearing at 40h but the majority of changes are around 60h post treatment.
(J–L) MA Plots of TDP-43 vs GFP treated neurons, from 20, 40 and 60h post treatment.
(A–B) PCA analysis of all transcripts is used to visualize the data and show an overall view of the data. (A)PC1 vs PC2 show that PC1 (61.21% of the variability) is associated with time, while PC2 (16.86% of the variability) is associated with the different treatments. (B) PC2 Vs PC3 emphasizes the variation in between the different treatments over time.
(C) KEGG pathway gene ontology enrichment of clusters 3–6 of the K-means clustering analysis (Figure 2C).
(D–F) Average linkage hierarchical clustering using the topological overlap metric for co-expression dissimilarity. (D) Modules were identified from this dendrogram. Correlations for each gene to covariates are delineated below the dendrogram (blue, negative; red, positive). Modules are labelled with colors. The grey module represents genes that are not co-expressed and was not evaluated in further comparisons. (E) Module-trait associations as computed by a linear model with four contrasts: 60h vs 40h, GFP vs Control, (PR)50 vs GFP + Control, and TDP-43 vs GFP + Control. Only p-values with a Bonferroni-corrected value < 0.05 are shown. (F) Enrichments for all of the co-expression modules with a list of p53 target genes. FDR corrected p-values are shown in parentheses.
(A) Two specific p53 antibodies were detected after (PR)50 treated WT neurons while absent in the p53 KO neurons.
(B–D) Cortical neurons from p53 KO embryos or their WT littermates were cultured for 3 days and either treated with (PR)50 or left untreated for 48h. 5 mg/ml cycloheximide or DMSO for control were added for additional 24h, followed by lysis and immunoblotting. Elevated p53 levels were detected in the presence of the protein inhibitor cycloheximide (B–C), while for puma this increase was completely blocked (B and D). Quantitation of p53 and puma was determined by immunoblots and normalized to actin (C and D). Graphs show mean ± SEM (t test; ****p < 0.0001, N.S. not significant).
(E–H) Cortical neurons from p53 KO embryos or their WT littermates were cultured for 3 days and either left untreated or treated with (PR)50 (E) or TDP-43 (G) and monitored using live cell imaging. WT cortical neurons were fragmented after (PR)50 and TDP-43. The p53 KO cortical neurons and axons were completely protected from any degradation after (PR)50 (E) but not TDP-43 (G) treatment. Axonal integrity (mean index) was calculated by measuring the slope of the degradation rate for each genotype and condition (F and H), as described in the Supplemental Experimental Procedures (t test; ***p < 0.001, N.S. not significant). Scale bars, 150 μm.
(I–J) Puma ablation protects neurons from (PR)50 toxicity. Cortical neurons from Puma KO embryos or their WT littermates were cultured for 3 days and either left untreated or treated with (PR)50 and monitored using live cell imaging (I). WT cortical neurons were fragmented after (PR)50. The Puma KO cortical neurons and axons were protected for the duration of 120h after (PR)50 treatment. Axonal integrity (mean index) was calculated by measuring the slope of the degradation rate for each genotype and condition (J), as described in the Supplemental Experimental Procedures (t test; **p < 0.01). Scale bar, 150 μm.
(A–B) WT cortical neurons were cultured for 3 days and treated with (PR)50 for additional 72h. Neurons were then either treated within the first 24h or after 24h of (PR)50 induction with siRNA against p53 or non-targeting control and immunostained for tubulin βIII. p53 siRNA addition within the first 24h of (PR)50 treatment protected against axonal degeneration (A). The extent of microtubule depolymerization (mean index) was calculated for each condition (B), as described in the Supplemental Experimental Procedures (t test; ****p < 0.0001). Scale bar, 100 μm.
(C–E) Cortical neurons from p53 KO embryos or their WT littermates were cultured for one day and 100nM FUdR was added for 8h. Following this treatment, no glial cells were present as detected by GFAP immunostainings (C). Axonal microtubules (MTs) of the WT cortical neurons were depolymerized and degraded after (PR)50. The p53 KO cortical neurons and axons were completely protected from any degradation after (PR)50 treatment (D). The extent of microtubule depolymerization (mean index) was calculated for each genotype and condition (E), as described in the Supplemental Experimental Procedures (t test; ****p < 0.0001, N.S. not significant). Scale bar, 100 μm.
(A–B) p53 shRNA lentiviral transduction decreases p53 levels in iPSC-derived neurons differentiated from two independent C9orf72 mutation carriers. Quantification of p53 levels by immunoblotting and normalized to actin. Graphs show mean ± SEM (t test; *p < 0.05).
(C–F) Relative p53 RNA expression in iMNs treated with 9 μM negative control or p53 ASOs for 24 hours, as determined by RT-PCR. (C) Mean +/−s.e.m., One-way ANOVA. n = 4 biological replicates per group. * p<0.05. The c9ALS patient-derived iMNs showed reduced survival (D). Survival of CTRL iMNs was not affected by p53 ASO treatment; log rank Mantel-Cox test; n=3 independent iMN lines with n=195 iMNs per condition per treatment; **p < 0.01, N.S. not significant (E–F).
(A) Newborn pups from p53 heterozygous x heterozygous crosses were injected with GFP.
(B) Viability of p53 KO mice (n=14) monitored for a total of 211 days.
(C) Kaplan-Meier survival curves comparing survival of WT (n = 8), p53 heterozygous (n=15) and p53 KO (n=5) TDP-43 transgenic mice. Curves were compared by log rank test and effect size was estimated by a Cox proportional hazards model (HR).
(D–E) Nucleocytoplasmic fractioning of mouse brain tissue. p53 were detected in WT nuclear fraction, reduced in p53 heterozygous and ablated in p53 KO mice (D). Samples were collected at P22. Quantitation of p53 was determined by immunoblots and normalized to actin (E). Graphs show mean ± SEM (one-way ANOVA; *p < 0.05, **p < 0.01).
(F–H) Immunofluorescence staining of WT and p53 KO 3-weeks-old mice show no activation in GFP expressing cells (G), whereas strong p53 activation in the cortex (H) of WT GFP-(PR)50 expressing cells. Three mice per each genotype and condition were quantified (F) as described in the Supplemental Experimental Procedures and the values of p53-expressing cells are plotted (one-way ANOVA; **p < 0.01, N.S. not significant). Scale bars, 200 μm.
Data Availability Statement
The datasets generated during this study are available at (GEO, https://www.ncbi.nlm.nih.gov/geo/query/acc.cgi?acc=GSE162048).
All code generated during this study for the ATACseq and RNAseq analysis are available at (https://github.com/zshipony/Maor_Nof_2020). All algorithms and code generated for image processing are available at (https://github.com/nofaviv/Axonal_Quantification, https://github.com/nofaviv/Axonal_Degeneration, https://github.com/nofaviv/Cells_CoLocalization).