

Abstract
Objective
To investigate the effects of leptin on different T‐cell populations, in order to gain more insight into the link between leptin and obesity.
Methods
Three hundred and nine RRMS patients and 322 controls participated in a cross‐sectional survey, to confirm whether excess weight/obesity in adolescence or early adulthood increased the risk of MS. Serum leptin levels were determined by ELISA. MBP83–102, and MOG63–87 peptide‐specific T cells lines were expanded from peripheral blood mononuclear cells. Leptin receptor expression was measured by RT‐PCR and flow cytometry. Bcl‐2, p‐STAT3, pERK1/2, and p27kip1 expression were assayed using ELISA, and apoptosis induction was determined by Annexin V detection. Cytokines were assessed by ELISPOT and ELISA, and regulatory T cells (Tregs) by flow cytometry.
Results
Logistic regression analysis, showed excess weight at age 15, and obesity at 20 years of age increased MS risk (OR = 2.16, P = 0.01 and OR = 3.9, P = 0.01). Leptin levels correlated with BMI in both groups. The addition of Leptin increased autoreactive T‐cell proliferation, reduced apoptosis induction, and promoted proinflammatory cytokine secretion. Obese patients produced more proinflammatory cytokines compared to overweight/normal/underweight subjects. Inverse correlation was found between leptin levels and circulating Treg cells (r = −0.97, P < 0.0001). Leptin inhibited Treg proliferation. Effects of leptin on CD4+CD25− effector T cells were mediated by increased STAT3 and ERK1/2 phosphorylation, and down modulation of the cell cycle inhibitor P27kip1. In contrast, leptin effects on Tregs resulted from decreased phosphorylation of ERK1/2 and upregulation of p27kip1.
Interpretation
Leptin promotes autoreactive T‐cell proliferation and proinflammatory cytokine secretion, but inhibits Treg‐cell proliferation.
Introduction
Multiple Sclerosis (MS) is a chronic inflammatory disease of the central nervous system (CNS) leading to demyelination, and neurodegeneration. Although its pathogenesis is not yet fully understood, there is considerable evidence to suggest that MS arises from complex interactions between genetic susceptibility and environmental factors. 1 , 2 , 3 In recent decades, population‐based studies indicate a significance increase in prevalence and incidence of MS worldwide, particularly in females. 4 , 5 , 6 Given the short time over which these changes have occurred, an increase in MS prevalence cannot be explained by genetic factors alone, highlighting the role of environment and lifestyle‐related factors. The prevalence of obesity has also dramatically increased in recent decades as a result of more sedentary habits and changes in dietary trends. 7 This synchronous rise in prevalence of both MS and obesity has led to a search for possible biological mechanisms underlying the association. Prospective as well as case–control studies have already shown a link between increased body mass index (BMI) in childhood and adolescence and higher risk of developing MS. 8 , 9 , 10 , 11
Obesity induces a chronic low‐grade inflammatory state characterized by altered secretion of adipokines, and systemic polarization of innate and adaptive immune cells. Notably, a large number of studies have established a significant correlation between obesity and higher prevalence, or worse prognosis, of several immune‐mediated conditions including: rheumatoid arthritis, systemic lupus erythematosus, inflammatory bowel diseases, type‐1‐diabetes, psoriasis, and MS. 12
Leptin is the forerunner and best‐characterized member of the adipokine family. Encoded by the LEP gene (human homolog of murine ob gene), leptin is mainly produced by adipocytes, making levels mostly dependent on BMI. Its physiological activity is exerted through a member of the class I cytokine receptor family (LEPR or Ob‐R), 13 The receptor plays a critical role in regulating body weight through inhibition of food intake and energy consumption increase, by inducing anorexigenic factors and suppressing orexigenic neuropeptides in the hypothalamus. 14 , 15 However, leptin is also involved in the regulation of autoimmune and inflammatory processes, suggesting a link between metabolism and immune response. 16 , 17
This study evaluates the effects of leptin on myelin‐specific T cells and regulatory T cells, in an attempt to gain further insight into the mechanisms linking obesity and MS.
Methods
Patient selection and study design
In the initial phase of the study, 309 patients with the diagnosis of clinically definite relapsing‐remitting MS according to the 2010 McDonald criteria, 18 regularly followed at a referral tertiary center in Buenos Aires, Argentina, were invited to participate in a cross‐sectional survey to examine whether excess weight or obesity in adolescence, or adulthood were associated with increased risk of MS. Patients received an online or printed survey and were required to provide information on their height and weight at 15 and at 20 years of age, as well as at the time of enrollment in the study. Participants who were overweight or obese in adolescence or as adults were identified based on BMI, calculated as weight (in kilograms) divided by height (in meters squared). Three hundred and twenty‐two age and gender‐matched healthy controls also provided biometric data, from which BMI was estimated. Patients were categorized according to WHO definition of BMI 19 as follows: underweight < 18.5 kg/m2; normal weight 18.5 to <25 kg/m2; overweight 25.0 to <30 kg/m2; and obese > 30 kg/m2.
In addition, patients were asked to select the body type (of 9 male or female silhouettes from the Stunkard’s figure rating scale) 20 that best resembled their own at 15 and at 20 years of age. Demographic characteristics of MS patients and controls for different weight categories are summarized in Table 1.
Table 1.
Demographic characteristics of MS patients and controls for different weight categories.
| Normal/underweight | Overweight | Obesity | Total | |
|---|---|---|---|---|
| MS patients | ||||
| Cases (n) | 162 | 90 | 57 | 309 |
| Number women | 140 | 53 | 36 | 229 |
| Age (years) a | 39 ± 11 | 44.4 ± 11 | 43.2 ± 11 | 41 ± 11 |
| Smokers (%) | 47 | 46 | 57 | 49 |
| EDSS b (median) | 1 (0–7.5) | 1 (0–6) | 2 (0–3.5) | 1 (0–7.5) |
| Controls | ||||
| Cases (n) | 145 | 108 | 69 | 322 |
| Number women | 126 | 71 | 50 | 247 |
| Age (years) a | 41 ± 12 | 42 ± 12 | 49.2 ± 12 | 41 ± 12 |
| Smokers (%) | 36 | 38 | 40 | 36 |
Values are expressed as mean ± SD.
Expanded Disability Status Scale.
Because leptin levels strongly correlate with both BMI and total fat, 21 and because individuals with established MS have been shown to have elevated leptin levels, 22 we analyzed the impact of leptin on T‐cell function. Ninety patients with clinically definite relapsing‐remitting MS according to McDonald criteria 2010 18 and normal weight (18.5 to <25 kg/m2) were studied during remission. None had received steroids, or dietary supplements for at least 6 months prior to study entry, and all were naïve to treatment with disease‐modifying therapies (DMT). All patients lived in the city of Buenos Aires (latitude 34°S, longitude 58°W). Ninety healthy individuals, selected to match patients with respect to place of residence, race/ethnicity, age, and gender, not taking any regular medication, or dietary supplements, served as controls. Thorough clinical and neurological examination as well as standard chemical and hematological laboratory examinations ruled out the presence of underlying disorders in all subjects. Demographic and clinical characteristics of patients included in this second part of the study as well as of control subjects are shown in Table 2.
Table 2.
Demographic and clinical characteristics of the study population.
| Characteristics | MS patients | Controls |
|---|---|---|
| Female sex (%) | 66 (73) | 67 (74) |
| Age (years) a | 39 (10) | 41 (9.7) |
| Duration of disease (years) a | 5.3 (2.80) | – |
| EDSS b score a | 2.5 (1.1) | – |
| Annual relapse rate 2 years before entry a | 0.7 (0.44) | – |
Values are expressed as mean ± SD.
Expanded Disability Status Scale.
The study protocol was approved by the Institutional Ethics Committee and written informed consent was obtained from all participants.
Determination of serum leptin levels
Serum samples were drawn between 8 and 10 am, and leptin levels were measured using a commercially available ELISA kit, following manufacturer instructions (R&D Systems, Minneapolis, MN). Assay sensitivity was as follows: 8 pg/mL. Intra and interassay variation coefficients were <7% and 6.5%, respectively.
Isolation of MBP‐ and MOG‐peptide‐specific T‐cell lines
MBP83–102 (ADPGSRPHLIRLFSRDAPGR), and MOG63–87 (PEYRGRTELLKDAIGEGKVTLRIRN) peptide‐specific T‐cell lines were expanded from peripheral blood, as previously described. 23 Briefly, 5 × 10⁶ peripheral blood mononuclear cells (PBMC) were isolated from heparinized peripheral blood by Ficoll/Hypaque (Sigma‐Aldrich, St Louis, MO) density gradient. To establish MBP‐ and MOG‐peptide‐specific T‐cell lines, PBMCs were resuspended in complete culture medium (RPMI 1640 containing 2 mmol/L l‐glutamine, 100 U/mL penicillin, 100 µg/mL streptomycin, all from JRH Biosciences) and 5% heat‐inactivated fetal bovine serum (Thermo Fisher, Whaltman , MA), to a final concentration of 1 × 10⁶ cells/mL, and stimulated with optimal concentrations of synthetic MBP83–102 or MOG63–87 peptides (10 µg/mL). Optimal peptide concentration was determined in preliminary titration experiments. After 5–7 days, cells were expanded in the fresh medium containing 50 U/mL of rh‐IL‐2 (R&D Systems) for an additional week. Cultures were then submitted to alternating cycles of weekly restimulation and expansion until antigen (Ag) specificity was evident in proliferation assays. Restimulation was accomplished in the presence of the specific peptide and autologous irradiated (3000 rad) PBMCs, as antigen‐presenting cells (APC), whereas expansion occurred in the presence of 50 U/mL rhIL‐2. Cut‐off value for positive response was set at stimulation index > 3 (Fig. S1). Following the same protocol, specific T‐cell lines were generated by stimulation of PBMCs with 5 µg/mL of Tetanus toxoid (Accurate Chemicals, Westbury, NY), and influenza hemagglutinin307–319 peptide (10 µg/mL).
For specific T‐helper‐cell polarization, CD4+ T cells were isolated from fresh PBMCs by magnetic separation with a CD4+ isolation kit (Miltenyi Biotec, Bergisch Gladbach, Germany). Separation monitored by flow cytometry analysis demonstrated >97% purity. For Th1 differentiation, naive CD4+ T cells were stimulated with PHA (1 µg/mL; Sigma –Aldrich) in the presence of IL‐12 (2 ng/mL; BD Biosciences, San Diego, CA), plus anti‐IL‐4 (100 ng/mL; BD Biosciences). For Th17 differentiation, naive CD4 + T cells were stimulated for 5 days (Betelli et al., Nature 2006) with plate‐bound anti‐CD3 (5 µg/mL; clone HIT3a; BD Biosciences) and soluble anti‐CD28 (1 µg/mL; clone 28.2 BD Biosciences), in the presence of TGF‐β (3 ng/mL), IL‐6 (20 ng/mL), and IL‐23 (20 ng/mL), all from R&D Systems; and neutralizing antibodies anti‐IL4 (10 µg/mL; clone MP4‐25D2), and anti‐IFN‐γ (10 µg/mL; clone B27), both from BD Biosciences. Cultures were supplemented with rh‐IL‐2 (50 U/mL; R&D Systems) on days 2 and 4.
Jurkat T leukemia cells (American Type Cell Culture: TIB‐152, Manassas, VA) were cultured in RPMI‐1640 medium, supplemented with 25 mmol/L HEPES, 2 nmol/L l‐glutamine, 100 U/mL penicillin, 100 μg/mL streptomycin (all from JRH Bioscience), and 10% heat‐inactivated fetal bovine serum (Thermo Fisher).
Proliferation assays
Antigen‐specific proliferation assays were performed as previously described. 23 Briefly, T‐cell lines were tested 10 days after the last addition of antigen and feeder cells, in a 60‐h assay measuring 3H‐thymidine incorporation. T cells were cultured at a density of 5 × 10⁴ cells/well in the presence of 5 × 10³ adherent irradiated autologous PBMC (3000 rad) as source of Ag‐presenting cells and 10 µg/mL of specific peptide, in the presence or absence of recombinant human leptin (250 µg/mL; Sigma‐Aldrich). Tetanus toxoid (5 µg/mL), MBP 1–20 (10 µg/mL), and influenza hemagglutinin307–319 (10 µg/mL) peptides were used as control Ags, and optimal concentrations were determined in preliminary experiments. Twelve hours before harvesting, 1 µCi of 3H‐thymidine (ICN Biomedical, Irvine, CA) was added to each well. Cells were harvested on glass fiber filters Whatman, Maidstone, UK) using an automated cell harvester, and 3H‐thymidine incorporation measured in a scintillation counter (Pharmacia LKB Biotechnology Inc, Gaithersburg, MD). Results are expressed as the mean of triplicate cultures ± SEM. For blocking experiments human leptin receptor polyclonal antibody (MyBioSource, San Diego CA) was used at a final concentration of 20 µg/mL; control was an irrelevant isotype‐matched antibody (R&D Systems).
Real‐time quantitative reverse transcriptase polymerase chain reaction analysis
For quantitative assessment of relative mRNA levels, total RNA was prepared using TRIzol LS reagent (Invitrogen, Carlsbad, CA), following manufacturer instructions. RNA was reverse transcribed using an M‐MLV RT reverse transcription kit with random hexamer primers (Invitrogen). Relative levels of leptin receptor mRNA were determined by real‐time polymerase chain reaction using an ABI 7000 sequence detection system (Applied Biosystems, Foster City, CA), under the following conditions: initial denaturation for 10 min at 95°C, followed by 40 denaturation amplification cycles at 95°C for 15 sec, annealing at 67°C for 15 sec, and extension at 72°C for 60 sec, followed by an additional extension (72°C for 5 min). Values obtained were normalized to the amount of glyceraldehyde 3‐phosphate dehydrogenase (GAPDH), as the control housekeeping gene. To confirm product specificity, melting curves were performed to verify that only the specific products were synthesized, and to exclude the formation of primer dimers. Primer sequences used to generate a product specific for the long form (Ob‐Rb) of the human leptin receptor (nucleotide position 2831–3719) were as follows: forward 5’AATTGTTCCTGGGCACAAGG‐3’, reverse 5’CACAATCTGAAGGTTTCTTC‐3’, and for GAPDH: forward 5’‐GAAGGTGAAGTCGGAGTC‐3’, reverse 5’‐GAAGATGGTGATGGGATTTC‐3’.
Small interfering RNA technique
Leptin receptor (Ob‐Rb) was silenced using the small interfering RNA (siRNA) technique. 24 Fifty thousand MBP83–102 peptide‐specific T cells were transfected with 50 nmol/L of siRNA (Ob‐R siRNA (h) sc‐36116, Santa Cruz, CA, USA), or with a scrambled siRNA containing a random sequence as a negative control (Silencer®, Select Negative Control No 2, Thermo Fisher), using Opti‐MEM media and Lipofectamine 2000 transfection reagent (both from Thermo Fisher) according to manufacturer protocol. Three days after posttransfection, RT‐PCR and flow cytometry showed no leptin receptor expression.
Flow cytometry
Peripheral blood mononuclear cells were isolated by Ficoll/Hypaque (Sigma‐Aldrich) density gradient centrifugation following the standard protocol, and cell surface molecule labeling performed, using saturating amounts of appropriate monoclonal antibody (mAb) combinations, including: anti‐CD3‐PerCp‐Cy (clone UCHT‐1); anti‐CD4‐FITC (clone SK3); anti‐CD25‐APC‐R700 (clone 2A3); anti‐CD14‐FITC (clone MφP‐9); anti‐CD19‐FITC (clone HIB19); and anti‐CD295‐Alexa‐Fluor 647 (clone 52263). Anti‐mouse matched isotype controls were used to test for nonspecific binding. All mAbs were obtained from BD Biosciences (San Jose, CA). Samples were acquired with a LSRIII flow cytometer (BD Biosciences), using BD FACSDiva ™ software, and analyzed with FlowJo software (Tree Star, Ashland, OR). Cells were gated according to forward and side‐light scattering properties, including small lymphocytes and lymphoblasts as well as monocytes, and excluding red cells and debris. T cells, B cells, and monocytes were gated according to forward and side light‐scattering properties versus CD3+, CD19+, and CD14+ cells, respectively. At least 5000 events were counted for each cell population. Specific leptin receptor immunoreactivity was calculated in each cell population by subtracting the isotype control mAb signal, from specific mAb staining. Cell analysis was performed with the CellQuest® program (Becton Dickinson). Results are expressed as mean fluorescence intensity (MFI), as an indicator of leptin receptor density (CD295) per cell. Cell viability was assessed both by changes in forward and side‐light scattering properties, and by propidium iodide staining.
Apoptosis measurement
Three days after Ag stimulation, 5 × 10⁵ MBP‐peptide‐specific T cells were cultured for 24 h in serum‐free medium (OpTmizer; Thermo Fisher) in the presence and absence of leptin (2.5–2500 ng/mL, usually 250 ng) for the indicated times. Subsequent studies were performed analyzing steroid‐induced apoptosis. For that purpose, cells were cultured with 10−6 mol/L hydrocortisone for 24 h. Apoptosis was measured using a FITC Annexin V detection kit (BD Biosciences), following manufacturer instructions. The percentage of apoptosis inhibition (%) was calculated using the following formula:
Where control Annexin V‐stained cells represent cells cultured in the absence of leptin. The EC50 value is the concentration of leptin causing 50% inhibition of cell death, averaged from 5 experiments, and obtained by plotting percentage of inhibition versus leptin concentration. In all experiments, PBMC were isolated from patients with normal BMI, to make sure BMI did not affect cell responsiveness to leptin.
ELISA assays
Cells exposed to different experimental conditions were centrifuged for 5 min at 1000g and at 2–8°C, supernatants were removed and cells resuspended in PBS, at a cell concentration of 106 cells/mL. Cells were then washed in PBS three times, lysed, and protein concentrations quantified using a total protein assay. Twenty microgram of cell extract was used to determine Bcl‐2, p‐STAT3 (pY705), p‐ERK1 (T202/Y204)/ERK2 (T185/Y187), and p27kip1 expression, using commercial ELISA kits according to manufacturer instructions, with the variant of adding protease inhibitors (Thermo Fisher), to the lysis buffer provided, immediately prior to use. Sample concentrations were determined with standard curves after blank subtraction. ELISA kits for Bcl‐2 were purchased from Abcam (Cambridge, MA), and ELISA kits for measuring p‐STAT3 (pY705), p‐ERK1 (T202/Y204)/ERK2 (T185/Y187), and p27kip1 were acquired from R&D Systems.
Quantification of cytokines secreted
The number of PBMC secreting IL‐2, IL‐6, IL‐17, TNF‐α, and IFN‐γ, was assessed using commercially available kits for single‐cell resolution enzyme‐linked immunospot (ELISPOT) assay as described elsewhere, 25 following manufacturer instructions (R&D Systems). Briefly, 200 µL aliquots containing 2 × 10⁵ PBMC or MBP83–102 and MOG63–87 peptide‐specific T cells was added to ELISPOT plates coated with capture Abs, specific for each cytokine tested. Cell samples were analyzed in triplicate. MBP83–102 and MOG63–87 peptides were added in 10 µL aliquots to a final concentration of 10 µg/mL. These Ag concentrations rendered a maximum of spots in preliminary experiments. The number of IL‐15 secreting cells was determined by an ELISPOT assay developed in our laboratories using 96‐well PVDF membrane‐bottomed plates (Sigma‐Aldrich), as well as an anti‐human IL‐15 capture and detection monoclonal antibody purchased from Abcam. Cells were also applied into wells in which either the cognate Ag or the detection antibody was omitted, as negative controls. Wells containing 105 PBMC or peptide‐specific T cells and media only were cultured for determination of background responses. Ovalbumin323–339 peptide (Sigma‐Aldrich) at the final concentration of 20 µg/mL was used as a nonrelevant peptide. PHA (1 µg/mL), and each of the specific cytokines in separate wells, were used as positive controls. The specific number of cytokine‐producing cells was calculated by subtracting the numbers of spots obtained in 0 Ag background control cultures, from the number of spots obtained in cultures exposed to stimulating Ag. In another set of experiments.
MBP83–102, and MOG63–87 peptides‐specific T‐cell lines were stimulated with the cognate peptide at a final concentration of 10 µg/mL, in the presence or absence of recombinant human leptin (250 ng/mL). For blocking experiments human leptin receptor polyclonal antibody was used at a final concentration of 20 µg/mL. A representative example of IFN‐γ‐positive response involving MBP83–102‐, and MOG63–87‐peptide‐specific T cells is shown in Figure S2.
Evaluation of CD4+CD25+FoxP3+ regulatory T cells
The number of CD4+CD25+FoxP3+ regulatory T cells (Treg) was evaluated by flow cytometry using a commercially available Treg‐cell‐staining kit, following manufacturer instructions (Thermo Fisher). To evaluate leptin activity on Treg cells, CD4+ CD25+ cells were isolated from fresh PBMC by magnetic separation using a CD4+CD25+ regulatory T cells isolation kit (Miltenyi Biotec, Bergisch Gladbach, Germany). The separation monitored by flow cytometry demonstrated >95% purity, 93% of which expressed FoxP3. For proliferation assays, cells were stimulated with soluble anti‐CD3 (clone HIT3a; BD Biosciences) together with anti‐CD28 (clone 28.2 BD Biosciences), both at 5 µg/mL concentration, in the presence and in the absence of leptin (250 ng/mL) and rh‐IL‐2 (50 U/mL). Since concentrations of rh‐IL‐2 during human Treg cells culture vary wildly in the literature, optimal concentrations of both rh‐IL‐2 and leptin were established in preliminary experiments. Proliferation was determined on day 6 with [3H]‐thymidine added during the final 18 h of culture. For suppression experiments CD4+CD25+FoxP3+ Treg cells were added in variable numbers, together with 2 × 10⁴ T‐cell‐depleted irradiated (3000 rad) accessory cells, to a constant number of autologous Th1 or Th17 CD4+CD25− effector cells (104 cells/well) to achieve appropriate suppressor/responder ratios (1:1, 1:3, and 1:9). Co‐cultures were stimulated with soluble anti‐CD3 (5 µg/mL) together with anti‐CD28 (5 µg/mL), or 10 µg/mL of the cognate Ag, in the presence and in the absence of leptin. Proliferation was evaluated by a 60‐hour assay measuring 3H‐thymidine incorporation as previously described. To measure IFN‐γ, and IL‐17 production by CD4+CD25−, supernatants were removed before [3H] thymidine addition, and analyzed using commercially available ELISA kits (R&D Systems).
To study the molecular effects of leptin on CD4+CD25+FoxP3+ Tregs and CD4+ CD25− effector cells, purified cells were stimulated with antiCD3/CD28 antibodies or the cognate Ag for 12 h, after which cell lysates were studied for expression of p‐STAT3, pERK1/2, and p27kip1 using ELISA.
Statistical analysis
Statistical analysis was performed using SPSS Statistics v23 (Armonk, NY: IBM Corp).
Differences in patient characteristics were compared using Student’s test. Rates of categorical variables were tested with Pearson’s Chi‐Square test or Fisher's exact test, depending on expected frequency assumptions. A multivariate logistic regression model was applied to estimate the OR of developing MS and the 95% CI for each BMI category, using smoking as covariate. To avoid variables overlapping, when the OR of developing MS at the age of 20 was calculated, obesity at 15 years was used as covariate. Age and gender were not used as covariates because cohorts had been previously matched for these, as mentioned. Kruskal–Wallis of one‐way ANOVA, a nonparametric test, was used to estimate differences between more than two groups, and post hoc analysis conducted using Dunn's multiple comparison test, when appropriate. In all cases, P values below 0.05 were considered statistically significant.
Figures were designed with GraphPad Prism version 8.0.0 for Windows (GraphPad Software, San Diego, California USA, www.graphpad.com).
Results
Anthropometric parameters or body weight (BMI) and MS risk
Between July 2013 and October 2019, 309 MS cases and 322 controls completed questionnaires for the study. As mentioned in the Methods section, a multivariate logistic analysis was performed using smoking and BMI at age of 15 as the independent variables to determine whether excess weight or obesity during adolescence and early adulthood increased the risk of MS. Results are shown in Table 3. At age 15, overweight patients showed increased risk of developing MS (OR = 2.16, 95% CI: 1.17–3.99, P = 0.01), and at age 20, obesity was associated with increased risk of MS (OR = 3.90, 95% CI: 1.38–11.1, P = 0.01). For the silhouette questionnaires, the risk of MS was not increased in individuals who acknowledged larger body size (87% at age 15 and 78% at age 20). This unexpected result may be explained by body size underestimation in patients defined as obese based on BMI, a finding previously reported in childhood and adolescence by other authors. 26 , 27
Table 3.
Body size and risk of Multiple Sclerosis.
| MS | Control | OR (95%CI) | P value | |
|---|---|---|---|---|
| BMI at 15 years of age | ||||
| Normal or underweight | 140 | 166 | 1 (ref) | |
| Overweight | 36 | 18 | 2.16 (1.17–3.99) | 0.01 |
| Obesity | 8 | 6 | 1.49 (0.5–4.44) | 0.46 |
| BMI at 20 years of age a | ||||
| Normal/underweight | 215 | 250 | 1 (ref) | |
| Overweight | 43 | 33 | 1.46 (0.88–2.41) | 0.1 |
| Obesity | 18 | 5 | 3.9 (1.38–11.1) | 0.01 |
BMI, body mass index.
Adjusted by smoking and obesity at 15 years of age.
Increased serum levels of leptin correlate with higher BMI
To assess possible mechanisms through which obesity contributes to increased MS risk, serum leptin levels were determined in obese, overweight, and individuals with normal BMI (90 RRMS patients and 90 healthy subjects). Higher BMI showed a positive correlation with higher serum leptin levels (r = 0.88, P < 0.0001), both in RRMS patients (Fig. 1A) and in healthy subjects (data not shown). In addition, serum leptin levels were significantly higher in obese patients compared to overweight or normal/underweight patients (37.44 ± 5.81 vs. 28.06 ± 3.62 ng/mL; P < 0.0001, and 37.44 ± 5.81 vs. 21.82 ± 4.85 ng/mL; P < 0.0001, respectively). Similarly, serum leptin levels were higher in overweight patients compared to normal/underweight patients (28.06 ± 3.62 vs. 21.82 ± 4.85 ng/mL; P < 0.01, Fig. 1B).
Figure 1.

(A) Body mass index (BMI) positively correlated with serum leptin levels. (B) Serum leptin levels were higher in obese patients compared to overweight and normal/underweight patients. Similarly, overweight patients showed increased serum leptin levels compared to normal/underweight patients. No statistically significant differences were found when MS and control patients were compared in each subgroup. Each circle represents values from a single individual. Data are presented as mean ± SEM. Kruskal–Wallis test of one‐way ANOVA and post hoc data analysis applying Dunn's multiple comparison test, performed to analyze differences between groups. **P < 0.01, ****P < 0.0001.
Leptin receptor is expressed on different lymphocyte subpopulations
To better characterize the influence of leptin on immune response/s, we measured expression of the long form of the human leptin receptor (Ob‐Rb) at mRNA and protein levels, in freshly isolated and activated T cells, B cells, and monocytes, and demonstrated that freshly isolated CD4+ CD25+, CD4+CD25−, B cells, and monocytes all express mRNA of the long form of leptin receptor. The specific activation of each cell population significantly increased mRNA expression (Fig. 2A). When cells were stained with an antileptin receptor‐specific antibody and analyzed by flow cytometry, the antibody was expressed on all freshly isolated lymphocyte subpopulations (Fig. 2B). Following activation, leptin‐receptor fluorescence intensified, suggesting stimulation‐induced heightened receptor density per cell.
Figure 2.

Lymphocyte subpopulations were isolated from fresh PBMC by magnetic separation using specific isolation kits, and leptin receptor expression was measured by RT‐PCR (A) and flow cytometry (B). Cells were cultured (5 × 10⁴ cells/well) in round bottom 96‐well plates for 72 h and stimulated as follows: T cells were stimulated with soluble anti‐CD3 and soluble anti‐CD28 (both at 5 µg/mL concentration); B cells using PMA (5 ng/mL) plus ionomycin (1 μmol/L); and monocytes were activated with 100 ng/mL of LPS. For mRNA expression, data were normalized to the amount of GAPDH, as a control housekeeping gene, using the Pfaffl method. 65 Intra‐assay precision was determined in three repeats within one LightCycler run, and interassay variation was investigated in three different experimental runs. Variations for intertest and intratest experiments were between 5% and 7% in all cases. Flow cytometry data were acquired as described in Material and Methods. The results are expressed as Mean Fluorescence Intensity (MFI) of leptin receptor expression (Ob‐Rb; CD295). In all lymphocyte subpopulations, activation significantly increased leptin receptor expression compared to resting cells. Data represent the mean ± SEM from 25 MS patients. *P < 0.05, **P < 0.01, ****P < 0.0001.
The protective effect of leptin on apoptosis of autoreactive T cells
To determine the role of leptin on autoreactive T‐cell survival, we investigated its effects on spontaneous apoptosis of MBP‐ and MOG‐peptide‐specific T cells. Apoptotic cell death was assessed after 24 h in serum‐free culture medium, in the presence and absence of different concentrations of leptin, using an Annexin V binding assay and flow cytometry. Leptin inhibited T‐cell apoptosis in a dose‐dependent manner (Fig. 3A). Maximal inhibition of autoreactive T‐cell death was reached with 250 ng/mL; higher concentrations caused no further effect. The EC50 of leptin used for these experiments was ~ 100 ng/mL. To demonstrate specificity of leptin activity on inhibition of apoptosis, MBP83–102 peptide‐specific T cells in which leptin receptor was silenced using siRNA technique, were included in this assay as a negative control. As shown in Figure 3A, leptin receptor silencing abrogated inhibition of apoptosis mediated by leptin. Since the long isoform of the leptin receptor is expressed on Jurkat T cells, and leptin promotes their survival in the absence of serum by preventing apoptosis, these cells were included as a positive control. 28 Leptin inhibited Jurkat T‐cell apoptosis at concentrations significantly lower than those required for apoptosis inhibition of autoreactive MBP83–102 cells (EC50 ~ 20 ng/mL Fig. 3A). We further evaluated the effect of leptin on autoreactive T cells from a broader group of patients. Leptin‐treated (250 ng/mL) MBP83–102‐peptide‐specific T cells exhibited a significant decrease in the percentage of apoptotic cells. Antileptin receptor antibody abrogated the survival effect of leptin when was added to cultures 30 min before leptin (Fig. 3B). Treatment of Jurkat cells with 50 ng/mL of leptin showed a similar effect (Fig. 3C). We next analyzed the effect of leptin on steroid‐induced apoptosis. We used hydrocortisone 10−6 mol/L, a concentration known to trigger apoptosis of T cells very efficiently and cause immunosuppression. We found that leptin significantly reduced steroid‐induced apoptosis in MBP83–102, and MOG63–87 peptide‐specific T cells. In both settings, the antiapoptotic effect of leptin was blocked by antileptin receptor antibody, but not modified by an isotype control antibody (Fig. 3D). To investigate potential mechanisms accounting for the protective effect of leptin on apoptosis of autoreactive T cells, we quantified the expression of the antiapoptotic protein Bcl‐2. As shown in Figure 3E, when T cells were incubated in the presence of leptin, Bcl‐2 expression was significantly increased. This effect was abrogated by antileptin receptor mAb, but not modified by an isotype control antibody. Thus, overexpression of Bcl‐2 induced by leptin can lead to resistance to different apoptosis‐inducing stimuli. Finding leptin had antiapoptotic effects on autoreactive T cells suggests leptin could favor autoreactive T‐cell activity. To study this, MBP83–102, and MOG63–87 peptide‐specific T cells were stimulated with the cognate Ag at different concentrations, in the presence and in the absence of leptin. The addition of leptin to cultures promoted a significant increase in the proliferative response of autoreactive T cells. This effect was abrogated by the addition of antileptin receptor antibody, but not modified by an isotype control antibody, thus confirming a leptin‐mediated effect (Fig. 3F).
Figure 3.

(A) Concentration curve of antiapoptotic effect mediated by leptin. MBP83–102 peptide‐specific T cells were cultured in serum‐free culture medium for 24 h, in the presence and absence of different concentrations of leptin. Maximal antiapoptotic effects were seen at 250 ng/mL. Inhibition of apoptosis was leptin dependent, since leptin receptor silencing using siRNA abrogated the leptin effect. Jurkat T cells were used as positive control, with the maximum inhibition of apoptosis reached at concentrations significantly lower than those necessary to prevent apoptosis in autoreactive T cells. Data represent mean values ± SEM of triplicate cultures from five independent experiments. (B) Leptin decreases apoptosis induction in MBP83–102, peptide‐specific T cells from MS patients. Three days after Ag stimulation, autoreactive T cells were cultured for 24 h in serum‐free medium, with and without leptin (250 ng/mL). Both antileptin receptor and control antibodies were added at a final concentration of 20 µg/mL, 30 min before leptin (250 ng/mL). The antiapoptotic effect of leptin was blocked by antileptin receptor mAb, but not modified by an isotype control antibody. MBP83–102 peptide‐specific T cells in which leptin receptor was silenced using siRNA technique were included in this assay as a negative control. (C) Leptin at a concentration of 50 ng/mL decreases apoptosis induction in Jurkat T cells, cultured in conditions similar to MBP83–102 peptide‐specific T cells. Data represent mean ± SEM from seven different experiments performed in triplicate (D) Leptin inhibited steroid‐induced apoptosis in MBP83–102 peptide‐specific T cells. Three days after Ag stimulation, autoreactive T cells were cultured for 24 h with 10−6 mol/L hydrocortisone in the presence and in the absence of leptin (250 ng/mL). As in the previous experiment, the antiapoptotic effect of leptin was blocked by antileptin receptor mAb, but not modified by an isotype control antibody. In panels A to D, evidence of apoptosis was evaluated by FITC‐Annexin V and PI staining and analyzed by flow cytometry. (E) Expression of the antiapoptotic molecule Bcl‐2 significantly increased in the presence of leptin. This effect was abrogated in the presence of antileptin receptor mAb, but not modified by an isotype control antibody. (F) Leptin promoted proliferation of both MBP83–102, and MOG63–87 peptide‐specific T cells stimulated with increasing concentrations of the cognate antigen. Cell proliferation was assessed by measuring 3H thymidine incorporation during the final 12 h of a 60 h culture. As in previous experiments, both antileptin receptor and control antibodies were added at a final concentration of 20 µg/mL, 30 min before adding leptin (250 ng/mL). Data represent mean ± SEM from five different experiments. For panels B, D, and E each circle represents an individual MBP83–102‐specific T‐cell line, isolated from a total of 15 MS patients. Data represent mean ± SEM. In all experiments, PBMC were isolated from patients with normal BMI, to make sure BMI did not affect cell responsiveness to leptin. Kruskal–Wallis test of one‐way ANOVA and post hoc data analysis applying Dunn's multiple comparison test were performed to analyze differences between groups. LEPR: Leptin receptor; Anti LEPR ab = antileptin receptor antibody ****P < 0.0001.
Obesity promotes proinflammatory cytokine production
We further investigated cytokines profiles in ex vivo PBMC from obese, overweight, and normal /underweight MS patients. To this end, cells were stimulated with MBP83–102, and MOG63–87 peptides and cytokine production assessed by ELISPOT assay. As shown in Figure 4A, obese patients produced significantly higher numbers of IL‐2, IL‐6, IL‐15, IL‐17, IFN‐γ, and TNF‐α producing cells, compared to overweight and normal/underweight MS subjects. Likewise, production of the same cytokines was significantly higher in overweight patients compared to normal/underweight MS patients. In a second protocol, MBP83–102, and MOG63–87‐peptide‐specific T cells from MS patients of normal weight were stimulated with the cognate peptide in the presence and absence of leptin, and the same panel of cytokines measured by ELISPOT assay. We found a marked increase in the production of IL‐2, IL‐6, IL‐15, IL‐17, IFN‐γ, and TNF‐α in the presence of leptin. These effects were blocked after the addition of antileptin receptor antibody but were not modified by the addition of an isotype antibody (Fig. 4B).
Figure 4.

(A) Obese MS patients showed significantly higher numbers of IL‐2, IL‐6, IL‐15, IL‐17, IFN‐γ, and TNF‐α producing cells compared to overweight and normal/underweight MS subjects. Likewise, overweight patients showed a higher number of cytokine‐producing cells compared to normal/underweight MS patients. ** P < 0.01, ***P < 0.001, ****P < 0.0001 (B) MBP83–102T‐cell lines isolated from normal weight MS patients, were stimulated with the cognate peptide in the presence of leptin, significantly increased the production of IL‐2, IL‐6, IL‐15, IL‐17, IFN‐γ, and TNF‐α producing cells. These effects were overcome by the addition of an antileptin receptor mAb, but not modified by an isotype control antibody. Stimulation with Ovalbumin323–339 (20 µg/mL), as nonrelevant peptide, showed values similar to background. In all experiments, cytokine production was assessed using ELISPOT assays. The specific number of cytokine‐producing cells was calculated by subtracting the numbers of spots obtained in 0 Ag background control cultures, from the number of spots obtained in cultures exposed to stimulating Ag. In both panels, data correspond to the number of spots per 105 PBMC from 30 patients, and results represent mean ± SEM. Kruskal–Wallis test of one‐way ANOVA and post hoc data analysis applying Dunn's multiple comparison test were performed to analyze differences between groups. ****P < 0.0001 Anti LEPR ab = antileptin receptor antibody.
Leptin modulates CD4+CD25+Foxp3+ regulatory T cells in MS
Given that regulatory T (Treg) cells play a central role in the control of autoimmune responses we next investigated the link between serum leptin levels and peripheral of Treg‐cell numbers in MS patients. Percentage of CD4+CD25+ FoxP3+ Treg cells from 90 RRMS treatment‐naive patients were compared to serum leptin levels. Regression analysis showed an inverse correlation between serum leptin levels and percentage of circulating Treg cells (r = −0.97, P < 0.0001) (Fig. 5A). In vitro analysis of Treg proliferation, demonstrated Treg cells were hyporesponsive to anti‐CD3/anti‐CD28 stimulation after the addition of leptin to cultures. The addition of antileptin receptor mAb reversed this effect and promoted Treg proliferation (Fig. 5B). Notably, the addition of exogenous IL‐2 reversed Treg‐cell hyporesponsiveness to anti‐CD3/anti‐CD28 stimulation in the presence of leptin (Fig. 5B). We next examined whether CD4+CD25+FoxP3+ Treg cells isolated from MS patients inhibited the proliferation of Th1 and Th17 MBP83–102‐, and MOG63–87‐peptide‐specific T cells in response to anti CD3/CD28 stimulation. The addition of Treg cells to cultures (1:1 ratio) resulted in significant inhibition of CD4+CD25− effector T‐cell proliferation (Fig. 5C). Likewise, IFN‐γ secretion by Th1 cells, and IL‐17 secretion by Th17 cells were also significantly suppressed in these co‐cultures (Fig. 5D and E). When leptin was added to cultures, suppression mediated by Treg cells significantly declined (Fig. 5C–E). A decrease in suppressor/responder T‐cell ratio resulted in significantly less suppression (Fig 6A–C). Stimulation using either anti‐CD3/anti‐CD28 or specific Ags showed similar results.
Figure 5.

(A) Percentage of CD4+CD25+ FoxP3+ Treg cells from 90 treatment‐naive RRMS patients were compared to serum leptin levels. Regression analysis showed a statistically inverse correlation between serum leptin levels and the percentage of circulating Treg cells (r = −0.97, P < 0.0001). (B) Fifty thousand CD4+CD25+ cells isolated from fresh PBMC by magnetic separation using commercially available kits (95% purity, 93% expressing FoxP3) were stimulated with soluble anti‐CD3 and anti‐CD28 (BD Bisociences), both at 5 µg/mL concentration, in the presence and in the absence of leptin (250 ng/mL). Both antileptin receptor and control isotypes antibodies were added at a final concentration of 20 µg/mL each, 30 min before adding leptin. Proliferation was determined on day 6 with [3H]‐thymidine added during the final 18 h of culture. Proliferation of CD4+CD25+Foxp3+ cells was significantly inhibited after stimulation with leptin (250 ng/mL). This effect was abrogated by the addition of antileptin receptor mAb (LEPR‐ab) but not modified by the control antibody. The addition of exogenous IL‐2 (50 U/mL) reversed Treg‐cell hyporesponsiveness to anti‐CD3/anti‐CD28 stimulation in the presence of leptin. Each circle represents data from an individual patient (n = 25). Data are presented as mean ± SEM. (C‐E) Inhibitory effects of CD4+CD25+FoxP3+ Treg cells were examined in 15 RRMS patients during remission on: proliferative response, and secretion of IFN‐γ, and IL‐17 by Th1 and Th17 polarized MBP83–102 peptide‐specific T cells. For proliferation assays, CD4+CD25+FoxP3+ Treg cells were added together with 2 × 10⁴ T‐cell‐depleted irradiated (3000 rad) accessory cells to autologous Th1 or Th17 CD4+CD25− MBP83–102‐peptide‐specific effector cells at a ratio 1:1 (104 cells/well). Co‐cultures were stimulated with soluble anti‐CD3 (5 µg/mL) together with soluble anti‐CD28 (5 µg/mL), in the presence and in the absence of leptin, and proliferation determined in a 60‐hour assay, measuring 3H‐thymidine incorporation. To measure IFN‐γ and IL‐17 production by CD4+CD25− effector cells, supernatants were removed before [3H] thymidine addition, and analyzed using commercially available ELISA kits. The addition of leptin to the cultures (250 ng/mL) abrogated the inhibitory effects mediated by CD4+CD25+FoxP3+ Treg cells. For panels C, D, and E, each circle represents values for an individual T‐cell line (mean of triplicate cultures). Data represent mean ± SEM. Kruskal–Wallis test of one‐way ANOVA and post hoc data analysis applying Dunn's multiple comparison test were performed to analyze differences between groups. Data are presented as mean ± SEM. ****P < 0.0001.
Figure 6.

Mean percentage inhibition of proliferative response, as well as of IFN‐γ and IL‐17 production by CD4+CD25+Foxp3+ Treg cells on CD4+CD25− MBP83–102‐ and influenza hemagglutinin 307–319‐peptide‐specific effector T cells, derived from 15 RRMS during remission was calculated. CD4+CD25+FoxP3+ Treg cells were added in variable numbers together with 2 × 10⁴ T‐cell‐depleted accessory cells, to a constant number of autologous Th1 or Th17 CD4+CD25− effector cells (104 cells/well) to achieve appropriate suppressor/responder ratios (1:1, 1:3, and 1:9). Co‐cultures were stimulated with soluble anti‐CD3 (5 µg/mL) together with soluble anti‐CD28 (5 µg/mL) in the presence or absence of recombinant human leptin (250 µg/mL). Proliferation assays and measurement of IFN‐γ and IL‐17 production were performed as described in Figure 5 and in Material and Methods. Proliferative response (A), IFN‐γ production (B) and IL‐17 production (C) were significantly inhibited upon the addition of CD4+CD25+FoxP3+ to the CD4+CD25− MBP83–102 effector T cells in a 1:1ratio. Decreasing ratios of suppressor:effector cells (ratios 1:3 and 1:9) resulted in less suppression in all conditions examined. CD4+CD25+FoxP3+ exhibited significantly less suppressor activity on CD4+CD25− influenza hemagglutinin 307–319‐peptide‐specific effector T cells, compare with CD4+CD25− MBP83–102‐ peptide‐specific T cells. When leptin was added to cultures, suppression mediated by Treg cells declined significantly, regardless of specific antigen. Assays were performed in triplicate, the symbols represent mean ± SEM. Percentage of CD4+CD25+FoxP3+ Treg‐cell inhibition in co‐cultures was defined as: [1‐(Treg:Teff values/Teff values)] × 100. The Mann–Whitney test was used to evaluate differences in CD4+CD25+FoxP3+ function between T‐cell lines co‐cultured at different ratios, and differences in suppressor activity exerted by Treg cells on different specific T cells. ****P < 0.0001.
Limited data exist concerning Ag specificity of CD4+CD25+ FoxP3+ Treg cells in the regulation of autoimmune responses. 29 , 30 To assess the ability of CD4+CD25+FoxP3+ Treg cells from MS patients to suppress responses to a foreign Ag, and to investigate whether leptin has similar effects on specific self‐reactive T cells, and on nonself‐reactive T cells, influenza hemagglutinin 307–319‐specific T‐cell lines were co‐cultured at different regulatory: responder ratios as previously described for MBP83–102 peptide‐specific T cells, and proliferation, as well as IFN‐γ, and IL‐17 production measured. As shown in Figure 6, CD4+CD25+FoxP3+ Treg cells exhibited significantly less suppressor activity on influenza hemagglutinin 307–319‐peptide‐specific effector T cells (only evident at a 1:1 ratio), compared with CD4+CD25− MBP83–102‐ peptide‐specific T cells. Notably, when leptin was added to cultures, suppression mediated by Treg cells declined significantly, regardless of antigen specificity or magnitude of inhibition observed (Fig. 6A–C).
Effects of leptin on STAT3 and ERK1/2 pathways
Leptin appears to exert its biological function through binding to its receptors, which in turns stimulates gene transcription via activation of STAT3, mitogen‐activated protein kinases (MAPK), and phosphatidylinositol 3‐kinase (PI‐3K)/Akt pathways. 31 , 32 , 33 Therefore, to gain insight into signal transduction pathways underlying leptin effects, we evaluated p‐STAT3Y705 in response to leptin in CD4+CD25−, and CD4+CD25+Foxp3+ Treg cells. The activation of CD4+CD25− MBP83–102 peptide‐specific T cells in the presence of leptin, induced strong Tyr705 phosphorylation of STAT3. Incubation of cells with antileptin receptor antibody together with leptin, abrogated the stimulatory effect of leptin on STAT3Y705 phosphorylation (P < 0.0001; Fig. 7A). Conversely, stimulation of CD4+CD25+FoxP3+ Treg cells by anti‐CD3/anti‐CD28 antibodies, in the presence and in the absences of leptin, induced comparable amounts of p‐STAT3Y705 (P < 0.0001; Fig. 7B). Previous studies have shown that leptin also triggers phosphorylation‐dependent activation of ERK1/2 pathway in CHO cells and murine tumor cells. 32 , 34 Therefore, to evaluate whether leptin could affect T‐cell activation, we studied p‐ERK1T202/Y204/ERK2T185/Y187 expression on CD4+CD25− MBP83–102 peptide‐specific T cells and on CD4+CD25+FoxP3+ Treg cells. Leptin, added during anti‐CD3/anti‐CD28 stimulation, increased ERK1T202/Y204/ERK2T185/Y187 phosphorylation in CD4+CD25− effector T cells (P < 0.0001; Fig. 7C). In contrast, stimulation of Treg cells under similar conditions in the presence of leptin, induced a significant decrease in p‐ ERK1T202/Y204/ERK2T185/Y187, indicating an anergic state (P < 0.0001; Fig. 7D). Notably, the effects mediated by leptin were abrogated after adding anti‐leptin receptor mAb, which induced a significant increase p‐ ERK1T202/Y204/ERK2T185/Y187 expression and reversal of hyporesponsiveness.
Figure 7.
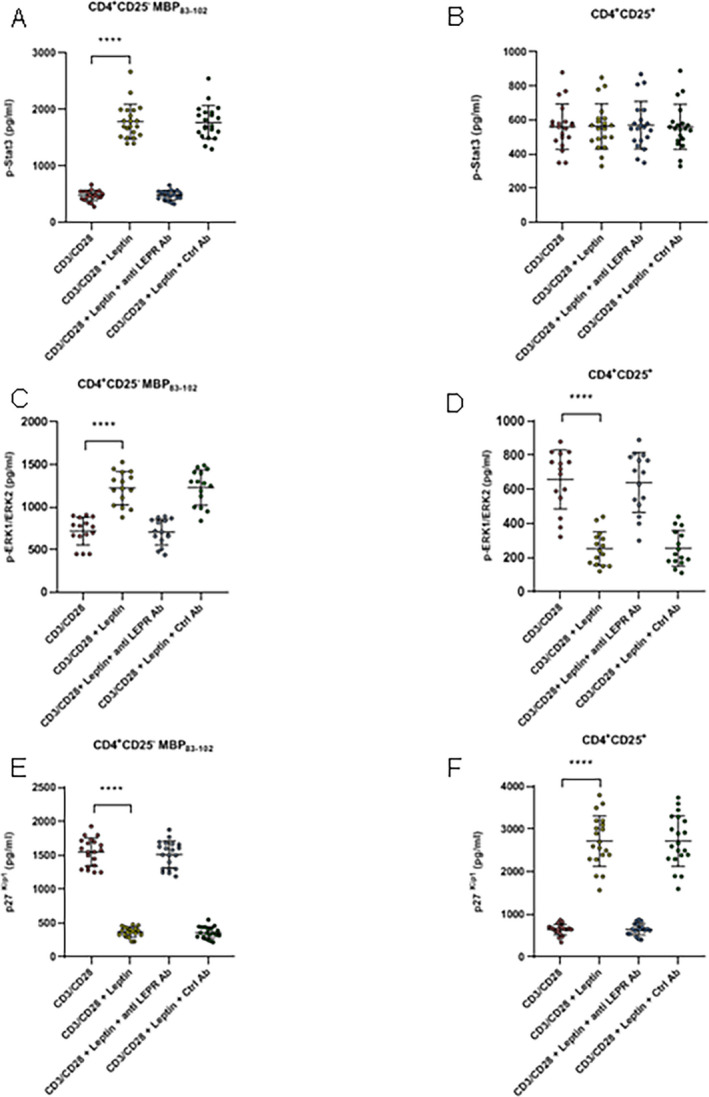
In panels A to F cells were stimulated with soluble anti‐CD3/anti‐CD28 (5 µg/mL each) during 6 h, in the presence and in the absence of leptin (A) Stimulation of CD4+CD25− MBP83–102 effector T cells in the presence of leptin significantly increased p‐STAT3Y705 levels. (B) In contrast, no differences were observed in CD4+CD25+FoxP3+ Treg cells under similar experimental conditions. (C) Stimulation of CD4+CD25− MBP83–102 effector T cells in the presence of leptin, induced a significant increase in p‐ ERK1T202/Y204/ERK2T185/Y187 expression. (D) Conversely, Treg cells stimulated under similar conditions showed a marked decrease in p‐ ERK1T202/Y204/ERK2T185/Y187. (E‐F) Using similar experimental conditions for both CD4+ CD25− effector cells and for CD4+CD25+FoxP3+ Treg cells, a marked decrease in expression of cell cycle inhibitor p27kip1 was observed in the former, whereas p27kip1was significantly increased in Treg cells. Leptin‐mediated effects were abrogated by antileptin receptor antibody, but not modified by an isotype control (20 µg/mL). Each circle represents an individual MBP83–102‐specific T‐cell line isolated from a total of 15 MS patients. Data represent mean ± SEM. Kruskal–Wallis test of one‐way ANOVA and post hoc data analysis applying Dunn's multiple comparison test were performed to analyze differences between groups. Anti LEPR ab = antileptin receptor antibody. ****P < 0.0001.
STAT3 activation has been reported to regulate cell cycle progression, through upregulation of downstream target Cyclin D (1, 2, and 3) and downregulation of p21 and p27 expression. 35 , 36 We therefore analyzed the expression of the cyclin‐dependent kinase inhibitor p27kip1. In the presence of leptin, p27kip1 was down modulated in CD4+CD25− effector T cells during anti‐CD3/anti‐CD28 stimulation (P < 0.0001; Fig. 7E), explaining at least in part, the increase in proliferation of these cells caused by leptin. In contrast, expression of p27kip1 was significantly increased in Treg cells (P < 0.0001; Fig. 7F), suggesting their contribution to cell cycle arrest of anergic Treg cells. Because, Jurkat T cells activate tyrosine phosphorylation of STAT3, MAPK, and PI‐3K signaling pathways after leptin stimulation, they were included as positive controls. 28 Leptin stimulation of Jurkat T cells significantly increased expression of p‐STAT3Y705, p‐ERK1T202/Y204/ERK2T185/Y187, and dowregulation of p27kip1 (Fig. S3A, D and G), as observed in autoreactive MBP 83–102 and MOG 63–87 T cells (Fig. S3B, E and H). In addition, MBP83–102‐peptide‐specific T cells in which leptin receptor was silenced were included as negative controls. As expected, leptin had no effect on STAT‐3, and ERK1/2 phosphorylation, nor on p27kip1 expression (Fig. S3C, F, and I).
Discussion
The prevalence of obesity is rapidly growing worldwide, representing a major public health problem, fueled mainly by sedentary habits of the modern lifestyle and unhealthy diets. In recent years, the concept that white adipose tissue was exclusively an energy storage site has shifted towards recognition that it also influences endocrine function. Indeed, an increase in white adipose tissue is known to induce a chronic, low‐grade inflammatory state with increased production of inflammatory cytokines and adipokines. 37 One of the most well‐studied adipokines is leptin, whose secretion is proportional to adipose tissue mass and levels of which are increased in obesity. Besides playing an important role in energetic homeostasis, leptin exerts pleiotropic effcets on physiological functions, including fertility, bone metabolism, angiogenesis, inflammation, and is considered a key element in the interplay between metabolism and immunity. 38
As previously reported, 8 , 9 , 10 we found excess weight/obesity during adolescence and early adulthood were associated with an increased risk of MS (after adjusting for smoking). Adjustment for other relevant MS risk factors such as genetic profile, vitamin D levels, and Epstein Barr virus antibody titers was not possible as these were not studied in this cohort at those ages. Our study did, however, show that leptin plays a dual role in MS patients. On one hand, it exerts proinflammatory effects by increasing CD4+CD25− MBP‐ and MOG‐peptide‐specific T‐cell proliferation, promoting secretion of proinflammatory cytokines, as well as an antiapoptotic effect on myelin‐reactive T cells. This indicates leptin may favor autoreactive T‐cell activity. On the other hand, leptin inhibits CD4+ CD25+ Treg‐cell proliferation, inducing hyporesponsiveness of these cells. We compared the impact of leptin on underlying signaling events in CD4+CD25− autoreactive T cells and CD4+CD25+ Treg cells, and demonstrated marked differences in p‐STAT‐3, p‐ERK1/2 and p27 kip1 pathways for each cell type.
In line with these observations, leptin‐deficient (ob/ob) mice are resistant to the development of both passively and actively induced experimental autoimmune encephalomyelitis (EAE), reverted by the administration of exogenous leptin. Also, administration of leptin to EAE‐susceptible mice worsens the clinical course, whereas antileptin‐receptor antibodies ameliorate it. 39 , 40 , 41 Notably, the onset of neurological symptoms following EAE induction is typically preceded by a reduction in food intake and body weight, which are associated with a marked increase in serum leptin levels, and leptin secretion by T cells in active EAE brain lesions. 42 Likewise, in patients with RRMS, previous studies have demonstrated that serum and CSF leptin levels are increased, both in correlation with IFN‐γ secretion in the CSF, and reduction of circulating Treg cells. 43
If leptin acts as a proinflammatory mediator both during innate and adaptive immunity, 44 this might help explain the association between obesity and MS. In line with our results, leptin‐deficient ob/ob mice protected from adoptively transferred EAE, presented progressive decline in MOG autoreactive CD4+ T‐cell survival, which was associated with significant downregulation of the survival factor Bcl‐2. Exogenous leptin administration reversed these phenomena, 43 indicating leptin favored autoreactive T‐cell survival. Similarly, acute starvation, a leptin‐deficient state, delayed EAE onset, and attenuated animal symptoms. 41 , 45 Once again, administration of leptin reversed the immunosuppressive effects of acute starvation in these animals, preventing the decline of lymphocytes, favoring the proliferative response of CD4+ T cells and promoting proinflammatory cytokine secretion. 46 , 47 Likewise, in humans, leptin deficiency is associated with reduction in circulating CD4+ T cells and impaired T‐cell proliferation and cytokine release, all of which are reversed by administration of recombinant human leptin. 48
The critical protective role of CD4+CD25+ FoxP3+ Treg cells in numerous autoimmune diseases is now well established. 49 In obesity, high levels of leptin may negatively influence CD4+CD25+ Treg‐cell expansion and homeostatic proliferation. Cell metabolism is critical to regulate cell fate, since distinct metabolic programs may direct toward either effector or regulatory functions. 50 At physiological concentration leptin increases glucose uptake by CD4+CD25+ Treg cells, whereas in conditions in which its levels rise high, it is able to significantly inhibit glycolysis, 51 and consequently reduce the capacity of conventional T cells to differentiate into Treg cells; effects associated with inhibition of FoxP3 gene expression, and its splicing variants containing the exon 2. 52 Our results are in agreement with previous studies demonstrating an inverse correlation between leptin and Treg cells in RRMS. 49 In mice, chronic deficiency of leptin, or leptin receptor, increases Treg‐cell numbers and activity, as well as resistance to EAE induction. 39 Also worthy of note, wild‐type Treg cells adoptively transferred into leptin‐deficient mice expand substantially more, than those transferred into wild‐type animals, indicating Treg cells proliferate better in a leptin‐poor environment. Interestingly, Treg cells themselves are a source of leptin, both secreting it and expressing leptin receptors on their surface (Fig. 2), which could allow leptin to mediate a negative autocrine loop in Treg cells, in the absence of exogenous leptin. In contrast, leptin antibody inhibited the proliferation of purified effector CD4+CD25−T cells, a phenomenon reversed by the addition of leptin. 53 Notably, in vivo leptin neutralization also increased Foxp3 expression in Treg cells, suggesting maintenance of their suppressive phenotype after expansion in vivo. 53 Taken together these findings show leptin exerts opposing effects on CD4+CD25− effector and CD4+CD25+ regulatory T cells, which could explain, at least in part, how it promotes inflammatory responses in obese/overweight MS patients.
It has been widely demonstrated that quantitative and qualitative differences in T‐cell signaling may underlie the different functional outcomes of immunological tolerance and priming. 54 , 55 Previous studies have demonstrated that leptin, after binding to its receptor, increases STAT‐3 phosphorylation in T cells, 56 with higher levels of p‐STAT‐3 activity in activated T lymphocytes than in resting ones. 57 Our results demonstrated that the intensity of this activation pattern is significantly higher in CD4+CD25− effector T cells, compared to CD4+CD25+ Treg cells. In contrast, leptin receptor/STAT‐3 signaling is significantly suppressed in leptin‐resistant animals, and during starvation. 57 Both conditions have been associated with impaired immune response, suggesting leptin may exert its action initially through this pathway.
Although the precise molecular mechanisms underlying the induction of hyporesponsiveness in vitro have not been fully characterized, they have been associated with defective coupling of the TCR in early signal events such as activation of the ZAP‐70, ERK, and JNK/STAT pathways. 54 , 55 In addition, several studies have indicated that ERK1/2 activity also contributes to regulate cell cycle arrest in anergic cells, through downregulation of p27 in the late G1/S phase. 58 , 59 Our results demonstrate that in the presence of leptin, a significant increase in p‐STAT3, and p‐ERK1T202/Y204/ERK2T185/Y187 is observed in CD4+CD25− effector T cells associated with a marked decrease in the cell cycle inhibitor p27 kip1. Opposite results were detected in CD4+CD25+ Treg cells (Fig. 7). Leptin neutralization can overcome the hyporesponsiveness of Treg cells via a degradation of p27 kip1, associated with: phosphorylation of ERK1/2, entry into the G1/S phase of the cell cycle, and induction of IL‐2 gene transcription. These findings are consistent with the fact that in the presence of leptin, primed but not anergic cells progress through the cell cycle, and that such progression correlates with increasing levels of p‐ERK1/2 and p‐STAT3. 60
In addition to STAT‐3 and ERK1/2, the mammalian target of rapamycin (m‐TOR) is also activated by leptin, controlling the responsiveness of autoreactive T cell, 42 and Treg‐cell survival. 61 mTOR inhibition by rapamycin, impairs T‐cell effector proliferation and cytokine secretion, via early downmodulation of p‐ERK1/2, increased accumulation of p27 kip1, and consequently inhibition of IL‐2 secretion. 62 Furthermore, studies have shown mTOR is involved in Foxp3 expression 63 as well as in de novo differentiation of Treg cells. 64
Other molecules involved in sensing host metabolic status may participate in immunomodulatory activities, such as AMPK and PPARγ, and certain current strategies used to treat obesity‐related disorders, are now known to also downregulate immune responses. For example, our group recently demonstrated that metformin (an AMPK agonist) and pioglitazone (a PPARγ agonist), two compounds used in the treatment of metabolic syndrome, have beneficial anti‐inflammatory effects in MS patients. 53
Overall, the discovery of different pathways linking metabolism and autoimmunity allows a better understanding of the relationship between MS and certain life‐style factors. Further investigations will contribute to the development of new treatments, targeting improved energy balance modulation and ultimately better control over autoimmune diseases.
Conflicts of Interest
MM: does not report conflicts of interest in relation to the content of this manuscript, MFF: does not report conflicts of interest in relation to the content of this manuscript, MEB: does not report conflicts of interest in relation to the content of this manuscript, JC: does not report conflicts of interest in relation to the content of this manuscript.
Authors’ Contributions
MM involved in acquisition and analysis of data, drafting a significant portion of the manuscript and figures. MFF and MEB involved in acquisition and analysis of data. JC involved in conception and design of the study, acquisition, and analysis of data, drafting a significant portion of the manuscript and figures, and work supervision.
Supporting information
Figure S1. Antigen‐induced proliferation of autoreactive MBP83–102 T‐cell lines derived from three different patients. Fifty thousand T cells and 5 × 10³ autologous irradiated (3000 rad) PBMCs as source of Ag‐presenting cells, were co‐cultured in media alone (Bckg) or media containing either optimal concentrations of control Ags or the cognate Ag (10 µg/mL). Control Ags included tetanus toxoid (TT; 5 µg/mL), influenza hemagglutinin 307–319 (IH; 10 µg/mL), and a nonstimulatory fragment MBP1–20 (10 µg/mL). Antigen‐specific proliferation was examined in a 60 h assay measuring 3H‐thymidine incorporation. Results are shown as the mean value of counts per minute (CPM) ±SEM for triplicate cultures.
Figure S2. IFN‐γ response to MBP83–102 and MOG63–87 peptides in Th1 polarized T‐cell lines from 3 MS patients. Cell samples were analyzed in triplicate in the IFN‐γ ELISPOT assay to determine their potential to respond to Ag stimulation. Each bar represents the number of spots per 105 peptide‐specific T cells obtained under the following culture conditions: (1) stimulation with the specific peptide, (2) stimulation with PHA (1 µg/mL) as positive control, (3) stimulation with Ovalbumin323–339 peptide (20 µg/mL) as a nonrelevant peptide, (4) cells in which either the cognate Ag or the detection antibody was omitted, as negative controls, (5) wells containing 2 × 10⁵ peptide‐specific T cells and media only for determination of background responses. The specific number of cytokine‐producing cells was calculated by subtracting the numbers of spots obtained in 0 Ag background control cultures, from the number of spots obtained in cultures exposed to stimulating Ag. Data represent mean ± SEM for triplicate cultures. Please note the use of logarithmic scale.
Figure S3. In all panels, cells were stimulated with soluble anti‐CD3/anti‐CD28 (5 µg/mL each) during 6 h, in the presence and in the absence of leptin, and p‐STAT3Y705, p‐ ERK1T202/Y204/ERK2T185/Y187, and p27kip1 expression measured using ELISA . Panels A, D, and G represent results obtained in Jurkat cells (positive control), panels B, E, and H represent results observed in autoreactive‐MOG63–87‐peptide‐specific T cells, and panels C, F, and I represent data obtained from MBP83–102‐peptide‐specific T cells in which leptin receptor was silenced, as described in material and methods (negative control). Data represent mean ± SEM of 7 individual experiments conducted in triplicate. A Mann–Whitney test was used to evaluate differences between groups in the presence and in the absence of leptin. W/o LEPR: Leptin receptor silenced ****P < 0.0001.
Funding Information
This study was founded by an internal grant from Fleni (JC).
References
- 1. Ascherio A. Environmental factors in multiple sclerosis. Expert Rev Neurother 2013;13(12 Suppl):3–9. [DOI] [PubMed] [Google Scholar]
- 2. Correale J, Gaitán MI. Multiple sclerosis and environmental factors: the role of vitamin D, parasites, and Epstein‐Barr virus infection. Acta Neurol Scand 2015;132:46–55. [DOI] [PubMed] [Google Scholar]
- 3. International Multiple Sclerosis Genetics Consortium . Network‐based multiple sclerosis pathway analysis with GWAS data from 15,000 cases and 30,000 controls. Am J Hum Genet 2013;92:854–865. [DOI] [PMC free article] [PubMed] [Google Scholar]
- 4. Koch‐Henriksen N, Sørensen PS. The changing demographic pattern of multiple sclerosis epidemiology. Lancet Neurol 2010;9:520–532. [DOI] [PubMed] [Google Scholar]
- 5. Trojano M, Lucchese G, Graziano G, et al. Geographical variations in sex ratio trends over time in multiple sclerosis. PLoS One 2012;7:e48078. [DOI] [PMC free article] [PubMed] [Google Scholar]
- 6. Melcon MO, Correale J, Melcon CM. Is it time for a new global classification of multiple sclerosis? J Neurol Sci 2014;344:171–181. [DOI] [PubMed] [Google Scholar]
- 7. NCD Risk Factor Collaboration (NCD‐RisC) . Trends in adult body‐mass index in 200 countries from 1975 to 2014: a pooled analysis of 1698 population‐based measurement studies with 19·2 million participants. Lancet 1975;2016:1377–1396. [DOI] [PMC free article] [PubMed] [Google Scholar]
- 8. Munger KL, Chitnis T, Ascherio A. Body size and risk of MS in two cohorts of US women. Neurology 2009;73:1543–1550. [DOI] [PMC free article] [PubMed] [Google Scholar]
- 9. Hedström AK, Alfredsson L, Olsson T. Environmental factors and their interactions with risk genotypes in MS susceptibility. Curr Opin Neurol 2016;29:293–298. [DOI] [PubMed] [Google Scholar]
- 10. Xu Y, Hiyoshi A, Brand JS, et al. Higher body mass index at ages 16 to 20 years is associated with increased risk of a multiple sclerosis diagnosis in subsequent adulthood among men. Mult Scler 2020:1352458520928061 10.1177/1352458520928061 [DOI] [PubMed] [Google Scholar]
- 11. Langer‐Gould A, Brara SM, Beaber BE, Koebnick C. Childhood obesity and risk of pediatric multiple sclerosis and clinically isolated syndrome. Neurology 2013;80:548–552. [DOI] [PMC free article] [PubMed] [Google Scholar]
- 12. Versini M, Jeandel PY, Rosenthal E, Shoenfeld Y. Obesity in autoimmune diseases: not a passive bystander. Autoimmun Rev 2014;13:981–1000. [DOI] [PubMed] [Google Scholar]
- 13. Münzberg H, Morrison CD. Structure, production and signaling of leptin. Metabolism 2015;64:13–23. [DOI] [PMC free article] [PubMed] [Google Scholar]
- 14. Al‐Suhaimi EA, Shehzad A. Leptin, resistin and visfatin: the missing link between endocrine metabolic disorders and immunity. Eur J Med Res 2013;18:12. [DOI] [PMC free article] [PubMed] [Google Scholar]
- 15. Rosenbaum M, Leibel RL. 20 years of leptin: role of leptin in energy homeostasis in humans. J Endocrinol 2014;223:T83–T96. [DOI] [PMC free article] [PubMed] [Google Scholar]
- 16. Francisco V, Pino J, Campos‐Cabaleiro V, et al. Obesity, fat mass and immune system: role for Leptin. Front Physiol 2018;9:640. [DOI] [PMC free article] [PubMed] [Google Scholar]
- 17. Matarese G, Procaccini C, De Rosa V. At the crossroad of T cells, adipose tissue, and diabetes. Immunol Rev 2012;249:116–134. [DOI] [PubMed] [Google Scholar]
- 18. Polman CH, Reingold SC, Banwell B, et al. Diagnostic criteria for multiple sclerosis: 2010 revisions to the McDonald criteria. Ann Neurol 2011;69:292–302. [DOI] [PMC free article] [PubMed] [Google Scholar]
- 19. World Health Organization . Obesity: preventing and managing the global epidemic. Report of a WHO consultation. World Health Organ Tech Rep Ser. 2000;894:i‐xii, 1‐253. 2000. [PubMed]
- 20. Stunkard AJ, Sørensen T, Schulsinger F. Use of the Danish Adoption Register for the study of obesity and thinness. Res Publ Assoc Res Nerv Ment Dis 1983;60:115–120. [PubMed] [Google Scholar]
- 21. Considine RV, Sinha MK, Heiman ML, et al. Serum immunoreactive‐leptin concentrations in normal‐weight and obese humans. N Engl J Med 1996;334:292–295. [DOI] [PubMed] [Google Scholar]
- 22. Matarese G, Carrieri PB, Montella S, et al. Leptin as a metabolic link to multiple sclerosis. Nat Rev Neurol 2010;6:455–461. [DOI] [PubMed] [Google Scholar]
- 23. Correale J, McMillan M, McCarthy K, et al. Isolation and characterization of autoreactive proteolipid protein‐peptide specific T‐cell clones from multiple sclerosis patients. Neurology 1995;45:1370–1378. [DOI] [PubMed] [Google Scholar]
- 24. McManus MT, Sharp PA. Gene silencing in mammals by small interfering RNAs. Nat Rev Genet 2002;3:737–747. [DOI] [PubMed] [Google Scholar]
- 25. Correale J, de los Milagros Bassani Molinas M. Time course of T‐cell responses to MOG and MBP in patients with clinically isolated syndromes. J Neuroimmunol 2003;136:162–171. [DOI] [PubMed] [Google Scholar]
- 26. Maximova K, McGrath JJ, Barnett T, et al. Do you see what I see? Weight status misperception and exposure to obesity among children and adolescents. Int J Obes (Lond) 2008;32:1008–1015. [DOI] [PMC free article] [PubMed] [Google Scholar]
- 27. Fredrickson J, Kremer P, Swinburn B, et al. Which measures of adiposity are related to Australian adolescent's perception of their weight? Acta Paediatr 2014;103:e317–e324. [DOI] [PubMed] [Google Scholar]
- 28. Fernández‐Riejos P, Goberna R, Sánchez‐Margalet V. Leptin promotes cell survival and activates Jurkat T lymphocytes by stimulation of mitogen‐activated protein kinase. Clin Exp Immunol 2008;151:505–518. [DOI] [PMC free article] [PubMed] [Google Scholar]
- 29. Homann D, Holz A, Bot A, et al. Autoreactive CD4 + T cells protect from autoimmune diabetes via bystander suppression using the IL‐4/Stat6 pathway. Immunity 1999;11:463–472. [DOI] [PubMed] [Google Scholar]
- 30. Yu P, Lee Y, Liu W, et al. Intratumor depletion of CD4+ cells unmasks tumor immunogenicity leading to the rejection of late‐stage tumors. J Exp Med 2005;201:779–791. [DOI] [PMC free article] [PubMed] [Google Scholar]
- 31. Vaisse C, Halaas JL, Horvath CM, et al. Leptin activation of Stat3 in the hypothalamus of wild‐type and ob/ob mice but not db/db mice. Nat Genet 1996;14:95–97. [DOI] [PubMed] [Google Scholar]
- 32. Bjørbaek C, Uotani S, da Silva B, Flier JS. Divergent signaling capacities of the long and short isoforms of the Leptin receptor. J Biol Chem 1997;272:32686–32695. [DOI] [PubMed] [Google Scholar]
- 33. Hu X, Juneja SC, Maihle NJ, Cleary MP. Leptin–a growth factor in normal and malignant breast cells and for normal mammary gland development. J Natl Cancer Inst 2002;94:1704–1711. [DOI] [PubMed] [Google Scholar]
- 34. Park J, Kusminski CM, Chua SC, Scherer PE. Leptin receptor signaling supports cancer cell metabolism through suppression of mitochondrial respiration in vivo. Am J Pathol 2010;177:3133–3144. [DOI] [PMC free article] [PubMed] [Google Scholar]
- 35. Kawada M, Yamagoe S, Murakami Y, et al. Induction of p27Kip1 degradation and anchorage independence by Ras through the MAP kinase signaling pathway. Oncogene 1997;15:629–637. [DOI] [PubMed] [Google Scholar]
- 36. Saxena NK, Vertino PM, Anania FA, Sharma D. Leptin‐induced growth stimulation of breast cancer cells involves recruitment of histone acetyltransferases and mediator complex to CYCLIN D1 promoter via activation of Stat3. J Biol Chem 2007;282:13316–13325. [DOI] [PMC free article] [PubMed] [Google Scholar]
- 37. Cao H. Adipocytokines in obesity and metabolic disease. J Endocrinol 2014;220:T47–T59. [DOI] [PMC free article] [PubMed] [Google Scholar]
- 38. Abella V, Scotece M, Conde J, et al. Adipokines, metabolic syndrome and rheumatic diseases. J Immunol Res 2014;2014:343746. [DOI] [PMC free article] [PubMed] [Google Scholar]
- 39. Matarese G, Di Giacomo A, Sanna V, et al. Requirement for leptin in the induction and progression of autoimmune encephalomyelitis. J Immunol 2001;166:5909–5916. [DOI] [PubMed] [Google Scholar]
- 40. De Rosa V, Procaccini C, La Cava A, et al. Leptin neutralization interferes with pathogenic T cell autoreactivity in autoimmune encephalomyelitis. J Clin Invest 2006;116:447–455. [DOI] [PMC free article] [PubMed] [Google Scholar]
- 41. Galgani M, Procaccini C, De Rosa V, et al. Leptin modulates the survival of autoreactive CD4+ T cells through the nutrient/energy‐sensing mammalian target of rapamycin signaling pathway. J Immunol 2010;185:7474–7479. [DOI] [PubMed] [Google Scholar]
- 42. Sanna V, Di Giacomo A, La Cava A, et al. Leptin surge precedes onset of autoimmune encephalomyelitis and correlates with development of pathogenic T cell responses. J Clin Invest 2003;111:241–250. [DOI] [PMC free article] [PubMed] [Google Scholar]
- 43. Matarese G, Carrieri PB, La Cava A, et al. Leptin increase in multiple sclerosis associates with reduced number of CD4(+)CD25+ regulatory T cells. Proc Natl Acad Sci USA 2005;102:5150–5155. [DOI] [PMC free article] [PubMed] [Google Scholar]
- 44. Lago F, Dieguez C, Gómez‐Reino J, Gualillo O. Adipokines as emerging mediators of immune response and inflammation. Nat Clin Pract Rheumatol 2007;3:716–724. [DOI] [PubMed] [Google Scholar]
- 45. Matarese G. Leptin and the immune system: how nutritional status influences the immune response. Eur Cytokine Netw 2000;11:7–14. [PubMed] [Google Scholar]
- 46. Fujita Y, Murakami M, Ogawa Y, et al. Leptin inhibits stress‐induced apoptosis of T lymphocytes. Clin Exp Immunol 2002;128:21–26. [DOI] [PMC free article] [PubMed] [Google Scholar]
- 47. Lord GM, Matarese G, Howard JK, et al. Leptin modulates the T‐cell immune response and reverses starvation‐induced immunosuppression. Nature 1998;394:897–901. [DOI] [PubMed] [Google Scholar]
- 48. Farooqi IS, Matarese G, Lord GM, et al. Beneficial effects of Leptin on obesity, T cell hyporesponsiveness, and neuroendocrine/metabolic dysfunction of human congenital Leptin deficiency. J Clin Invest 2002;110:1093–1103. [DOI] [PMC free article] [PubMed] [Google Scholar]
- 49. Sakaguchi S, Ono M, Setoguchi R, et al. Foxp3+ CD25+ CD4+ natural regulatory T cells in dominant self‐tolerance and autoimmune disease. Immunol Rev 2006;212:8–27. [DOI] [PubMed] [Google Scholar]
- 50. Michalek RD, Gerriets VA, Jacobs SR, et al. Cutting edge: distinct glycolytic and lipid oxidative metabolic programs are essential for effector and regulatory CD4+ T cell subsets. J Immunol 2011;186:3299–3303. [DOI] [PMC free article] [PubMed] [Google Scholar]
- 51. Saucillo DC, Gerriets VA, Sheng J, et al. Leptin metabolically licenses T cells for activation to link nutrition and immunity. J Immunol 2014;192:136–144. [DOI] [PMC free article] [PubMed] [Google Scholar]
- 52. De Rosa V, Galgani M, Porcellini A, et al. Glycolysis controls the induction of human regulatory T cells by modulating the expression of FOXP3 exon 2 splicing variants. Nat Immunol 2015;16:1174–1184. [DOI] [PMC free article] [PubMed] [Google Scholar]
- 53. De Rosa V, Procaccini C, Calì G, et al. A key role of leptin in the control of regulatory T cell proliferation. Immunity 2007;26:241–255. [DOI] [PubMed] [Google Scholar]
- 54. Nel AE, Slaughter N. T‐cell activation through the antigen receptor. Part 2: role of signaling cascades in T‐cell differentiation, anergy, immune senescence, and development of immunotherapy. J Allergy Clin Immunol 2002;109:901–915. [DOI] [PubMed] [Google Scholar]
- 55. Nel AE. T‐cell activation through the antigen receptor. Part 1: signaling components, signaling pathways, and signal integration at the T‐cell antigen receptor synapse. J Allergy Clin Immunol 2002;109:758–770. [DOI] [PubMed] [Google Scholar]
- 56. Maccarrone M, Di Rienzo M, Finazzi‐Agrò A, Rossi A. Leptin activates the anandamide hydrolase promoter in human T lymphocytes through STAT3. J Biol Chem 2003;278:13318–13324. [DOI] [PubMed] [Google Scholar]
- 57. Papathanassoglou E, El‐Haschimi K, Li XC, et al. Leptin receptor expression and signaling in lymphocytes: kinetics during lymphocyte activation, role in lymphocyte survival, and response to high fat diet in mice. J Immunol 2006;176:7745–7752. [DOI] [PubMed] [Google Scholar]
- 58. Kerkhoff E, Rapp UR. Induction of cell proliferation in quiescent NIH 3T3 cells by oncogenic c‐Raf‐1. Mol Cell Biol 1997;17:2576–2586. [DOI] [PMC free article] [PubMed] [Google Scholar]
- 59. Rivard N, Boucher MJ, Asselin C, et al. MAP kinase cascade is required for p27 downregulation and S phase entry in fibroblasts and epithelial cells. Am J Physiol 1999;277:C652–C664. [DOI] [PubMed] [Google Scholar]
- 60. Adams CL, Grierson AM, Mowat AM, et al. Differences in the kinetics, amplitude, and localization of ERK activation in anergy and priming revealed at the level of individual primary T cells by laser scanning cytometry. J Immunol 2004;173:1579–1586. [DOI] [PubMed] [Google Scholar]
- 61. Procaccini C, De Rosa V, Galgani M, et al. An oscillatory switch in mTOR kinase activity sets regulatory T cell responsiveness. Immunity 2010;33:929–941. [DOI] [PMC free article] [PubMed] [Google Scholar]
- 62. Haxhinasto S, Mathis D, Benoist C. The AKT‐mTOR axis regulates de novo differentiation of CD4+Foxp3+ cells. J Exp Med 2008;205:565–574. [DOI] [PMC free article] [PubMed] [Google Scholar]
- 63. Delgoffe GM, Powell JD. mTOR: taking cues from the immune microenvironment. Immunology 2009;127:459–465. [DOI] [PMC free article] [PubMed] [Google Scholar]
- 64. Negrotto L, Farez MF, Correale J. Immunologic effects of metformin and pioglitazone treatment on metabolic syndrome and multiple sclerosis. JAMA Neurol 2016;73:520–528. [DOI] [PubMed] [Google Scholar]
- 65. Pfaffl MW. A new mathematical model for relative quantification in real‐time RT‐PCR. Nucleic Acids Res 2001;29:e45. [DOI] [PMC free article] [PubMed] [Google Scholar]
Associated Data
This section collects any data citations, data availability statements, or supplementary materials included in this article.
Supplementary Materials
Figure S1. Antigen‐induced proliferation of autoreactive MBP83–102 T‐cell lines derived from three different patients. Fifty thousand T cells and 5 × 10³ autologous irradiated (3000 rad) PBMCs as source of Ag‐presenting cells, were co‐cultured in media alone (Bckg) or media containing either optimal concentrations of control Ags or the cognate Ag (10 µg/mL). Control Ags included tetanus toxoid (TT; 5 µg/mL), influenza hemagglutinin 307–319 (IH; 10 µg/mL), and a nonstimulatory fragment MBP1–20 (10 µg/mL). Antigen‐specific proliferation was examined in a 60 h assay measuring 3H‐thymidine incorporation. Results are shown as the mean value of counts per minute (CPM) ±SEM for triplicate cultures.
Figure S2. IFN‐γ response to MBP83–102 and MOG63–87 peptides in Th1 polarized T‐cell lines from 3 MS patients. Cell samples were analyzed in triplicate in the IFN‐γ ELISPOT assay to determine their potential to respond to Ag stimulation. Each bar represents the number of spots per 105 peptide‐specific T cells obtained under the following culture conditions: (1) stimulation with the specific peptide, (2) stimulation with PHA (1 µg/mL) as positive control, (3) stimulation with Ovalbumin323–339 peptide (20 µg/mL) as a nonrelevant peptide, (4) cells in which either the cognate Ag or the detection antibody was omitted, as negative controls, (5) wells containing 2 × 10⁵ peptide‐specific T cells and media only for determination of background responses. The specific number of cytokine‐producing cells was calculated by subtracting the numbers of spots obtained in 0 Ag background control cultures, from the number of spots obtained in cultures exposed to stimulating Ag. Data represent mean ± SEM for triplicate cultures. Please note the use of logarithmic scale.
Figure S3. In all panels, cells were stimulated with soluble anti‐CD3/anti‐CD28 (5 µg/mL each) during 6 h, in the presence and in the absence of leptin, and p‐STAT3Y705, p‐ ERK1T202/Y204/ERK2T185/Y187, and p27kip1 expression measured using ELISA . Panels A, D, and G represent results obtained in Jurkat cells (positive control), panels B, E, and H represent results observed in autoreactive‐MOG63–87‐peptide‐specific T cells, and panels C, F, and I represent data obtained from MBP83–102‐peptide‐specific T cells in which leptin receptor was silenced, as described in material and methods (negative control). Data represent mean ± SEM of 7 individual experiments conducted in triplicate. A Mann–Whitney test was used to evaluate differences between groups in the presence and in the absence of leptin. W/o LEPR: Leptin receptor silenced ****P < 0.0001.