

Abstract
The gut microbiota affects tissue physiology, metabolism, and function of both the immune and nervous systems. We found that intrinsic enteric-associated neurons (iEANs) in mice are functionally adapted to the intestinal segment they occupy; ileal and colonic neurons are more responsive to microbial colonization than duodenal neurons. Specifically, a microbially responsive subset of viscerofugal CART+ neurons, enriched in the ileum and colon, modulated feeding and glucose metabolism. These CART+ neurons send axons to the prevertebral ganglia and are polysynaptically connected to the liver and pancreas. Microbiota depletion led to NLRP6- and caspase 11–dependent loss of CART+ neurons and impaired glucose regulation. Hence, iEAN subsets appear to be capable of regulating blood glucose levels independently from the central nervous system.
Enteric-associated neurons (EANs) comprise a numerous and heterogeneous population of neurons innervating the gastrointestinal (GI) tract that monitor and respond to various environmental cues such as mechanical stretch and luminal content (1, 2). The vast majority of luminal stimuli are derived from the diet and commensal microbes, which may be sensed directly by EAN fibers positioned along the intestinal epithelium or indirectly through signals derived from nonneuronal cells inhabiting the same compartment (1, 3). Intrinsic EANs (iEANs) are neural crest–derived and organized in two distinct layers: the myenteric or Auerbach’s plexus and submucosal or Meissner’s plexus (2). iEANs can operate autonomously and are primarily tasked with modulation of intestinal motility and secretory function (2). Recent studies have demonstrated that the gut microbiota influences the basal activity of intestine-associated cells, including EANs and immune cells (2, 3), as well as host metabolism (4). These studies highlight the impact of the gut microbiota on EANs and key mammalian physiological processes; however, the cellular circuits and molecular components that mediate gut-EAN communication remain poorly understood. We sought to determine how the microbiota affects iEANs to better characterize their role in host physiology.
Microbiota-dependent transcriptional changes in enteric neurons are region-specific
To profile iEANs in an untargeted and region-specific manner, we performed translating ribosomal affinity purification (TRAP), a cell type–specific actively translated mRNA profiling approach. We interbred pan-neuronal Snap25Cre mice with Rpl22lsl-HA (RiboTag) mice, allowing hemagglutinin (HA) immunoprecipitation of actively translated mRNA. Expression of HA-tagged ribosomes was observed in neurons in the myenteric plexus of Snap25RiboTag mice (Fig. 1A). RNA sequencing (RNA-seq) of bound transcripts revealed significant enrichment of neuron-specific genes and pathways in Cre+ animals compared with Cre− animals (fig. S1, A to C). Given their deep integration into the intestinal tissue, we sought to understand how iEANs might differ from extrinsic EANs (eEANs) (5) innervating the gut. TRAP RNA-seq (TRAP-seq) analysis of iEANs and eEANs (nodose, NG; celiac–superior mesenteric, CG-SMG; and dorsal root ganglion, DRG) (5) suggested that iEANs possess a distinct translational profile (Fig. 1B and fig. S2A). We found that iEANs were primarily defined by enriched transcripts related to neuropeptide signaling as compared with either NG and DRG or CG-SMG, which had increased expression of transcripts involved in sensory processes and catecholamine production, respectively (Fig. 1C and fig. S2, B to D).
Fig. 1. TRAP-seq profiling of iEANs reveals anatomical region–specific differences.
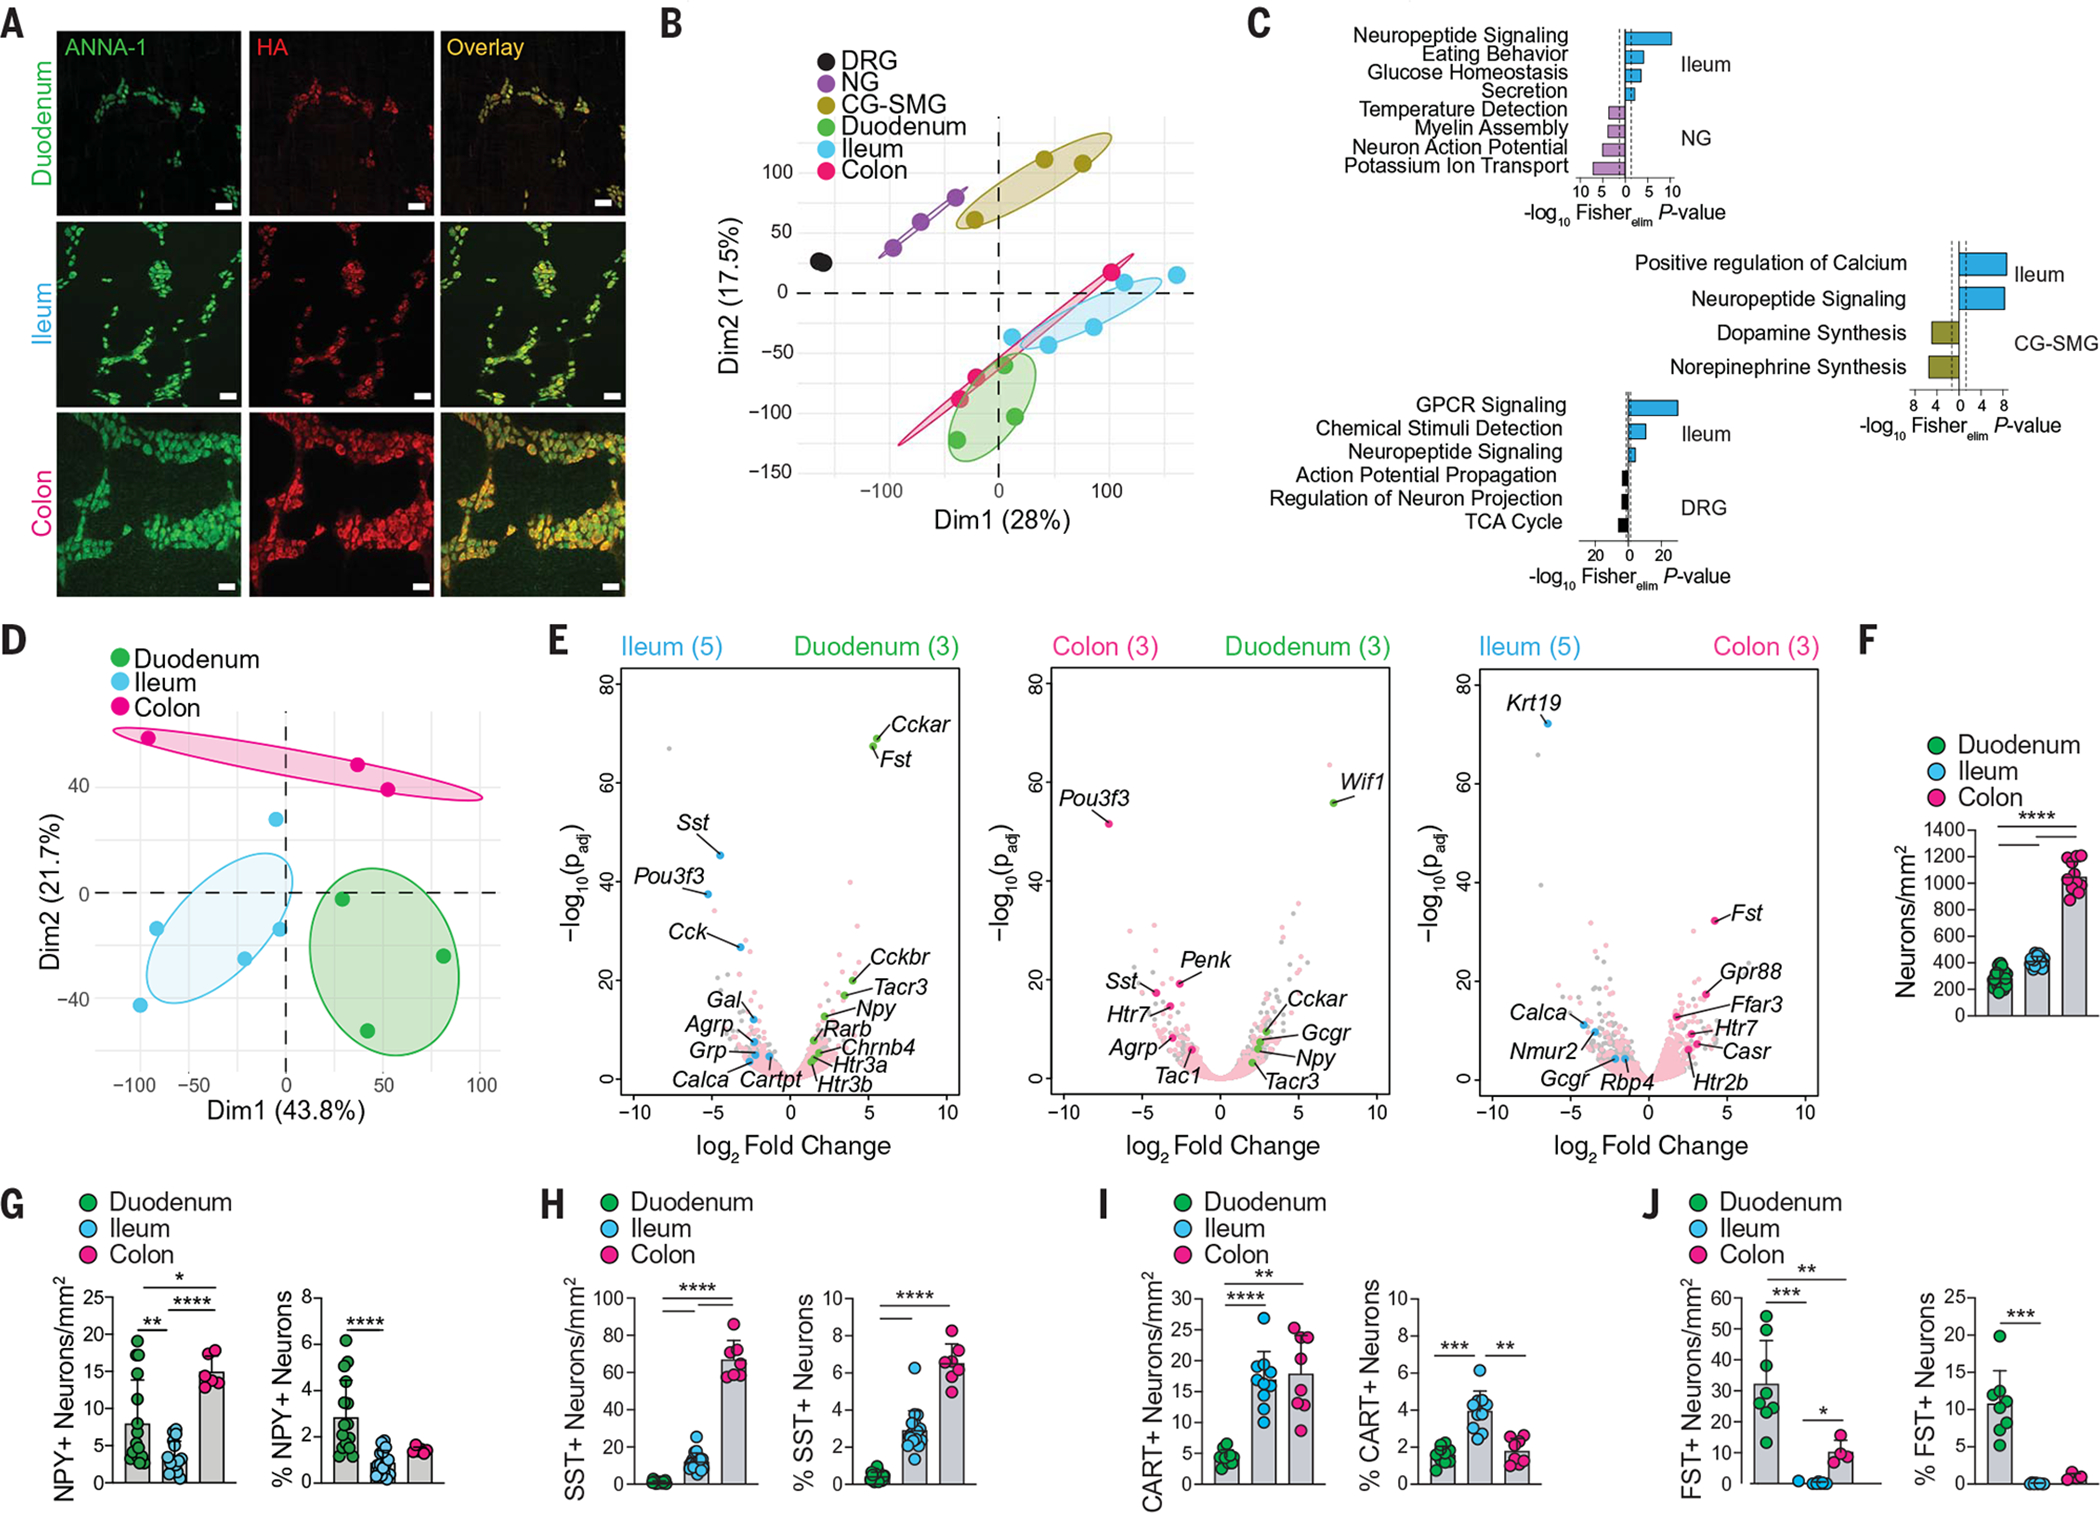
Snap25RiboTag SPF mice were analyzed in (A) to (E). (A) Whole-mount immunofluorescence (IF) of duodenum, ileum, and colon myenteric plexus using anti-neuronal nuclear (ANNA-1, green) and anti-HA (red) antibodies. Scale bars are 50 mm. (B) Principal components analysis (PCA) of neuronal translatomes from DRG, NG, CG-SMG, duodenum, ileum, and colon. (C) Gene ontology (GO) pathways of differentially expressed genes (DEGs) [log2 fold change (FC) > 1, and adjusted P value (Padj) < 0.05] enriched in ileum versus indicated ganglia. GPCR, G protein–coupled receptor; TCA cycle, tricarboxylic acid cycle. (D) PCA of neuronal translatomes from duodenum, ileum, and colon. (E) Volcano plots of DEGs between myenteric iEANs. Pink dots represent all intestine neuronal immunoprecipitation (IP)–enriched transcripts; colored dots represent DEGs of interest between each pair of intestine segments. Sample numbers are indicated in parentheses. (F) Number of total iEANs in different gut regions. (G to J) Numbers and percentages of (G) NPY+, (H) SST+, (I) CART+, and (J) FST+ myenteric iEANs in different gut regions. *P < 0.05, **P < 0.01, ***P < 0.001, and ****P < 0.0001; for numbers of iEANs in (F) to (J), Brown-Forsythe and Welch analysis of variance (ANOVA) with Dunnett’s T3 multiple comparisons test was performed; for percentages of iEANs in (G) to (J), Kruskal-Wallis test with Dunn’s multiple comparisons test was performed. Error bars indicate SD.
Comparison between translational profiles of myenteric iEANs isolated from the duodenum, ileum, and colon indicated that iEANs segregate based on their anatomical location (6) (Fig. 1D and fig. S3, A to C). The proximal small intestine is highly absorptive and enriched with enteroendocrine cell (EEC) subsets associated with lipid and nutrient detection (7). Consistently, we found that duodenal iEANs, in comparison to ileal and colonic iEANs, express significantly higher levels of transcripts encoding receptors involved in the response to proximal EEC- or iEAN-derived signals, such as cholecystokinin receptor A (Cckar), glucagon receptor (Gcgr), and tachykinin receptor 3 (Tacr3) (Fig. 1E and fig. S3, A to C). There are also regional differences in neuropeptide transcripts, including neuropeptide Y (Npy) enrichment in duodenum iEANs. Terminal ileum and colon iEANs are enriched in neuropeptide transcripts, including somatostatin (Sst), cocaine- and amphetamine-regulated transcript (CART, encoded by Cartpt), proenkephalin (Penk), gastrin releasing peptide (Grp), agouti-related peptide (Agrp), and tachykinin 1 (Tac1), all of which, besides Agrp, are thought to be involved in controlling intestine motility through the myenteric plexus (8–12) (Fig. 1E and fig. S3, A to C). Immunofluorescence analysis confirmed a region-specific compartmentalization of neuropeptides at the protein level and identified regional differences in neuronal numbers along the intestine (Fig. 1F and fig. S3D). For instance, NPY, which is typically involved in intestinal inflammation or inhibition of neurotransmission (13, 14), was enriched in duodenum iEANs (Fig. 1G and fig. S3E). By contrast, the neuropeptide SST, which is involved in EEC regulation of several GI hormones (15) and inhibition of smooth muscle contraction (8, 13), is highly expressed in the ileum and colon but scarcely expressed in the duodenum (Fig. 1H and fig. S3F). We also observed increased numbers of CART+ neurons, which are thought to play a role in intestinal nitrous oxide neurotransmission and neuroprotection (9, 16), in the ileum and colon (Fig. 1I and fig. S3, G to I). Finally, we found that duodenum iEANs are particularly enriched in pleiotropic growth factors previously shown to be expressed in intestinal epithelium, such as follistatin 1 (Fst1) (17) and WNT inhibitory factor 1 (Wif1) (18). Immunofluorescence analysis confirmed prominent FST1+ neurons and nerve fibers in the duodenum that were absent in the ileum and sparse within the colon (Fig. 1J and fig. S3J). These data reveal the region-specific translational profiles of iEANs that likely reflect the function of distinct intestinal regions.
Because the density and diversity of the gut microbiota increase from the proximal to distal intestine, we examined whether regionally distinct iEAN translational programs are partially influenced by the microbiota. To determine if microbial stimuli influence iEAN morphology, we first performed AdipoClear on whole-mount intestinal tissue followed by light-sheet microscopy of iEANs in the ileum and colon of germ-free (GF) or specific pathogen–free (SPF) mice. In both GF and SPF mice, iEANs were organized into distinct plexuses, and we observed vast mucosal innervation in the small and large intestines that extended into individual villi with fibers adjacent to the epithelium (Fig. 2A and movies S1 to S4). We noted that ileum villi are thin and blunted in GF animals, inherently leading to different nerve fiber structure (Fig. 2A and movies S1 to S4).
Fig. 2. Microbiota affect iEAN translatomes in a compartmentalized manner.
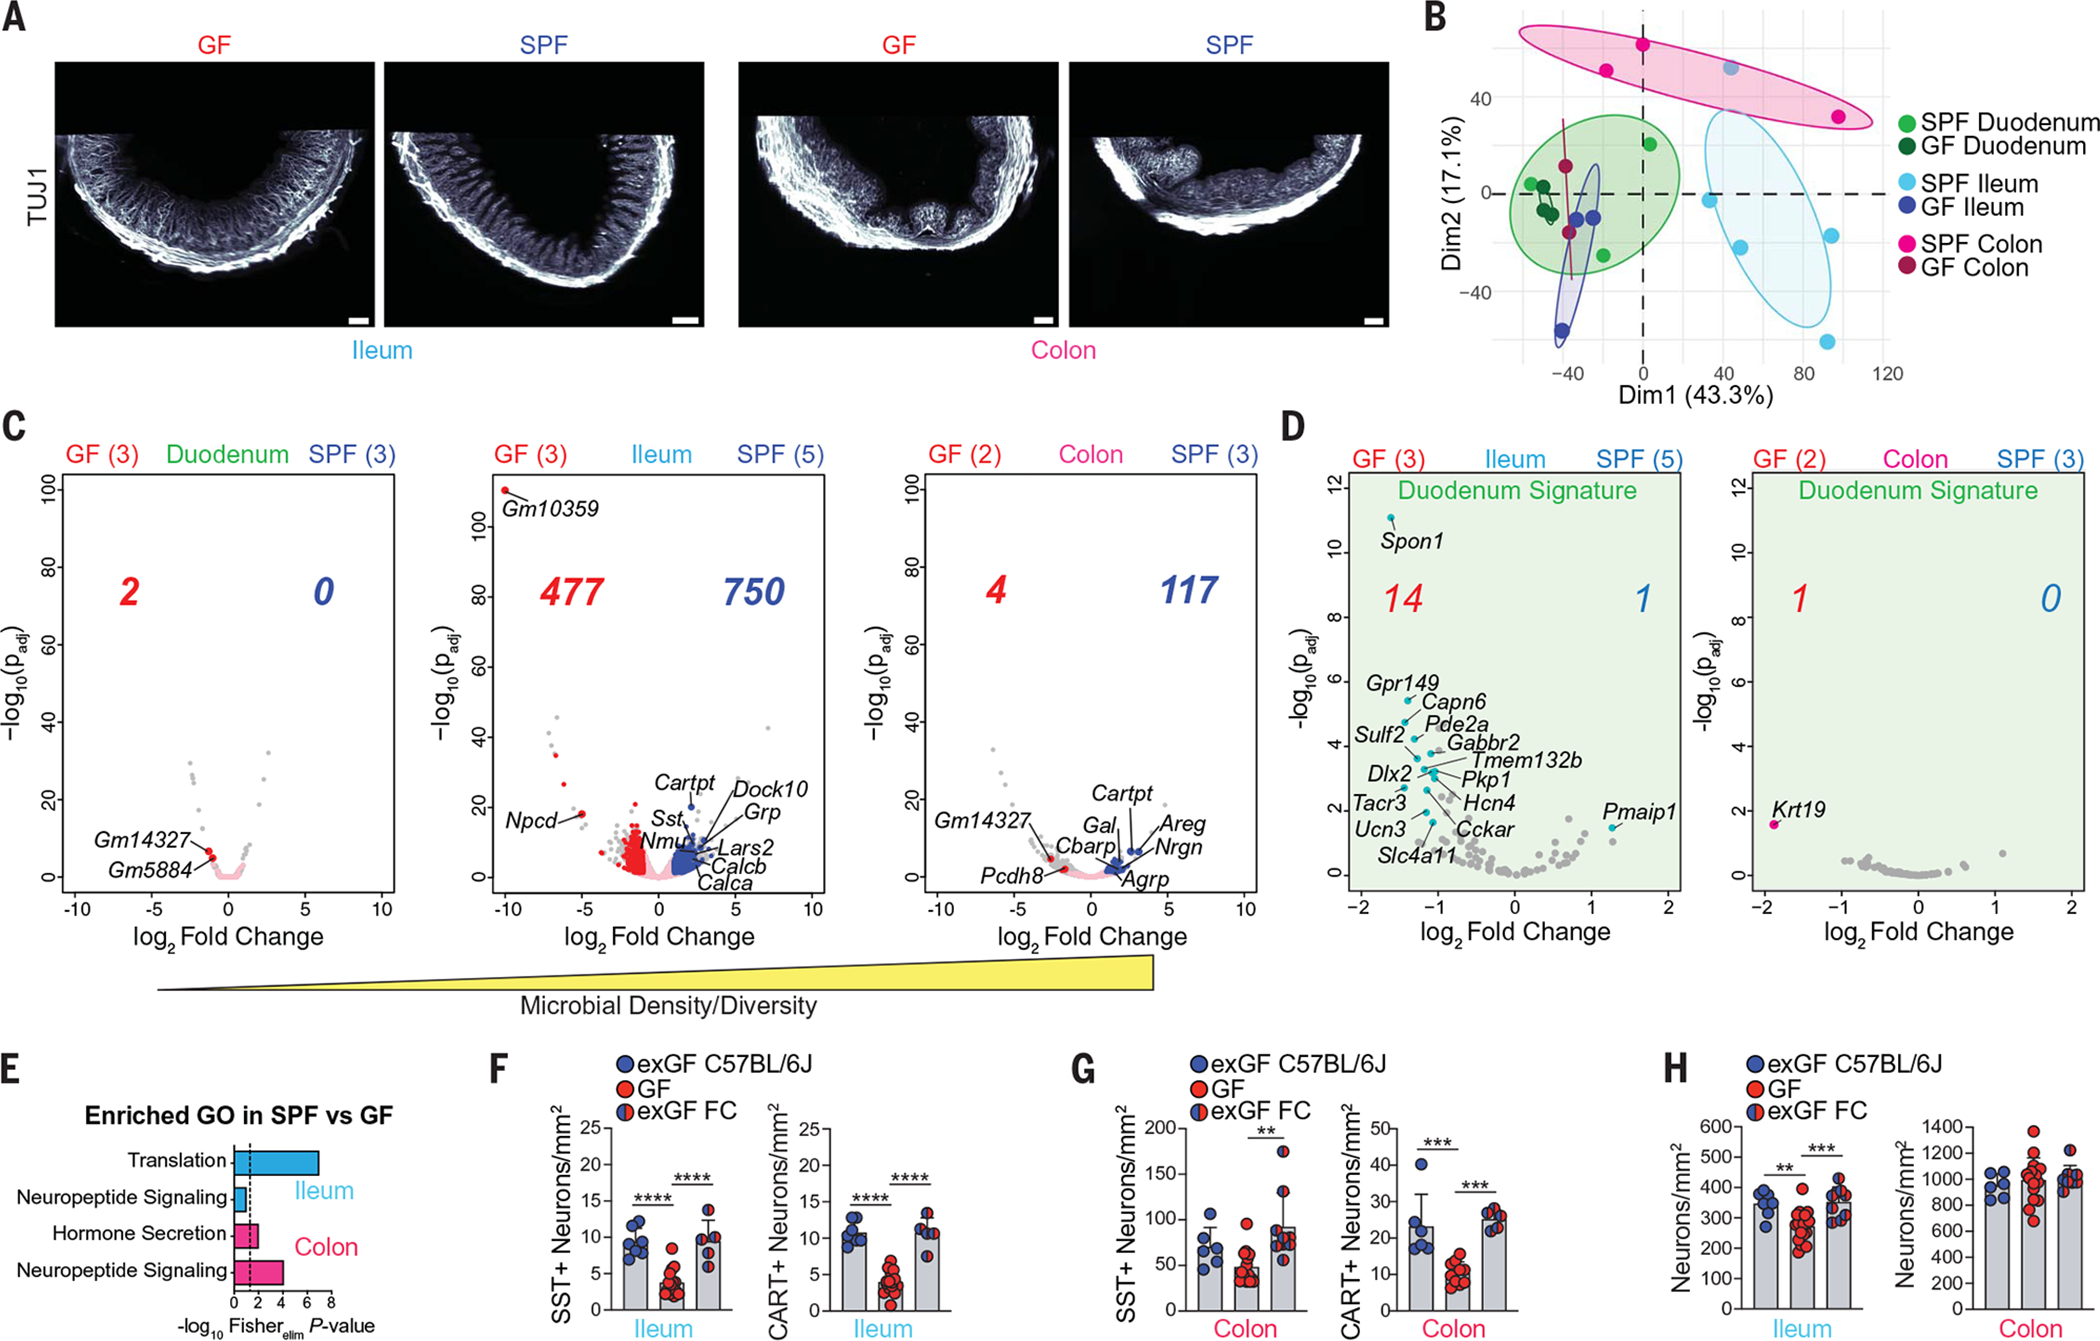
(A) AdipoClear light-sheet images of ileum and colon of GF or SPF C57BL/6J mice using anti-TUJ1 antibody. Scale bars for ileum and GF colon are 200 μm; scalebar for SPF colon is 100 μm. (B) PCA of GF and SPF iEANs from duodenum, ileum, and colon. (C and D) Volcano plots of (C) duodenum, ileum, and colon iEAN DEGs between GF and SPF mice and (D) differentially expressed “duodenum signature” transcripts in ileum and colon iEANs of GF and SPF mice. Pink dots represent all intestine neuronal IP-enriched transcripts; colored dots and numbers represent significantly differentially expressed transcripts (log2 FC > 1, and Padj < 0.05). Sample numbers are indicated in parentheses. (E) GO pathways of DEGs enriched in SPF versus GF samples. In (B) to (E), Snap25RiboTag mice were analyzed. (F and G) Numbers of SST+ and CART+ iEANs in (F) ileum and (G) colon of GF mice, exGF mice, and GF mice colonized with exGF feces (exGF FC). (H) Total iEANs in ileum (left) and colon (right) of GF, exGF, and exGF FC mice. **P < 0.01, ***P < 0.001, and ****P <0.0001; for numbers of SST+ iEANs in (F) and (G), CART+ iEANs in (F), and total iEANs in (H), one-way ANOVA with Tukey’s multiple comparisons test was performed; for numbers of CART+ iEANs in (G), Brown-Forsythe and Welch ANOVA with Dunnett’s T3 multiple comparisons test was performed. Error bars indicate SD.
To determine whether the microbiota affects iEAN gene expression profiles along the intestine, we rederived Snap25RiboTag mice under GF conditions (fig. S4A). Analysis of TRAP-seq from duodenum, ileum, and colon myenteric iEANs of GF Snap25RiboTag mice revealed microbiota-dependent transcriptional changes in each region (Fig. 2, B and C). Although no transcripts were significantly up-regulated in the duodenum in SPF mice compared with GF mice, 750 and 117 transcripts were significantly up-regulated in the ileum and colon, respectively (Fig. 2C). The absence of significant microbiota-dependent changes in the duodenum could be related to the decreased microbial density and diversity in this region. Furthermore, principal components analysis showed that duodenum, ileum, and colon samples from GF mice all clustered together with duodenum samples of SPF mice (Fig. 2B). To determine whether these distal regions gain a “duodenum-like” gene expression profile, we generated a list of transcripts enriched in SPF duodenum as compared with SPF ileum and colon (table S1). A subset of duodenum-enriched transcripts was up-regulated in the ileum, but not colon, of GF animals as compared with SPF animals (Fig. 2D). The third principal component also showed segregation of colon samples from the small intestine, which may reflect the presence of iEANs derived from sacral progenitors in the large intestine, or functional differences between colon and ileum (fig. S4B). Direct comparison between regions in GF mice also indicated segregation, suggesting that certain features of region-specific iEAN programming are microbiota-independent (fig. S4C).
In the ileum and colon, we found microbiota-dependent transcripts encoding neuropeptides associated with neuro-immune cross-talk, such as Nmu (19); EAN physiological function, such as Sst or Cartpt; and functions outside of the intestine, like Agrp (colon only) (Fig. 2, C and E). SST and CART protein expression changes were confirmed by quantification of immunofluorescence images from GF and SPF mice (Fig. 2, F and G, and fig. S4, D to G). Quantification of iEANs in the myenteric plexus of GF and SPF mice also revealed a significant reduction in iEAN numbers in the duodenum and ileum, but not colon, of GF mice (Fig. 2H and fig. S4H). Finally, analysis of GF and SPF datasets using PASTAA (predicting associated transcription factors from annotated affinities) identified cAMP response element–binding protein (CREB) among the most enriched transcription factors for the ileum and colon in SPF mice (fig. S4I). Because the level of phosphorylated CREB (pCREB) in neurons is often used as an indirect measure of activation and it is a mediator of neuropeptide transcription (20), we used immunofluorescence analysis of pCREB at serine-133, which is a key modification to induce gene transcription. We found a significant reduction of pCREB in the ileum myenteric plexus of GF mice compared with SPF mice (fig. S4, J and K), demonstrating that iEANs may be hypoexcitable under gnotobiotic conditions, as previously proposed (21), and providing a possible explanation for the reduction in neuropeptide transcripts observed.
To address whether altered neuropeptide levels and iEAN numbers in GF mice are the result of a developmental defect, we provided adult C57BL/6 GF mice with age- and sex-matched feces from SPF mice on a matched GF diet (exGF). Colonization of 8-week-old GF animals with SPF feces was sufficient to increase the number of SST+ and CART+ neurons in the colon and ileum to levels similar to SPF animals after 2 weeks, as well as a notable increase in the density of SST+ and CART+ nerve fibers (Fig. 2, F and G, and fig. S4, L to O). We also noted that recolonization restored iEAN numbers in the ileum, whereas the colon remained unaffected by colonization (Fig. 2H). These results establish both regional differences and the microbial influence on iEAN numbers and gene expression profiles, particularly on neuropeptidergic coding.
Microbiota modulate iEAN numbers through NLRP6 and caspase 11
We next asked if microbiota-dependent changes in iEANs can be observed in SPF mice after administration of broad-spectrum antibiotics or if a microbiome must be absent from birth. We administered antibiotics (vancomycin, ampicillin, metronidazole, and neomycin) through drinking water to SPF mice for 2 weeks and detected a significant decrease in the number of iEANs in the ileum and colon but not in the duodenum (Fig. 3A and fig. S5A). We recently described an inflammasome-dependent pathway whereby caspase 11 (caspase 4 in humans) and NOD-like receptor family pyrin domain containing 6 (NLRP6) are key mediators of neuronal death after infection (22). To evaluate whether the iEAN reduction observed after microbiota depletion was also dependent on this pathway, Casp1−/−Casp11−/− (ICE−/−) or Casp11−/− mice were exposed to Splenda or antibiotics in the drinking water. Quantification of iEANs in the ileum of antibiotic-treated mice did not reveal iEAN loss in ICE−/− or Casp11−/− mice, suggesting an additional role for caspase 11 in the reduction of iEANs during dysbiosis (Fig. 3A and fig. S5, A to D). We confirmed that these changes in neuronal numbers were not the effect of morphological differences in the intestine induced by antibiotics or genotype (fig. S5, E to G). Furthermore, neuronal- and neuroendocrine-specific deletion (Snap25) of Nlrp6 and Casp11 may prevent loss of enteric neurons after antibiotic administration (Fig. 3, B and C). Importantly, this neuronal reduction was not permanent, because antibiotic withdrawal for 2 weeks resulted in the recovery of neuronal numbers to SPF levels (Fig. 3D). Treatment with vancomycin, ampicillin, or metronidazole alone, but not neomycin or a single dose of streptomycin, also induced a reduction in total neuronal numbers, suggesting a possible role for specific bacteria in the physiological iEAN maintenance (Fig. 3E and fig. S5, H and I). Quantification of microbiota load after oral or intraperitoneal antibiotic administration, and subsequent neuronal quantification, further suggested that neuronal loss was induced by microbial depletion and not by direct antibiotic neurotoxicity or dysbiosis per se (fig. S5, J to M). We next examined the microbiota-modulated neuropeptide pathways that we identified in GF mice and analogously observed a significant decrease in number and percentage of SST+ and CART+ neurons in the ileum and colon, but not duodenum, after antibiotic treatment (Fig. 3F). Consistently, short-term microbial depletion by single-dose streptomycin administered to wild-type (WT) mice or continuous broad-spectrum antibiotic treatment of Casp1/11−/−, Casp11−/−, Snap25ΔNlrp6, and Snap25ΔCasp11 mice did not affect neuropeptide-specific iEAN numbers in the ileum and colon (Fig. 3, F to H, and fig. S6, A to O). Given that neuropep-tide expression can vary with drastic changes in nutrient availability during fasting (fig. S7, A to C), we confirmed that antibiotic treatment did not result in body weight change at the time of analysis, indicating that food intake was comparable between groups (fig. S7D). The above data establish that iEANs, including SST+ and CART+ neuropeptide subsets, can be tuned by the microbiota. Additionally, these analyses define a role for caspase 11 and the noncanonical inflamma- some sensor NLRP6 in microbiota-mediated iEAN regulation.
Fig. 3. iEAN loss after antibiotic treatment is mediated by NLRP6 and caspase 11.
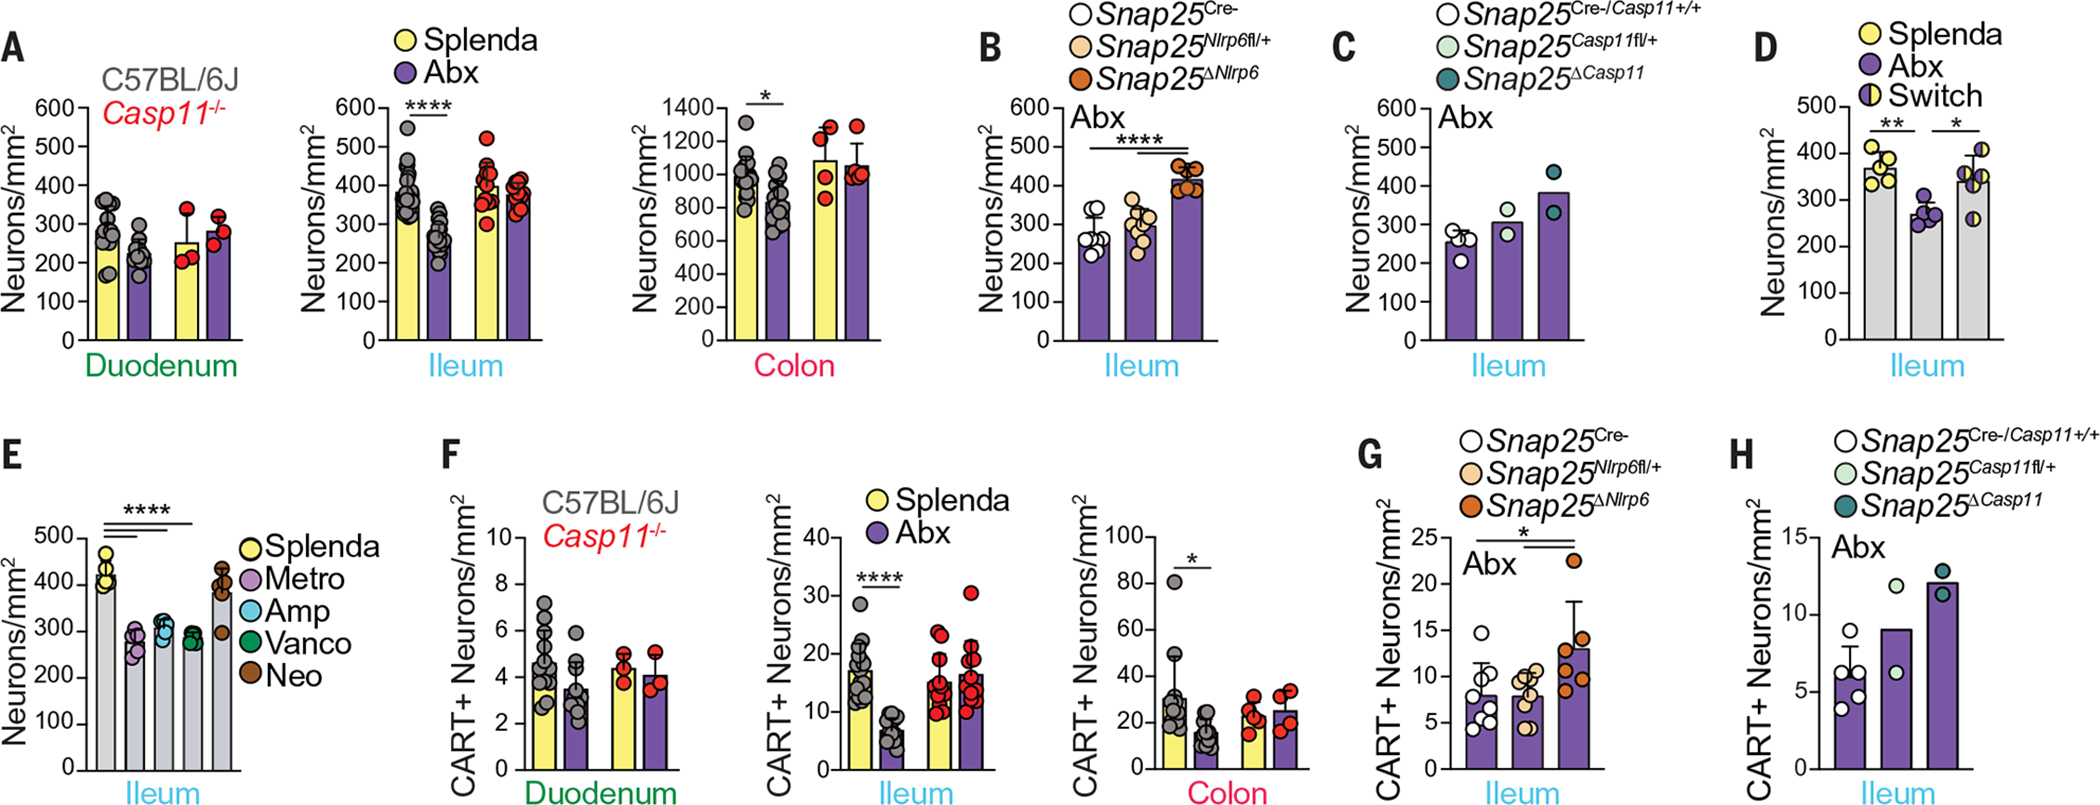
(A) Myenteric iEAN numbers in duodenum, ileum, and colon of C57BL/6J and Casp11−/− mice treated with antibiotics (vancomycin, ampicillin, metronidazole, and neomycin, referred to collectively as Abx) or Splenda. (B and C) Ileal myenteric iEAN numbers for (B) Snap25ΔNlrp6 or (C) Snap25ΔCasp11 mice on Abx. (D) Ileal myenteric iEAN numbers for C57BL/6J SPF mice after 4 weeks on Abx or Splenda, or Abx followed by Splenda for 2 weeks each (Switch). (E) Ileal myenteric iEAN numbers for C57BL/6J SPF mice on metronidazole (Metro), ampicillin (Amp), vancomycin (Vanco), neomycin (Neo), or Splenda. (F) CART+ myenteric iEAN numbers in duodenum, ileum, and colon of C57BL/6J and Casp11−/− mice on Abx or Splenda. (G and H) CART+ ileal myenteric iEAN numbers for (G) Snap25ΔNlrp6 and control or (H) Snap25ΔCasp11 and control mice on Abx. *P < 0.05, **P < 0.01, and ****P < 0.0001; for (A) and (F), two-way ANOVA with Tukey’s multiple comparisons test was performed; for (B), (D), (E), and (G), one-way ANOVA with Tukey’s multiple comparisons test was performed. Error bars indicate SD.
Microbiota-modulated CART+ iEANs are viscerofugal and glucoregulatory
To test possible functional roles for microbiota-modulated iEANs in intestinal physiology, we focused on CART+, NPY+, and AGRP+ neuronal populations because of their distinct features. CART+ neurons are enriched in the ileum and colon and are bidirectionally modulated by the microbiota, and unlike SST, CART is not expressed by EECs in these gut regions (23). Meanwhile, AGRP+ neurons are particularly enriched in the colon and reduced in GF mice, and NPY+ neurons are enriched in the duodenum and not affected by the microbiota. These three neuropeptides are also expressed by neuronal populations in the hypothalamus that work in concert to regulate energy balance (24) and, as such, could potentially play a similar role in gut-specific circuits to influence feeding behavior. Whole-mount analysis of intestinal muscularis externa using RNA in situ hybridization confirmed the expression of Npy and Cartpt in the ileum and colon and Agrp in the midcolon (fig. S8, A to C). We obtained Cre lines corresponding to the three neuropep-tides and validated Cre, Cartpt, Npy, and Agrp expression in the periphery using in situ hybridization (fig. S8, D to G). Because these neuropeptides are known to be expressed in both the periphery and central nervous system (CNS) (13, 24–26), we used a local retrograde viral delivery approach into the duodenum, ileum, and colon to guide us on subsequent gut-restricted adeno-associated virus (AAV) approaches. Injection of retrograde AAV (AAVrg)-FLEX-tdTomato into the intestine of CartptCre, NpyCre, and AgrpCre mice (generating CartptEAN-tdTomato, NpyEAN-tdTomato, and AgrpEAN-tdTomato, respectively) revealed a prominent population of tdTomato+ neurons in the myenteric plexus of CartptEAN-tdTomato and NpyEAN-tdTomato mice (Fig. 4A and fig. S8, H and I). NpyEAN-tdTomato and CartptEAN-tdTomato neurons displayed considerable innervation of the circular and longitudinal smooth muscle within these segments of the intestine, with CartptEAN-tdTomato also exhibiting dense interganglionic patterning (Fig. 4A and fig. S8, H and I). We found a sparse population of tdTomato+ neurons in the midcolon of AgrpEAN-tdTomato, which exhibited muscular and interganglionic innervation (fig. S8J). We confirmed a lack of tdTomato expression in the submucosal plexus, NG, DRG, and CG-SMG in CartptEAN-tdTomato and AgrpEAN-tdTomato mice. We also observed a population of tdTomato+ neurons in the submucosal plexus and gut-projecting CG-SMG neurons in NpyEAN-tdTomato mice (fig. S8K). Additionally, a significant number of tdTomato+ fibers were detected in the CG-SMG of CartptEAN-tdTomato mice (Fig. 4B and fig. S8L), suggesting that some CART+ neurons are viscerofugal (iEAN projecting axons outside of the intestine and previously described as mechanosensitive) (27).
Fig. 4. CART+ iEANs in the distal intestine are viscerofugal and glucoregulatory.
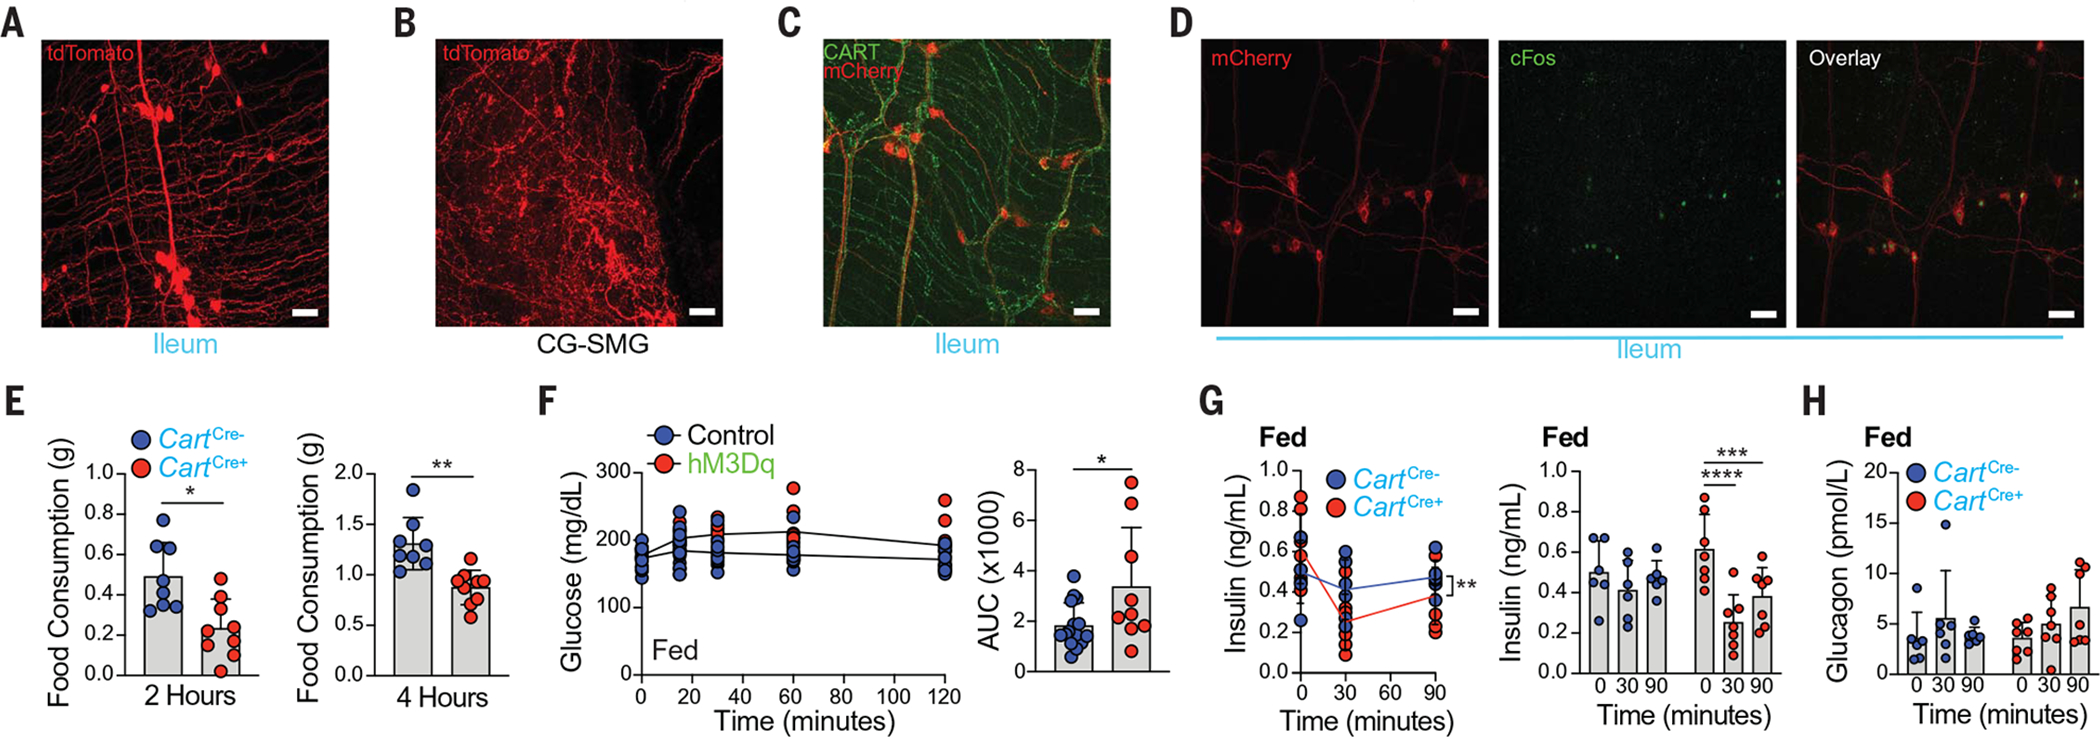
(A and B) Whole-mount IF image of the (A) ileum myenteric plexus (MP) and (B) CG-SMG of CartCre+ injected with AAVrg-FLEX-tdTomato into (A) ileum and (B) duodenum, ileum, and colon. (C and D) Whole-mount IF image of the ileum MP of CartCre+ mice injected with AAV9-hSyn-DIO-hM3Dq-mCherry into the ileum, (C) stained for CART (green) and mCherry (red) and (D) 3 hours after C21 administration, stained for mCherry (red) and cFos (green). (E) Food consumption at night 2 hours (left) and 4 hours (right) after C21 administration in CartCre+ and CartCre− mice injected with AAV9 as in (C). (F) Blood glucose levels after C21 administration (left) and area under curve (AUC) analysis (right) in fed CartCre+ and CartCre− (control) mice injected with AAV9-hSyn-DIO-hM3DqmCherry or control AAV9-hSyn-DIO-mCherry into ileum and colon. (G and H) Plasma (G) insulin and (H) glucagon levels after C21 administration in CartCre+ and CartCre− mice injected with AAV9-hSyn-DIO-hM3Dq-mCherry into ileumand colon. Scale bars in (A) to (D) are 50 μm. *P < 0.05, **P < 0.01, ***P < 0.001, and ****P < 0.0001; for (E) and (F), two-tailed unpaired Student’s t test was performed; for (G), two-way (left) or one-way ANOVA (right) with Tukey’s multiple comparisons test was performed. Error bars indicate SD.
To directly modulate neuronal activity and assess the function of these intestine neuropeptide populations, we used a gut-restricted chemogenetic approach by injecting excitatory DREADD (designer receptor exclusively activated by designer drugs) virus (AAV9-FLEX-Syn-hM3Dq-mCherry) into the distal ileum and proximal colon of CartptCre and NpyCre mice or into the midcolon of AgrpCre mice (Fig. 4, C and D, and fig. S9A). We found no change in total intestinal transit time for any of the three neuropeptide lines tested after administration of the DREADD ligand, compound 21 (C21), although changes in either small or large intestine motility separately cannot be ruled out (fig. S9, B to D). However, we observed a significant decrease in food consumption during day feeding at 1 and 2 hours, as well as during night feeding at 2 and 4 hours, after C21 injection in CartptEAN-hM3Dq but not NpyEAN-hM3Dq or AgrpEAN-hM3Dq mice (Fig. 4E and fig. S9, E to G). We found no clear evidence for hM3Dq (mCherry) expression outside of the distal ileum and proximal colon, indicating that the observed changes in feeding behavior are dependent on iEAN-specific neuronal stimulation. We next evaluated whether the reduction in feeding was accompanied by acute changes in blood glucose or by glucoregulatory hormone levels that can regulate the activity of CNS nuclei that control feeding behavior (28). We assessed the effects of either excitatory (hM3Dq) or inhibitory (hM4Di) DREADD viruses in CartptCre mice, again injected into their distal ileum and proximal colon. Administration of C21 led to significantly higher blood glucose levels in CartptEAN-hM3Dq mice than in control mice, whereas inhibition of these neurons in CartptEAN-hM4Di mice did not change blood glucose levels (Fig. 4F and fig. S9, H and I). On measurement of canonical glucoregulatory hormones, we found a significant decrease in insulin levels at 30 and 90 min after C21 administration to CartptEAN-hM3Dq mice, whereas glucagon levels were not significantly altered (Fig. 4, G and H). These data indicate that stimulation of ileum and colon CART+ iEANs results in increased blood glucose and decreased insulin levels, with a subsequent reduction in food consumption.
We next asked how CART+ iEANs can exert their glucoregulatory function. One possible route could be through direct detection of signals coming from the epithelium. However, imaging analyses confirmed that CART+ neurons are not present in the submucosal plexus nor do they project to the epithelium (fig. S10, A and B, and movie S5). We confirmed their viscerofugal nature with viral anatomical and cholera toxin subunit B (CTB) tracing (Fig. 5, A and B, and movie S5). We also noted that some CART+ neurons appear to directly interact with other CART− viscerofugal neurons (fig. S10C). These CART+ viscerofugal neurons send axonal projections to the CG-SMG, which in turn provides sympathetic innervation to several visceral organs, including the pancreas and liver (29, 30). Sympathetic innervation of the pancreatic islets can stimulate glucagon release and inhibit insulin secretion through adrenergic receptor engagement on alpha and beta cells, respectively (29). Sympathetic stimulation of the liver can drive gluconeogenesis and glycogenolysis through hepatocyte adrenergic receptor activation (30). To determine if a synaptically connected circuit exists between the gut, sympathetic ganglia, and the pancreas or liver, we performed polysynaptic retrograde tracing using pseudo-rabies virus (PRV). We injected enhanced green fluorescent protein (EGFP)–expressing PRV into the pancreas and monomeric red fluorescent protein (mRFP)–expressing PRV into the parenchyma of the liver and assessed their synaptic connections to the CG-SMG and the intestine (fig. S10D). We detected viral spread or CTB labeling from both organs to the CG-SMG as early as 1 day after injection (fig. S10E). We observed GFP+ neurons in the myenteric plexuses of the duodenum, ileum, and colon 4 days after injection, with the highest concentration of neurons occurring in the colon and ileum, whereas RFP+ neurons were only observed in the ileum (Fig. 5C). We did not observe dual RPF and GFP labeling of ileal viscerofugal neurons, suggesting that the pancreas and liver are connected by two separate circuits. Together, we found that glucoregulatory organs are polysynaptically connected to the gut through viscerofugal neurons.
Fig. 5. CART+ viscerofugal neurons are polysynaptically connected to the liver and pancreas through the CG-SMG.
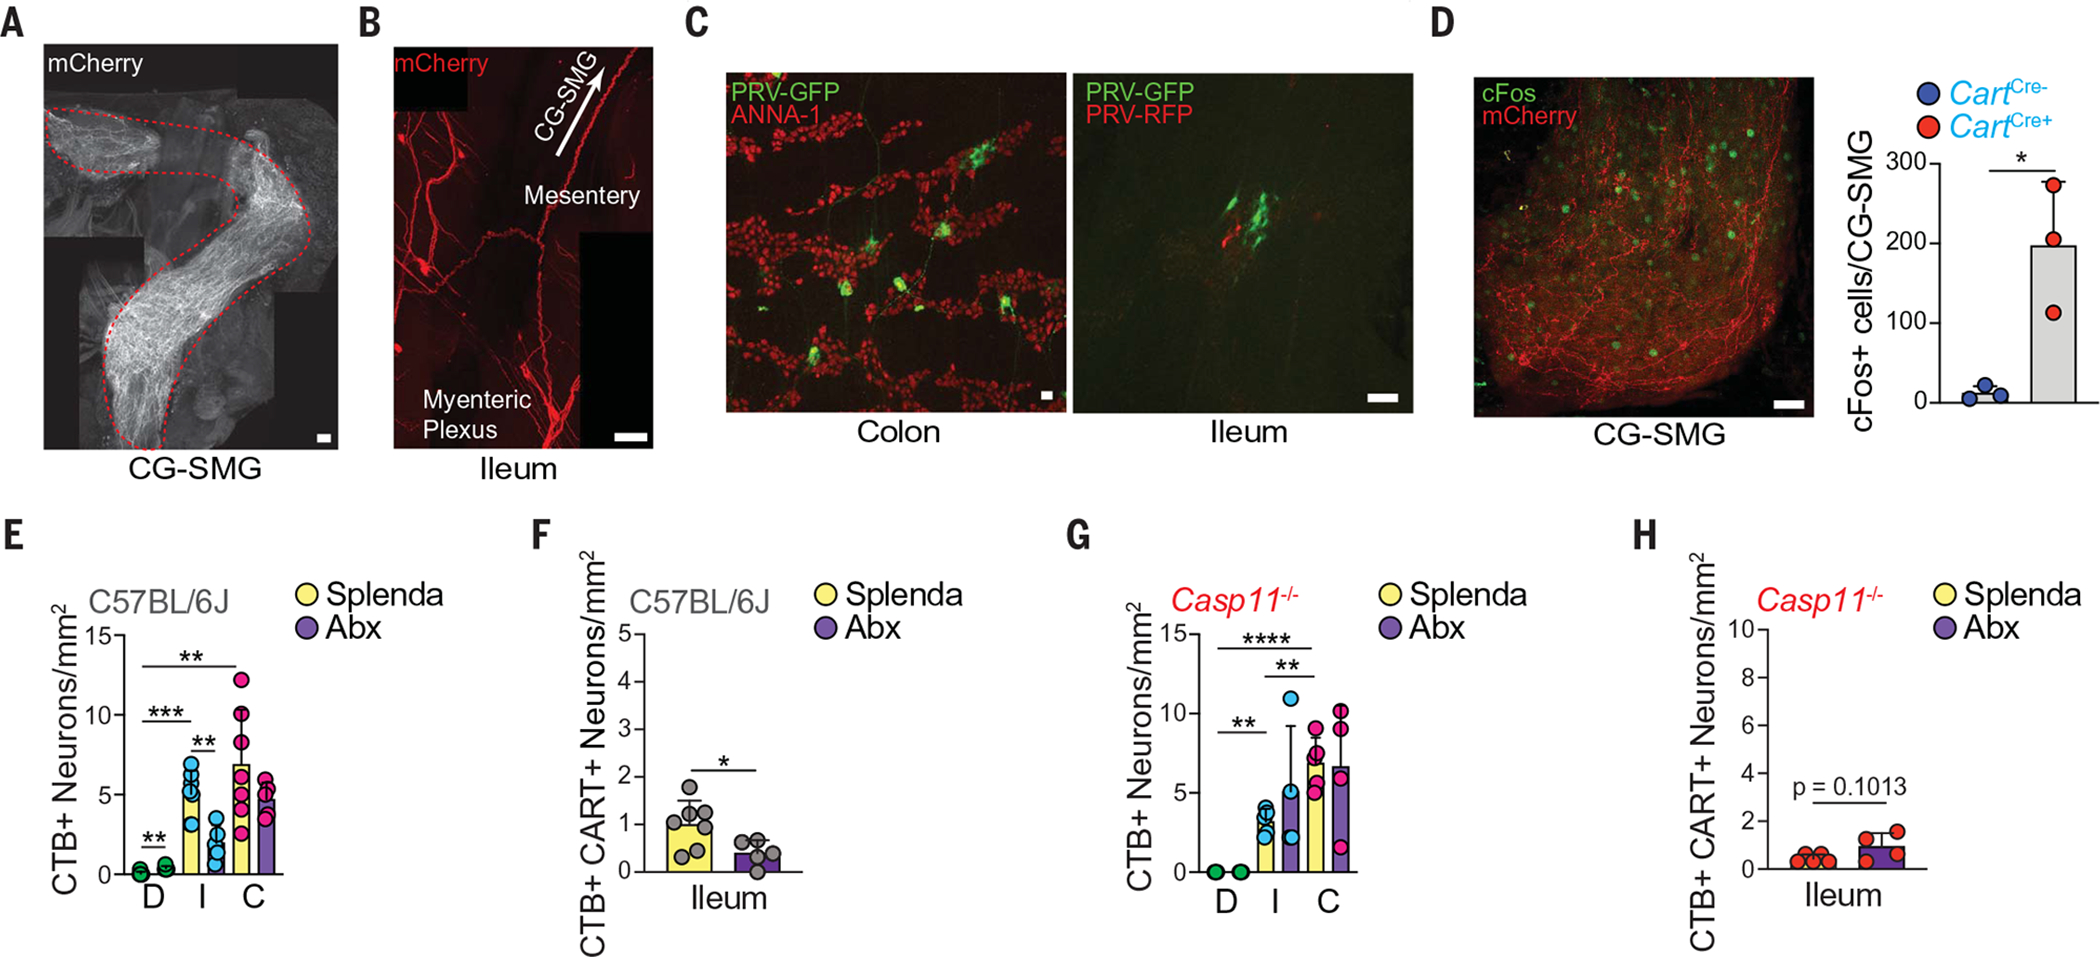
(A and B) Whole-mount IF image of (A) CG-SMG and (B) ileum MP of CartCre+ mice injected with AAV9-hSyn-DIO-hM3Dq-mCherry into ileum and colon. Scale bars are 100 μm. (C) Whole-mount IF image of colon (left) and ileum MP (right) of SPF mice injected with PRV-GFP (pancreas) and PRV-RFP (liver). Scale bars are 50 mm. (D) (Left) cFos (green) and mCherry (red) expression and (right) number of cFos+ neurons in the CG-SMG of CartCre+ mice injected with AAV as in (A), 3 hours after C21 injection. Scale bar is 50 mm. (E and G) CTB-AF647+ neuron numbers in duodenum, ileum, and colon (labeled D, I, and C, respectively) of (E) C57BL/6J or (G) Casp11−/− mice treated with Splenda or antibiotics for 2 weeks after CTB injection into the CG-SMG. (F and H) CTB-AF647+ CART+ neuron numbers in the ileum of (F) C57BL/6J or (H) Casp11−/− mice treated with Splenda or antibiotics for 2 weeks after CTB injection into the CG-SMG. *P < 0.05, **P < 0.01, ***P < 0.001, and ****P < 0.0001; for (D) and comparisons between Splenda and Abx [(E) to (H)], two-tailed Student’s unpaired t test was performed; for Splenda group comparisons between gut segments [(E) and (G)], one-way ANOVA with Tukey’s multiple comparisons test was performed. Error bars indicate SD.
To investigate whether CART+ viscerofugal neuron activation could directly modulate sympathetic neuronal activity, we dissected the CG-SMG after C21 administration and measured cFos expression as an indicator of sympathetic activation (5). As expected, we observed a significant increase in cFos expression in C21-injected CartptEAN-hM3Dq mice as compared with control mice (Fig. 5D). Inhibition of catecholamine release by guanethidine prevented the increase in glucose levels in C21-treated CartptEAN-hM3Dq mice, further suggesting the involvement of sympathetic activation (fig. S11A). However, guanethidine administration did not prevent the reduction in blood glucose induced by antibiotics (fig. S11B). To determine whether neuropeptide release affects glucose regulation, we exogenously administered CART peptide in antibiotic- or control-treated mice but observed no change in blood glucose (fig. S11C). However, we cannot definitively rule out a direct effect of CART peptide owing to incomplete knowledge of its role in the periphery and lack of identified receptor(s). Next, we investigated whether viscerofugal populations would be affected after microbial depletion. Indeed, retrograde fluorescent CTB tracing from the CG-SMG revealed a loss of CTB+ neurons, including CTB+ CART+ neurons, specifically in the ileum of antibiotic-treated mice, whereas only a minor reduction was observed in the colon and no changes were found in the sparsely retrograde-labeled duodenum (Fig. 5, E and F, and fig. S11, D to J). As expected, administration of antibiotics to Casp11−/− mice did not result in loss of viscerofugal neurons (Fig. 5, G and H, and fig. S11, K to Q), demonstrating that their loss is also dependent on this noncanonical inflammasome effector. We conclude that intestinal CART+ neurons that can modulate blood glucose are viscerofugal and microbiota-dependent.
Modulation of glucose by the microbiota is dependent on CART+ iEANs
To confirm whether microbiota depletion affects glucose regulation, we analyzed antibiotic-treated SPF and GF mice and found a significant reduction in blood glucose, irrespective of diet or feeding state (Fig. 6, A and B, and fig. S12, A, B, and H), corroborating previous studies (31–33). Consistent with neuronal loss, ampicillin treatment alone specifically led to a reduction in blood glucose levels (Fig. 6C). Fasting blood glucose levels could be rescued after colonization with the microbiota from SPF animals, irrespective of genetic background (Fig. 6D and fig. S12, C to G). To determine whether microbiota-mediated changes in glucose levels are associated with loss of iEANs, we measured blood glucose levels in global or conditional knockout mice targeting NLRP6 and its downstream effector caspase 11, because these genotypes did not lose iEANs or CART+ iEANs after antibiotic treatment. We found that blood glucose levels in Casp1/11−/−, Casp11−/−, Snap25ΔNlrp6, and Snap25ΔCasp11 mice were higher after antibiotic treatment as compared with that of WT and heterozygous controls (Fig. 6, A, E, and F, and fig. S12H).
Fig. 6. Control of blood glucose is microbiota- and CART+ iEAN- dependent.
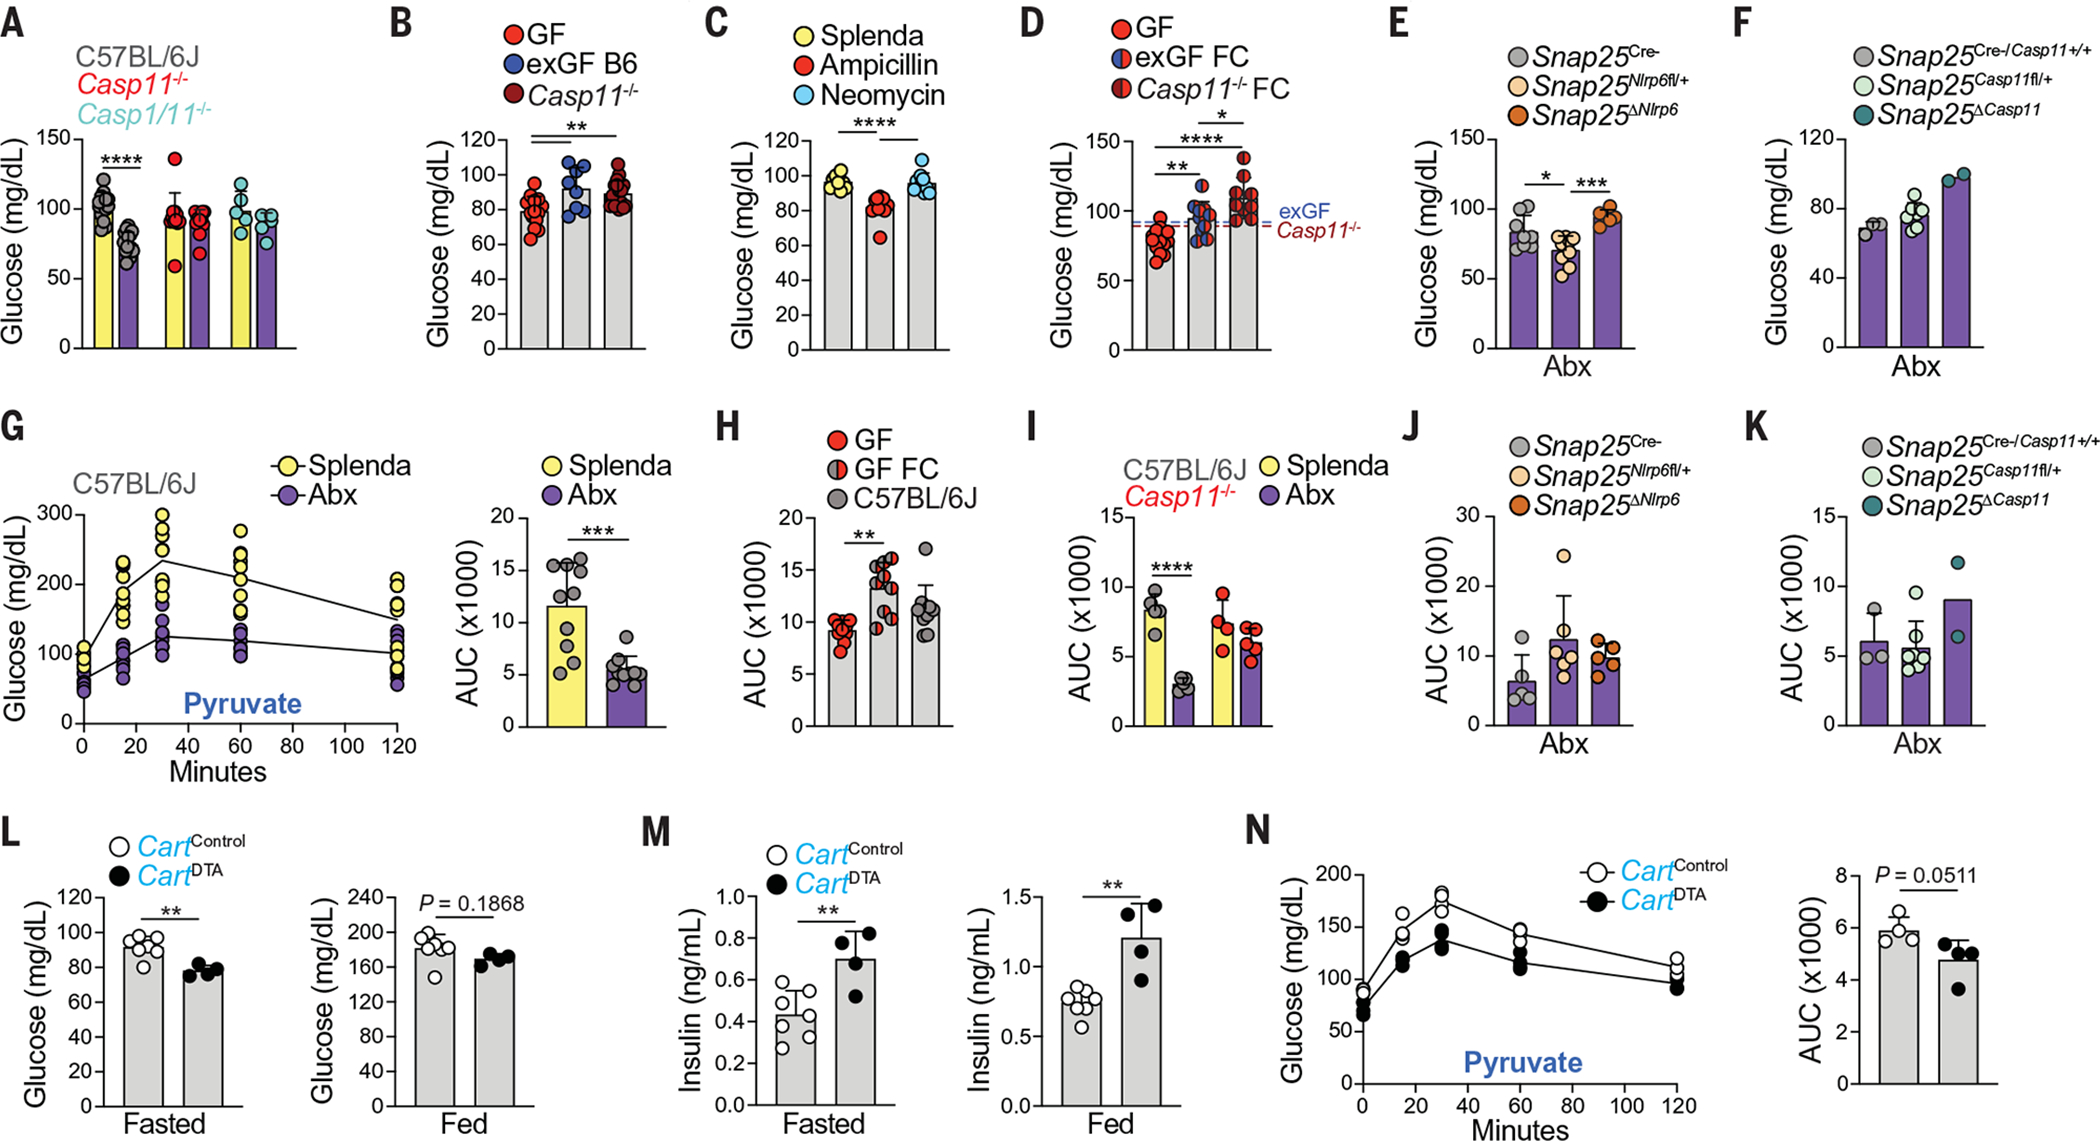
(A to G) Blood glucose levels of fasted (A) C57BL/6J, Casp11−/−, and Casp1/11−/− mice treated with Abx or Splenda; (B) GF, exGF B6, and Casp11−/− mice; (C) C57BL/6J mice on ampicillin, neomycin, or Splenda; (D) GF, exGF FC, and Casp11−/− FC mice; (E) Snap25ΔNlrp6 mice on Abx; and (F) Snap25ΔCasp11 mice on Abx. In (G), an intraperitoneal pyruvate tolerance test (IP-PTT) of fasted C57BL/6J mice on Abx or Splenda is presented, with blood glucose curves shown on the left and AUC analysis shown on the right. (H and I) IP-PTT AUC analysis of fasted (H) GF, GF FC, and C57BL/6J mice housed in bioexclusion isolator cages, and (I) C57BL/6J and Casp11−/− mice on Abx or Splenda. (J and K) IP-PTT AUC analysis of fasted (J) Snap25ΔNlrp6 and control or (K) Snap25ΔCasp11 and control mice on Abx. (L to N) CartCre+ mice injected with AAV5-DTA into ileum and colon. Shown are (L) fasted (left) or fed (right) blood glucose levels, (M) fasted (left) or fed (right) plasma insulin levels, and (N) fasted IP-PTT blood glucose curves (left) and AUC analysis (right). *P < 0.05, **P < 0.01, ***P < 0.001, and ****P < 0.0001; for (G) and (L) to (N), two-tailed unpaired Student’s t test was performed; for (B) to (E), (H), and (I), one-way ANOVA with Tukey’s multiple comparisons test was performed; for (A) and (J), two-way ANOVA with Tukey’s multiple comparisons test was performed. Error bars indicate SD.
We sought to determine which glucose-modulating pathways may be regulated by changes in the microbiota and, more specifically, whether the NLRP6–caspase 11 inflammasome pathway was involved. We first confirmed that glucagon-like peptide 1 (GLP-1) is increased in antibiotic-treated mice (31) but found that this increase was independent of caspase 11 (fig. S12I). Furthermore, administration of the GLP-1 receptor (GLP-1R)–blocking peptide Exendin-9–39 did not change fasting blood glucose levels of antibiotic-treated WT mice (fig. S12J). Additionally, insulin levels did not change after antibiotic treatment in WT, Casp1/11−/−, and Casp11−/− mice (fig. S12K). We next investigated whether pyruvate-induced gluconeogenesis (33) was affected by microbial manipulation. We observed significantly blunted temporal changes in blood glucose levels in GF and antibiotic-treated SPF mice compared with control SPF mice after pyruvate administration (Fig. 6, G to I, and fig. S12, L and M). This effect was rescued by microbiota reconstitution in GF mice (Fig. 6H and fig. S12L) or global loss of caspase 11 in SPF mice (Fig. 6I and fig. S12N); additionally, it was partially rescued in SPF mice with neuronal-specific deletion of NLRP6 and caspase 11 (Fig. 6, J and K, and fig. S12, O and P). Of note, because we noticed antibiotic-resistant bacteria in global Casp11−/− mice, these experiments were performed after antibiotic depletion followed by microbiota reconstitution from “antibiotic-resistant” feces from Casp11−/− mice (fig. S12Q). These data suggest that iEANs can regulate liver gluconeogenesis independently of pancreatic insulin production or intestinal GLP-1 release in a microbiota- and inflammasome-dependent manner.
To directly test the necessity of gut CART+ neurons in glucose regulation, we injected AAV5-mCherry-FLEX-DTA into the ileum and colon of CartptCre mice to selectively delete intestinal CART+ neurons. Two weeks after CART+ neuron ablation, we observed a significant reduction in blood glucose levels in fasted animals and a significant increase in insulin levels in fasted and fed animals compared with CartptCre mice injected with control AAV5 (Fig. 6, L and M, and fig. S13, A and B). Similar to what was observed in GF and antibiotic-treated mice, we found a trend toward decreased gluconeogenic capacity (Fig. 6N). Thus, loss of CART+ viscerofugal iEANs decreases blood glucose levels, presumably owing to the lack of pancreas- and liver-specific sympathetic regulation. Gut CART+ neurons are therefore both sufficient and necessary to modulate blood glucose through glucoregulatory organs. Together, these experiments establish a microbiota-sensitive, polysynaptic glucoregulatory circuit connecting the gut, sympathetic ganglia, and the liver and pancreas (fig. S14).
Discussion
The gut microbiota influences several physiological and pathological processes, including local nutrient absorption and lipid metabolism (4, 31, 32, 34), as well as activation of the gut-associated and systemic immune systems (35). Dysbiosis or depletion of commensal bacteria has also been shown to affect iEAN excitability and neurochemical code (21, 36), behavioral, or cognitive disorders (37). Our data revealed microbial- and region-dependent iEAN functional specialization with the potential to perform metabolic control independent of the CNS. Adding to our recent findings (22), here we describe a distinct role for the noncanonical inflammasome components NLRP6 and caspase 11 in controlling iEAN numbers and subsequent glucose regulation in response to microbiota levels. Although we do not know the ligand(s) that activate the noncanonical inflammasome pathway, bile acids may represent an interesting mediator (38) because we did not observe significant iEAN expression of direct pathogen recognition receptors, such as Toll-like receptors. It remains to be determined whether CART+ viscerofugal neurons respond to the presence of glucose in the intestinal lumen, release of neuropeptides, or the movement of fecal matter. It will also be important to determine how CART+ viscerofugal neurons are functionally connected to potential sensors such as intrinsic primary afferents, EECs, or mechanosensitive populations and the downstream neuronal populations required to perform glucoregulatory functions (39, 40). Finally, the ability of viscerofugal neurons in the distal ileum and proximal colon to increase blood glucose through a peripheral circuit warrants additional investigations into CNS-independent iEAN circuits. Because we focused on the functional characterization of selected neuropeptides in this study, it will be important to further explore if additional microbiota-modulated and/or microbiota-independent iEAN neuropeptide pathways play complementary or redundant roles in GI physiology, including feeding behavior (3, 32, 36, 39, 40). Targeting peripheral-restricted circuits, such as the one uncovered here, could bypass undesirable CNS effects for the treatment of metabolic disorders, such as type 2 diabetes.
Note added in proof: Our final mouse experiments were substantially affected by Rockefeller coronavirus disease 2019 (COVID-19) lab closures, and thus we acknowledge that our initial sample sizes for Snap25ΔCasp11 were below the standard for an animal experiment, despite two independent experiments having been run. In the time between the First Release and print publication, we were able to complete a final antibiotic treatment experiment in Snap25ΔCasp11 mice. We present these findings with increased n in fig. S15.
Supplementary Material
ACKNOWLEDGMENTS
We thank all Mucida Lab members, the Bio-imaging and Genomics Centers, and Rockefeller University employees for their continuous assistance; and A. Rogoz and S. Gonzalez for the maintenance of mice. We thank J. Friedman for the generous use of lab equipment and resources. We also thank A. Lockhart, G. Donaldson, and the Nussenzweig, Victora, and Lafaille labs for fruitful discussions.
Funding: This work was supported by NIH P40 OD010996 (Core), Gilliam HHMI (V.J.), NIH UL1TR001866 (P.A.M. and D.M.), and NIH F31 DK112601; Philip M. Levine (P.A.M.), Anderson Graduate (F.M.), and Kavli fellowships (P.A.M. and M.S.); NIDDK grant K99 DK120869; the Robertson Therapeutic Development Fund (M.S.); the Burroughs Wellcome Fund; the Kenneth Rainin Foundation; the Food Allergy FARE/FASI Consortium; and NIH R01DK126407 and Transformative R01DK116646 (D.M.).
Footnotes
REFERENCES AND NOTES
- 1.Mayer EA, Nat. Rev. Neurosci 12, 453–466 (2011). [DOI] [PMC free article] [PubMed] [Google Scholar]
- 2.Furness JB, Rivera LR, Cho HJ, Bravo DM, Callaghan B, Nat. Rev. Gastroenterol. Hepatol 10, 729–740 (2013). [DOI] [PubMed] [Google Scholar]
- 3.Veiga-Fernandes H, Mucida D, Cell 165, 801–811 (2016). [DOI] [PMC free article] [PubMed] [Google Scholar]
- 4.Ridaura VK et al. , Science 341, 1241214 (2013). [DOI] [PMC free article] [PubMed] [Google Scholar]
- 5.Muller PA et al. , Nature 583, 441–446 (2020). [DOI] [PMC free article] [PubMed] [Google Scholar]
- 6.Sang Q, Young HM, Cell Tissue Res 284, 39–53 (1996). [DOI] [PubMed] [Google Scholar]
- 7.Gribble FM, Reimann F, Annu. Rev. Physiol 78, 277–299 (2016). [DOI] [PubMed] [Google Scholar]
- 8.Teitelbaum DH, O’Dorisio TM, Perkins WE, Gaginella TS, Am. J. Physiol 246, G509–G514 (1984). [DOI] [PubMed] [Google Scholar]
- 9.Ekblad E, Kuhar M, Wierup N, Sundler F, Neurogastroenterol. Motil 15, 545–557 (2003). [DOI] [PubMed] [Google Scholar]
- 10.Lecci A, Altamura M, Capriati A, Maggi CA, Eur. Rev. Med. Pharmacol. Sci 12 (suppl. 1), 69–80 (2008). [PubMed] [Google Scholar]
- 11.Holzer P, Regul. Pept 155, 11–17 (2009). [DOI] [PMC free article] [PubMed] [Google Scholar]
- 12.Degen LP et al. , Gastroenterology 120, 361–368 (2001). [DOI] [PubMed] [Google Scholar]
- 13.Grider JR, J. Pharmacol. Exp. Ther 307, 460–467 (2003). [DOI] [PubMed] [Google Scholar]
- 14.Browning KN, Lees GM, Neurogastroenterol. Motil 12, 33–41 (2000). [DOI] [PubMed] [Google Scholar]
- 15.Mace OJ, Tehan B, Marshall F, Pharmacol. Res. Perspect 3, e00155 (2015). [DOI] [PMC free article] [PubMed] [Google Scholar]
- 16.Makowska K et al. , C. R. Biol 341, 325–333 (2018). [DOI] [PubMed] [Google Scholar]
- 17.Sonoyama K, Rutatip S, Kasai T, Am. J. Physiol. Gastrointest. Liver Physiol 278, G89–G97 (2000). [DOI] [PubMed] [Google Scholar]
- 18.Byun T et al. , J. Clin. Pathol 58, 515–519 (2005). [DOI] [PMC free article] [PubMed] [Google Scholar]
- 19.Cardoso V et al. , Nature 549, 277–281 (2017). [DOI] [PMC free article] [PubMed] [Google Scholar]
- 20.Lakhina V et al. , Neuron 85, 330–345 (2015). [DOI] [PMC free article] [PubMed] [Google Scholar]
- 21.McVey Neufeld KA, Perez-Burgos A, Mao YK,Bienenstock J, Kunze WA, Neurogastroenterol. Motil 27, 627–636 (2015). [DOI] [PubMed] [Google Scholar]
- 22.Matheis F et al. , Cell 180, 64–78. e16 (2020). [DOI] [PMC free article] [PubMed] [Google Scholar]
- 23.Gunawardene AR, Corfe BM, Staton CA, Int. J. Exp. Pathol 92, 219–231 (2011). [DOI] [PMC free article] [PubMed] [Google Scholar]
- 24.Waterson MJ, Horvath TL, Cell Metab 22, 962–970 (2015). [DOI] [PubMed] [Google Scholar]
- 25.Gupta R, Ma Y, Wang M, Whim MD, Endocrinology 158, 2572–2584 (2017). [DOI] [PMC free article] [PubMed] [Google Scholar]
- 26.Yuan X, Huang Y, Shah S, Wu H, Gautron L, eNeuro 3, ENEURO.0174–16.2016 (2016). [DOI] [PMC free article] [PubMed] [Google Scholar]
- 27.Hibberd TJ, Zagorodnyuk VP, Spencer NJ, Brookes SJ, Neuroscience 225, 118–129 (2012). [DOI] [PubMed] [Google Scholar]
- 28.Havrankova J, Roth J, Brownstein M, Nature 272, 827–829 (1978). [DOI] [PubMed] [Google Scholar]
- 29.Love JA, Yi E, Smith TG, Auton. Neurosci 133, 19–34 (2007). [DOI] [PubMed] [Google Scholar]
- 30.Mizuno K, Ueno Y, Hepatol. Res 47, 160–165 (2017). [DOI] [PubMed] [Google Scholar]
- 31.Zarrinpar A et al. , Nat. Commun 9, 2872 (2018). [DOI] [PMC free article] [PubMed] [Google Scholar]
- 32.Martin AM et al. , Proc. Natl. Acad. Sci. U.S.A 116, 19802–19804 (2019). [DOI] [PMC free article] [PubMed] [Google Scholar]
- 33.Krisko TI et al. , Cell Metab 31, 592–604. e9 (2020). [DOI] [PMC free article] [PubMed] [Google Scholar]
- 34.Korem T et al. , Cell Metab 25, 1243–1253. e5 (2017). [DOI] [PubMed] [Google Scholar]
- 35.Honda K, Littman DR, Nature 535, 75–84 (2016). [DOI] [PubMed] [Google Scholar]
- 36.Yano JM et al. , Cell 161, 264–276 (2015). [DOI] [PMC free article] [PubMed] [Google Scholar]
- 37.Kim S et al. , Nature 549, 528–532 (2017). [DOI] [PMC free article] [PubMed] [Google Scholar]
- 38.Levy M et al. , Cell 163, 1428–1443 (2015). [DOI] [PMC free article] [PubMed] [Google Scholar]
- 39.Kaelberer MM et al. , Science 361, eaat5236 (2018).30237325 [Google Scholar]
- 40.Han W et al. , Cell 175, 665–678. e23 (2018). [DOI] [PMC free article] [PubMed] [Google Scholar]
Associated Data
This section collects any data citations, data availability statements, or supplementary materials included in this article.