. 2021 Feb 16;10:e60005. doi: 10.7554/eLife.60005

Figure 1. Single-cell profiling strategy and cell population composition of posterior sox10:GFP+ cells from the posterior zebrafish during the embryonic to larval stage transition.

(A) Confocal image of a sox10:GFP+ embryo at 48 hpf; Hb: Hindbrain; Sc: Spinal cord. A: Anterior, P: Posterior, D: Dorsal, V: Ventral. Scale bar: 50 μM (B) Cartoon illustrations of a zebrafish embryo at 48–50 hpf and an early larval fish at 68–70 hpf depicted laterally to summarize the dissection workflow used to collect posterior sox10:GFP+ cells. (C) Schematic of the 10X Genomics Chromium and data analysis pipeline. (D) tSNE plots showing the arrangement of Clusters 0–18 and where the major cell types identified among sox10:GFP+ cells arrange in the 48–50 hpf dataset. (E) tSNE plots showing the arrangement of Clusters 0–22 and where the major cell types identified among sox10:GFPcells arrange in the 68–70 hpf dataset. (F,G) Dot plots of the identifying gene markers for each major cell type classification in the 48–50 hpf and 68–70 hpf datasets, respectively. Dot size depicts the cell percentage for each marker within the dataset and the color summarizes the average expression levels for each gene.

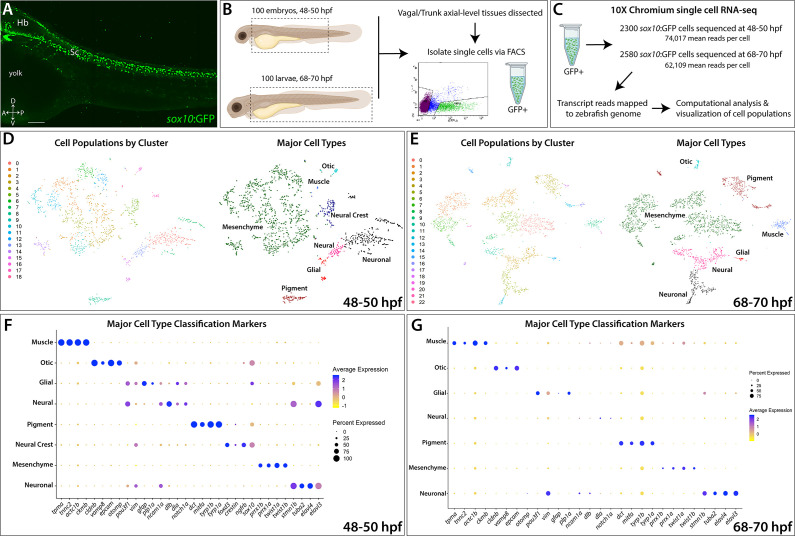
Figure 1—source data 1. List of marker genes per cluster in the sox10:GFP scRNA-seq datasets.
Tables reporting the Seurat output for genes for each cluster at the 48–50 hpf (Tab 1) and 68–70 hpf (Tab 2) time points, including p-values (<0.01), average log-fold change (≥0.25), adjusted p-values (≤1.0), pct.1 summarizing proportion of cells expressing the individual gene in the cluster, pct.2 showing the proportion of cells expressing the individual gene in all other clusters in the dataset.

Figure 1.

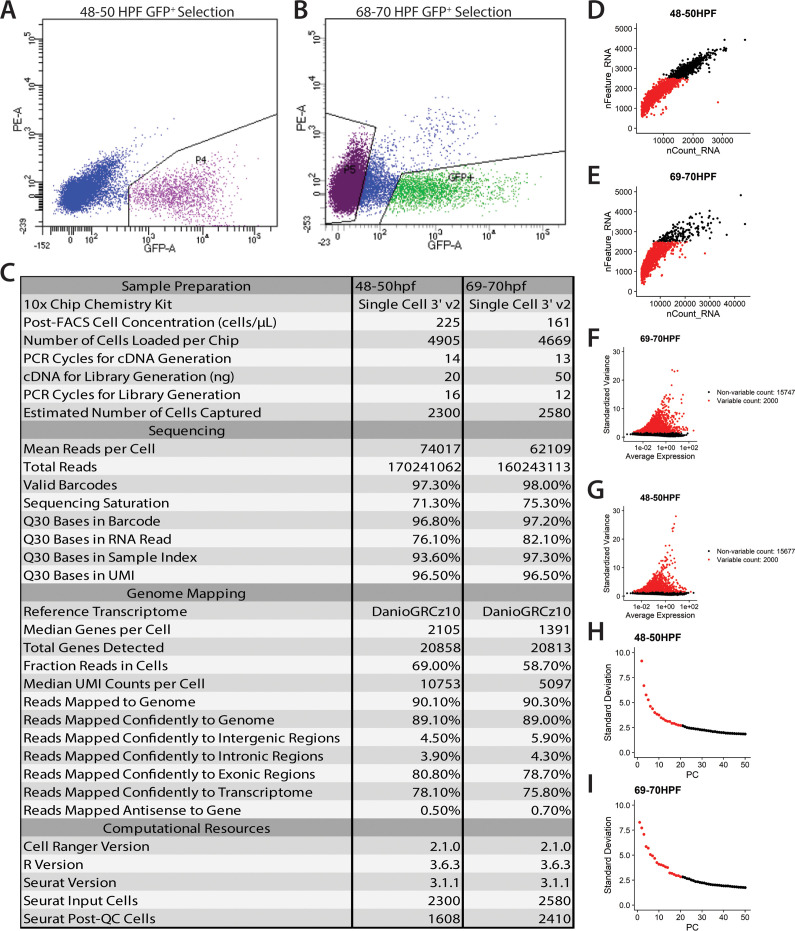
Figure 1—figure supplement 1. Statistics on generation and filtering of single cell transcriptomes at 48–50 hpf and 68–70 hpf.

Figure 1—figure supplement 1.

(A,B) Fluorescence activated cell sorting plots highlighting the GFP+ cell population sorted at 48–50 hpf (A) and 68–70 hpf (B). (C) Table of general statistics pertaining to the sequencing and alignment of reads from the Cell Ranger pipeline. Additional metrics provided were derived from the Seurat R package as described in the Materials and Methods section. (D,E) Plots showing the feature selection for both the 48–50 hpf (D) and 68–70 hpf (E) datasets. Cells were selected such that they had fewer than 2500 features to reduce spuriously sorted cells. (F,G) Top 2000 most variably expressed genes were identified and used for further downstream identification of significant principal components, as described in the Materials and Methods section. (H,I) Most significant principal components (top 20 for both datasets) were selected to be used for subsequent cluster identification and cell embedding in tSNE and UMAP spaces.
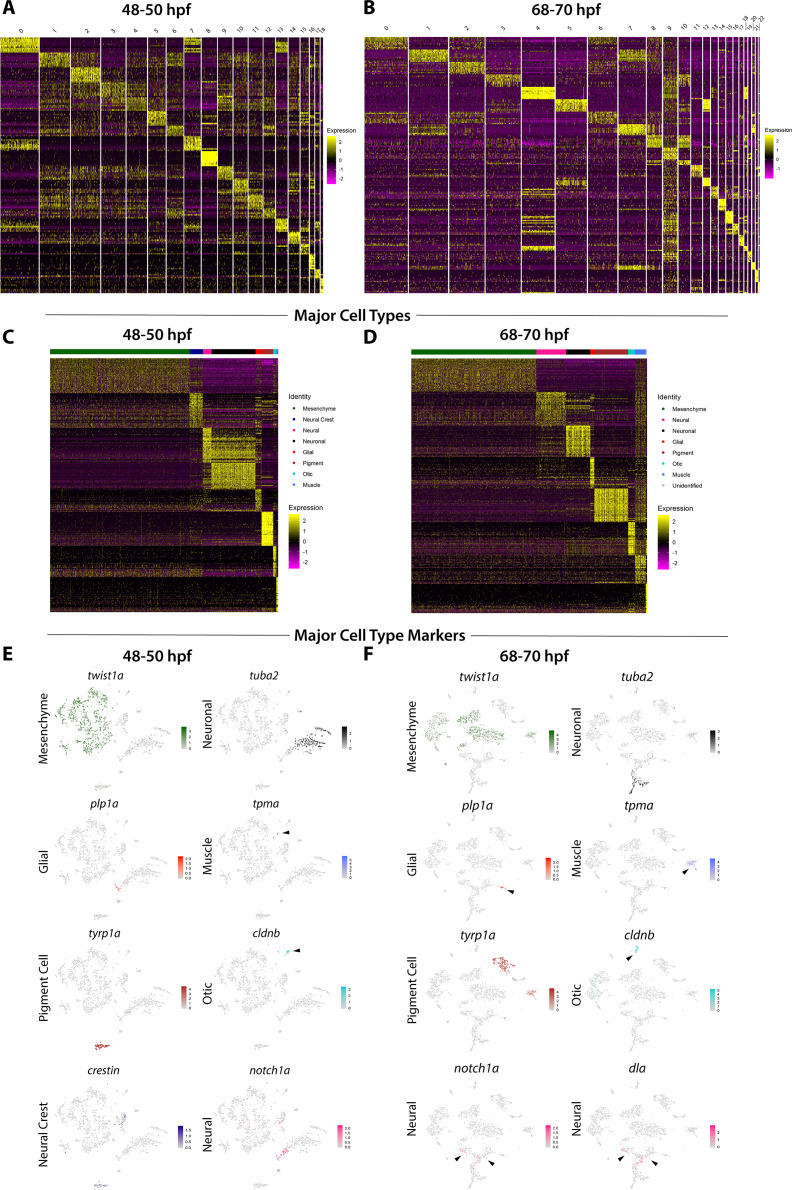
Figure 1—figure supplement 2. Major cell type annotations among sox10:GFP+ cells.

Figure 1—figure supplement 2.

(A,B) Heatmap summarizing the top 10 genes significantly expressed in each cluster, for 48–50 and 68–70 hpf, respectively. Relative expression levels within each cluster is summarized within the color key, where yellow to magenta color indicates high to low gene expression levels. (C,D) Heatmaps summarizing the top 30 genes significantly expressed among the major cell types identified among sox10:GFP+ cells, for 48–50 and 68–70 hpf, respectively. Relative expression levels within each major cell type cluster is summarized within the color key, where yellow to magenta color indicates high to low gene expression levels. (E,F) tSNE plots depicting the major cell type classification representative gene marker for each major cell type category, for 48–50 and 68–70 hpf, respectively. Relative expression levels are summarized within the color keys, where color intensity is proportional to expression level of each gene depicted.
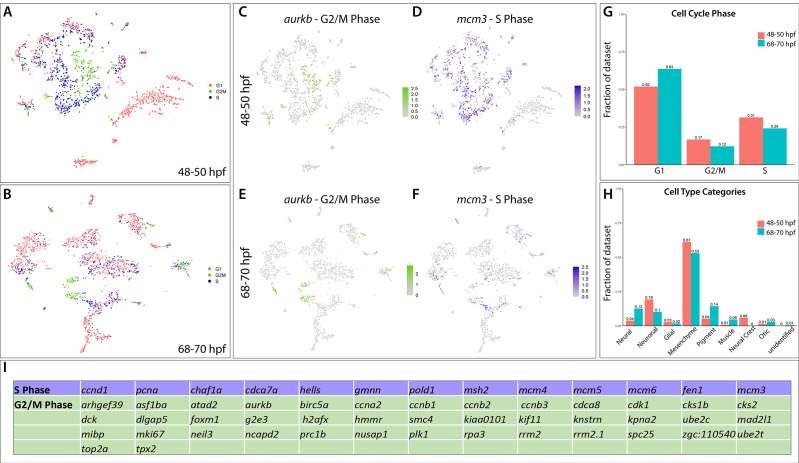
Figure 1—figure supplement 3. Major cell type categories and cell cycle distributions of the scRNA-seq datasets.

Figure 1—figure supplement 3.

(A,B) tSNE plots summarizing the G1, S, and G2/M phase cell cycle phase occupancies of the cells in the 48–50 and 68–70 hpf time points, respectively. (C,E) A tSNE plot depicting the expression of aurkb, a G2/M phase marker, within the 48–50 and 68–70 hpf datasets, respectively. Relative expression levels are summarized within the color keys, where color intensity is proportional to expression level of each gene depicted. (D,F) A tSNE plot depicting the expression of mcm3, a S phase marker, within the 48–50 and 68–70 hpf datasets, respectively. Relative expression levels are summarized within the color keys, where color intensity is proportional to expression level of each gene depicted. (G) Bar graphs summarizing the cell cycle phase occupancies, as a fraction of cells within the total datasets for each time point. (H) Bar graphs summarizing the major cell type categories, as a fraction of cells within the total datasets for each time point. (I) Table summarizing the cell cycle genes used to demarcate cell cycle phase occupancy categories within the scRNA-seq datasets.
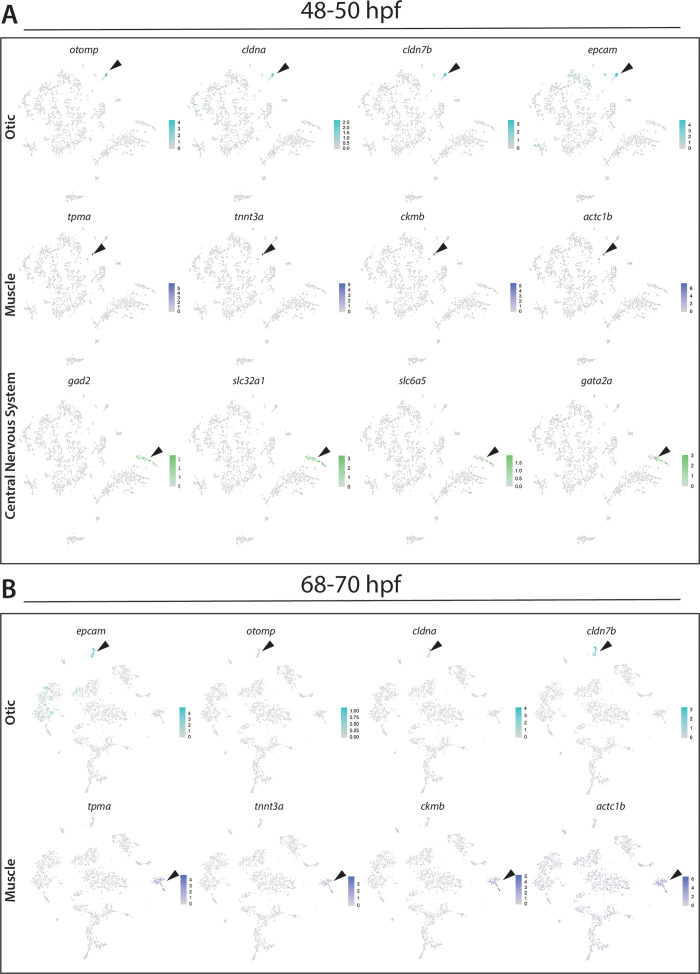
Figure 1—figure supplement 4. Identification of otic vesicle, muscle, and central nervous system (CNS) cellular populations.

Figure 1—figure supplement 4.

(A) Panel of tSNE feature plots at 48–50 hpf that identify combinatorial expression of otic vesicle (otomp, cldna, cldn7b and epcam), muscle (ckmb, actc1b, tnnt3a and tpma), or CNS (slc32a1, gad1b, slc6a5, gata2a) markers. Cluster of interest denoted by black arrows. (B) Panel of tSNE feature plots at 68–70 hpf that identify combinatorial expression of otic vesicle markers (otomp, cldna, cldn7b, and epcam) or muscle (ckmb, actc1b, tnnt3a, and tpma). Cluster of interest denoted by black arrows.
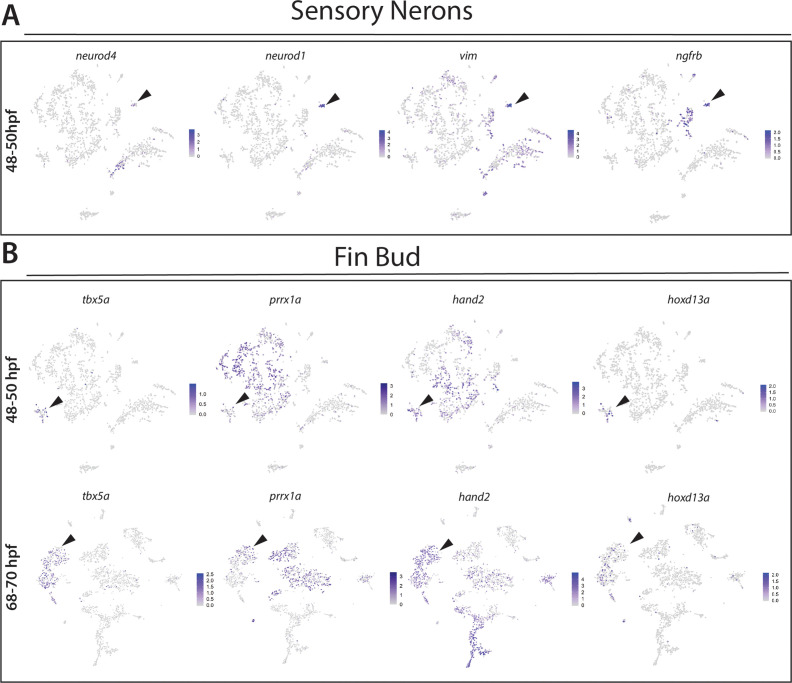
Figure 1—figure supplement 5. Identification of fin bud and sensory neuronal progenitor cellular populations.

Figure 1—figure supplement 5.

(A) Panel of tSNE feature plots of sensory neuronal progenitor markers at 48–50 hpf that show combinatorial expression of neurod4, neurod1, vim, and ngfrb, Cluster of interest denoted by black arrows. (B) Panel of tSNE feature plots of fin bud makers at 48–50 hpf (top) and 68–70 hpf (bottom) that show combinatorial expression of tbx5a, hand2, hoxd13a, and prrx1a. Cluster of interest denoted by black arrows.