

Abstract
Hepatic leukemia factor (HLF) is an oncogenic transcript factor, but its role in gliomas is unclear.
With the open-access data from the Cancer Genome Atlatls (TCGA), HLF expression was compared between normal and glioma tissues and its correlation to patient survival, age, gender, race, and tumor grade was analyzed. Multivariate Cox regression was adopted to explore the independent risk factors for patient survival. Survivals between high and low HLF expression, and high and low model predicted risk subgroups were compared. 1, 2, 3, and 5-year patient survival were predicted with the Cox regression model. Gene set enrichment analysis (GSEA) was performed to predict the potential function of HLF.
Expression and clinical data of 5 normal brain samples and 655 glioma samples were obtained from TCGA. HLF expression was downregulated in gliomas than normal brain tissue (P = .007), and negatively related to patient age and advancing tumor grade (P < .001). HLF was a protective factor for patient survival (OR = 0.81, 95%CI 0.67–0.99, P = .035). Patients’ survivals were poorer in low HLF expression subgroups and the Cox regression model predicted high-risk subgroups (P < .001). The accuracy of the model in predicting 1, 2, 3, and 5-year patient survival was 0.864, 0.895, 0.907, and 0.893, respectively. GSEA revealed HLF mainly took part in regulating tumor cell metabolism and cell cycle.
HLF was downregulated in gliomas than normal tissue, negatively related to patient age and tumor grade, and was an independent protective factor for glioma patients.
Keywords: Glioma, hepatic leukemia factor, metabolism, patient survival, risk factor
1. Introduction
Gliomas account for 75% primary intracranial malignancies in adults, with increasing incidence with advancing age.[1] Gliomas are highly heterogeneous, resulting in a distinct 5-year survival rate from 94% in grade I pilocytic astrocytoma to only 5.5% in grade IV glioblastoma.[2] Even in patients with the same pathological grade, different prognosis was encountered. Gliomas harboring isocitrate dehydrogenase 1/2 (IDH1/2) mutations are associated with a better prognosis than IDH-wildtype ones.[3,4] O6-methylguanine-DNA methyltransferase promoter methylation confers a favorable prognosis in both low and high-grade gliomas after Temozolomide chemotherapy.[5–7] To improve diagnostic objectivity and accuracy, and probably subsequent more precise determination of prognosis and treatment, molecular parameters have been incorporated with the histological ones and yielded the new World Healy Organization (WHO) central nervous system (CNS) tumor classification.[8] In this new classification system, the histopathological name is followed by the genetic features (eg, glioblastoma, IDH-wildtype). In cases of discordant results from histology and molecular genetic features, the genotype is considered more informative than the histological phenotype.[2,8] This progress in genomics, along with significant advances in cancer and CNS immunology, has defined a new era in neuro-oncology and holds promise for diagnostic and therapeutic improvement.[2]
Despite great processes in diagnosis, precise classification, microsurgery, chemotherapy, radiotherapy, even gene, and immunotherapy over the past decays, effective treatment for gliomas remains limited.[2,9,10] Poor drug blood-brain barrier penetration, redundancy of intracellular signaling pathways, tumor molecular heterogeneity, and lack of validated biomarkers are the main reasons responsible for the frustrating results.[2] Mapping the cancer gene network to identify key tumor drivers and the genetic influences on treatment responses is a substantial way for this difficulty.
Hepatic leukemia factor (HLF) was found in 1992 as a member of the PAR subfamily of basic leucine zipper proteins.[11] Wild-type HLF forms a homodimer or heterodimer with other PAR factors and binds DNA specifically as a transcriptor.[11] In acute lymphoblastic leukemia, the t(17;19) produced fused E2a-HLF protein that contributed to the leukemogenic conversion.[11] Thereafter, HLF was found to regulate hematopoietic cells development and malignant transmission,[12,13] and promote resistance to cell death.[14] Recently, HLF was reported to take roles in liver fibrosis and chemotherapy resistance in hepatic carcinomas.[15,16] In 2016, Chen et al reported that HLF overexpression could inhibit proliferation, invasion, and colony formation in U87 glioma cell lines through the miR-132/TTK pathway.[17] However, HLF expression profiles in glioma species and its clinical significance have not been reported.
2. Material and methods
2.1. Data acquisition
Gene expression and clinical data of the human low-grade glioma and glioblastoma datasets were obtained from TCGA (https://www.cancer.gov) on 23, February 2020. 10 normal and 691 glioma samples were included in these two datasets. The enrolled clinical features for tumor samples were patient age, gender, race, follow-up time, and survival status, and tumor grade. After the exclusion of the duplicated samples and those with incomplete clinical information. A total of 5 normal and 655 tumor samples were enrolled for analysis. Informed consent was not required from the patients as this was publicly accessible data, and this study was approved by the Ethics Committee of TianTan Hospital, Capital University.
2.2. Correlation of HLF expression with clinical features
The expression of HLF was log2 transformed. The expression profile between normal and tumor samples was compared. Patients that encountered death during follow up were classified into long and short survival subgroups according to the median survival time, and the HLF expression was compared between the long and short survival subgroups. Linear regression was performed to detect the correlation of HLF expression to patient age. Tumor samples were classified into subgroups based on gender, race, and pathological grade, respectively, and HLF expression was compared between/among these subgroups.
2.3. Correlation of HLF expression with patient survival
Univariate Cox regression was performed to explore the correlation of patient survival to patient age, gender, race, and tumor grade and HLF expression. All the patients were classified into high and low HLF expression subgroups according to the median HLF expression, survival curves of these two subgroups were built and compared. Patient age, race, gender, and tumor grade with or without HLF expression were enrolled into multivariate Cox regression and these two regression models were compared by the likelihood ratio test. The regression model with the HLF expression was demonstrated as a forest plot and adopted to predict the death risks. Receiver operating characteristic curves (ROCs) were built and areas under the curve (AUCs) were used to demonstrate the performance of the model predicted death risks in predicting 1, 2, 3, and 5-year patient survival.
2.4. Functional analysis
GSEA was performed to explore HLF related gene sets enrichment in Gene Ontology (GO) and Kyoto Encyclopedia of Genes and Genomes (KEGG) pathways with the software of GSEA (version 4.0.3, https://www.gsea-msigdb.org/gsea/downloads.jsp). For GSEA analysis, the number of permutations was set to 1000 and the metric for ranking genes was set to Singal2Noise. For KEGG pathways, the results were filtered by p-value < 5%, q value < 25%, and normalized enrichment score >1 and ranked by increasing q value. For Go pathways, the filtered criteria were P value < 1%. For the number of enriched pathways that greatly over 10, the top 10 were selected for demonstration.
2.5. Statistical analysis
Figure plotting and statistical analysis were done with the R software (version 3.6.2, https://www.r-project.org/). Spearman linear regression was adopted to explore the Correlation between gene expression and age. Wilcoxon rank-sum test was used to compare HLF expression between normal and tumor samples, males and females, and long and short survival dead patients. Kruskal-Wallis rank-sum test was used to compare the gene expression profiles among different tumor grade and race subgroups. Univariate Cox regression was adopted to explore the correlation of clinical features to patient survival. Multivariate Cox regression was used to screen the risk factors for patient survival and determine the weights of the variates in the prediction model. The likelihood ratio test was performed to compare the multivariate Cox models with or without the HLF expression profile. The log-rank test was used to compare the differences between survival curves. Packages used in this study for figure plotting and statistical analysis mainly include ggplot2, survival, survminer, Hmisc, RMS, and survival ROC.
3. Results
3.1. HLF expression is downregulated in glioma tissues and decreases with advancing patient age and tumor grade
As showed by Figure 1, HLF expression was significantly downregulated in glioma than normal tissues (Fig. 1A, P = .007). HLF expression was significantly higher in long survival patients than those with short survival, in patients that have encountered death event (Fig. 1B). HLF expression was negatively correlated to patient age (Correlation coefficient = −0.322, 95%CI −0.389 — −0.252, P < .01, Fig. 1C) and tumor grade (P < .001, Fig. 1F). HLF expression was not correlated with patient gender (P = .393, Fig. 1D) and race (P = .23, Fig. 1E).
Figure 1.

HLF expression profiles. A: HLF expression was significantly lower in gliomas than normal brain tissue (P = .007). B: HLF expression was significantly lower in glioma patients with short survival (P < .001). Patients that encountered death during follow up were classified into long and short survival subgroups according to the median survival time, and the HLF expression was compared between the long and short survival subgroups. C: HLF expression was negatively correlated to patient age (Correlation coefficient = −0.322, 95%CI −0.389 – −0.252, P < .001). D: HLF expression distributed equally between patient gender (P = .393). E: HLF expression distributed equally among patient races (P = .283). F: HLF expression was negatively correlated with tumor grade (P < .001).
3.2. HLF is an independent protective factor for survival in glioma patients
Univariate Cox regression results were summarized in Table 1. Patient age (P < .001), tumor grade (referenced to grade II, P < .001, for grade III/IV), and HLF expression (P < .001) were closely related to patient survival. Patient age, race, gender, tumor grade, and HLF expression were taken into multivariate Cox regression. The constitution of the model with HLF expression was demonstrated in Figure 2. As the figure showed, patient age (HR 1.046, 95%CI 1.034–1.058, P < .001), tumor grade (HR 2.501, 95%CI 1.632–3.834, P < .001, for grade III, and HR = 7.001, 95%CI 3.927–12.479, P < .001 for grade IV, referenced to grade II) were independent risk factors and HLF expression (Hazard ratio [HR] = 0.81, 95%CI 0.67–0.99, P = .035) was an independent protective factor for patient survival.
Table 1.
Univariate Cox regression for patient survival.
| Characteristics | OR | 95% CI | P |
| Age | 1.072 | (1.061, 1.083) | <.001 |
| Race (vs Asian) | |||
| Black or African American | 2.053 | (0.459, 9.179) | .347 |
| White | 1.577 | (0.391, 6.357) | .522 |
| Gender (vs Female) | 1.135 | (0.867, 1.487) | .357 |
| Grade (vs G2) | |||
| G3 | 3.067 | (2.026, 4.641) | <.001 |
| G4 | 18.668 | (12.152, 28.678) | <.001 |
| HLF expression | 0.051 | (0.031, 0.085) | <.001 |
Figure 2.

Forest plot of the multivariate Cox regression model for patient survival. Patient age (HR 1.046, 95%CI 1.034–1.058, P < .001), tumor grade (HR 2.501, 95%CI 1.632–3.834, P < .001, for grade III, and HR = 7.001, 95%CI 3.927–12.479, P < .001 for grade IV, referenced to grade II) were independent risk factors for patient survival and HLF expression (HR = 0.81, 95%CI 0.67–0.99, P = .035) was an independent protective factor for patient survival.
3.3. HLF expression was beneficial in predicting patient survival
Patient age, race, gender, and tumor grade with or without HLF expression were taken into multivariate Cox regression, and the models were compared with the likelihood ratio test. Validated with the same dataset, the concordance was slightly higher in the model with HLF expression than the one without (0.846 vs 0.842, P = .032 by likelihood ratio test). This result demonstrated HLF expression could bring in additional benefit for predicting survival.
Survival curves were built and compared between high and low HLF expression subgroups. As Figure 3 showed, patients with low HLF expression suffered poor survival than those with high expression (Fig. 3A). Similarly, the multivariate Cox regression model (Fig. 2) predicted high-risk patients suffered poorer survival than the low-risk patients (Fig. 3B). When only HLF expression was used to predict the 1, 2, 3, and 5-year patient survival, the accuracy reached 0.766, 0.766, 0.796, and 0.781, respectively (Fig. 4A). When combined with other clinical features including patient age, race, gender, and tumor grade, the multivariate Cox regression prediction model gained an accuracy of 0.864, 0.895, 0.907, and 0.893 in predicting the 1, 2, 3, and 5-year patient survival (Fig. 4B).
Figure 3.

Patient survival between high and low HLF expression subgroups, and between model-predicted high and low death risk subgroups. A: Patients with low HLF expression suffered poorer survival than those with high HLF expression (P < .001). B: The multivariate Cox regression model predicted high death risk patients suffered poorer survival than those with low predicted death risks (P < .001).
Figure 4.
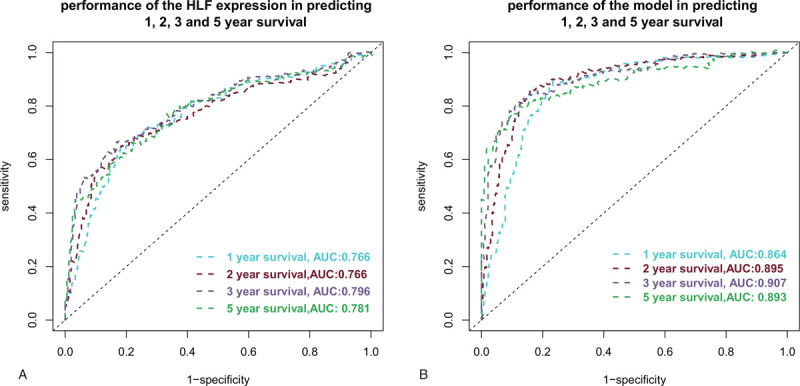
Prediction performance of HLF expression and the multivariate Cox regression model in predicting 1, 2, 3, and 5-year patient survival. A: The accuracy of using HLF expression in predicting the 1, 2, 3, and 5-year patient survival was 0.776, 0.776, 0.796, and 0.781, respectively. B: The accuracy of using the multivariate Cox regression model in predicting the 1, 2, 3, and 5-year patient survival was 0.864, 0.895, 0.907, and 0.893, respectively.
3.4. HLF may mainly be involved in cell metabolism and cell cycle regulation
As filtered by p-value < 5%, q value < 25%, and normalized enrichment score >1, GSEA revealed 14 HLF related gene sets were enriched in KEGG pathways (Fig. 5A). They were: Amino sugar and nucleotide sugar metabolism, Basal transcription factors, Cell cycle, Fructose and mannose metabolism, Galactose metabolism, Mismatch repair, Glycan biosynthesis, Nucleotide excision repair, p53 signaling pathway, Pathogenic Escherichia coli infection, Protein export, Pyrimidine metabolism, RNA degradation, and Ubiquitin mediated proteolysis. Filtered by P value <1%, HLF related gene sets enriched in 27 GO pathways, and the top 10 were: De Novo protein folding, ER nucleus signaling pathway, GDE binding, mRNA 5-UTR binding, NADP binding, Negative regulation of meiotic cell cycle, Nuclear inner membrane, Pyrimidine nucleoside biosynthetic process, Spliceosomal tri SNRNP complex, and Transcription factor TFIID complex (Fig. 5B).
Figure 5.

GSEA for HLF related gene sets enrichment in KEGG and GO pathways. A: Filtered by P value < 5%, q value < 25% and normalized enrichment score >1, HLF related gene sets were enriched in KEGG pathways were: Amino sugar and nucleotide sugar metabolism, Basal transcription factors, Cell cycle, Fructose and mannose metabolism, Galactose metabolism, Mismatch repair, Glycan biosynthesis, Nucleotide excision repair, p53 signaling pathway, Pathogenic Escherichia coli infection, Protein export, Pyrimidine metabolism, RNA degradation, and Ubiquitin mediated proteolysis. B: Filtered by P value <1%, The top 10 HLF related gene sets enriched in GO pathways were: De Novo protein folding, ER nucleus signaling pathway, GDE binding, mRNA 5-UTR binding, NADP binding, Negative regulation of meiotic cell cycle, Nuclear inner membrane, Pyrimidine nucleoside biosynthetic process, Spliceosomal tri SNRNP complex, and Transcription factor TFIID complex. GO = gene ontology, KEGG = Kyoto Encyclopedia of Genes and Genomes.
4. Discussion
In this study, we found HLF expression was downregulated in glioma species than normal tissue (P = .007), and the expression decreased with advancing age (P < .001) and tumor grade (P < .001). HLF expression was an independent protective factor (HR = 0.81, 95%CI 0.67–0.99, P = .035) for patient survival irrespective of tumor grade (P < .001) and patient age (P < .001). Patients with low HLF expression suffered a poorer survival than those with high HLF expression (P < .001). Multivariate Cox regressions model with HLF expression performed better than that without (concordance: 0.846 vs 0.842, P = .032 by likelihood ratio test), reaching an accuracy of nearly 90% in predicting 1, 2, 3, and 5-year patient survival. GSEA revealed that HLF may take part in cell metabolism and cell cycle regulation.
The past decay has witnessed a great progression in the classification of the high heterogeneous entity of gliomas. Traditional WHO classification for gliomas is based on light microscope findings of tissue histology and tumor's invasion into the surrounding tissues and scaled gliomas into I to IV grade.[18] However, drawbacks of this classification were encountered in clinical practice, as gliomas of the same grade might harbor distinct biological properties and prognosis.[3–7] Revealing of molecular mechanisms underlying glioma tumorigenesis has brought out some new molecular dependent classifications. In 2010, a TCGA data-based new classification for glioblastoma has been proposed based on the aberrations and gene expression of EGFR, NF1, and PDGFRA/IDH1, which were categorized glioblastoma into Classical, Mesenchymal, and Proneural subtypes.[19] These subtypes showed a strong correlation to gene signatures of normal brain cell types, and response to aggressive therapy.[19] Subsequently, with the Chinese Glioma Genome Atlas (CGGA) data, a molecular classification of gliomas based on whole-genome gene expression was proposed in 2012.[20] This study revealed 3 main glioma subtypes in the Chinese population, which was closely related to clinical prognosis and genetic alterations.[20] In 2016, the new WHO classification was published, in which, for the first time, molecular parameters were used to establish brain tumor diagnosis.[8] This new classification has initiated a great wave for screening new genetic alterations with potentials for classification, prognosis prediction, and targeted therapy. In this study, we found HLF expression was downregulated in gliomas than the normal brain and was negatively related to tumor grade (Fig. 1). Furthermore, multivariate Cox regression revealed HLF expression was an independent protective factor for patient survival irrespective of the traditional risk factor of tumor grade (Fig. 2). These results demonstrate that HLF may have the potential as a molecular biomarker for glioma classification, prognosis prediction, and targeted therapy.
HLF was initially identified as an oncogenic transcript or in acute lymphoblastic leukemia.[11] Thereafter, HLF was found to be upregulated in human skin cancers[21] and inhibit cell cycle and in mouse epidermal cells and human keratinocytes.[14] Similarly, HLF was not detected in normal liver but detected in activated hepatic stellate cells and involved in liver fibrosis.[16] Furthermore, HLF could act as an oncofetal protein to drive hepatocellular carcinoma onset and progression, regulate chemotherapy resistance to sorafenib, and predict patient prognosis.[15,22] In a previous study, Chen et al have confirmed that HLF overexpression could decrease cell viability, proliferation, migration, invasion, and radiosensitivity in gliomas via miR-132/TTK axis, exerting an anti-oncogenic effect,[17] which was in accordance with our findings that HLF was downregulated in glioma tissues than the normal brain, and decreased with advancing tumor grade. These results demonstrate that the role of HLF may be tissue or tumor type-specific. HLF expression profiles and roles in other tumors were unclear, and need further elucidation.
Although HLF was identified as an anti-oncogenic transcription factor in gliomas and involved in some glioma biological properties such as proliferation, invasion, and radiotherapy resistance via the miR-132/TTK pathway,[17] its role in other biological properties and the regulatory mechanism remains unclear. In this study, with GSEA in KEGG and GO pathways, we identified 14 KEGG and 27 GO pathways that may be related to HLF expression in gliomas. Half of the 14 KEGG pathways were metabolism-related, indicating that HLF may take part in the reprogramming of the tumor metabolisms. This was further validated in GO pathways in that both GDP and NADPH binding pathways were enriched. Cell cycle pathway was enriched both in the top 10 KEGG and GO pathways, indicating the important role of HLF related gene sets in cell cycle regulation. The involvement of HLF in cell cycle regulation has also been reported previously.[13] Our GSEA results provided the potential direction for investigating the function of HLF, and further molecular mechanical studies were needed to clarify the prediction.
5. Limitations
There are some limitations to this study. First, only patient age, race, gender, and tumor grade were enrolled in this study for survival analysis, some other widely established risk factors such as radiotherapy, chemotherapy, and molecular mutations were not included for analysis. Second, only bioinformatics analysis was conducted in this manuscript, molecular experiments were needed to further elucidate the function of HLF. Third, only the TCGA dataset was analyzed in this manuscript, external validation was absent.
6. Conclusion
Although limitations, some conclusions still could be drawn. HLF expression was downregulated in gliomas than normal brain tissue, and negatively related to patient age and tumor grade. HLF was an independent protective factor for patient survival in patients with gliomas irrespective of patient age and tumor grade. Functional analysis revealed HLF may take mainly part in tumor cell metabolism and cell cycle regulation.
Author contributions
Conceptualization: QingLin Liu, Youxiang Li.
Data curation: QingLin Liu, Huijian Ge, Peng Liu, Youxiang Li.
Funding acquisition: QingLin Liu.
Methodology: Huijian Ge, Peng Liu.
Supervision: Youxiang Li.
Writing – original draft: QingLin Liu.
Writing – review & editing: QingLin Liu, Youxiang Li.
Glossary
Abbreviations: AUCs = areas under the curve, CNS = central nervous system, GO = gene ontology, GSEA = gene set enrichment analysis, HLF = hepatic leukemia factor, HR = Hazard ratio, IDH1/2 = isocitrate dehydrogenase 1/2, KEGG = Kyoto Encyclopedia of Genes and Genomes, OR = odd ratio, ROCs = receiver operating characteristic curves, WHO = World Healy Organization.
References
- [1].Ostrom QT, Cioffi G, Gittleman H, et al. CBTRUS statistical report: primary brain and other central nervous system tumors diagnosed in the United States in 2012–2016. Neuro-Oncology 2019;21: (Supplement_5): v1–00. [DOI] [PMC free article] [PubMed] [Google Scholar]
- [2].Lapointe S, Perry A, Butowski NA. Primary brain tumours in adults. Lancet 2018;392:432–46. [DOI] [PubMed] [Google Scholar]
- [3].Yan H, Parsons DW, Jin G, et al. IDH1 and IDH2 mutations in gliomas. N Engl J Med 2009;360:765–73. [DOI] [PMC free article] [PubMed] [Google Scholar]
- [4].Houillier C, Wang X, Kaloshi G, et al. IDH1 or IDH2 mutations predict longer survival and response to temozolomide in low-grade gliomas. Neurology 2010;75:1560–6. [DOI] [PubMed] [Google Scholar]
- [5].Hegi ME, Diserens AC, Godard S, et al. Clinical trial substantiates the predictive value of O-6-methylguanine-DNA methyltransferase promoter methylation in glioblastoma patients treated with temozolomide. Clin Cancer Res 2004;10:1871–4. [DOI] [PubMed] [Google Scholar]
- [6].Hegi ME, Diserens AC, Gorlia T, et al. MGMT gene silencing and benefit from temozolomide in glioblastoma. N Engl J Med 2005;352:997–1003. [DOI] [PubMed] [Google Scholar]
- [7].Everhard S, Kaloshi G, Criniere E, et al. MGMT methylation: a marker of response to temozolomide in low-grade gliomas. Ann Neurol 2006;60:740–3. [DOI] [PubMed] [Google Scholar]
- [8].Louis DN, Perry A, Reifenberger G, et al. The 2016 World Health Organization Classification of Tumors of the Central Nervous System: a summary. Acta Neuropathol 2016;131:803–20. [DOI] [PubMed] [Google Scholar]
- [9].Miyauchi JT, Tsirka SE. Advances in immunotherapeutic research for glioma therapy. J Neurol 2018;265:741–56. [DOI] [PMC free article] [PubMed] [Google Scholar]
- [10].Ludwig K, Kornblum HI. Molecular markers in glioma. J Neuro-Oncol 2017;134:505–12. [DOI] [PMC free article] [PubMed] [Google Scholar]
- [11].Hunger SP, Ohyashiki K, Toyama K, et al. Hlf, a novel hepatic bZIP protein, shows altered DNA-binding properties following fusion to E2A in t(17;19) acute lymphoblastic leukemia. Gene Dev 1992;6:1608–20. [DOI] [PubMed] [Google Scholar]
- [12].Wahlestedt M, Ladopoulos V, Hidalgo I, et al. Critical modulation of hematopoietic lineage fate by hepatic leukemia factor. Cell Rep 2017;21:2251–63. [DOI] [PMC free article] [PubMed] [Google Scholar]
- [13].Garg S, Reyes-Palomares A, He L, et al. Hepatic leukemia factor is a novel leukemic stem cell regulator in DNMT3A, NPM1, and FLT3-ITD triple-mutated AML. Blood 2019;134:263–76. [DOI] [PubMed] [Google Scholar]
- [14].Waters KM, Sontag RL, Weber TJ. Hepatic leukemia factor promotes resistance to cell death: implications for therapeutics and chronotherapy. Toxicol Appl Pharmacol 2013;268:141–8. [DOI] [PubMed] [Google Scholar]
- [15].Musso O, Beraza N. Hepatocellular carcinomas: evolution to sorafenib resistance through hepatic leukemia factor. Gut 2019;68:1728–30. [DOI] [PMC free article] [PubMed] [Google Scholar]
- [16].Xiang DM, Sun W, Ning BF, et al. The HLF/IL-6/STAT3 feedforward circuit drives hepatic stellate cell activation to promote liver fibrosis. Gut 2018;67:1704–15. [DOI] [PubMed] [Google Scholar]
- [17].Chen S, Wang Y, Ni C, et al. HLF/miR-132/TTK axis regulates cell proliferation, metastasis and radiosensitivity of glioma cells. Biomed Pharmacoth 2016;83:898–904. [DOI] [PubMed] [Google Scholar]
- [18].Louis DN, Ohgaki H, Wiestler OD, et al. The 2007 WHO classification of tumours of the central nervous system. Acta Neuropathol 2007;114:97–109. [DOI] [PMC free article] [PubMed] [Google Scholar]
- [19].Verhaak RG, Hoadley KA, Purdom E, et al. Integrated genomic analysis identifies clinically relevant subtypes of glioblastoma characterized by abnormalities in PDGFRA, IDH1, EGFR, and NF1. Cancer Cell 2010;17:98–110. [DOI] [PMC free article] [PubMed] [Google Scholar]
- [20].Yan W, Zhang W, You G, et al. Molecular classification of gliomas based on whole genome gene expression: a systematic report of 225 samples from the Chinese Glioma Cooperative Group. Neuro-Oncology 2012;14:1432–40. [DOI] [PMC free article] [PubMed] [Google Scholar]
- [21].Waters KM, Tan R, Opresko LK, et al. Cellular dichotomy between anchorage-independent growth responses to bFGF and TPA reflects molecular switch in commitment to carcinogenesis. Mol Carcinogen 2009;48:1059–69. [DOI] [PubMed] [Google Scholar]
- [22].Xiang DM, Sun W, Zhou T, et al. Oncofetal HLF transactivates c-Jun to promote hepatocellular carcinoma development and sorafenib resistance. Gut 2019;68:1858–71. [DOI] [PubMed] [Google Scholar]