Supplemental Digital Content is available in the text
Keywords: forest plot, Google maps, major medical subject headings term, similar articles, social network analysis
Abstract
Background:
Comparison of similarity and difference in research types among journals are concerned in literature. However, to date, none display the methodology seen in selecting similar journals related to the target journal, as similar articles did to a given article. Authors need 1 effective method not only to find similar journals for their studies but also to know the difference in methods. This study (1) shows the similar journals for the target journal online displayed, and (2) identifies the effect of similarity odds ratio compared to the counterparts using the forest plots in Meta-analysis and the major medical subject headings (MeSH terms).
Methods:
We downloaded 1000 recent top 20 most similar articles related to the Respiratory Care journal from the PubMed library, plotted the clusters of related journals using social network analysis (SNA), and compared the MeSH terms in differences in an odds ratio unit using the forest plot relevant to Respiratory Care and the most similar journals. Q statistic and I-square (I2) index were used to evaluate the difference in the proportion of events.
Results:
This study found that (1) the journals related to Respiratory Care are easily presented on Google Maps; (2) 10 journal clusters were identified using SNA; (3) the top 3 MeSH terms are methods, therapy, and physiopathology, and (4) the odds ratios of MeSH terms between journals associated with the Respiratory Care showing different from Int J Chron Obstruct Pulmori Dis and similar to Curr Opin Endocrinol Diabetes Obes within heterogeneity with I2 = 70.5% (P < 0.001) and 0% (P = 0.803), respectively.
Conclusions:
SNA and forest plots provide deep insight into the relationships between journals in MeSH terms. The results of this research can provide readers with a concept diagram that can be used for future submissions to a given journal.
Key Points
The main approaches frequently used in meta-analysis for drawing forest plots were contributed to:
-
(1)
select similar articles from the recent 1,000 published articles in Respiratory Care (journal),
-
(2)
retrieve journals related to similar articles, and
-
(3)
draw a visual representation by using SNA techniques and forest plots that can inspire other relevant research to replicate the approaches for other journals in the future.
1. Introduction
Much more knowledge in publications is required for explorations[1] for readers who are interested in understanding data accumulating at a high velocity, resulting in datasets too large for traditional data-processing systems.[2,3] In practice, data in health care need to incorporate increasingly sophisticated analytical and visual approaches in ways making the data meaningful and useful to humans in our lives.[4] Through techniques in dealing with these so-called big data, understanding the target journal's aims and scope (ie, characteristics for short) in comparison with other journals using associated journals’ names motivates us to conduct this study.
Recently, bibliometric analyses became popular for authors to know the target journal's characteristics or aims and scope.[5] The utility of bibliometric analyses goes beyond information and library science and requires an effort to present an assessment of the scientific literature of a given topic for a given journal. Publications with the features in medical subject headings (MeSH terms) provide insight into the current state of the topics for a journal.[6] As such, data are valuable treasures with great potential to generate useful knowledge for readers and the public. The bibliographic analysis provides a novel, easy, and interesting approach in summarizing a large amount of information related to publications of a target journal that needs to study.
In this modern era of science and technology, authors, for example, undergraduates, postgraduate students, physicians, and research scholars, are fascinated by writing scientific articles as academic scientists.[7] Once an author found a possible journal to submit his/her article to, reading its aims and scope is recommended for a brief introduction to the journal.[8,9] The journal's aims and scope can be seen in the journal's name, but this is not always true. The author must match the aims and scope of his/her article to that of the target journal by browsing similar articles. Using the recent computer techniques, whether similar journals published in the target journal can give hints to its characteristics is worth studying.
As the scholar environment continues to change, researching through new interfaces for effectively retrieving journals associated with the target journal is required, particularly searching for articles rejected to pursue other similar journals for resubmission. Regretfully, researchers often spend a great deal of effort and time retrieving associated journals for their studies and submissions. Fortunately, authors may search for articles related to their target journal using a specific technique or tool. However, to date, none displays the methodology seen in searching journals similar to the target journal, as similar articles did to a given article. Authors should find similar journals for their article submissions using 1 effective and efficient way in this study.
This study
-
(1)
shows the location of related journals for a given journal online displayed through new big-data bibliometric techniques and
-
(2)
identifies the effect of similarity odds ratio (OR) compared to the counterparts using MeSH terms and the forest plots.
2. Methods
2.1. Data sources
We programmed visual basic for applications (VBA) modules in Microsoft Excel to extract the most similar articles related to the Respiratory Care journal with PubMed IDs on June 20, 2020, from the PubMed library. Only those articles labeled as journal articles were included. Others, such as those marked as “Published Erratum, Editorial, or conference proceedings,” were excluded. A total of 1000 eligible PubMed IDs published recently that was the most recent publications in the target journal were obtained (see Additional File 1). A VBA routine was programmed to extract journals related to Respiratory Care journal through PubMed links (called similar articles), as shown in Supplemental Digital Content file 1 http://links.lww.com/MD/F632. Only the top 20 best-match articles were involved due to the limitation of 20 similar articles on 1 webpage in a Pubmed search. Each journal related to a given article was counted once or more (ie, with repetition) and then clustered using social network analysis (SNA).
2.2. Data arrangement to fit the SNA requirement
Before visualizing our results using SNA, we organized the data in compliance with the format and guidelines defined by the Pajek software.[10] Microsoft Excel's VBA routines were used to perform data fitting to SNA requirements (see Additional File 2).
The top 20 best-match articles were ranked in descending order with the weight (Wi) shown in Equation (1), where L denotes the number of similar articles (or journals in this study), and i represents the order of the best-match articles for a given article published in Respiratory Care. In SNA, each journal defined as a note earns the centrality degree (CD) computed using Equation (2), where n (1000) denotes the study sample size, and the CD for a given similar article is determined using the summed weights of the 2 similar journals (ie, at L and g, respectively, and L<>g).
| (1) |
| (2) |
Cluster analysis was performed to observe the journal's characteristics using the journal names related to Respiratory Care. The absolute density (journal weights/total weights) was used to denote the important role of a specific cluster. In contrast, the relative density was used to represent the characteristics of the target journal (ie, Respiratory Care in this study) in other domains or topics.
Similarly, keywords symbolized by major MeSH terms were used to classify article features and research types with no weight considered in Eq. (1).
2.3. Task 1: locating journals related to the target journal on Google Maps
Clusters were separated by the SNA community algorithm and plotted on Google Maps. The bigger bubble represents the number of nodes, that is, representative journals in the cluster (or subnetwork). The wider line indicates the stronger relationships between the 2 ties. Any cluster with a closer relationship is filled with identical colors in the respective bubbles. Similarly, MeSH terms regarding article types were applied to understand the feature of the given article.
2.4. Task 2: identifying the OR in similarity compared to the counterparts using MeSH terms
The forest plot[11,12] (often applied in meta-analysis) was used to display the estimated results from numerous paired observations and events (ie, count in a MeSH term for a given journal) addressing the same article type and feature, along with the overall effects[13] (ie, the average measure). The right-hand column is a plot of the measure of effect (eg, OR) for each observed study (ie, the <MeSH term) denoted by a square incorporating confidence intervals (CIs), which are represented by horizontal lines.
The area of each square is proportional to the study's weight (ie, 1/variance for a MeSH term). The overall measure of effect is represented by a diamond on the plot. The lateral points of which diamond indicate CIs for the overall estimate.
A vertical line representing no effect (eg, OR = 1) is plotted if the CIs for individual studies overlapped with this line; it indicates that the effect sizes do not differ from the no-effect scenario for the individual study at a given level of confidence (eg, P < .05). The same situation can be applied to the overall effect if the points of the diamond touch the line of the no-effect scenario, indicating that the overall result cannot differ from the no-effect scenario at a given level of confidence. We particularly drew the forest plot on a dashboard for a better understanding of the effect on each observed study through the functions zoom in and zoom out on Google Maps.
The meaningfulness of the study data for the individual effect of the MeSH term is denoted by the weight (size) of the box. Data from studies with greater sample sizes and smaller CIs are more meaningful data, which contribute to the pooled result (ie, the overall effect) with a greater degree. The 95% CIs can be yielded by following Eqs. (3) to (10) if counts in a confusion matrix are known (eg, n1 = 85, n2 = 515, n3 = 100, and n4 = 500).
| (3) |
| (4) |
| (5) |
| (6) |
| (7) |
| (8) |
| (9) |
where
| (10) |
as the example in Eq. (4).
To understand the similarity and difference in article type and feature between 2 journals, 2 forest plots were generated for the 2 most similar journals in comparison with the target journal when the proportion of MeSH terms were taken into account using the 1000 articles deposited in Supplemental Digital Content File 1, http://links.lww.com/MD/F632.
2.5. Task 3: creating dashboards on Google Maps
We applied the author-made modules in Microsoft Excel and the SNA in Pajek[10]
-
(1)
to obtain the CD of each related journal and
-
(2)
to verify the difference in density compared to counterparts using the forest plots.
The pages of Hypertext Markup Language used for Google Maps were created; see Supplemental Digital Content File 2, http://links.lww.com/MD/F633. All relevant information was linked to the dashboards laid on Google Maps; see the study flowchart in Figure 1.
Figure 1.
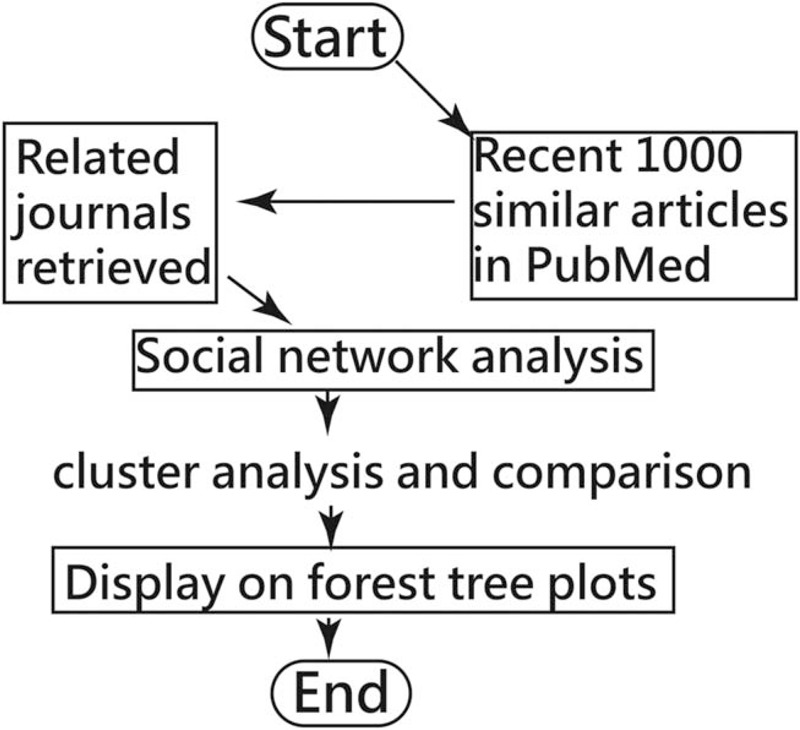
Study flowchart.
3. Results
3.1. CDs for each cluster in SNA
Ten clusters with corresponding representatives were separated using SNA (Table 1). The biggest cluster came from the cluster of Respiratory Care, followed by Orvosi Hetilap and Current Opinion in Endocrinology, Diabetes, and Obesity, indicating several small article types (MeSH terms) represented by trivial roles played in those other journals.
Table 1.
Clusters and their corresponding centrality degrees.
| Cluster | Journal | n | CD | Total CD | % |
| 1 | Respir Care | 1019 | 836.01 | 12784.05 | 0.07 |
| 2 | Orv Hetil | 4 | 47.60 | 82.55 | 0.58 |
| 3 | Curr Opin Endocrinol Diabetes Obes | 4 | 5.17 | 12.03 | 0.43 |
| 4 | Int J Occup Environ Health | 5 | 5.10 | 12.65 | 0.40 |
| 5 | Acta Neurochir Suppl | 4 | 4.89 | 11.80 | 0.41 |
| 6 | Malar J | 5 | 3.94 | 11.13 | 0.35 |
| 7 | J Interpers Violence | 6 | 3.56 | 12.68 | 0.28 |
| 8 | Drug Alcohol Rev | 4 | 3.04 | 8.92 | 0.34 |
| 9 | Metab Syndr Relat Disord | 6 | 2.14 | 11.14 | 0.19 |
| 10 | J Cardiol | 1 | 0.04 | 0.04 | 1.00 |
| Total | 1058 | 911.48 | 18009.12 | 0.05 |
CD = centrality degree.
3.2. Task 1: locating the journals related to the target journal on Google Maps
The 10 clusters are presented in Figure 2. The journal impact factor (JIF) based on Clarivate Analytics are shown in red font. We can see that the journal's characteristics can be easily identified by referring to related journals’ names in Figure 2. This is a clue to the characteristics of the target journal that can be examined by taking a look at similar journals on a graph. It is because that the SNA characterizes networked structures in terms of nodes (eg, journal names in this study) and the ties, edges, or links (relationships or interactions) that connect them. These visualizations provide a means of qualitatively assessing networks by varying the visual representation of their nodes and edges to reflect attributes of interest. A more number of relationships or interactions drive entities (eg, journals in Fig. 3) to form ties with similar versus dissimilar others. The similarity, in this case, can be defined by the salient characteristic of similar articles toward journals with each other.
Figure 2.
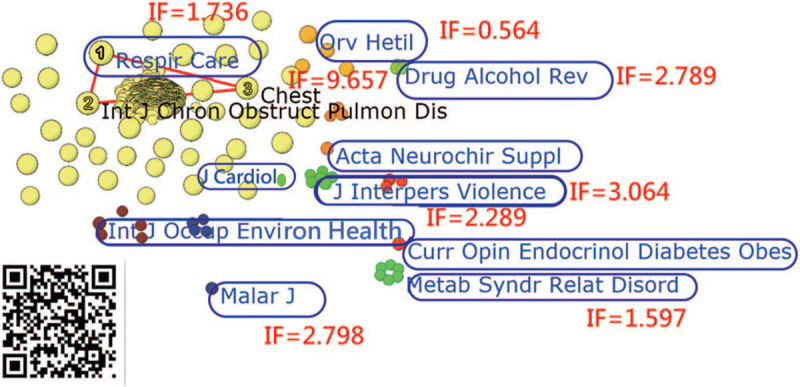
Cluster analysis of similar journals related to Respir Care.
Figure 3.
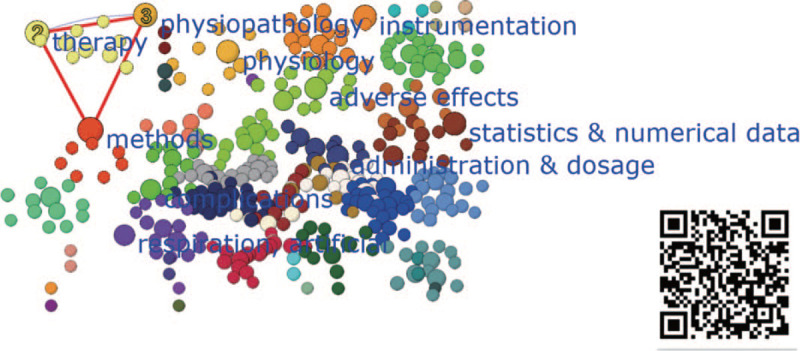
Cluster analysis of MeSH terms for the journal of Respir Care. MeSH = medical subject headings.
3.3. Task 3: locating the MeSH terms related to the target journal on Google Maps
Several MeSH terms were highlighted to present the most important feature for the Respiratory Care journal in Figure 2. We can see that the top 3 (ie, methods, therapy, and physiopathology) are highlighted with a triangle in Figure 3.
With other following 7 representative MeSH terms, comparisons in similarity and difference of article types denoted by MeSH terms were made to select 2 journals of
-
(1)
Int J Chron Obstruct Pulmori Dis and
-
(2)
Curr Opin Endocrinol Diabetes Obes (shown in a similar to and different from the cluster represented by the target journal of Respiratory Care in Fig. 2) using forest plots in the next section.
3.4. Task 2: identifying the similarity OR compared to the counterparts
The ORs of MeSH terms between journals associated with the Respiratory Care showing different from Int J Chron Obstruct Pulmori Dis and similar to Curr Opin Endocrinol Diabetes Obes within heterogeneity with I2 = 70.5% (P < .001) and 0% (P = .803), respectively, in Figures 4 and 5. Any feature in favor of Respiratory Care (eg, instrumentation and respiration, artificial in Fig. 4) is easily observed using forest plots to display.
Figure 4.
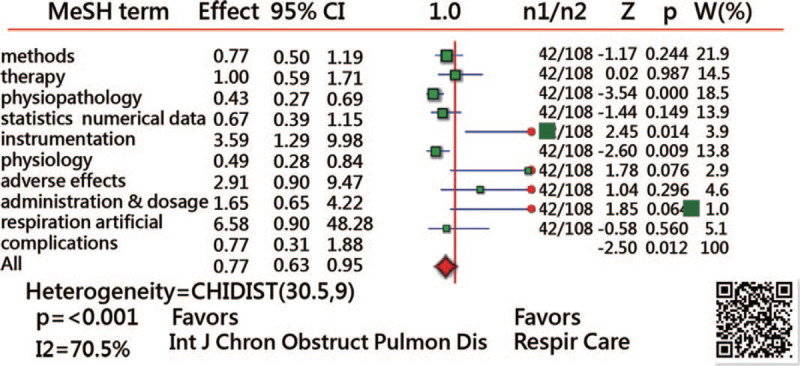
Comparison of odds ratios to main MeSH terms for two journals of Int J Chron Obstruct Pulmori Dis and Respir Care. MeSH = medical subject headings.
Figure 5.
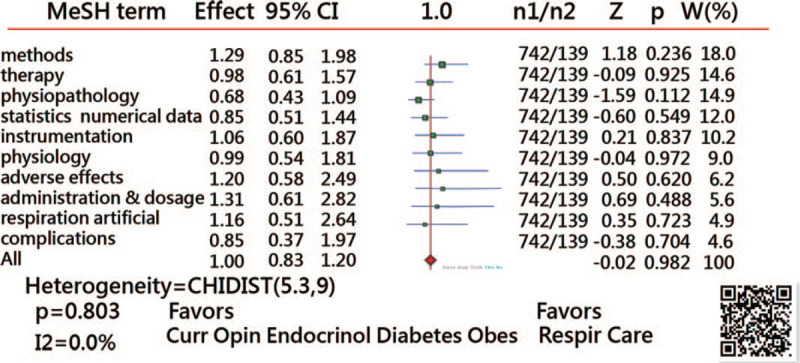
Comparison of odds ratios to main MeSH terms for two journals of Curr Opin Endocrinol Diabetes Obes and Respir Care. MeSH = medical subject headings.
3.5. Task 3: creating dashboards on Google Maps
Figures from 2 to 5 are provided with links to the references.[14–17] Readers are invited to see the detailed information on the dashboard laid on Google Maps.
4. Discussion
4.1. Principle findings
We applied the SNA technique to explore the characteristics of the Respiratory Care journal and found that
-
(1)
the journals related to Respiratory Care were easily presented on Google Maps;
-
(2)
10 journal clusters were identified using SNA;
-
(3)
the top 3 MeSH terms are methods, therapy, and physiopathology, and
-
(4)
the ORs of MeSH terms between journals associated with the Respiratory Care showing differently from Int J Chron Obstruct Pulmori Dis and similar to Curr Opin Endocrinol Diabetes Obes within heterogeneity with I2 = 70.5% (P < .001) and 0% (P = .803), respectively.
4.2. Review of research findings
With the popularity of big data- and knowledge discovery-related developments recently, we sought to retrieve the most recent 1000 articles published in Respiratory Care to understand the journal's characteristics by looking up the names of the associated journals shown in Figure 2. With this technique, authors can know the journal's characteristics with a quick glance. A similar technique is applied to MeSH terms in Figure 3.
The publications provide valuable insight regarding the characteristics of the target journal. The main approaches include those
-
(1)
similar articles searched in PubMed,
-
(2)
journals related to similar articles, and
-
(3)
a visual representation drawn using SNA.
We can see that researchers who submit articles to a given journal can examine the target journal's characteristics via a visual display, which is rare, novel, and never seen before in the literature.
Through a visual display (Figs. 2 and 3), authors can easily submit their manuscripts to the appropriate journal soon when journal characteristics were known. This study applied Google Maps with SNA to display all associated journals on a dashboard and provided a breakthrough for future studies on other journals of interest. Readers are invited to click on the link at the references.[14,15] Such a network in Figures 2 and 3 can be defined as a co-occurrence pattern, which is a phenomenon found to be similar to a previous study.[18–20]
Many journals provide authors manuscript transfer services as a convenient way of resubmitting manuscript files and reviewer comments to other journals within the journal's publishing portfolio.[21,22] However, no such information about the journal characteristics related to the target journal was provided to authors as we did in this study. One picture is worth ten thousand words.[23] We hope that future studies can combine SNA with Google Maps to report other types of study results to readers in the future.
4.3. Implications and applications of the study
A novel approach for plotting the forest plots is provided in the references,[24,25] which are easily and clearly displayed and interpreted on dashboards laid on Google Maps. The online forest plot can be applied to any 2-pair comparison with 2 observed events and nonevent counts. The method was used in numerous articles related to meta-analysis in the literature.[26]
This study conducted a bibliometric analysis of articles indexed in PubMed, using 1000 downloaded recent top-20 most similar articles related to Respiratory Care. In addition to the methods and instrumentality advantages used in this study, we offered distinct conceptual tools that can help researchers analyze this study with a systematic and comprehensive understanding of the research question, such as the most associated journals to a given target journal.
Scientific paper writing for science journals is a highly adroit, competitive, and laborious process.[7] The study strengths include the following:
-
(1)
finding of highly associated journals to Respiratory Care online displayed on Google Maps and
-
(2)
the use of forest plots to allow researchers to intuitively understand the clusters of Respiratory Care using similarity OR and its 95% CIs compared with counterparts.
Many studies[18–20] merely showed the patterns of interest on a map and ignored the network density indices (ie, the important role played in a cluster), which are also essential when interpreting visual displays using SNA. For example, Respiratory Care earned a density of 0.07 (836.01/12,784.05) in Table 1.
Google Maps are sophisticatedly used and linked in references.[17,23,24] The reader can manipulate the dashboard as they wish to understand the characteristics of the journals related to Respiratory Care. Like an airline route (https://jl.fltmaps.com/en/japan), readers can be redirected to any location to drill down more detailed information on their own. We provided Supplemental Digital Content File 2, http://links.lww.com/MD/F633 to readers who can easily understand how to proceed with the research, which is rarely found in other studies.
4.4. Limitations and suggestions
Although combined efforts to make a systematic and comprehensive approach to collect and analyze relevant articles were made in this study, several limitations that should be alert to readers are raised. First, we used SNA to analyze clusters of journals and MeSH terms related to the target journal; this might present somewhat different features from other SNA software, such as Usenet[27] and Gephi.[28] We provided Supplemental Digital Content File 2, http://links.lww.com/MD/F633 to readers who can understand how we transform the coordinates from Pajek[10] into Google Maps. The clusters can be gathered in colors and sizes on Google Maps with a hyperlink. It is worth developing as new concepts (eg, journals and MeSH terms in this study) separated by clusters for readers in future studies.
Many innovations have been introduced with advances in science and technology, such as the visual dashboard on Google Maps using the coordinates to display clusters of journals and MeSH terms as shown in Figures from 2 to 5. However, these achievements are not free of charge. For example, the Google Maps API requires a paid project key for use on the cloud platform. Thus, the second limitation in this study is that it is not publicly accessible and is difficult to mimic by other authors or programmers for use in a short period of time.
Third, the interpretation and generalization of the visual display should be cautious because the data were merely extracted from PubMed. Note that any generalization should be made in the similar article contents (eg, MeSH terms) and the target journal (eg, Respiratory Care).
Fourth, the data were extracted from 1000 recent top 20 best-matched articles; this is a weak explanation for related journals evolving at earlier stages (eg, before 2017). More data points should be involved in future studies to create more precise inferences for the study.
Fifth, the JIFs shown in Figure 2 were illustrated in this study. We found a difference in impact factors across years for each journal, which cannot be generalized to the future because JIFs of each year are not similar based on the Clarivate Analytics.
Finally, the vulnerability[29] of the proposed approaches (eg, showing SNA on Google Maps with Supplemental Digital Content File 2, http://links.lww.com/MD/F633) to any attacks of false positives and false negatives have not been taken into account. An application security framework that helps development teams
-
(1)
review (or address) code vulnerabilities and
-
(2)
minimize false positives discovered in Figures laid on Google Maps is worthy of evaluations further in the future.
5. Conclusions
This study exhibited a detailed overview of the characteristics of Respiratory Care using bibliometric and SNA methods. Several foundations for future studies were paved, including
-
(1)
research with SNA and Google Maps to present characteristics of the target journal, and
-
(2)
a reference that can be mimicked for future studies displays knowledge concept maps to readers.
Additionally, the forest plot provides a good visual comparison and the ORs can be used as an evaluation indicator to compare and analyze the similarity of journals using the MeSH terms in the future.
We demonstrated methods and results on Google Maps and inspired other relevant studies to replicate the approaches for other disciplines in the future.
The method of using forest plots to present the similarity and difference of research topics with MeSH terms related to Respiratory Care (journal) is novel and innovative for authors who want to know a given journal related on article submissions in the future.
Acknowledgment
The authors appreciate the Tainan Municipal Hospital (Managed by Show Chwan Medical Care Corporation) Research Fund so that the study can be completed successfully.
Author contributions
Conceptualization: Tsair-Wei Chien.
Formal analysis: Yu-Hua Yan, Tsair-Wei Chien.
Funding acquisition: Yu-Hua Yan.
Methodology: Yu-Hua Yan.
Resources: Yu-Hua Yan.
Glossary
Abbreviations: MESH = medical subject headings, SNA = social network analysis, VBA = visual basic for application.
References
- [1].Riba M, Sala C, Toniolo D, et al. Big data in medicine, the present and hopefully the future. Front Med (Lausanne) 2019;6:263. [DOI] [PMC free article] [PubMed] [Google Scholar]
- [2].Bates DW, Saria S, Ohno-Machado L, et al. Big data in health care: using analytics to identify and manage high-risk and high-cost patients. Health Aff (Millwood) 2014;33:1123–31. [DOI] [PubMed] [Google Scholar]
- [3].Provost F, Fawcett T. Data science and its relationship to big data and data-driven decision making. Big Data 2013;1:51–9. [DOI] [PubMed] [Google Scholar]
- [4].Weintraub WS. Role of big data in cardiovascular research. J Am Heart Assoc 2019;8:e012791. [DOI] [PMC free article] [PubMed] [Google Scholar]
- [5].Mullins CH, Boyd CJ, Lindeman B. Factors associated with the highest and lowest cited research articles in general surgery journals. J Surg Res 2020;250:39–44. [DOI] [PMC free article] [PubMed] [Google Scholar]
- [6].Whitney E, Mahato D, Odell T, et al. The 100-most cited articles about craniectomy and hemicraniectomy: a bibliometric Analysis. Cureus 2019;11:e5524. [DOI] [PMC free article] [PubMed] [Google Scholar]
- [7].Meo SA, Eldawlatly AA. Pathophysiology of a scientific paper. Review Saudi J Anaesth 2019;13: (Suppl 1): S9–11. [DOI] [PMC free article] [PubMed] [Google Scholar]
- [8].Griffo R. Scope and aims of the journal. Monaldi Arch Chest Dis 2002;58:iii–10. [PubMed] [Google Scholar]
- [9].Dhaenens M. Aims & scope. EuPA Open Proteom 2019;22–23:2–3. [DOI] [PMC free article] [PubMed] [Google Scholar]
- [10].de Nooy W, Mrvar A, Batagelj V. Exploratory Social Network Analysis with Pajek: Revised and Expanded. 2nd ednNew York: Cambridge University Press; 2011. [Google Scholar]
- [11].Sedgwick P. How to read a forest plot in a meta-analysis. BMJ 2015;351:h4028. [DOI] [PubMed] [Google Scholar]
- [12].Stephenson J. Explaining the forest plot in meta-analyses. J Wound Care 2017;26:611–2. [DOI] [PubMed] [Google Scholar]
- [13].Lalkhen AG, Statistics V. Introduction to clinical trials and systematic reviews. Continuing Educ Anaesth Crit Care Pain 2008;8:143–6. [Google Scholar]
- [14].Chien TW. Google Maps on Journals Related to the Journal of Respiratory Care. Available at: http://www.healthup.org.tw/gps/RCsimilarA.htm [access June 14, 2020]. [Google Scholar]
- [15].Chien TW. Forest trees on journals related to MeSH terms for Respiratory Care. Available at: http://www.healthup.org.tw/gps/rtsimilaritymesh.htm [access June 14, 2020]. [Google Scholar]
- [16].Chien TW. Forest Trees on Journals Related to the Journal Related to Respiratory Care and Int J Chron Obstruct Pulmori Dis. Available at: http://www.healthup.org.tw/gps/rtarticle1.htm [access June 14, 2020]. [Google Scholar]
- [17].Chien TW. Forest Trees on Journals Related to the Journal Related to Respiratory Care and Curr Opin Endocrinol Diabetes Obes. Available at: http://www.healthup.org.tw/gps/rtarticle2.htm [access June 14, 2020]. [Google Scholar]
- [18].Sadoughi F, Valinejadi A, Shirazi MS, et al. Social network analysis of Iranian researchers on medical parasitology: a 41 year co-authorship survey. Iran J Parasitol 2016;11:204–12. [PMC free article] [PubMed] [Google Scholar]
- [19].Osareh F, Khademi R, Rostami MK, et al. Co-authorship network structure analysis of Iranian researchers’ scientific outputs from 1991 to 2013 based on the social science citation index (SSCI). Collnet J Scientometr Info Manag 2014;8:263–71. [Google Scholar]
- [20].Liu X, Bollen J, Nelson ML, et al. Co-authorship networks in the digital library research community. Info Process Manag 2005;41:1462–80. [Google Scholar]
- [21].Eysenbach G. My Paper Was Rejected (or I am Not Sure I can Address the Reviewer Comments) - How do I request a Manuscript Transfer to Another Journal? Available at: https://jmir.zendesk.com/hc/en-us/articles/115001714547 [access June 1, 2020]. [Google Scholar]
- [22].Springer. How to Transfer Manuscripts. Available at: https://www.springer.com/gp/authors-editors/transfer-desk [access June 1, 2020]. [Google Scholar]
- [23].Oska S, Lerma E, Topf J. A picture is worth a thousand views: a triple crossover trial of visual abstracts to examine their impact on research dissemination. J Med Internet Res 2020;22:e22327. [DOI] [PMC free article] [PubMed] [Google Scholar]
- [24].Chien TW. Forest Trees on Journals Related to the Journal of Medicine Within a Given Cluster. Available at: http://www.healthup.org.tw/gps/RCsimilarB.htm [access June 14, 2020]. [Google Scholar]
- [25].Chien TW. Forest Trees on Journals Related to the Journal of Medicine Between Clusters. Available at: http://www.healthup.org.tw/gps/RCsimilarC.htm [access June 14, 2020]. [Google Scholar]
- [26].Chien TW. Meta-analysis in Pubmed. Available at: https://pubmed.ncbi.nlm.nih.gov/?term=Meta-analysis%5BMeSH+Major+Topic%5D [access June 14, 2020]. [Google Scholar]
- [27].Borgatti SP, Everett MG, Freeman LC. Ucinet for Windows: Software for Social Network Analysis. Harvard, MA: Analytic Technologies; 2002. [Google Scholar]
- [28].Bastian M, Heymann S, Jacomy M. Gephi: An Open Source Software for Exploring and manipulating networks. International AAAI Conference on Weblogs and Social Media, 2009. Available at: https://gephi.org/publications/gephi-bastian-feb09.pdf. [Accessed January 22, 2021]. [Google Scholar]
- [29].Li J. Vulnerabilities mapping based on OWASP-SANS: a survey for static application security testing (SAST). Ann Emerg Technol Comput 2020;4:1–8. [Google Scholar]


