

Abstract
Background:
There is no golden standard for the diagnosis of Kawasaki disease (KD), the most common cause of acquired heart disease in children in many countries. In recent years, many studies have focused on the relationship between microRNAs (miRNAs) and KD. Thus, we perform this meta-analysis to understand the role of circulating miRNAs as a biomarker to detect KD.
Methods:
We searched PubMed, EMBASE, the Cochrane Central Register of Controlled Trials, and China National Knowledge Infrastructure through March 10, 2019. Meta-disc 1.4 and STATA 15.1 (Stata Corporation, College Station, TX) were used to conduct the meta-analysis.
Results:
Six eligible articles were included in this meta-analysis. The overall performance of total mixed miRNAs detection was: pooled sensitivity, 0.7 (95% confidence interval, 0.66–0.74); pooled specificity, 0.87 (95% confidence interval, 0.83–0.90); and area under the summary receiver operating characteristic curves value (SROC), 0.8302. The meta-regression analysis indicated that the specimen types, the composition of the control group, and types of the reference miRNA were not responsible for the existing heterogeneities. The subgroup analysis showed that SROC of the plasma group (0.8890) was more significant than the serum group (0.7204), and SROC of the non-healthy control group (0.9622) was more significant than the healthy control group (0.8096).
Conclusions
: This is the first meta-analysis show that miRNAs may be used as novel biomarkers for detecting KD, especially for distinguishing KD from other febrile diseases. More studies are needed in the future to clarify the association between KD and miRNAs.
PROSPERO registration number:
CRD42019129976
Keywords: biomarker, diagnosis, Kawasaki disease, meta-analysis, microRNA
1. Introduction
Kawasaki disease (KD) is an unknown cause of self-limited febrile vasculitis, which mainly affects children under 5 years old.[1] KD is the most common cause of acquired heart disease in children in many countries.[2–4] The major etiology of KD is unknown. Timely initial treatment with intravenous immunoglobulin reduced the incidence of coronary artery lesions from 25% to less than 5%.[5] Delayed diagnosis is associated with increased coronary artery lesions.[6] In clinical practice, the diagnosis of KD is mainly based on the American Heart Association[1] or Japanese Cardiology Society Joint Working Group criteria[7]; both made according to the clinical manifestations and laboratory tests. Laboratory tests, such as C reactive protein, erythrocyte sedimentation rate, and nitrogen-terminal B-type natriuretic peptide (NT-proBNP) have although been proved to be important in the diagnosis of KD, but none of them can accurately diagnose KD.[8,9] There is still a lack of specific laboratory indicators for the diagnosis of KD. Therefore, the search for new and reliable circulating biomarkers is of great significance for the early diagnosis of KD.
MicroRNAs (miRNAs) are a subset of intra hereditarily initiated single-stranded noncoding RNAs that participate in inhibiting protein translation or degradation of polypeptides by binding to the untranslated regions of mRNA.[10] Previous studies have demonstrated that circulating miRNAs can be considered as potential biomarkers for detecting various diseases, including cancer, cardiovascular disease, and autoimmune diseases.[11–14] Besides, many studies have focused on the association between the miRNAs and the risk of KD, indicating that miRNAs might be potential and reliable biomarkers for diagnosing KD.[15,16] However, the results were inconsistent. Therefore, we performed this meta-analysis to assess the diagnostic accuracy of miRNAs for KD.
2. Materials and methods
2.1. Study protocol
This analysis was performed following a predetermined protocol by the recommendations of Deeks.[17] Data collection and reporting were conducted according to the Preferred Reporting Items for Systematic Reviews and Meta-Analyses (PRISMA) Statement.[18] As it is systematic literature research, there is no need for ethical approval. The protocol for this analysis was registered with PROSPERO (CRD42019129976).
2.2. Search strategy
We searched multiple databases, including PubMed, EMBASE, the Cochrane Central Register of Controlled Trials, and China National Knowledge Infrastructure through March 10, 2019 to identify the relevant studies. Keyword search terms were (“mucocutaneous lymph node syndrome” or “Kawasaki disease” or “Kawasaki syndrome”) and (“MicroRNAs” or “MicroRNA” or “miRNAs” OR “miRNA”).
2.3. Study selection
The title and abstract of the article were preliminarily selected through system retrieval. Then, potentially relevant studies were searched by full text and evaluated for inclusion and exclusion criteria.
The criteria for inclusion were
-
(1)
all KD subjects were confirmed by KD diagnosis criteria;
-
(2)
randomized controlled or non-randomized controlled, clinical trials, cohort studies to evaluate miRNAs expression;
-
(3)
data including true positive, false positive, false negative, and true negative can be calculated, such as data of the receiver operating characteristic (ROC) curve and essential sample size;
-
(4)
all studies had non-KD subjects as the control group, either healthy or febrile controls;
-
(5)
the expression of miRNAs detection methods must be conventional, such as miRNA sequence, real-time polymerase chain reaction (RT-PCR), and quantitative real-time polymerase chain reaction (qRT-PCR); and all specimens were obtained during the acute phase of KD before treatment.
The criteria for exclusion were
-
(1)
conferences articles, reviews, letters, editorials, abstracts, expert opinions, or case reports without controls;
-
(2)
no complete data to form a 2 × 2 table; and
-
(3)
duplicated reports.
2.4. Data collection and assessment of research quality
Two researchers (Gang Wu, Peng Yue) independently assessed studies eligibility by title or abstract, and a third reviewer (Xiaolan Zheng) determining the divergences based on inclusion or exclusion criteria and reports quality. Quality assessment of all selected studies was conducted independently by 2 researchers (Fan Ma, Yi Zhang) following 14-item quality assessment of diagnostic accuracy studies list,[19] and any disagreement was resolved through discussion. All assessments were reported in descriptive forms, as a well-conducted study might score poorly once relevant parts of the methodology and results are missing.
2.5. Evaluation indicators
We measured the following indicators for different types of miRNAs: sensitivity, specificity, diagnostic odds ratio (DOR), area under the summary receiver operating characteristic curves value (SROC). The proportion of KD patients with positive miRNAs expression represented sensitivity. Besides, the proportion of non-KD cases correctly identified with negative miRNAs expression represented specificity. Furthermore, DOR more reliably defined a summary of test performance rather than combine sensitivity and specificity of individual studies. Meanwhile, DOR was an independent index in a range from 0 to infinity. The higher the DOR, the better the test discrimination ability.[20] SROC was plotted according to sensitivity and specificity. In addition, the area under the curve (AUC) value was a global measure of test performance, and the closer the AUC was to 1, the better the test performance.[21]
2.6. Publication bias
We used STATA version 15.1 (Stata Corporation, College Station, TX) statistical software to quantify all publication bias using Deeks’ test. Asymmetric distribution of data points in Deeks’ test plot, quantified P < .05, indicating potential publication bias.[22]
2.7. Heterogeneity and meta-regression
Heterogeneity of pooling sensitivity and specificity was examined by the X2 test. We used the Cochran Q test to examine the heterogeneity of pool DOR. Heterogeneity was statistically significant when P < .05. We also performed the I2 test to quantitatively estimate the proportion of total variation across reports in every summary analysis. I2 value ranging from 0 to 100%, with values of 25, 50, and 75%, respectively, were considered as evidence of low, moderate, and high heterogeneity.[23] A curvilinear shape in the SROCs indicated a threshold effect. We conducted meta-regression analysis to identify potential factors that might contribute to heterogeneity. All the possible factors extracted from baseline measurements and original testing procedures were considered for the meta-regression. The meta-regression could determine the correlation between potential factors and existing heterogeneity. When significant differences were discovered, the factor should have a significant impact on the homogeneity of the included studies with a P value < .05.
2.8. Sensitivity analysis
Sensitivity analysis of included studies was performed using STATA version 15.1 to determine the impact of individual trials on the results. Meta-disc 1.4 (Ramón y Cajal Hospital, Madrid, Spain) was used to detect the threshold effects in the study.[24]
2.9. Statistical analysis
Meta-disc 1.4 (Ramón y Cajal Hospital, Madrid, Spain) was utilized for data analysis. Besides, publication bias analysis was conducted by STATA Version 15.1. Homogeneous results were statistically analyzed by fixed effects model, while heterogeneous (I2 > 50%) results were statistically analyzed by random effects model, and the data were presented by forest map.
3. Results
3.1. Search results
Initially, 119 potentially relevant papers were retrieved using the above search method, 19 of which were considered to be interested by scanning titles and abstracts. However, due to article types, 4 reports were excluded by reading the full article, 6 studies lacked available data to construct a 2 × 2 table, and 3 articles lacked non-KD controls. Finally, 6 studies[25–30] were included in the meta-analysis. The process of study selection was illustrated in Figure 1. All included reports were prospective trials. In the included studies, the sample types of 3 studies were plasma,[25–27] and the remaining 3 studies were serum.[28–30] Besides, 3 studies defined healthy children as healthy controls (HCs),[26,27,29] 1 study defined juvenile systemic lupus erythematosus as the control,[25] 2 studies used both healthy and febrile children as controls.[28,30] Meanwhile, there were 2 types of reference miRNA, cel-miR-39,[25,27,28,30] and U6.[26,29] The basic characteristics of the included studies were shown in Table 1.
Figure 1.
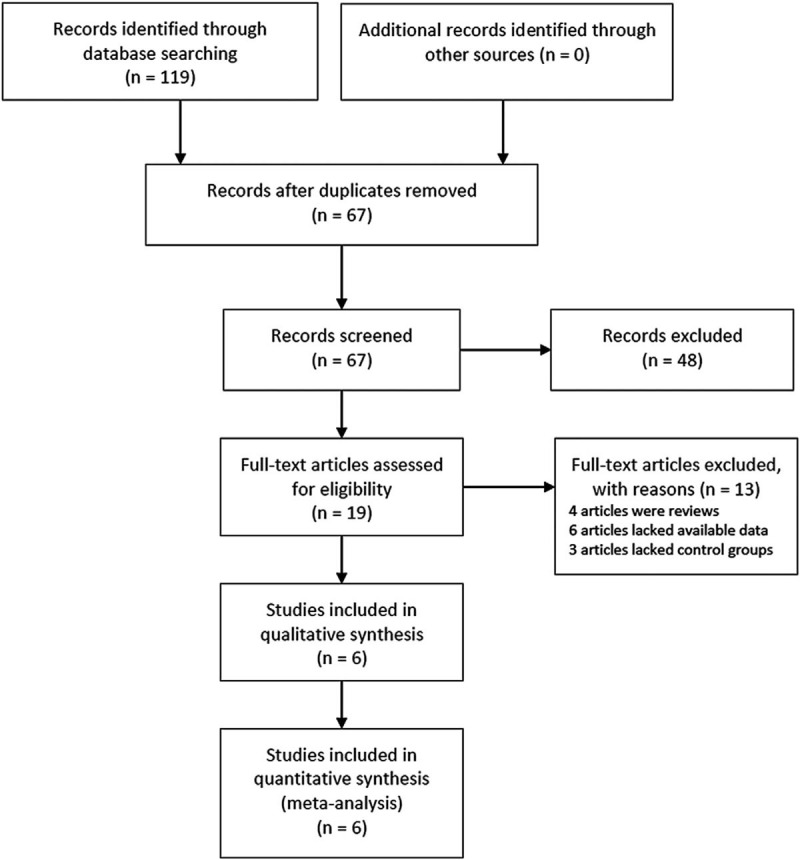
Flow chart of the study selection process.
Table 1.
Characteristics of studies in this meta-analysis.
| No. | First author | Yr | Country | Design | Composition of control | Detection method | Reference | Reference miRNA | Specimen | Case (male/female) | Age of case | Control (male/female) | Age of control | Selected miRNAs | Expression | Sensitivity | Specificity |
| 1 | Sun J | 2015 | China | Prospective | JSLE | qRT-PCR | AHA | Cel-miR-39 | Plasma | 26 (N/R) | 2.2 | 20 (N/R) | 10.7 | miR-1825 | Up-regulated | 1 | 1 |
| 2 | Sheng WW | 2016 | China | Prospective | HC | qRT-PCR | AHA | U6 | Plasma | 45 (27/18) | 0.3–7 | 30 (18/12) | 0.3–7 | miR-145 | Up-regulated | 0.6444 | 0.9 |
| miR-143 | Up-regulated | 0.6444 | 0.8667 | ||||||||||||||
| 3 | Jia LH | 2016 | China | Prospective | HC | qRT-PCR | AHA | Cel-miR-39 | Plasma | 33 (25/8) | 2.1 | 15 (11/4) | 1.7 | miR-21 | Up-regulated | 0.846 | 0.714 |
| 4 | Rong X | 2017 | China | Prospective | HC | RT-PCR | JCS | Cel-miR-39 | Serum | 45 (34/11) | 2.1 | 30 (21/9) | 1.7 | miR-92a-3p | Up-regulated | 0.733 | 0.889 |
| FC | 30 (23/7) | 1.5 | miR-92a-3p | Up-regulated | 0.733 | 0.733 | |||||||||||
| 5 | Zhang W | 2017 | China | Prospective | HC | qRT-PCR | AHA | U6 | Serum | 102 (60/42) | 2.2 | 80 (45/35) | 2.3 | miR-200c | Up-regulated | 0.6 | 0.8 |
| miR-371–5p | Up-regulated | 0.667 | 0.866 | ||||||||||||||
| 6 | Rong X | 2018 | China | Prospective | HC | qRT-PCR | AHA | Cel-miR-39 | Serum | 34 (24/10) | 2.7 | 42 (27/15) | 3.6 | miR-27b | Up-regulated | 0.853 | 1 |
| FC | 15 (10/5) | 4.1 | miR-27b | Up-regulated | 0.676 | 0.933 |
AHA = American Heart Association, FC = febrile control, HC = healthy control, JCS = Japanese Cardiology Society, JSLE = juvenile systemic lupus erythematous, miR = mircoRNA, N/R = not report.
3.2. Study quality
The quality assessment of the included studies was done following the quality assessment of diagnostic accuracy studies list of questions, with the results shown in Table 2.
Table 2.
Quality assessment of diagnostic accuracy studies criteria of included studies.
| No. | Spectrum composition | Selection criteria | Reference standard | Disease progression bias | Partial verification | Differential verification | Incorporation bias | Index test execution | Reference standard execution | Test review bias | Reference standard review bias | Clinical review bias | Uninterruptible test results | Withdrawals |
| 1 | ? | + | + | ? | + | + | + | + | + | + | + | + | + | ? |
| 2 | + | + | + | + | + | + | + | + | + | + | + | + | + | + |
| 3 | + | + | + | ? | + | + | + | + | + | + | + | + | + | + |
| 4 | + | + | + | + | + | + | + | + | + | + | + | + | + | ? |
| 5 | + | + | + | + | + | + | + | + | + | + | + | + | + | + |
| 6 | ? | + | + | ? | + | + | + | + | + | + | + | + | + | ? |
3.3. Diagnostic accuracy of miRNAs
The overall diagnostic measurements for detecting KD of total mixed miRNAs (TmiRs) was summarized in Figure 2. The pooled sensitivity was 0.70 (95%CI, 0.66–0.74), and the pooled estimation showed significant heterogeneity (P = .0001, X2 = 33.98, I2 = 73.5%) (Fig. 2A). Meanwhile, the summary specificity was 0.87 (95%CI, 0.83–0.90), and the pooled estimation also showed noticeable heterogeneity (P = .0012, X2 = 27.40, I2 = 67.20%) (Fig. 2B). The pooled DOR was 15.53 (95% CI, 8.37–28.85), with significant heterogeneity (P = .0171, X2 = 20.13, I2 = 55.3%) (Fig. 2C). The calculated AUC value was 0.8302 ± 0.0402 (Fig. 2D). There was no curvilinear shape in SROC, indicating no potential threshold effect. After a review of the baseline data and original data generation, specimen types, control group composition, and reference miRNA type were considered in meta-regression to detect the origin of heterogeneity. According to the results (Fig. 3), the meta-regression did not find that specimen type was a dramatic impact factor on the homogeneity of the included studies, P = .604, t = –0.54, 95%CI (0.12, 3.71) (Fig. 3A). Besides, the composition of the control group was not a significant factor, P = .791, t = –0.27, 95%CI (0.09, 6.49) (Fig. 3B). Meanwhile, the meta-regression also did not detect types of the reference miRNA has a dramatic impact on the homogeneity of the enrolled studies, P = 0.263, t = –1.21, 95%CI (0.10, 2.06) (Fig. 3C). Therefore, specimen type, control group composition, and reference miRNA type were not responsible for the heterogeneity.
Figure 2.
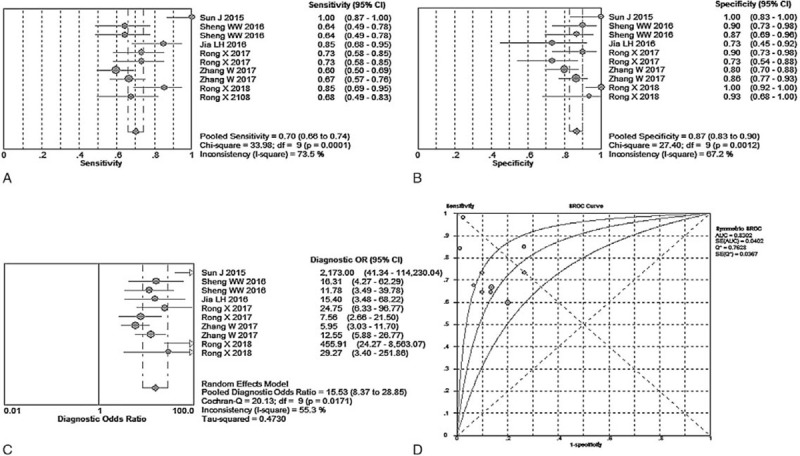
Performance of total mixed miRNAs detection for the diagnosis of Kawasaki disease. (A) Pooled sensitivity. (B) Pooled specificity. (C) Overall DOR. (D) The summary receiver operating characteristic curves value for all datasets.
Figure 3.
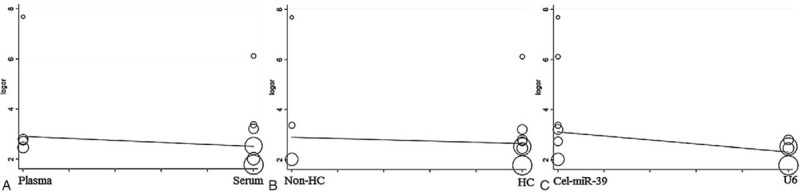
The meta-regression of the enrolled studies. (A) For the specimen types. (B) For the composition of the control group. (C) For the types of reference microRNA.
3.4. Sensitivity analysis and subgroup analysis
We systematically and qualitatively analyzed the sensitivity of the included studies to determine the impact of individual trials on TmiRs results, using STATA 15.1 for meta-analysis random-effects estimates. Finally, we did not detect any significant impact from every single research and confirmed the TmiRs results (Fig. 4). Meanwhile, Meta-disc 1.4 (Ramón y Cajal Hospital, Madrid, Spain) was used to detect whether there was a threshold effect in the report. Spearman correlation coefficient was –0.255 and P = .478, indicating there was no threshold effect related to heterogeneity. Then, we performed 2 subgroups analysis according to the specimen type, and the composition of the control group. The results were illustrated in Table 3. Subgroup analysis showed that the SROC of the plasma group (0.8890) was more significantly higher than that of the serum group (0.7204), and that of the non-HC group (0.9622) was significantly higher than that of the HC group (0.8096).
Figure 4.
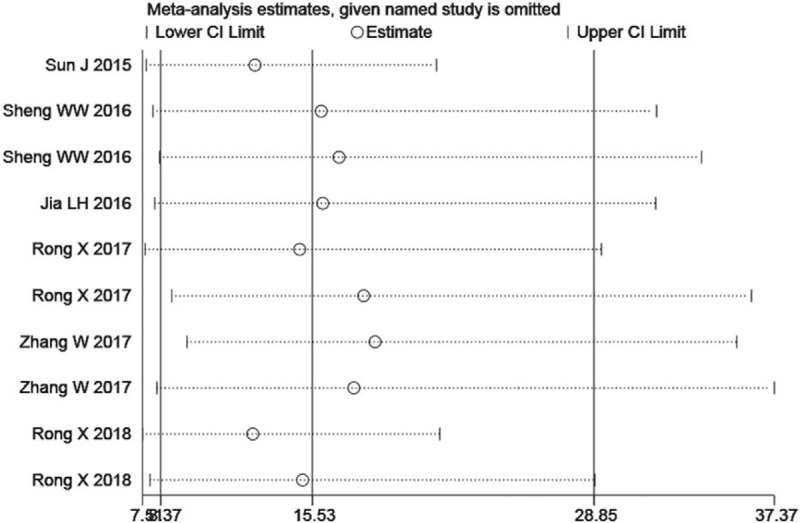
Sensitivity analysis of the individual trials on the results total mixed miRNAs.
Table 3.
Subgroup analysis results of all included studies.
| Sensitivity (95% CI) | Specificity (95% CI) | DOR (95% CI) | SROC (AUC ± SE) | |
| TmiRs | 0.70 (0.66–0.74) | 0.87 (0.83–0.90) | 15.53 (8.37–28.85) | 0.8302 ± 0.0402 |
| P/I2 | .0001/73.5% | .0012/67.2% | .0171/55.3% | |
| Specimen type | ||||
| Plasma | 0.75 (0.67–0.82) | 0.88 (0.80–0.94) | 20.94 (6.38–68.76) | 0.8890 ± 0.0361 |
| P/I2 | .0001/86.2% | .0540/60.7% | .0976/52.4% | |
| Serum | 0.68 (0.63–0.73) | 0.86 (0.81–0.90) | 13.75 (6.43–29.42) | 0.7204 ± 0.0828 |
| P/I2 | .0846/48.4% | .0016/74.2% | .0285/60.0% | |
| Control group Composition | ||||
| HC | 0.68 (0.63–0.73) | 0.87 (0.82–0.90) | 12.63 (8.76–18.20) | 0.8096 ± 0.0576 |
| P/I2 | .0244/58.7% | .0084/65.2% | .0700/48.5% | – |
| Non-HC | 0.78 (0.69–0.86) | 0.86 (0.75–0.93) | 42.43 (3.21–560.31) | 0.9622 ± 0.0719 |
| P/I2 | .0005/87.0% | .0063/80.3% | .0142/76.5% | – |
AUC = area under the curve, CI = confidence interval, DOR = diagnostic odds ratio, HC = healthy control, SE = standard error, SROC = summary receiver operating characteristic curves value, TmiRs = total mixed miRNAs.
3.5. Publication bias
We used the Deeks’ test plots to assess the publication bias of the included reports. Each of these dots represented a report. The distance between each point and the vertical line indicated bias in each report. Meanwhile, no asymmetric distribution suggested no publication bias existed. The Deeks’ test plots in Figure 5A to E showed a degree of symmetry, suggested no potential publication bias existed in the studies included.
Figure 5.
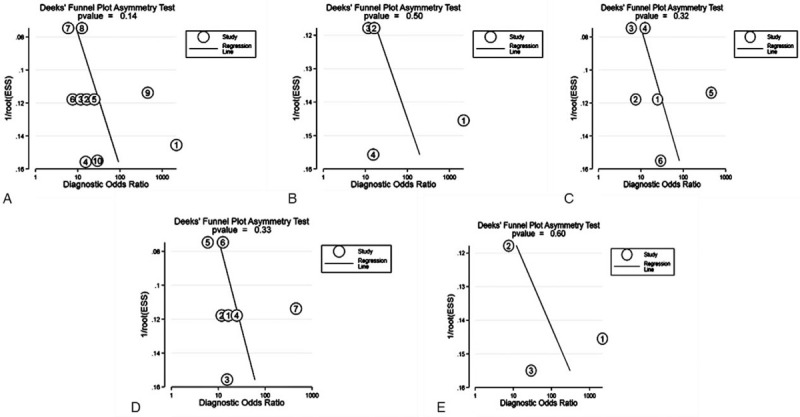
The Deeks’ test plot for the assessment of potential publication bias. (A) total mixed miRNAs pooled result. (B) Plasma pooled result. (C) Serum pooled result. (D) healthy control pooled result. (E) Non- healthy control pooled result.
4. Discussion
Since its discovery, the stability of circulating miRNAs has stimulated interest in their role as the biomarkers for the diagnosis and prognosis of various diseases, including cardiovascular diseases.[31] Meanwhile, some studies were carried out to assess whether miRNAs have sufficient capability as biomarkers of KD.[25–30,32] To our knowledge, this study is the first meta-analysis to focus on the accuracy of miRNAs in detecting KD. Since there are not enough researches to analyze specific individual miRNAs, it seems reasonable to use the results of mixed total miRNAs as the first look at miRNAs in detecting KD.
In this meta-analysis, we enrolled 6 studies[25–30] and finally found that the combined AUC of TmiRs was 0.8302 with a pooled sensitivity of 70% and a pooled specificity of 87%, indicating that miRNAs had a moderate diagnostic accuracy as a diagnostic biomarker in discriminating KD from other people. Moreover, compared to NT-proBNP, which achieved a combined AUC of 0.87 with 84% pooled sensitivity and 79% pooled specificity in a recent meta-analysis,[33] the accuracy of miRNAs was similar and should be considered as a useful biomarker for KD.
Furthermore, we intended to detect individual miRNAs in the entire miRNA library. Unfortunately, there were no single miRNAs have been used repeatedly in individual studies. Based on this, we took sensitivity analysis and subgroup analysis in the next step. Subgroup analysis indicated that compared with the healthy control group, circulating miRNAs could be considered as diagnostic biomarkers discriminating KD from other febrile diseases with relatively higher accuracy (SROC: 0.9622 ± 0.0719, and 0.8096 ± 0.0576, respectively). Also, our meta-analysis showed that plasma-based specimens had higher accuracy than serum-based samples (SROC: 0.8890 ± 0.0361, and 0.7204 ± 0.0828, respectively). Besides, human miRNAs isolated from plasma are highly stable in boiling water, able to tolerate high or low pH, and able to resist repeated freeze-thaw or prolonged room temperature incubation.[34] These reasons make plasma seem to be the right candidate for clinical specimen collection, but more research is needed in the future to clarify.
However, it is worth to note that miRNAs may have many targets, so they may only play an auxiliary role in disease diagnosis.[35] Therefore, none of the miRNAs are disease-specific. We can combine them with other indicators to improve diagnostic accuracy. Meanwhile, further experimental studies are needed to explore the cause and mechanism of miRNAs expression in KD.
This meta-analysis has several limitations. First, our study included 8 miRNAs, and all miRNAs were not repeatedly used in individual publications, so we did not analyze the same miRNA across studies. Second, due to the lack of available data from other countries except for China, which limits the cross-comparison between reports conducted by different countries or ethnicities, might produce unconvincing results for the included studies. Third, no included articles combined miRNAs with other laboratory tests, such as C reactive protein, erythrocyte sedimentation rate, and NT-proBNP to identify the diagnostic accuracy of KD, which could provide a better method for the detection of KD.
In conclusion, this is the first meta-analysis to demonstrate that circulating miRNAs may be considered as potential novel biomarkers for the detection of KD, particularly to distinguish KD from other febrile diseases. Besides, more studies are needed in the future to clarify the association between KD and miRNAs. Furthermore, a combination of miRNAs and other laboratory tests needs to be done to launch the application of miRNAs as biomarkers for KD detection in the clinic.
Author contributions
Conceptualization: Xiaolan Zheng, Yifei Li.
Data curation: Gang Wu, Peng Yue, Xiaolan Zheng.
Formal analysis: Xiaolan Zheng, Peng Yue, Fan Ma, Yi Zhang.
Investigation: Yifei Li, Gang Wu, Yi Zhang, Xiaolan Zheng.
Methodology: Yi Zhang, Fan Ma.
Project administration: Yifei Li.
Software: Gang Wu, Fan Ma.
Supervision: Yifei Li, Xiaolan Zheng.
Validation: Xiaolan Zheng, Yifei Li.
Visualization: Xiaolan Zheng, Yifei Li.
Writing – original draft: Xiaolan Zheng.
Writing – review & editing: Yifei Li.
Glossary
Abbreviations: AUC = area under the curve, DOR = diagnostic odds ratio, HC = healthy controls, KD = Kawasaki disease, miRNAs = microRNAs, NT-proBNP = nitrogen-terminal B-type natriuretic peptide, SROC = summary receiver operating characteristic curves value, TmiRs = total mixed miRNAs.
References
- [1].Newburger JW, Takahashi M, Gerber MA, et al. Diagnosis, treatment, and long-term management of Kawasaki disease: a statement for health professionals from the committee on rheumatic fever, endocarditis and kawasaki disease, council on cardiovascular disease in the young, American Heart Association. Circulation 2004;110:2747–71. [DOI] [PubMed] [Google Scholar]
- [2].Dietz SM, van Stijn D, Burgner D, et al. Dissecting Kawasaki disease: a state-of-the-art review. Eur J Pediatr 2017;176:995–1009. [DOI] [PMC free article] [PubMed] [Google Scholar]
- [3].Singh S, Vignesh P, Burgner D. The epidemiology of Kawasaki disease: a global update. Arch Dis Child 2015;100:1084–8. [DOI] [PubMed] [Google Scholar]
- [4].Singh S, Bhattad S, Gupta A, et al. Mortality in children with Kawasaki disease: 20 years of experience from a tertiary care centre in North India. Clin Exp Rheumatol 2016;34:S129–33. [PubMed] [Google Scholar]
- [5].Takahashi K, Oharaseki T, Yokouchi Y. Histopathological aspects of cardiovascular lesions in Kawasaki disease. Int J Rheum Dis 2018;21:31–5. [DOI] [PubMed] [Google Scholar]
- [6].Balasubramanian S, Krishna MR, Dhanalakshmi K, et al. Factors associated with delay in diagnosis of Kawasaki disease in India. Indian Pediatr 2012;49:663–5. [DOI] [PubMed] [Google Scholar]
- [7].JCS Joint Working Group. Guidelines for diagnosis and management of cardiovascular sequelae in Kawasaki disease (JCS 2008)--digest version. Circ J 2010;74:1989–2020. [DOI] [PubMed] [Google Scholar]
- [8].Dionne A, Dahdah N. A Decade of NT-proBNP in Acute Kawasaki Disease, from Physiological Response to Clinical Relevance. Children (Basel) 2018;5:141. [DOI] [PMC free article] [PubMed] [Google Scholar]
- [9].Singh S, Jindal AK, Pilania RK. Diagnosis of Kawasaki disease. Int J Rheum Dis 2018;21:36–44. [DOI] [PMC free article] [PubMed] [Google Scholar]
- [10].Valinezhad Orang A, Safaralizadeh R, Kazemzadeh-Bavili M. Mechanisms of miRNA-Mediated Gene Regulation from Common Downregulation to mRNA-Specific Upregulation. Int J Genomics 2014;2014:970607. [DOI] [PMC free article] [PubMed] [Google Scholar]
- [11].Kosaka N, Iguchi H, Ochiya T. Circulating microRNA in body fluid: a new potential biomarker for cancer diagnosis and prognosis. Cancer Sci 2010;101:2087–92. [DOI] [PMC free article] [PubMed] [Google Scholar]
- [12].Yan H, Ma F, Zhang Y, et al. MiRNAs as biomarkers for diagnosis of heart failure: a systematic review and meta-analysis. Medicine 2017;96:e6825. [DOI] [PMC free article] [PubMed] [Google Scholar]
- [13].Jin F, Hu H, Xu M, et al. Serum microRNA profiles serve as novel biomarkers for autoimmune diseases. Front Immunol 2018;9:2381. [DOI] [PMC free article] [PubMed] [Google Scholar]
- [14].Kim JS, Pak K, Goh TS, et al. Prognostic value of microRNAs in coronary artery diseases: a meta-analysis. Yonsei Med J 2018;59:495–500. [DOI] [PMC free article] [PubMed] [Google Scholar]
- [15].Chen Y, Ding YY, Ren Y, et al. Identification of differentially expressed microRNAs in acute Kawasaki disease. Mol Med Rep 2018;17:932–8. [DOI] [PMC free article] [PubMed] [Google Scholar]
- [16].Sun LL, Li WD, Lei FR, et al. The regulatory role of microRNAs in angiogenesis-related diseases. J Cell Mol Med 2018;22:4568–87. [DOI] [PMC free article] [PubMed] [Google Scholar]
- [17].Deeks JJ. Systematic reviews in health care: systematic reviews of evaluations of diagnostic and screening tests. BMJ (Clinical research ed) 2001;323:157–62. [DOI] [PMC free article] [PubMed] [Google Scholar]
- [18].Moher D, Liberati A, Tetzlaff J, et al. Preferred reporting items for systematic reviews and meta-analyses: the PRISMA statement. PLoS Med 2009;6:e1000097. [DOI] [PMC free article] [PubMed] [Google Scholar]
- [19].Whiting P, Rutjes AW, Reitsma JB, et al. The development of QUADAS: a tool for the quality assessment of studies of diagnostic accuracy included in systematic reviews. BMC Med Res Methodol 2003;3:25. [DOI] [PMC free article] [PubMed] [Google Scholar]
- [20].Glas AS, Lijmer JG, Prins MH, et al. The diagnostic odds ratio: a single indicator of test performance. J Clin Epidemiol 2003;56:1129–35. [DOI] [PubMed] [Google Scholar]
- [21].Moses LE, Shapiro D, Littenberg B. Combining independent studies of a diagnostic test into a summary ROC curve: data-analytic approaches and some additional considerations. Stat Med 1993;12:1293–316. [DOI] [PubMed] [Google Scholar]
- [22].Deeks JJ, Macaskill P, Irwig L. The performance of tests of publication bias and other sample size effects in systematic reviews of diagnostic test accuracy was assessed. J Clin Epidemiol 2005;58:882–93. [DOI] [PubMed] [Google Scholar]
- [23].Higgins JP, Thompson SG. Quantifying heterogeneity in a meta-analysis. Stat Med 2002;21:1539–58. [DOI] [PubMed] [Google Scholar]
- [24].Zamora J, Abraira V, Muriel A, et al. Meta-DiSc: a software for meta-analysis of test accuracy data. BMC Med Res Methodol 2006;6:31. [DOI] [PMC free article] [PubMed] [Google Scholar]
- [25].Sun J, Wu FQ, Lu J, et al. Role of microRNA-22 and microRNA-1825 in the diagnosis and differential diagnosis of juvenile systemic lupus erythematou. Chin J Appl Clin Pediatr 2015;30:667–71. [Google Scholar]
- [26].Sheng WW, Gao CB, Guan HL. Expression and its significance of microRNA-145 and microRNA-143 in plasma in children with Kawasaki disease. J Mod Lab Med 2016;31:34–41. [Google Scholar]
- [27].Jia LH, Pan LL, Lu JC, et al. Expression of miR-21 in patients with the acute phase of Kawasaki disease and its clinical significance. J Wenzhou Med Univ 2016;46:254–7. (Article in Chinese). [Google Scholar]
- [28].Rong X, Jia L, Hong L, et al. Serum miR-92a-3p as a new potential biomarker for diagnosis of Kawasaki disease with coronary artery lesions. J Cardiovasc Transl Res 2017;10:1–8. [DOI] [PubMed] [Google Scholar]
- [29].Zhang W, Wang Y, Zeng Y, et al. Serum miR-200c and miR-371-5p as the useful diagnostic biomarkers and therapeutic targets in Kawasaki disease. Biomed Res Int 2017;2017:8257862. [DOI] [PMC free article] [PubMed] [Google Scholar]
- [30].Rong X, Ge D, Shen D, et al. miR-27b suppresses endothelial cell proliferation and migration by targeting Smad7 in Kawasaki disease. Cell Physiol Biochem 2018;48:1804–14. [DOI] [PubMed] [Google Scholar]
- [31].Zhou SS, Jin JP, Wang JQ, et al. miRNAS in cardiovascular diseases: potential biomarkers, therapeutic targets and challenges. Acta Pharmacol Sin 2018;39:1073–84. [DOI] [PMC free article] [PubMed] [Google Scholar]
- [32].Rowley AH, Pink AJ, Reindel R, et al. A study of cardiovascular miRNA biomarkers for Kawasaki disease. Pediatr Infect Dis J 2014;33:1296–9. [DOI] [PMC free article] [PubMed] [Google Scholar]
- [33].Yu J, Li HH, Dong L. Meta-analysis: diagnostic value of N-Terminal pro-brain natriuretic peptide for Kawasaki disease. Clin Lab 2016;62:1903–10. [DOI] [PubMed] [Google Scholar]
- [34].Turchinovich A, Weiz L, Langheinz A, et al. Characterization of extracellular circulating microRNA. Nucleic Acids Res 2011;39:7223–33. [DOI] [PMC free article] [PubMed] [Google Scholar]
- [35].Lewis BP, Shih IH, Jones-Rhoades MW, et al. Prediction of mammalian microRNA targets. Cell 2003;115:787–98. [DOI] [PubMed] [Google Scholar]