

Abstract
Background:
Brain-derived neurotrophic factor (BDNF) rs6265 polymorphism has been previously suggested to be associated with the susceptibility of type 2 diabetes mellitus (T2DM), but results remained controversial. We aim to provide a more reliable conclusion about the association between BDNF rs6265 polymorphism and T2DM risk by using a meta-analysis.
Methods:
Electronic databases such as Pubmed, Embase, CNKI, and Wanfang were searched for relevant articles published up to May 06, 2020. Pooled odds ratios (ORs) with 95% confidence intervals (CIs) were used to evaluate the strength of the associations. Subgroup analysis was carried out according to source of controls and quality score of included studies. A trial sequential analysis was conducted to reduce the risk of type I error.
Results:
A total of 8 case-control studies (7 conducted in China) with 1576 T2DM patients and 1866 controls were included. Overall, our results indicated no significant association between BDNF rs6265 polymorphism and T2DM risk with the random-effects model (allele model: pooled OR = 1.14, 95% CI = 0.79–1.65, homozygote model: pooled OR = 1.13, 95% CI = 0.57–2.21, heterozygote model: pooled OR = 1.07, 95% CI = 0.78–1.48, dominant model: pooled OR = 1.14, 95% CI = 0.74–1.75 and recessive model: pooled OR = 1.10, 95% CI = 0.67–1.80). Subgroup analysis by source of controls and quality score also showed no significant association between BDNF rs6265 polymorphism and T2DM risk. Trial sequential analysis results confirmed the null association and further studies were unnecessary.
Conclusion:
This meta-analysis study indicated that no significant association between BDNF rs6265 polymorphism and T2DM risk.
Keywords: brain-derived neurotrophic factor, meta-analysis, polymorphism, type 2 diabetes mellitus
1. Introduction
Type 2 diabetes mellitus (T2DM) is an important cause of many serious life-threatening health problems, such as cancers, cardiovascular diseases, and all-cause mortality,[1] resulting in higher medical care costs and reduced quality of life.[2,3] About 1 in 11 adults have diabetes mellitus, and 90% of them have T2DM.[4] The International Diabetes Federation estimated that there were 451 million adults with diabetes worldwide in 2017, and these figures were expected to increase to 693 million by 2045.[5] The etiology of T2DM is known to be complex, and the determinants of T2DM consist of a matrix of genetic, epigenetic, lifestyle factors, polypharmacy use, cardiometabolic risk factors (such as arterial hypertension, obesity or the metabolic syndrome), oxidative stress, inflammation, etc. [4,6–8] The main drivers of the global epidemic of T2DM included the rise in obesity, a sedentary lifestyle, and energy-dense diets.[4] Genetic loci related with obesity has been identified which may associate with T2DM risk.[4]
Brain-derived neurotrophic factor (BDNF) is a protein family abundantly expressed within the brain that plays an important role in maturation, synaptic connection, neuronal repair, and plasticity in the central nervous system.[9] BDNF is highly expressed in the hypothalamus, where this neurotrophic factor has an important role in regulating metabolism of appetite.[9] It has been established that hypothalamic reduction of BDNF modulated energy homeostasis affecting food intake and promoting an anorectic signal,[10] thereby influencing energy balance and weight that increased T2DM risk. In addition, BDNF produced by monocytes was also related with inflammatory cytokines such as high-sensitivity c-reactive protein, playing a possible role in the progression of T2DM.[11]
Genetic variations in BDNF have also been shown to affect the function of BDNF protein, and rs6265 polymorphism is the most extensively studied one. It is a nonsynonymous SNP resulting in a valine to methionine substitution at codon 66 in the BDNF prodomain, which is thought to interfere with intracellular trafficking and activity-dependent secretion of the BDNF protein.[2,5] To date, a number of studies had been performed to assess the association between BDNF rs6265 polymorphism and susceptibility to T2DM.[12–19] However, the results remained to be inconsistent and ambiguous. As the statistical power of an individual study may be too weak to detect association between rs6265 polymorphism and T2DM risk, a meta-analysis pooling data from all published studies may be more convincing to determine whether or not BDNF rs6265 polymorphism is a risk factor for the development of T2DM.
Hence, we aimed to conduct a meta-analysis with all available case-control studies to obtain more precise evidence for the association between BDNF rs6265 polymorphism and T2DM risk.
2. Materials and methods
This meta-analysis was conducted according to the Preferred Reporting Items for Systematic Reviews and Meta-analyses (PRISMA) guidelines.[20]
2.1. Literature search
Eligible studies investigating the association between BDNF rs6265 polymorphism and T2DM risk were searched from the public electronic databases, including PubMed, Embase, CNKI (https://www.cnki.net/), and Wanfang (http://www.wanfangdata.com.cn/index.html) with searching up to May 6, 2020, but no lower date limit was used. The following terms were utilized to identify potential related articles: (Polymorphism, Genetic[mesh] or polymorphism∗ or variant∗ or genotype∗) and (BDNF or “brain derived neurotrophic factor”) and (Diabetes Mellitus[MESH] or diabetes), without any restriction of publication language. Concurrently, the reference lists of included articles and reviews were manually searched to find additional relevant studies. Related articles generated by PubMed and Google scholar (https://scholar.google.com/) were also searched.
2.2. Selection criteria
After removing the duplicates by Endnote, 2 authors (XX and CD) independently reviewed titles and abstracts, as well as the full-text of the articles identified to determine their eligibility based on selection criteria. For inclusion in this meta-analysis, the eligible articles should meet the following criteria:
-
(1)
case-control study design;
-
(2)
evaluating the BDNF rs6265 polymorphism;
-
(3)
the outcome was T2DM; and
-
(4)
providing the number of individual genotypes for BDNF rs6265 polymorphism in T2DM cases and controls, respectively.
The exclusion criteria were as follows:
-
(1)
outcomes were other types of diabetes, such as type 1 diabetes and gestational diabetes;
-
(2)
abstract, comment, review, and editorial; and
-
(3)
no original data of the genotype frequencies for both cases and controls.
If data were duplicated or shared in more than one article, only the most recent or complete article was included. No ethical review is needed in this study.
2.3. Data extraction and quality assessment
Data from all eligible studies were extracted by the same 2 authors independently according to the selection criteria listed above. The following data were collected from each study using a standardized form: first author's name, year of publication, country in which the study was conducted, study period, sample size, mean age, and proportion of males for cases and controls, genotyping method, genotype frequency of the BDNF rs6265 polymorphism of cases and controls, matching variables between cases and controls (if available). The reviewers resolved disagreements through discussion. For studies without enough information, corresponding authors were contacted for further information by E-mail, if possible.
The quality of each study was assessed using the Newcastle–Ottawa Scale.[21] Newcastle–Ottawa Scale has been developed for both cohort and case-control studies. For case-control studies, it contains three dimensions: selection (4 scores), comparability (2 scores), and exposure (3 scores). Accumulated score ranges from 0 to 9 points, with a score ≥7 indicating higher quality.
2.4. Statistical analysis
The departure of frequencies of BDNF rs6265 polymorphism from expectation under Hardy–Weinberg equilibrium (HWE) in controls was assessed by chi-square test, which can compare actual frequencies of genotype with expected value.
Odds ratios (ORs) with their 95% confidence intervals (CIs) were used to assess the strength under each genic model in overall and stratified groups to appraise the associations between the BDNF rs6265 polymorphism and T2DM risk, and Z test was used to access the significance of pooled ORs. Five models based on the allele frequency in case group and control group were used, including allele contrast model (G vs T), homozygote comparison model (G/G vs T/T), heterozygote comparison model (G/T vs T/T), dominant comparison model (G/G+G/T vs T/T), and recessive comparison model (G/G vs G/T+T/T). The subgroups were stratified by source of control and quality of the included studies.
The between-study heterogeneity was evaluated using the inconsistency index (I2 statistic), and I2 values of 25%, 50%, and 75% were corresponding to cut-o-points for mild, moderate, and extensive heterogeneity, respectively.[22] Due to significant between-study heterogeneity existed in this study, the random-effects model (the DerSimonian and Laird method) was chosen a priori,[23] and it was also considered as more conservative than the fixed-effects model.[24]
We also did sensitivity analyses with excluding 1 article conducted in Denmark[19] and 2 studies deviated to HWE.[14,18] Influence analysis was used to assess the stability of the results, with a single study in the meta-analysis excluding each time to reflect the influence of a single study on the summary results.[25] Furthermore, Egger regression asymmetry test and Begg funnel plot were obtained to evaluate whether there was a significant publication bias.[26]
All of the statistical analyses were performed using Stata version 12.0 (Stata Corporation, College Station, TX, USA). A 2-side P value <0.05 was considered as a statistically significant finding.
2.5. Trial sequential analysis
Cumulative meta-analyses are prone to type I and type II errors because of repeated testing of significance as trial data accumulate. Trial sequential analysis (TSA) was conducted to avoid type I error rate (α) and estimate the required sample information.[27] The required information size (RIS) was conducted by anticipating a 30% relative risk reduction for efficacy outcome, an overall 5% of a type I error, and 20% of the type II error (a statistical test power of 80%).[27] TSA was used to calculate the required number of participants (RIS), and constructed a sequential monitoring boundary to determine whether a trial could be terminated early. A cumulative Z-curve was constructed using a random-effects model, and if it crossed the trial sequential monitoring boundary suggested that the statistical evidence was conclusive. We used TSA software version 0.9 (beta) (Copenhagen Trial Unit, Copenhagen, Denmark) to conduct these analyses.
3. Results
3.1. Study selection process and characteristics
Overall, 402 articles were identified after the electronic and manual search (Fig. 1). After excluding duplicates (n = 47) and unrelated articles (n = 329), 26 studies were eligible for further full-text review. Among these articles, 16 articles were excluded due to:
Figure 1.
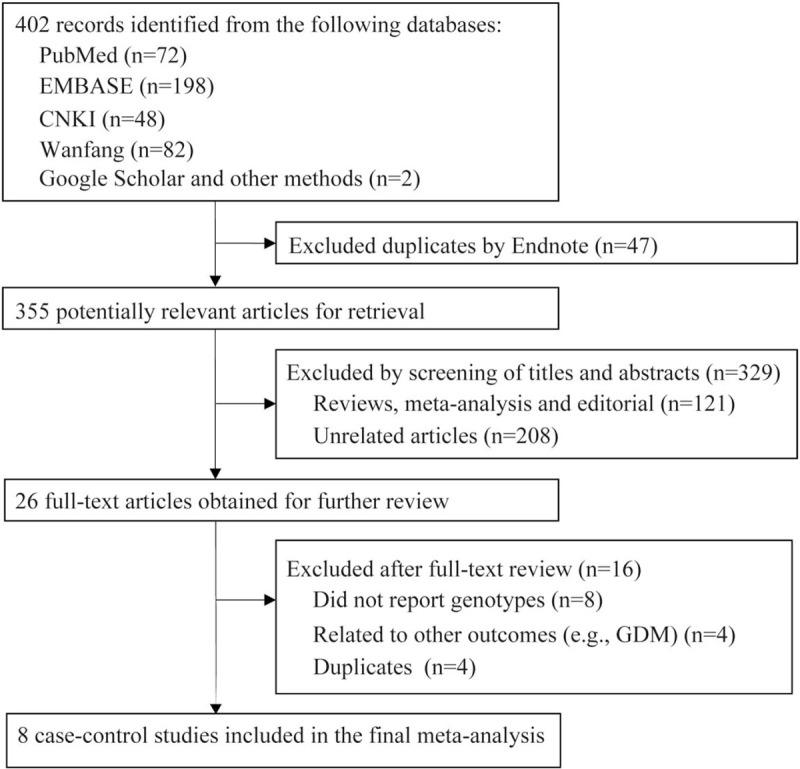
Flow chart of study selection.
-
(1)
lack of information for genotype (n = 8);
-
(2)
related to other outcomes, such as GDM (n = 4); and
-
(3)
duplicate articles (n = 4).
Finally, 8 articles with a total of 1576 T2DM cases and 1866 controls were included in the present meta-analysis.
Table 1 presents the main characteristics of these studies. These studies were published between 2007 and 2019. Except for 1 study conducted in Denmark,[19] all studies were conducted among Chinese. The sample size ranged from 233 to 840. All eligible studies had a moderate or high quality, with an overall score ranging from 5 to 8. Table 2 presents the genotype distributions for the BDNF rs6265 polymorphism of each included study. The genotype distribution of the control group was deviated with HWE in 2 studies.[14,18]
Table 1.
The main features of eligible studies.
| T2DM group | Control group | |||||||||||
| First author ref. | Year | Country | Sample size | Age, yr | Men (%) | Sample size | Age, yr | Men (%) | Control source | Genotyping method | Matching factors | NOS quality score |
| Chen Y[12] | 2019 | China | 418 | 56.78 ± 13. 8 | 51.9 | 422 | 56.1 ± 11.6 | 55.0 | Population | Fluorescence-based real-time PCR | — | 6 |
| Zhen YF[13] | 2018 | China | 311 | 54.93 ± 10.73 | 43.7 | 346 | 53.43 ± 9.86 | 39.9 | Population | PCR-RFLP | Sex, age, and education | 8 |
| Jin Y[14] | 2015 | China | 72 | 60.4 ± 4.2 | 32.6 | 208 | 63.5 ± 3.2 | 55.8 | Hospital | PCR-RFLP | — | 5 |
| Xu HY[15] | 2014 | China | 160 | 55.4 ± 3.5 | 50.0 | 80 | 55.1 ± 3.3 | 51.2 | Hospital | PCR-RFLP | — | 6 |
| Zhou JX[16] | 2014 | China | 296 | 53.2 ± 5.5 | 50.0 | 70 | 55.2 ± 6.5 | 48.6 | Hospital | PCR-RFLP | Age, gender | 7 |
| Cao Y[17] | 2011 | China | 246 | 48.95 ± 10.71 | 46.3 | 186 | 38.2 ± 15.86 | 47.3 | Population | Illumina GoldenGate | — | 7 |
| Zhou DH[18] | 2010 | China | 144 | 52.54 ± 11.03 | 56.9 | 120 | 51.57 ± 9.91 | 59.2 | Population | PCR-RFLP | — | 6 |
| Krabbe KS[19] | 2007 | Denmark | 96 | 58.2 ± 1.5 | 75.0 | 137 | 60.3 ± 2.6 | 67.2 | Population | Fluorescence-based real-time PCR | — | 7 |
PCR = polymerase chain reaction, PCR–RFLP = PCR–restriction fragment length polymorphism.
Table 2.
Brain-derived neurotropic factor rs6265 genotype distributions among T2DM cases and controls of the included studies.
| Cases | Controls | ||||||||
| First author | Year | GG | GA | AA | GG | GA | AA | MAF | P (HWE)∗ |
| Chen Y[12] | 2019 | 172 | 213 | 33 | 176 | 202 | 44 | 34.4 | .209 |
| Zhen YF[13] | 2018 | 76 | 165 | 70 | 88 | 183 | 75 | 48.1 | .27 |
| Jin Y[14] | 2015 | 16 | 19 | 37 | 127 | 45 | 36 | 28.1 | <.001 |
| Xu HY[15] | 2014 | 53 | 68 | 39 | 30 | 35 | 15 | 40.6 | .405 |
| Zhou JX[16] | 2014 | 26 | 33 | 11 | 103 | 137 | 56 | 42.1 | .386 |
| Cao Y[17] | 2011 | 106 | 179 | 73 | 24 | 98 | 64 | 60.8 | .153 |
| Zhou DH[18] | 2010 | 22 | 44 | 25 | 59 | 82 | 50 | 47.6 | .054 |
| Krabbe KS[19] | 2007 | 61 | 30 | 5 | 88 | 42 | 7 | 20.4 | .502 |
HWE = Hardy-Weinberg equilibrium, MAF = minor allele frequency.
P value of chi-square test for HWE among controls.
3.2. Quantitative data synthesis
Table 3 and Figure 2 show the quantitative pooled results of the meta-analysis and heterogeneity test. We did not find any statistically significant association between the BDNF rs6265 polymorphism and the risk of T2DM under all genetic models, including the allele model (OR:1.14, 95% CI: 0.79–1.65; P = .496), the homozygote model (OR:1.13, 95% CI: 0.57–2.21; P = .773), and the heterozygote model (OR:1.07, 95% CI: 0.78–1.48; P = .677), the dominant model (OR:1.14, 95% CI: 0.74–1.75; P = .559), and the recessive model (OR:1.10, 95% CI: 0.67–1.80; P = .706), respectively. Between-studies heterogeneity was significant under all models with I2 ranging from 70.1% to 91.4%.
Table 3.
Total and stratified analyses of brain-derived neurotropic factor rs6265 polymorphism and T2DM risk.
| Allelic comparison | Homozygote comparison | Heterozygote comparison | Dominant genetic model | Recessive genetic model | |||||||||||||
| Variables | N∗ | Cases/Controls | OR (95%CI) | P † | I 2 | OR (95%CI) | P † | I 2 | OR (95%CI) | P † | I 2 | OR (95%CI) | P † | I 2 | OR (95%CI) | P † | I 2 |
| Total | 8 | 1576/1866 | 1.14 (0.79, 1.65) | .496 | 91.4 | 1.13 (0.57, 2.21) | .773 | 88.6 | 1.07 (0.78, 1.48) | .677 | 70.1 | 1.14 (0.74, 1.75) | .559 | 85.5 | 1.10 (0.67, 1.80) | 0.706 | 84.4 |
| Asian only | 7 | 1480/1729 | 1.16 (0.78, 1.74) | .465 | 92.6 | 1.14 (0.55, 2.36) | .732 | 90.2 | 1.08 (0.75, 1.56) | .675 | 74.4 | 1.16 (0.71, 1.88) | .561 | 87.6 | 1.11 (0.65, 1.88) | 0.704 | 86.7 |
| HWE only | 6 | 1413/1467 | 0.90 (0.71, 1.15) | .414 | 75.7 | 0.77 (0.46, 1.3) | .329 | 75.2 | 0.90 (0.68, 1.20) | .487 | 57.1 | 0.87 (0.63, 1.22) | .423 | 71.1 | 0.83 (0.59, 1.15) | 0.259 | 54.5 |
| Control source | |||||||||||||||||
| Population | 5 | 1274/1282 | 0.92 (0.64, 1.31) | .635 | 79.8 | 0.81 (0.38, 1.72) | .586 | 80.1 | 0.9 (0.58, 1.4) | .637 | 66.3 | 0.88 (0.53, 1.46) | .617 | 77.4 | 0.85 (0.55, 1.33) | 0.480 | 58.5 |
| Hospital | 3 | 302/584 | 1.63 (0.78, 3.4) | .197 | 96.0 | 1.84 (0.54, 6.31) | .331 | 93.7 | 1.38 (0.84, 2.28) | .207 | 75.9 | 1.71 (0.78, 3.77) | .181 | 91.9 | 1.55 (0.57, 4.22) | 0.395 | 92.7 |
| Score | |||||||||||||||||
| <7 | 4 | 741/901 | 1.01 (0.88, 1.14) | .946 | 0.0 | 0.97 (0.73, 1.29) | .824 | 0.0 | 1.06 (0.87, 1.29) | .595 | 0.0 | 1.04 (0.86, 1.25) | .712 | 0.0 | 0.96 (0.75, 1.23) | 0.728 | 0.0 |
| ≥7 | 4 | 835/965 | 1.31 (0.52, 3.27) | .564 | 96.2 | 1.30 (0.26, 6.52) | .747 | 94.9 | 1.16 (0.51, 2.68) | .721 | 87.0 | 1.28 (0.43, 3.84) | .661 | 93.7 | 1.28 (0.42, 3.93) | 0.665 | 92.8 |
| Sensitivity analysis | |||||||||||||||||
| Maximal | 7 | −/− | 1.28 (0.90, 1.82) | .169 | 88.6 | 1.41 (0.77, 2.55) | .263 | 82.3 | 1.19 (0.94, 1.50) | .149 | 36.3 | 1.33 (0.92, 1.92) | .129 | 77.3 | 1.26 (0.77, 2.05) | 0.361 | 79.6 |
| Minimal | 7 | −/− | 0.94 (0.75, 1.17) | .554 | 73.5 | 0.83 (0.52, 1.34) | .449 | 73.4 | 0.95 (0.73, 1.25) | .723 | 55.1 | 0.93 (0.68, 1.26) | .624 | 68.9 | 0.85 (0.64, 1.14) | 0.290 | 49.6 |
CI = confidence interval, OR = odds ratio.
Number of comparisons.
P-value of Z-test for significant test.
Figure 2.
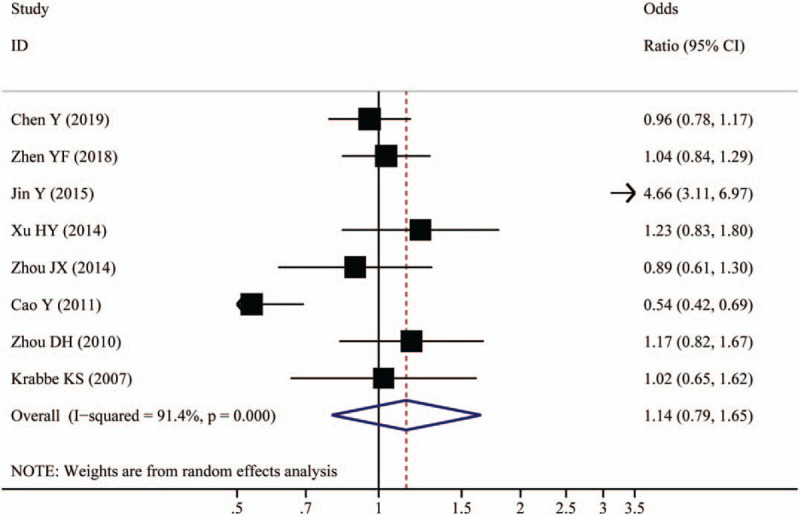
Forest plot of associations between BDNF rs6265 polymorphism and the risk of type 2 diabetes (allelic comparison).
Subgroup analyses according to source of control and quality score, sensitivity analyses with excluding 1 article conducted in Denmark [19] and 2 studies deviated to HWE,[14,18] as well as influence analyses, all did not show evidence of significant findings (Table 2).
The Egger regression asymmetry test and Begg funnel plot were applied to evaluate publication bias. The funnel plot appeared symmetrical (Fig. 3), and the P values of Egger test ranged from .286 to .609. These results did not indicate a potential for publication bias.
Figure 3.
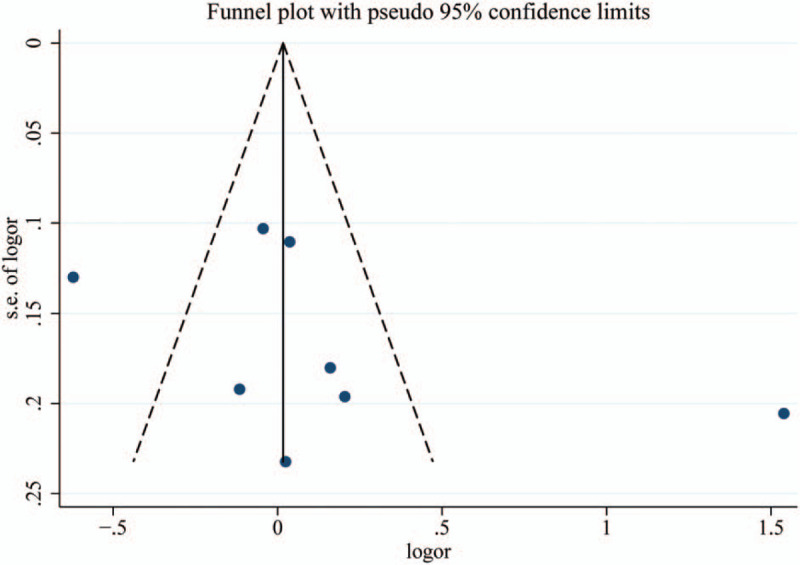
Funnel plot of associations between BDNF rs6265 polymorphism and the risk of type 2 diabetes (allelic comparison).
3.3. Trial sequential analysis results
When we anticipated a 30% relative risk reduction to estimate the maximal sample size (Fig. 4), the effect-size is 5988 participants. As shown in Figure 4, the cumulative Z-curve exceeded the information size (RIS line), and the total number of cases and controls were more than the RIS. However, the cumulative Z-curve did not cross the trial sequential monitoring boundary. Therefore, our nonsignificant results were established and further relevant studies were unnecessary.
Figure 4.
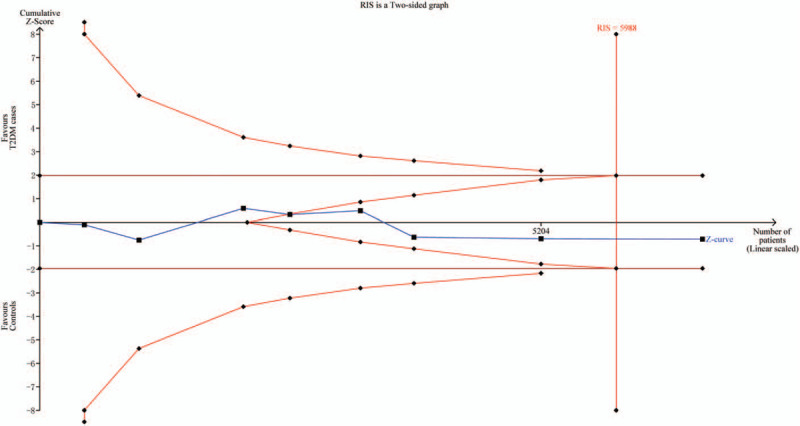
Trial sequential analysis of associations between BDNF rs6265 polymorphism and the risk of type 2 diabetes (allelic comparison).
4. Discussion
This is the first meta-analysis to summarize the current evidence on the effect of BDNF rs6265 polymorphism on the development of T2DM. Our meta-analysis indicated that null associations between BDNF rs6265 polymorphism and T2DM risk under all genetic models and the TSA analysis further confirmed this finding.
The BDNF gene is located on chromosome 11, band p13.[3] It encodes BDNF protein, a neurotrophin that plays a role in the proliferation, differentiation, and fate of neuronal cells, thus regulating plasticity and connectivity in the central nervous system.[3] BDNF has been suggested to be associated with many types of diseases such as depression and anxiety, bipolar disorder,[10] Alzheimer disease,[9] heart diseases,[4] chronic pain,[28] and T2DM.[29] BDNF rs6265 polymorphism is a common single nucleotide polymorphism in BDNF gene (c.196G>A, dbSNP: rs6265) has been identified to cause an amino-acid substitution of valine to methionine at amino-acid residue 66.[2,5] This polymorphism could alter intracellular trafficking and packaging of pro-BDNF, thus regulating secretion of the mature peptide.[2,5] The Met allele of the BDNF rs6265 polymorphism has been suggested to be associated with increased BDNF serum concentrations.[1]
Increasing evidence have been suggested the biologically plausible between BDNF protein or rs6265 polymorphism and T2DM risk. T2DM is significantly related with obesity. In the hypothalamus, this neurotrophic factor has major regulatory role in the control of appetite and metabolism, resulting in inhibition of food intake and increases energy expenditure.[9] Mice that were heterozygous for targeted disruption of BDNF was associated with a 50% reduction in BDNF expression in the hypothalamus, and consumed 47% more food than wild-type mice and are obese.[7] Chronic intracerebroventricular infusion of BDNF treatment attenuated weight gain in rats.[30] Plasma levels of BDNF decreased in humans with type 2 diabetes and obesity and plasma BDNF was inversely associated with fasting plasma glucose.[19] In addition, BDNF expression was associated with chronic inflammatory state, altered circulating inflammatory cytokines, enhanced immune system, and elevated compounds released by platelets, which was also an important process for development of T2DM.[29,31,32]
Many studies have investigated the involvement of BDNF rs6265 polymorphism in the etiology of T2DM, but with conflicting results. Meta-analysis is a powerful tool that could make the conclusion more credible, especially in analyzing conflicting associations with small sample size studies.[33] Besides, TSA was performed to effectively reduce the risk of type I error and assess whether the evidence of our results was reliable.[11] In the present meta-analysis, 8 independent case-control studies, mainly conducted in China (7 studies), with 1576 T2DM patients and 1866 controls were recruited. Our results revealed that null association was detected between BDNF rs6265 polymorphism and the risk of T2DM.
Subgroup meta-analyses were performed according to different source of controls and different quality score. In the subgroup analysis by source of controls, no significant difference about such association was also observed in population-based or hospital-based controls. Besides, there were healthy population and other disease patients such as depression in the controls included.[14,15] It was likely that different individuals in the control group might have different risk of developing T2DM, thus affecting the quality of the studies. In subgroups for quality score of the included studies, there was also no association between BDNF rs6265 polymorphism and the risk of T2DM for both high- and low-quality studies. Nevertheless, we also did sensitivity analyses after excluding one study conducted in Denmark[19] and 2 studies deviated to HWE,[14,18] the null association persisted.
As we well-known, traditional meta-analysis may lead to type I and type II errors. TSA is a powerful and useful approach that could reduce the risk of type I error by estimation of RIS with an adjusted threshold for statistical significance. Just like interim analyses in a single trial, TSA decides whether additional trials were needed to evaluate for evidence.[11] If the cumulative Z-curve crosses the monitoring boundary or the RIS, it shows firm evidence for such study. Otherwise, additional studies are further needed to reach a consistent conclusion.[27] As shown in our study, the cumulative Z-curve did not cross the trial sequential monitoring boundary but reach the perpendicular line (RIS), which means that, though without significant findings, our results were robust and did not need further studies.
In this meta-analysis, we included comprehensive studies with the large sample size to estimate a null association between BDNF rs6265 polymorphism and T2DM risk, which was confirmed by TSA analysis. However, limitations included in the present should also be taken into consideration. Firstly, the prevalence of T2DM varied significantly among different ethnicities. The majority of studies included were investigated in Chinese population and only 1 study was conducted in Denmark.[19] Therefore, it was impossible for us to conduct ethnic sub-group analysis. Further studies with more data are required to investigate the association in other populations. Secondly, between-studies heterogeneity was significant under all comparisons (I2: 70.1% ∼91.4%). Due to limited number of included studies, we could only conduct subgroup analyses for source of control or quality score to explore the potential source of heterogeneity and no evidence indicated that heterogeneities could be affected by these factors. Influence analyses showed attenuated heterogeneity, but the association still persisted. Thirdly, we could not get useful data about the association between BDNF rs6265 polymorphism and the risk of T2DM in the GWAS database. However, some articles related to BDNF rs6265 polymorphism with T2DM risk were found [34–36] and no association was also observed among these studies. Fourthly, the sample size in each stratified analysis was relatively small, which might potentially limit the statistical power to explore the subgroup interaction. Finally, except for genetic factors, the development of T2DM is closely related to environment, diet, and occupational exposure, etc. Therefore, we need to control these variable factors to achieve more accurate results.
5. Conclusion
In conclusion, the results of this meta-analysis demonstrated that no evidence indicated the association between BDNF rs6265 polymorphism and T2DM risk. Our findings suggested that BDNF rs6265 polymorphism did not serve as a clinical genetic biomarker of T2DM. More importantly, further studies in various ethnic groups are needed to provide more comprehensive understanding of this association.
Author contributions
Data curation: Xian-qiong Xie.
Formal analysis: Xian-qiong Xie.
Methodology: Xian-qiong Xie.
Project administration: Dong-gui Cai.
Writing – original draft: Quan Yang.
Writing – review & editing: Quan Yang, Xian-qiong Xie, Dong-gui Cai.
Glossary
Abbreviations: BDNF = brain-derived neurotrophic factor, CIs = confidence intervals, HWE = Hardy–Weinberg equilibrium, ORs = odds ratios, PRISMA = Preferred Reporting Items for Systematic Reviews and Meta-analyses, RIS = required information size, T2DM = type 2 diabetes mellitus, TSA = trial sequential analysis.
References
- [1].Gad MM, Gaman MA, Saad AM, et al. Temporal trends of incidence and mortality in Asian-Americans with pancreatic adenocarcinoma: an epidemiological study. Ann Gastroenterol 2020;33:210–8. [DOI] [PMC free article] [PubMed] [Google Scholar]
- [2].NCD Risk Factor Collaboration (NCD-RisC). Worldwide trends in diabetes since 1980: a pooled analysis of 751 population-based studies with 4.4 million participants. Lancet. 2016; 387:1513–30. [DOI] [PMC free article] [PubMed] [Google Scholar]
- [3].Baena-Diez JM, Penafiel J, Subirana I, et al. Risk of cause-specific death in individuals with diabetes: a competing risks analysis. Diabetes Care 2016;39:1987–95. [DOI] [PubMed] [Google Scholar]
- [4].Zheng Y, Ley SH, Hu FB. Global aetiology and epidemiology of type 2 diabetes mellitus and its complications. Nat Rev Endocrinol 2018;14:88–98. [DOI] [PubMed] [Google Scholar]
- [5].Cho NH, Shaw JE, Karuranga S, et al. IDF Diabetes Atlas: global estimates of diabetes prevalence for 2017 and projections for 2045. Diabetes Res Clin Pract 2018;138:271–81. [DOI] [PubMed] [Google Scholar]
- [6].Gaman MA, Dobrica EC, Pascu EG, et al. Cardio metabolic risk factors for atrial fibrillation in type 2 diabetes mellitus: focus on hypertension, metabolic syndrome and obesity. J Mind Med Sci 2019;6:157–61. [Google Scholar]
- [7].Epingeac ME, Gaman MA, Diaconu, et al. The evaluation of oxidative stress levels in obesity. Rev Chim 2019;70:2241–4. [Google Scholar]
- [8].Dobrica EC, Gaman MA, Cozma MA, et al. Polypharmacy in type 2 diabetes mellitus: insights from an internal medicine department. Medicina (Kaunas) 2019;55:436. [DOI] [PMC free article] [PubMed] [Google Scholar]
- [9].Skibinska M, Groszewska A, Kapelski P, et al. Val66Met functional polymorphism and serum protein level of brain-derived neurotrophic factor (BDNF) in acute episode of schizophrenia and depression. Pharmacol Rep 2018;70:55–9. [DOI] [PubMed] [Google Scholar]
- [10].Lebrun B, Bariohay B, Moyse E, et al. Brain-derived neurotrophic factor (BDNF) and food intake regulation: a minireview. Auton Neurosci 2006;126-127:30–8. [DOI] [PubMed] [Google Scholar]
- [11].Miladinovic B, Mhaskar R, Hozo I, et al. Optimal information size in trial sequential analysis of time-to-event outcomes reveals potentially inconclusive results because of the risk of random error. J Clin Epidemiol 2013;66:654–9. [DOI] [PubMed] [Google Scholar]
- [12].Chen Y, Yang FX, Zhang CX. Relationship between serum brain-derived neurotrophic factor level and polymorphism of G196A and C270T and type 2 diabetes mellitus. Shan Dong Yi Yao 2019;59:46–8. [Google Scholar]
- [13].Zhen YF, Liu XY, Zhou DH, et al. Cognition, serum BDNF levels, and BDNF Val66Met polymorphism in type 2 diabetes patients and healthy controls. Oncotarget 2018;9:3653–62. [DOI] [PMC free article] [PubMed] [Google Scholar]
- [14].Jin Y, Sun XR, Huang Y, et al. Study on the correlation between plasma brain-derived neurotrophic factor and depression combined with type 2 diabetes. Shen Jing Ji Bing Yu Jing Shen Wei Sheng 2015;158–60. [Google Scholar]
- [15].Xu HY, Xu XY, Jin H, et al. The correlation between type 2 diabetes complicated with depression and brain-derived neurotrophic factor. Zhong Guo Yi Yao Zhi Nan 2013;11:520–2. [Google Scholar]
- [16].Zhou JX, Li HC, Bai XJ, et al. Functional Val66Met polymorphism of Brain-derived neurotrophic factor in type 2 diabetes with depression in Han Chinese subjects. Behav Brain Funct 2013;9:34. [DOI] [PMC free article] [PubMed] [Google Scholar]
- [17].Cao Y, Liu GJ, Cheng JL, et al. Relationship between val66met polymorphism of brain-derived neurotrophic factor gene and diabetes mellitus with depression. Jiang Su Yi Yao 2011;37:2676–9. [Google Scholar]
- [18].2010;Zhou D. Study on the association between serum BDNF level and BDNF single nucleotide polymorphism and type 2 diabetes mellitus. Hebei Medical School, Doctoral Dissertation. [Google Scholar]
- [19].Krabbe KS, Nielsen AR, Krogh-Madsen R, et al. Brain-derived neurotrophic factor (BDNF) and type 2 diabetes. Diabetologia 2007;50:431–8. [DOI] [PubMed] [Google Scholar]
- [20].Knobloch K, Yoon U, Vogt PM. Preferred reporting items for systematic reviews and meta-analyses (PRISMA) statement and publication bias. J Craniomaxillofac Surg 2011;39:91–2. [DOI] [PubMed] [Google Scholar]
- [21].Stang A. Critical evaluation of the Newcastle-Ottawa scale for the assessment of the quality of nonrandomized studies in meta-analyses. Eur J Epidemiol 2010;25:603–5. [DOI] [PubMed] [Google Scholar]
- [22].Higgins JP, Thompson SG, Deeks JJ, et al. Measuring inconsistency in meta-analyses. BMJ 2003;327:557–60. [DOI] [PMC free article] [PubMed] [Google Scholar]
- [23].DerSimonian R, Laird N. Meta-analysis in clinical trials. Control Clin Trials 1986;7:177–88. [DOI] [PubMed] [Google Scholar]
- [24].Riley RD, Higgins JP, Deeks JJ. Interpretation of random effects meta-analyses. BMJ 2011;342:d549. [DOI] [PubMed] [Google Scholar]
- [25].Tobias A. Assessing the influence of a single study in the meta-anyalysis estimate. Stata Tech Bull 1999;8:15–7. [Google Scholar]
- [26].Egger M, Davey Smith G, Schneider M, et al. Bias in meta-analysis detected by a simple, graphical test. BMJ 1997;315:629–34. [DOI] [PMC free article] [PubMed] [Google Scholar]
- [27].Wetterslev J, Thorlund K, Brok J, et al. Trial sequential analysis may establish when firm evidence is reached in cumulative meta-analysis. J Clin Epidemiol 2008;61:64–75. [DOI] [PubMed] [Google Scholar]
- [28].Fuchsberger C, Flannick J, Teslovich TM, et al. The genetic architecture of type 2 diabetes. Nature 2016;536:41–7. [DOI] [PMC free article] [PubMed] [Google Scholar]
- [29].Eyileten C, Kaplon-Cieslicka A, Mirowska-Guzel D, et al. Antidiabetic effect of brain-derived neurotrophic factor and its association with inflammation in type 2 diabetes mellitus. J Diabetes Res 2017;2017:2823671. [DOI] [PMC free article] [PubMed] [Google Scholar]
- [30].Lang UE, Hellweg R, Sander T, et al. The Met allele of the BDNF Val66Met polymorphism is associated with increased BDNF serum concentrations. Mol Psychiatry 2009;14:120–2. [DOI] [PubMed] [Google Scholar]
- [31].Kernie SG, Liebl DJ, Parada LF. BDNF regulates eating behavior and locomotor activity in mice. EMBO J 2000;19:1290–300. [DOI] [PMC free article] [PubMed] [Google Scholar]
- [32].Lapchak PA, Hefti F. BDNF and NGF treatment in lesioned rats: effects on cholinergic function and weight gain. Neuroreport 1992;3:405–8. [DOI] [PubMed] [Google Scholar]
- [33].Walker E, Hernandez AV, Kattan MW. Meta-analysis: its strengths and limitations. Cleve Clin J Med 2008;75:431–9. [DOI] [PubMed] [Google Scholar]
- [34].Ng MC, Tam CH, So WY, et al. Implication of genetic variants near NEGR1, SEC16B, TMEM18, ETV5/DGKG, GNPDA2, LIN7C/BDNF, MTCH2, BCDIN3D/FAIM2, SH2B1, FTO, MC4R, and KCTD15 with obesity and type 2 diabetes in 7705 Chinese. J Clin Endocrinol Metab 2010;95:2418–25. [DOI] [PubMed] [Google Scholar]
- [35].Takeuchi F, Yamamoto K, Katsuya T, et al. Association of genetic variants for susceptibility to obesity with type 2 diabetes in Japanese individuals. Diabetologia 2011;54:1350–9. [DOI] [PubMed] [Google Scholar]
- [36].Kong X, Zhang X, Zhao Q, et al. Obesity-related genomic loci are associated with type 2 diabetes in a Han Chinese population. PLoS One 2014;9:e104486. [DOI] [PMC free article] [PubMed] [Google Scholar]