

Abstract
Background
Apolipoprotein B (ApoB), a constituent of lipid particles, is known to increase the risk of cardiovascular diseases. However, the association between ApoB and end-stage renal disease (ESRD) remains to be resolved. Our objective was to determine whether the ApoB concentration has an association with the risk of ESRD.
Methods
Serum ApoB, ApoA1, conventional lipid parameters and lipid subfractions were analyzed in 9403 subjects. The hazard ratio (HR) for the risk of ESRD was calculated using tertiles of ApoB concentration.
Results
ESRD developed in 110 patients (1.2%) during 10 years of follow-up. Several lipid parameters were compared for their association with the risk of ESRD, of which ApoB was best and its relationship was also independent of other clinical parameters. Individuals in the second and third ApoB tertiles had a higher risk of ESRD than those in the first tertile, with HRs of 1.5 [95% confidence interval (CI) 0.89–2.61] and 2.6 (1.56–4.20), respectively. A high ApoB:ApoA1 ratio was associated with a higher risk of ESRD, but ApoA1 had no independent association. Even after adjusting the competing risk for all-cause death, high ApoB concentrations had an association with the risk of ESRD.
Conclusions
High ApoB concentration is associated with a higher risk of ESRD, despite adjustment for other lipid and clinical parameters. Accordingly, the monitoring of ApoB may be helpful for the prediction of ESRD.
Keywords: apolipoprotein A1, apolipoprotein B, cholesterol, end-stage renal disease, lipid subfraction
INTRODUCTION
Dyslipidemia is an established risk factor for atherosclerotic disease because it promotes inflammation within the intima, which can lead to cardiovascular disease, stroke and atherosclerotic kidney disease [1]. Kidney and cardiovascular diseases share the risk of dyslipidemia that exacerbates both diseases by damaging endothelial cells and inducing inflammation [2]. These interacting mechanisms also explain that dyslipidemia is associated with high all-cause and cardiovascular mortality in chronic kidney disease (CKD) [3]. Accordingly, the Kidney Disease: Improving Global Outcomes guidelines recommend the evaluation of a lipid profile, including serum low-density and high-density lipoprotein (LDL and HDL) cholesterol, and triglyceride when kidney disease is diagnosed [4]. However, a number of studies have failed to demonstrate relationships between these conventional lipid parameters and renal outcomes [5–8].
Apolipoprotein B (ApoB) is an important structural component of intermediate-density lipoprotein (IDL), very low-density lipoprotein (VLDL) and LDL particles (i.e. non-HDL cholesterols). Consistent with this, several studies have identified a relationship between ApoB concentration and the risk of atherosclerotic cardiovascular disease [9–11]. The recently published American Heart Association guidelines state that >130 mg/dL of serum ApoB corresponds to ≥150 mg/dL of LDL cholesterol, thus ApoB may have potential as a marker of high cardiovascular risk [12]. Few studies have used ApoB to predict renal outcomes, and those that did were inconclusive. However, these studies did not account for the LDL subfractions, which might act as a confounding factor in a relationship [6, 13–15]. Therefore, in this study we determined whether ApoB concentration has an association with the risk of end-stage renal disease (ESRD) after considering the effects of both conventional lipid parameters and LDL subfractions.
MATERIALS AND METHODS
Study subjects
The study protocol complied with the Declaration of Helsinki, as revised in 2013, and was approved by the institutional review board of the Seoul National University Hospital (no. H-1807-013-955). A total of 14 123 patients attending a tertiary referral center (Seoul National University Hospital) were retrospectively reviewed between 2009 and 2016. Adult patients (≥18 years of age) for whom lipid parameters and the LDL subfraction were profiled were included. We excluded patients who had previously started renal replacement therapy (hemodialysis, peritoneal dialysis or kidney transplantation; n = 591) and those with missing clinical or laboratory data (n = 4128). Consequently, data from 9403 patients were analyzed in this study. Under the terms of the ethics approval, the requirement for informed consent was waived.
Study variables
Baseline clinical parameters including age, sex, body mass index, smoking status and comorbidities such as diabetes mellitus, hypertension, coronary artery disease, stroke, peripheral vascular disease, atrial fibrillation/flutter, valvular heart disease and CKD were reviewed. The blood parameters reviewed included white blood cells, hemoglobin and serum protein, albumin and creatinine concentrations. The lipid parameters measured were total cholesterol, LDL cholesterol, HDL cholesterol, triglyceride, LDL subfractions (Lipoprint, Quantimetrix, Redondo Beach, CA, USA), and ApoB and ApoA1 (using the immunoturbidimetric method, Toshiba, Tokyo, Japan). Blood was drawn after a 12-h fast. Estimated glomerular filtration rate (eGFR) was calculated using the Chronic Kidney Disease Epidemiology Collaboration equation [16]. Random urine albumin:creatinine and protein:creatinine ratios were available for 5856 patients. The medications being used included statins, ezetimibe, fenofibrate, omega-3 fatty acids, anti-platelet drugs, anticoagulants, oral antidiabetic drugs, insulin and antihypertensive agents (angiotensin-converting enzyme inhibitors, angiotensin II receptor blockers, β-blockers, calcium channel blockers and diuretics).
Study outcomes
The primary study outcome was the event of ESRD (maintenance dialysis or kidney transplantation). Information regarding ESRD was obtained from the Korean Society of Nephrology database. All-cause mortality data were obtained from the National Database of Statistics Korea. Patients were followed up until their death or August 2018.
Statistical analysis
All statistical analyses were performed using SPSS version 25.0 (IBM, Armonk, NY, USA) and R version 3.5.1 (R Foundation, Vienna, Austria, http://cran.r-project.org). Continuous variables are expressed as means and standard deviations if normally distributed and as medians and interquartile ranges if not normally distributed. Normality was determined using the Kolmogorov–Smirnov test. Categorical variables are expressed as proportions and the chi-square test was used for their comparison, or Fisher’s exact test if this was not applicable. Student’s t-test was used to analyze continuous variables and the Mann–Whitney U test was used if the variables were not normally distributed. Analysis of variance was used when normality was satisfied for comparisons between multiple groups and the Kruskal–Wallis test was used if the data were not normally distributed. Survival curves were drawn using the Kaplan–Meier method and the log-rank test was initially used to compare survival curves between groups. The hazard ratios (HRs) for renal outcome were estimated using the Cox regression model before and after backward conditional stepwise analysis, with adjustment for multiple covariates. The competing risk analysis was conducted using a cause-specific proportional hazards model after adjustment of multiple variables (CFC package of the R software). All P-values were two sided and were considered to indicate statistically significant differences when <0.05.
RESULTS
Evaluation of baseline characteristics according to ApoB concentration
Table 1 shows the baseline characteristics of the patients. The mean age of the patients was 65 ± 11 years and 64.7% were men. When the baseline characteristics were compared using tertiles of ApoB concentration, the individuals in the higher tertiles were more likely to be obese, smokers and have high eGFR compared with the lowest tertile. Individuals in the lower tertiles were more likely to have diabetes, hypertension and coronary artery disease than those in the highest tertile. The lipid profiles differed among the three groups, with individuals in the higher tertiles having a higher concentration of total cholesterol or LDL subfractions than those in the lowest tertile.
Table 1.
Baseline characteristics of the study subjects
| Tertile of ApoB |
|||||
|---|---|---|---|---|---|
| Variables | Total | First tertile | Second tertile | Third tertile | P-value |
| (n = 9403) | (n = 3135) | (n = 3134) | (n = 3134) | ||
| Age (years) mean ± SD | 64.8 ± 10.9 | 65.8 ± 10.7 | 64.9 ± 10.8‡ | 63.5 ± 11.1‡ | <0.001 |
| Female (%) | 35.3 | 31.7 | 33.8 | 40.4‡ | <0.001 |
| Body mass index (kg/m2) mean ± SD | 24.2 ± 3.3 | 23.8 ± 3.2 | 24.2 ± 3.4‡ | 24.5 ± 3.4‡ | <0.001 |
| Current smoker (%) | 14.5 | 12.0 | 13.7* | 17.8‡ | <0.001 |
| Comorbidity (%) | |||||
| Diabetes | 10.6 | 12.3 | 10.5* | 8.9‡ | <0.001 |
| Hypertension | 15.2 | 17.7 | 15.6* | 12.4‡ | <0.001 |
| Coronary artery disease | 64.0 | 68.4 | 65.0† | 58.7‡ | <0.001 |
| Stroke | 1.6 | 1.7 | 1.7 | 1.3 | 0.311 |
| Peripheral vascular disease | 1.3 | 1.5 | 1.6 | 0.8* | 0.015 |
| Atrial fibrillation/flutter | 2.7 | 2.7 | 2.7 | 2.7 | 0.940 |
| Valvular heart disease | 3.7 | 3.0 | 3.9 | 4.2† | 0.009 |
| Chronic kidney disease | 14.0 | 13.8 | 13.9 | 14.1 | 0.795 |
| Blood laboratory finding mean ± SD | |||||
| White blood cells (×10³/μL) | 6.9 ± 2.6 | 6.7 ± 2.4 | 6.9 ± 2.5† | 7.2 ± 2.8‡ | <0.001 |
| Hemoglobin (g/dL) | 13.3 ± 1.8 | 13.1 ± 1.8 | 13.3 ± 1.8‡ | 13.4 ± 1.8‡ | <0.001 |
| Protein (g/dL) | 7.0 ± 0.7 | 7.0 ± 0.7 | 7.0 ± 0.7 | 7.0 ± 0.7 | 0.010 |
| Albumin (g/dL) | 4.1 ± 0.5 | 4.1 ± 0.4 | 4.1 ± 0.5 | 4.1 ± 0.5‡ | 0.006 |
| eGFR (mL/min/1.73 m2) | 80.8 ± 19.0 | 80.2 ± 18.5 | 80.7 ± 18.9 | 81.5 ± 19.5† | <0.001 |
| Urine laboratory finding, mean ± SD | |||||
| ACR (mg/mg) | 0.1 ± 0.5 | 0.1 ± 0.5 | 0.1 ± 0.3 | 0.2± 0.6† | 0.001 |
| PCR (mg/mg) | 0.3 ± 0.9 | 0.3 ± 0.9 | 0.3 ± 0.7 | 0.4 ± 1.2‡ | <0.001 |
| Hematuria (%) | 11.9 | 11.4 | 11.1 | 13.1 | 0.080 |
| Medications (%) | |||||
| Statin | 19.2 | 17.2 | 17.4 | 22.9‡ | <0.001 |
| Ezetimibe | 1.9 | 1.6 | 1.7 | 2.6† | 0.010 |
| Fenofibrate | 0.2 | 0.2 | 0.3 | 0.2 | 0.866 |
| Omega-3 fatty acid | 6.0 | 5.4 | 6.1 | 6.5 | 0.166 |
| Aspirin | 20.6 | 19.6 | 19.7 | 22.6† | 0.003 |
| Other anti-platelets | 5.1 | 5.7 | 4.3* | 5.4 | 0.034 |
| Anti-coagulants | 3.0 | 2.5 | 3.1 | 3.5* | 0.082 |
| Oral antidiabetic drugs | 4.6 | 3.8 | 4.6 | 5.4† | 0.012 |
| Insulin | 1.3 | 1.2 | 1.2 | 1.5 | 0.469 |
| ACEI or ARB | 10.9 | 9.0 | 10.9* | 12.7‡ | <0.001 |
| β-blocker | 12.5 | 11.9 | 11.6 | 14.2† | 0.002 |
| Calcium channel blocker | 10.2 | 9.4 | 9.1 | 12.1‡ | <0.001 |
| Diuretics | 5.9 | 4.8 | 5.7 | 7.1‡ | 0.001 |
| Lipid profile, median (IQR) | |||||
| Total cholesterol (mg/dL) | 152 (130–178) | 125 (114–137) | 151 (139–163)‡ | 188 (172–209)‡ | <0.001 |
| Triglyceride (mg/dL) | 105 (78–146) | 89 (68–118) | 105 (79–144)‡ | 127 (94–172)‡ | <0.001 |
| HDL cholesterol (mg/dL) | 37 (31–44) | 36 (30–43) | 36 (30–44) | 37 (31–45)‡ | <0.001 |
| LDL cholesterol (mg/dL) | 86 (68–109) | 63 (54–72) | 86 (77–96)‡ | 120 (104–138)‡ | <0.001 |
| VLDL cholesterol (mg/dL) | 23 (18–29) | 20 (16–24) | 23 (19–28)‡ | 27 (22–35)‡ | <0.001 |
| IDL A cholesterol (mg/dL) | 12 (9–15) | 9 (7–11) | 11 (9–14)‡ | 15 (12–18)‡ | <0.001 |
| IDL B cholesterol (mg/dL) | 10 (8–13) | 8 (7–10) | 10 (8–12)‡ | 13 (11–16)‡ | <0.001 |
| IDL C cholesterol (mg/dL) | 15 (12–19) | 13 (10–16) | 15 (12–19)‡ | 19 (15–22)‡ | <0.001 |
| LDL subfraction score | 1.6 (1.4–1.8) | 1.4 (1.3–1.6) | 1.6 (1.4–1.8)‡ | 1.8 (1.5–2.2)‡ | <0.001 |
| ApoB (mg/dL) | 77.0 (65.0–93.0) | 61.0 (55.0–65.0) | 77.0 (74.0–82.0)‡ | 100.0 (92.0–111.0)‡ | <0.001 |
| ApoA1 (mg/dL) | 109 (98–121) | 108 (98–120) | 108 (98–120) | 110 (99–123)‡ | <0.001 |
| ApoB/A1 | 0.7 (0.6–0.9) | 0.6 (0.5–0.6) | 0.7 (0.6–0.8)‡ | 0.9 (0.8–1.1)‡ | <0.001 |
ACR, random urine albumin:creatinine ratio; PCR, random urine protein:creatinine ratio; ACEI, angiotensin-converting enzyme inhibitor; ARB, angiotensin II receptor blocker.
P < 0.05;
P < 0.01;
P < 0.001 (compared with the lowest tertile).
Lipid parameters associated with a higher risk of ESRD
During a median follow-up period of 5 years (IQR 3–7; maximum 10), ESRD developed in 110 patients (1.2%). Table 2 shows the HRs of lipid parameters for the risk of ESRD. In univariate analyses, serum ApoB, ApoA1, triglyceride and HDL and IDL cholesterol concentrations were associated with the risk of ESRD. The LDL subfraction score correlated with the development of ESRD. When backward stepwise regression was applied, after adjustment for age, sex, body mass index, smoking status, diabetes mellitus, hypertension and coronary artery disease, lipid parameters (ApoB and total, HDL and IDL cholesterols) remained significant predictors of ESRD. Specifically, 1 mg/dL increase in ApoB conferred an approximate 3% increase in the risk of ESRD.
Table 2.
Use of lipid parameters in the prediction of ESRD risk
| Parameters | Univariate |
Multivariatea |
||
|---|---|---|---|---|
| HR (95% CI) | P-value | HR (95% CI) | P-value | |
| ApoB (per 1 mg/dL) | 1.02 (1.007–1.023) | <0.001 | 1.03 (1.009–1.043) | 0.002 |
| ApoA1 (per 1 mg/dL) | 0.98 (0.964–0.986) | <0.001 | – | – |
| Total cholesterol (per 1 mg/dL) | 1.00 (0.997–1.007) | 0.571 | 0.97 (0.960–0.985) | <0.001 |
| Triglyceride (per 1 mg/dL) | 1.00 (1.000–1.003) | 0.008 | – | – |
| HDL cholesterol (per 1 mg/dL) | 0.94 (0.922–0.960) | <0.001 | 0.97 (0.945–0.993) | 0.011 |
| VLDL cholesterol (per 1 mg/dL) | 1.01 (0.999–1.025) | 0.062 | – | – |
| IDL A (per 1 mg/dL) | 1.07 (1.038–1.094) | <0.001 | 1.05 (0.999–1.105) | 0.054 |
| IDL B (per 1 mg/dL) | 1.12 (1.092–1.139) | <0.001 | 1.14 (1.089–1.190) | <0.001 |
| IDL C (per 1 mg/dL) | 1.05 (1.026–1.082) | <0.001 | 1.04 (1.000–1.078) | 0.049 |
| LDL subfraction score (per 1) | 1.06 (0.991–1.124) | 0.094 | – | – |
Adjusted for age, sex, body mass index, smoking status, diabetic mellitus, hypertension and coronary artery disease.
Effect of ApoB concentration on the risk of ESRD
Spine-based HR curves of serum ApoB or ApoA1 for the risk of ESRD are presented in Figure 1. As a result, patients with high ApoB and low ApoA1 concentrations seemed to be at risk of ESRD. Subsequently patients were divided into tertiles according to their Apo concentrations. Figure 2 shows the Kaplan–Meier curves representing cumulative ESRD events classified according to Apo tertile. The higher and lower tertiles of ApoB and ApoA1, respectively, were associated with a higher crude risk of ESRD (Figure 2A and B) and therefore the ApoB:ApoA1 ratio was positively associated with a higher risk of ESRD (Figure 2C). Unadjusted Cox regression analysis of the relationships between ApoB, ApoA1 and ESRD yielded similar results (Table 3). When clinical and laboratory parameters were sequentially adjusted for, the association of ApoA1 with ESRD disappeared; ApoB was independent of these clinical and laboratory parameters. In addition, ApoB:ApoA1 remained significant in an association with the risk of ESRD after adjustment for multiple parameters. Figure 3 demonstrates that the positive relationship between ApoB concentration and the risk of ESRD remained consistent irrespective of age, sex, diabetes mellitus and eGFR.
FIGURE 1.

Spline-based HR curves for the predicted risk of ESRD, classified according to serum (A) ApoB and (B) ApoA1 concentrations.
FIGURE 2.
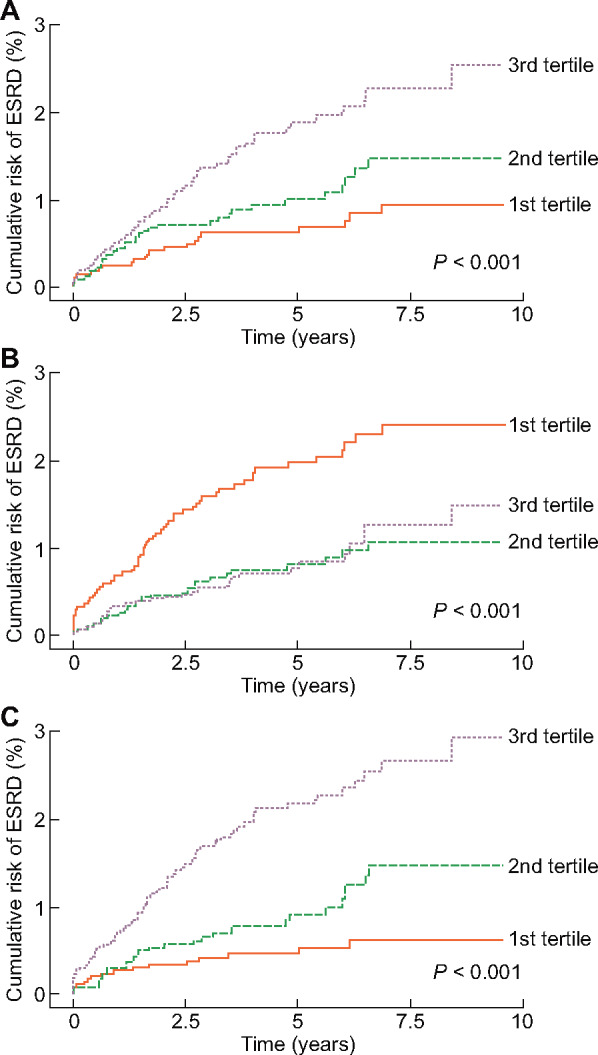
Risk of ESRD, according to tertiles of (A) ApoB, (B) ApoA1 and (C) ApoB:ApoA1 ratio.
Table 3.
Risk of ESRD according to the ApoB and ApoA1 levels, using backward stepwise multivariate model
| Univariate |
Model 1 |
Model 2 |
Model 3 |
||||||
|---|---|---|---|---|---|---|---|---|---|
| Parameter | Tertiles | HR (95% CI) | P-value | HR (95% CI) | P-value | HR (95% CI) | P-value | HR (95% CI) | P-value |
| ApoB | T1 | 1 (Reference) | <0.001* | 1 (Reference) | <0.001* | 1 (Reference) | 0.006* | 1 (Reference) | <0.001* |
| T2 | 1.52 (0.887–2.610) | 0.127 | 1.58 (0.918–2.702) | 0.096 | 1.85 (1.005–3.400) | 0.023 | 2.13 (1.225–3.689) | 0.007 | |
| T3 | 2.56 (1.563–4.202) | <0.001 | 2.86 (1.741–4.703) | <0.001 | 2.31 (1.376–3.863) | 0.002 | 2.82 (1.683–4.734) | <0.001 | |
| ApoA1 | T1 | 1 (Reference) | 0.001* | 1 (Reference) | <0.001* | – | – | ||
| T2 | 0.42 (0.262–0.667) | <0.001 | 0.44 (0.274–0.700) | 0.001 | – | – | |||
| T3 | 0.49 (0.283–0.712) | 0.001 | 0.46 (0.289–0.728) | 0.001 | – | – | |||
| ApoB: ApoA1 | T1 | 1 (Reference) | <0.001* | 1 (Reference) | <0.001* | 1 (Reference) | 0.095* | 1 (Reference) | 0.023* |
| T2 | 2.01 (1.083–3.742) | 0.027 | 2.10 (1.127–3.895) | 0.019 | 1.75 (0.937–3.280) | 0.079 | 1.95 (1.030–3.672) | 0.040 | |
| T3 | 4.41 (2.515–7.729) | <0.001 | 4.66 (2.660–8.180) | <0.001 | 1.90 (1.057–3.409) | 0.032 | 2.29 (1.270–4.145) | 0.006 | |
Model 1: adjusted for age, sex, body mass index and smoking status.
Model 2: adjusted for Model 1 variables plus comorbidity and laboratory findings.
Model 3: adjusted for Model 2 variables plus medications.
P-value for trend.
FIGURE 3.

Subgroup analysis for the risk of ESRD, according to tertiles of ApoB concentration.
Because urinary data were available for only 5856 patients (62.3%), we additionally adjusted for random urine albumin:creatinine and protein:creatinine ratios in the model as a sensitivity analysis (Table 3). The higher tertiles had a higher risk of ESRD than the lowest tertile with the following HR and P-values: HR 2.13 [95% confidence interval (CI) 1.225–3.689] and P = 0.007 for the second tertile and HR 2.82 (1.683–4.734) and P < 0.001 for the third tertile.
Effect of ApoB concentration on the mortality-adjusted risk of ESRD
During the follow-up period, 1162 patients (12.4%) died. A competing risk analysis was performed because the association between ApoB and ESRD could have been affected by the high death rate [17, 18]. Although the risk of death was adjusted for, a high ApoB concentration remained a risk factor for ESRD (Figure 4). When multiple covariates were adjusted for, the HRs for the second and third tertiles were 1.43 (95% CI 0.833–2.470), P = 0.193 and 1.86 (1.105–3.132), P = 0.019, respectively, compared with the first tertile.
FIGURE 4.
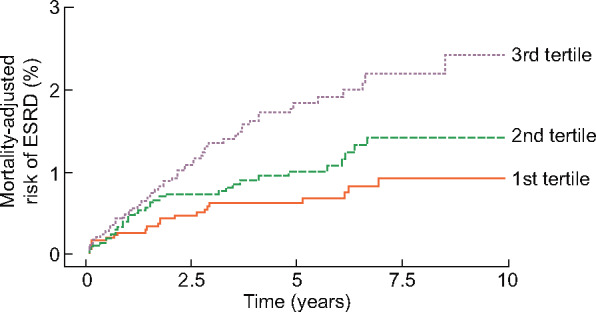
Death-adjusted risk of ESRD, according to tertiles of ApoB concentration.
DISCUSSION
Dyslipidemia is associated with substantial morbidity and mortality and ApoB can be used to help clarify the risk [12]. Despite the high prevalence of high serum ApoB concentrations [19], the association of ApoB with the risk of renal outcomes has not been fully established. This study aimed to determine whether ApoB concentration is associated with the risk of ESRD after taking interactions with other lipid parameters, including LDL subfractions, and the competing risk of death into account.
Various parameters indicative of dyslipidemia have been evaluated for their predictive value for the progression of renal disease to ESRD [20], although the relationships identified between conventional lipid parameters and renal outcomes have been both positive [8, 21] and negative [5–7, 22]. Failure to identify correlations has been attributed to the confounding effect of uremia on lipid metabolism. However, these studies evaluated conventional lipid parameters, such as total cholesterol, triglyceride and HDL and LDL cholesterols, but not other parameters, including serum ApoB and LDL subfractions.
Recently Apo have been of clinical interest for their potential use in relation to outcomes in CKD. Two large prospective cohort studies and other observational studies have assessed their suitability with regard to the survival of pre-dialysis CKD patients [14, 23–25]. The Atherosclerosis Risk in Communities Study has provided evidence that ApoB:ApoA1 and non-HDL:HDL cholesterol ratios are associated with the risk of cardiovascular disease in CKD. In addition, the Chronic Renal Insufficiency Cohort (CRIC) study has shown that high ApoB and low ApoA1 concentrations are correlated with higher risks of atherosclerotic cardiovascular disease. Thus a high ApoB concentration is known to be associated with the risks of atherosclerotic cardiovascular morbidity and mortality in CKD.
To date, few studies have identified the value of Apo in relation to renal outcomes [26–28]. Genetic polymorphisms of ApoE and ApoL1 have been shown to be associated with the progression of renal impairment [26, 28], and high ApoA4 concentration has been shown to be associated with the early progression of kidney disease, although ApoA4 is thought to be a reverse cholesterol transporter or antioxidant [27]. Despite these findings, Apo are not measured routinely in the clinic and are not mentioned in the guideline in CKD patients since few clinical or mechanistic studies have been conducted on the proteins to date. The CRIC study of CKD patients has identified a relationship between ApoB and renal outcomes, although this was not independent of other clinical and laboratory parameters [6]. The different results between ours and the CRIC study may be attributable to a different target population (outpatient versus CKD), study outcome (ESRD alone versus composite renal outcome) and investigated parameters. Furthermore, the CRIC study did not adjust LDL subfractions in the relationships.
The serum ApoB concentration reflects the amount of atherogenic lipid burden, as the subendothelial retention of ApoB-containing lipoproteins is a key insult in the development of atherosclerosis [29]. The ionic interaction between the negatively charged sulfate group on the extracellular matrix proteoglycans and the basic amino acids within ApoB promotes this deposition of lipid particles in the subendothelium [30]. These lipid deposits accelerate oxidation and inflammation, both of which result in endothelial dysfunction and the formation of atherosclerotic plaques [31]. The inflammation is also perpetuated by autoimmunity targeting the ApoB100 isoform [32]. In a similar way, glomerular endothelial cells and kidney vessels can become sites of oxidation and inflammation secondary to high ApoB concentrations, resulting in progression of CKD [33–35].
This study revealed that the ApoA1 concentration is not independently related to ESRD. ApoA1, the main protein constituent of HDL cholesterol, was originally thought to have a number of antiatherosclerotic influences [36]. However, when compared with concrete status of ApoB as a risk factor of atherosclerotic disease, the role of ApoA1 appears to be more limited [37], as the status of HDL for the prediction of atherosclerosis has recently been challenged [38]. Consistent with this doubt, an experimental study has shown that the plasma ApoA1 concentration does not reflect the real concentration within the endothelium [39]. Furthermore, another study found that HDL cholesterols lose their anti-inflammatory properties, and may in fact be converted into pro-inflammatory agents during chronic inflammatory disorders such as CKD [40]. These findings may explain the lack of association identified between ApoA1 and ESRD in this study.
Although the data obtained are informative, there were some limitations to the study. Neither causal relationships nor the underlying mechanisms linking ApoB and the risk of ESRD could be determined, although potential mechanisms are discussed above. In addition, other unmeasured lipid parameters, such as other subclasses of Apo, could have had a confounding effect on the association identified. The lifestyles and diets of the patients were not reviewed, which could have affected the concentrations of lipid parameters, including ApoB.
This study has demonstrated the association between ApoB and the risk of ESRD, adding to the related associations with cardiovascular morbidity and mortality identified in previous studies. Furthermore, the association was independent of the conventional lipid parameters and LDL subfraction. Future studies should aim to determine an appropriate strategy of ApoB monitoring, aiming to reduce the risk of ESRD.
ACKNOWLEDGEMENTS
This work was supported by a grant from the Basic Science Research Program through the National Research Foundation of Korea, funded by the Ministry of Education (NRF-2017R1D1A1B03031642), which had no role in the study design, data collection, analysis, interpretation or writing of the manuscript.
CONFLICT OF INTEREST STATEMENT
None declared.
REFERENCES
- 1. Ross R. Atherosclerosis—an inflammatory disease. N Engl J Med 1999; 340: 115–126 [DOI] [PubMed] [Google Scholar]
- 2. Reiss AB, Voloshyna I, De Leon J et al. Cholesterol metabolism in CKD. Am J Kidney Dis 2015; 66: 1071–1082 [DOI] [PMC free article] [PubMed] [Google Scholar]
- 3. Jono S, Shioi A, Ikari Y et al. Vascular calcification in chronic kidney disease. J Bone Miner Metab 2006; 24: 176–181 [DOI] [PubMed] [Google Scholar]
- 4. Wanner C, Tonelli M, Kidney Disease: Improving Global Outcomes Lipid Guideline Development Work Group. KDIGO clinical practice guideline for lipid management in CKD: summary of recommendation statements and clinical approach to the patient. Kidney Int 2014; 85: 1303–1309 [DOI] [PubMed] [Google Scholar]
- 5. Iseki K, Tozawa M, Ikemiya Y et al. Relationship between dyslipidemia and the risk of developing end-stage renal disease in a screened cohort. Clin Exp Nephrol 2005; 9: 46–52 [DOI] [PubMed] [Google Scholar]
- 6. Rahman M, Yang W, Akkina S et al. Relation of serum lipids and lipoproteins with progression of CKD: the CRIC study. Clin J Am Soc Nephrol 2014; 9: 1190–1198 [DOI] [PMC free article] [PubMed] [Google Scholar]
- 7. Voskamp PWM, van Diepen M, Dekker FW, Hoogeveen EK. Dyslipidemia and risk of renal replacement therapy or death in incident pre-dialysis patients. Sci Rep 2018; 8: 3130. [DOI] [PMC free article] [PubMed] [Google Scholar]
- 8. Muntner P, Coresh J, Smith JC et al. Plasma lipids and risk of developing renal dysfunction: the atherosclerosis risk in communities study. Kidney Int 2000; 58: 293–301 [DOI] [PubMed] [Google Scholar]
- 9. Walldius G, Jungner I, Holme I et al. High apolipoprotein B, low apolipoprotein A-I, and improvement in the prediction of fatal myocardial infarction (AMORIS study): a prospective study. Lancet 2001; 358: 2026–2033 [DOI] [PubMed] [Google Scholar]
- 10. Grundy SM, Vega GL, Tomassini JE et al. Correlation of non-high-density lipoprotein cholesterol and low-density lipoprotein cholesterol with apolipoprotein B during simvastatin + fenofibrate therapy in patients with combined hyperlipidemia (a subanalysis of the SAFARI trial). Am J Cardiol 2009; 104: 548–553 [DOI] [PubMed] [Google Scholar]
- 11. Sniderman AD, Williams K, Contois JH et al. A meta-analysis of low-density lipoprotein cholesterol, non-high-density lipoprotein cholesterol, and apolipoprotein B as markers of cardiovascular risk. Circ Cardiovasc Qual Outcomes 2011; 4: 337–345 [DOI] [PubMed] [Google Scholar]
- 12. Grundy SM, Stone NJ, Bailey AL et al. AHA/ACC/AACVPR/AAPA/ABC/ACPM/ADA/AGS/APhA/ASPC/NLA/PCNA guideline on the management of blood cholesterol: a report of the American College of Cardiology/American Heart Association Task Force on Clinical Practice Guidelines. J Am Coll Cardiol 2019; 73: 3168–3209 [DOI] [PubMed] [Google Scholar]
- 13. Samuelsson O, Mulec H, Knight-Gibson C et al. Lipoprotein abnormalities are associated with increased rate of progression of human chronic renal insufficiency. Nephrol Dial Transplant 1997; 12: 1908–1915 [DOI] [PubMed] [Google Scholar]
- 14. Cerezo I, Fernandez N, Romero B et al. [ Prognostic value of apolipoproteins A and B in the clinical course of patients with chronic kidney disease previous to dialysis]. Nefrologia 2009; 29: 540–547 [DOI] [PubMed] [Google Scholar]
- 15. Ferro CJ, Mark PB, Kanbay M et al. Lipid management in patients with chronic kidney disease. Nat Rev Nephrol 2018; 14: 727–749 [DOI] [PubMed] [Google Scholar]
- 16. Levey AS, Stevens LA. Estimating GFR using the CKD Epidemiology Collaboration (CKD-EPI) creatinine equation: more accurate GFR estimates, lower CKD prevalence estimates, and better risk predictions. Am J Kidney Dis 2010; 55: 622–627 [DOI] [PMC free article] [PubMed] [Google Scholar]
- 17. Scrucca L, Santucci A, Aversa F. Regression modeling of competing risk using R: an in depth guide for clinicians. Bone Marrow Transplant 2010; 45: 1388–1395 [DOI] [PubMed] [Google Scholar]
- 18. Forsblom C, Harjutsalo V, Thorn LM et al. Competing-risk analysis of ESRD and death among patients with type 1 diabetes and macroalbuminuria. J Am Soc Nephrol 2011; 22: 537–544 [DOI] [PMC free article] [PubMed] [Google Scholar]
- 19. Carroll MD, Kit BK, Lacher DA. Total and high-density lipoprotein cholesterol in adults: National Health and Nutrition Examination Survey, 2009–2010. NCHS Data Brief 2013; 132: 1–8 [PubMed] [Google Scholar]
- 20. Iseki K. Epidemiology of dyslipidemia in chronic kidney disease. Clin Exp Nephrol 2014; 18: 185–188 [DOI] [PubMed] [Google Scholar]
- 21. Schaeffner ES, Kurth T, Curhan GC et al. Cholesterol and the risk of renal dysfunction in apparently healthy men. J Am Soc Nephrol 2003; 14: 2084–2091 [DOI] [PubMed] [Google Scholar]
- 22. Chawla V, Greene T, Beck GJ et al. Hyperlipidemia and long-term outcomes in nondiabetic chronic kidney disease. Clin J Am Soc Nephrol 2010; 5: 1582–1587 [DOI] [PMC free article] [PubMed] [Google Scholar]
- 23. Okubo M, Hanada H, Matsui M et al. [ Clinical significance of apolipoprotein B-48 (apoB-48) in chronic kidney disease patients]. Rinsho Byori 2010; 58: 878–883 [PubMed] [Google Scholar]
- 24. Lamprea-Montealegre JA, Sharrett AR, Matsushita K et al. Chronic kidney disease, lipids and apolipoproteins, and coronary heart disease: the ARIC study. Atherosclerosis 2014; 234: 42–46 [DOI] [PubMed] [Google Scholar]
- 25. Bajaj A, Xie D, Cedillo-Couvert E et al. Lipids, apolipoproteins, and risk of atherosclerotic cardiovascular disease in persons with CKD. Am J Kidney Dis 2019; 73: 827–836 [DOI] [PMC free article] [PubMed] [Google Scholar]
- 26. Hsu CC, Kao WH, Coresh J et al. Apolipoprotein E and progression of chronic kidney disease. JAMA 2005; 293: 2892–2899 [DOI] [PubMed] [Google Scholar]
- 27. Boes E, Fliser D, Ritz E et al. Apolipoprotein A-IV predicts progression of chronic kidney disease: the mild to moderate kidney disease study. J Am Soc Nephrol 2006; 17: 528–536 [DOI] [PubMed] [Google Scholar]
- 28. Kronenberg F. Apolipoprotein L1 and apolipoprotein A-IV and their association with kidney function. Curr Opin Lipidol 2017; 28: 39–45 [DOI] [PubMed] [Google Scholar]
- 29. Tabas I, Williams KJ, Borén J. Subendothelial lipoprotein retention as the initiating process in atherosclerosis: update and therapeutic implications. Circulation 2007; 116: 1832–1844 [DOI] [PubMed] [Google Scholar]
- 30. Skalen K, Gustafsson M, Rydberg EK. Subendothelial retention of atherogenic lipoproteins in early atherosclerosis. Nature 2002; 417: 750–754 [DOI] [PubMed] [Google Scholar]
- 31. Libby P, Ridker PM, Hansson GK. Progress and challenges in translating the biology of atherosclerosis. Nature 2011; 473: 317–325 [DOI] [PubMed] [Google Scholar]
- 32. Gistera A, Hansson GK. The immunology of atherosclerosis. Nat Rev Nephrol 2017; 13: 368–380 [DOI] [PubMed] [Google Scholar]
- 33. Wheeler DC, Chana RS. Interactions between lipoproteins, glomerular cells and matrix. Miner Electrolyte Metab 1993; 19: 149–164 [PubMed] [Google Scholar]
- 34. Scheuer H, Gwinner W, Hohbach J et al. Oxidant stress in hyperlipidemia-induced renal damage. Am J Physiol Renal Physiol 2000; 278: F63–F74 [DOI] [PubMed] [Google Scholar]
- 35. Trevisan R, Dodesini AR, Lepore G. Lipids and renal disease. J Am Soc Nephrol 2006; 17: S145–S147 [DOI] [PubMed] [Google Scholar]
- 36. Riwanto M, Landmesser U. High density lipoproteins and endothelial functions: mechanistic insights and alterations in cardiovascular disease. J Lipid Res 2013; 54: 3227–3243 [DOI] [PMC free article] [PubMed] [Google Scholar]
- 37. Wilson PWF, Polonsky TS, Miedema MD et al. Systematic review for the 2018 AHA/ACC/AACVPR/AAPA/ABC/ACPM/ADA/AGS/APhA/ASPC/NLA/PCNA Guideline on the Management of Blood Cholesterol. Circulation 2019; 139: e1144–e1161 [DOI] [PubMed] [Google Scholar]
- 38. Barter P, Genest J. HDL cholesterol and ASCVD risk stratification: a debate. Atherosclerosis 2019; 283: 7–12 [DOI] [PubMed] [Google Scholar]
- 39. DiDonato JA, Huang Y, Aulak KS et al. Function and distribution of apolipoprotein A1 in the artery wall are markedly distinct from those in plasma. Circulation 2013; 128: 1644–1655 [DOI] [PMC free article] [PubMed] [Google Scholar]
- 40. Kopecky C, Michlits G, Säemann MD et al. Pro- versus anti-inflammatory actions of HDLs in innate immunity. Cell Metab 2017; 26: 2–3 [DOI] [PubMed] [Google Scholar]