

Abstract
Background and aims:
This study examined if the weight loss and metabolic benefits of alternate day fasting (ADF) varies according to sex and menopausal status in adults with obesity.
Methods and results:
This secondary analysis pooled the data of men and women (n = 75) who participated in three 12-week ADF studies (500 kcal fast day; alternated with an ad libitum intake feast day). Body weight decreased in premenopausal women (−4.6 ± 3.2%), postmenopausal women (−6.5 ± 3.2%) and men (−6.2 ± 4.4%) (main effect of time, P < 0.001), with no difference between groups (no group × time interaction). Energy intake on fast days was higher than prescribed in all groups (~400-500 excess kcal consumed), with no differences between groups. Fat mass, lean mass, fasting insulin, and insulin resistance, and blood pressure decreased similarly in all groups (main effect of time, P < 0.05 for all comparisons). LDL cholesterol decreased more in postmenopausal versus premenopausal women (group × time interaction, P = 0.01). Fasting glucose, HDL cholesterol, and triglycerides remained unchanged in all groups.
Conclusion:
These findings suggest that the weight loss and metabolic benefits of ADF do not generally vary according to sex or menopausal status in adults with obesity.
Keywords: Intermittent fasting, sex differences, menopausal status, weight loss, metabolic disease, obesity
Introduction
Over the past decade, intermittent fasting has gained substantial popularity as a weight loss regimen [1, 2]. One of the most researched forms of intermittent fasting is “alternate day fasting” (ADF) [3-15]. ADF involves a “fast day” where individuals consume 25% of their usual intake (approximately 500 kcal), alternated with a “feast day” where individuals are permitted to consume food ad libitum. ADF regimens are generally well tolerated over short periods of time (8-12 weeks) and produce weight loss which is on par with daily calorie restriction (3-7% from baseline) [3-15]. Improvements in several metabolic disease risk factors have also been noted. Many trials of ADF report potent reductions in insulin resistance and fasting insulin in healthy individuals with obesity and those with prediabetes [8, 10, 15, 16]. Blood pressure is also regularly decreased with this regimen [3, 5, 7, 10, 13-15]. The effects of ADF on plasma lipid levels are less clear, however, with some studies reporting reductions in LDL cholesterol and triglycerides [3-5, 10, 11], while others show no effect on these parameters [7, 12].
The majority of previous ADF trials have included a wide age range (18-65 years) of both female and male participants [3-15]. Due to this large age range, studies have typically included a pooled sample of both premenopausal and postmenopausal women. A key question that remains unresolved is whether the weight loss efficacy of ADF varies according to sex and menopausal status. In a recent trial [17], it was demonstrated that postmenopausal women lost twice as much weight (12%) as premenopausal women (6%) after 24-weeks of ADF. Another trial showed that men and women lost similar amounts of weight with ADF, but weight loss was more pronounced in older adults (>50 years old) [18]. While these studies offer some preliminary evidence, they are limited by small sample size. These studies also failed to measure adherence to ADF, which could be a key factor in explaining why one group experienced greater weight loss than the other. Moreover, how changes in metabolic disease risk factors (body composition, insulin resistance, blood pressure, and plasma lipids) varies according to sex and menopausal status, were not assessed.
Accordingly, this study was undertaken to examine if weight loss, dietary adherence, and metabolic disease risk reduction with ADF differs between premenopausal women, postmenopausal women and men. We hypothesized that postmenopausal women would be more compliant with ADF which would lead to greater reductions in body weight and insulin resistance, when compared to premenopausal women and men.
Methods
Study selection
The data used in this secondary analysis are from three separate trials of ADF [3, 10, 12] performed by our lab group. Full details regarding subject selection, interventions, and outcome measures have been published elsewhere [3, 10, 12]. These three studies were selected because they had similar population groups, and comparable ADF interventions. When a study employed multiple intervention arms, only the ADF diet arm was used in the analysis. For the study that combined ADF plus exercise [3], only the ADF diet arm was used in the present analysis. Moreover, if the study duration exceeded 12-weeks, the 12-week data point was used as the final time point.
Study populations
Subject selection procedures were almost identical between the three studies [3, 10, 12]. Independently living subjects were recruited from the University of Illinois, Chicago campus by flyers. Participants were included if they were 18-65 years old; BMI 25.0-39.9 kg/m2; and previously sedentary (<60 minutes/week of light activity for the 3 months prior to the study). Individuals were excluded if they had a history of type 1 or type 2 diabetes, cardiovascular disease, were taking weight loss medications, were not weight stable for 3 months prior to the beginning of the study (> 4 kg weight loss or gain), were peri-menopausal, pregnant, lactating, or smokers. Experimental protocols were approved by the Office for the Protection of Research Subjects at the University of Illinois, Chicago, and all volunteers gave written informed consent.
Menopausal status
During screening, menopausal status was determined using the Stages of Reproductive Aging Workshop classification [19]. Women were classified in three groups according to self-reported menstruation pattern: premenopausal (regular menses), perimenopausal (irregular menses, with differences on cycle length over seven days or amenorrhea until one year) or postmenopausal (absence of menses for over one year). Perimenopausal women were excluded from the present analysis as this stage of menopause is associated with altered lipid metabolism and metabolic disturbances [20].
Alternate day fasting diets
All subjects participated in a 12-week ADF protocol. During the ADF diet, subjects consumed 25% of their baseline energy needs on the fast day (24 h), and ate ad libitum on each alternating feast day (24 h). Baseline energy needs were calculated using the Mifflin equation. Fast and feast days began at midnight each day. In each of these trials, subjects were provided with meals on the fast day. In the trials by Bhutani et al [3] and Trepanowski et al [12], the macronutrient composition of the provided meals was ~15% energy from protein, ~55% energy from carbohydrates, and ~30% energy from fat. In the study by Kalam et al [10], the macronutrient profile of the provided fast day meals was ~35% energy from protein, ~30% energy from carbohydrates, and ~35% energy from fat. On fast days, subjects were encouraged to drink plenty of water, and were permitted to consume calorie-free foods such as black coffee, tea, water and sugar-free gum. Participants were instructed to eat their fast day calories as a lunch, to ensure that each subject was undergoing the same duration of fasting. On feast days, subjects were permitted to eat ad libitum.
Body weight and body composition assessment
Body weight measurements were taken to the nearest 0.25 kg at baseline and every 2 weeks during the intervention in light clothing and without shoes using a digital scale (Omron HBF-500; Omron Health Care). Height was assessed using a wall-mounted stadiometer to the nearest 0.1 cm at baseline. Body composition (fat mass, lean mass, visceral fat mass) was measured using dual x-ray absorptiometry (DXA; iDXA, General Electric Inc) during baseline and at week 12.
Dietary intake, adherence, and physical activity
All subjects were asked to complete a 7-d food record at baseline (pre-intervention) and during week 12. The study dietitian provided 15 min of instruction to each participant on how to complete the food records. These instructions included information and reference guides on how to estimate portion sizes and record food items in sufficient detail to obtain accurate estimates of dietary intake. Subjects were not required to weigh foods but were asked to measure the volume of foods consumed with household measures (i.e. measuring cups and measuring spoons). The food analysis program, Nutritionist Pro (Axxya Systems, Stafford, TX) was used to calculate the total daily intake of energy, fat, protein, carbohydrate, cholesterol, and fiber on the feast and fast days. Checklist were also provided each week to assess how much of the provided fast day meals were consumed. Subjects were considered “adherent” when their actual energy intake on the fast day, determined via food records, was not significantly different from their prescribed energy goal on the fast day. All subjects were asked to maintain their level of physical activity throughout the trial. Activity level (steps/d) was measured over 7-d during at baseline (pre-intervention) and at week 12 by a pedometer (Yamax Digi-walker SW-200, Yamax Inc., San Antonio, TX).
Metabolic disease risk factor assessment
All metabolic disease risk variables were measured at baseline and week 12. Twelve-hour fasting blood samples were collected between 6.00 am and 9.00 am on the morning of a feast day. The subjects were instructed to avoid exercise, alcohol, and coffee for 24 h before each visit. Fasting plasma total cholesterol, direct LDL cholesterol, HDL-cholesterol, triglycerides concentrations were measured by a commercial lab (Medstar, Chicago, IL). Fasting glucose concentrations were measured with a hexokinase reagent kit (Abbott, South Pasadena, CA). Fasting insulin was assessed as total immunoreactive insulin (Coat-A-Count Insulin, Los Angeles, CA). Insulin resistance (IR) was calculated using the HOMA (Homeostasis Model Assessment) method, by applying the following formula: [HOMA-IR = Fasting insulin (μlU/ml) × Fasting glucose (mg/dL) / 405]. Blood pressure and heart rate were measured in triplicate using a digital automatic blood pressure/heart rate monitor (Omron HEM 705 LP, Kyoto, Japan) with the subject in a seated position after a 10-min rest.
Statistics
Results are presented as mean ± SD. Shapiro-Wilk tests for normality were included in the model. No variables were found to be not normal. Homogeneity of variance was tested by Levene’s test, and the variances were not statistically different from each other. Differences between groups at baseline were assessed by a one-way ANOVA with a Tukey post-hoc test (continuous variables) or McNemar test (categorical variables). Repeated measures ANOVA with groups (premenopausal women, postmenopausal women and men) as the between-subject factor and time (baseline and week 12) as the within-subject factor was used to compare changes in dependent variables between the groups over time. When there was a significant main effect but no interaction, post hoc comparisons were performed using Bonferroni’s correction to determine differences between group means. Differences were considered significant at P < 0.05. All data was analyzed using SPSS software (version 25, SPSS Inc, Chicago, IL).
Results
Baseline characteristics of the pooled study population
A total of 75 subjects (premenopausal n = 43, postmenopausal n = 22, men n = 10) were included in the analysis (Figure 1). Baseline characteristics of these participants are reported in Table 1. Postmenopausal women were significantly older than premenopausal women and men (P < 0.001). Baseline BMI did not differ between groups, although body weight (P = 0.001) and height (P = 0.01) were significantly different between groups. Race and ethnicity did not differ between premenopausal women, postmenopausal women and men.
Figure 1.
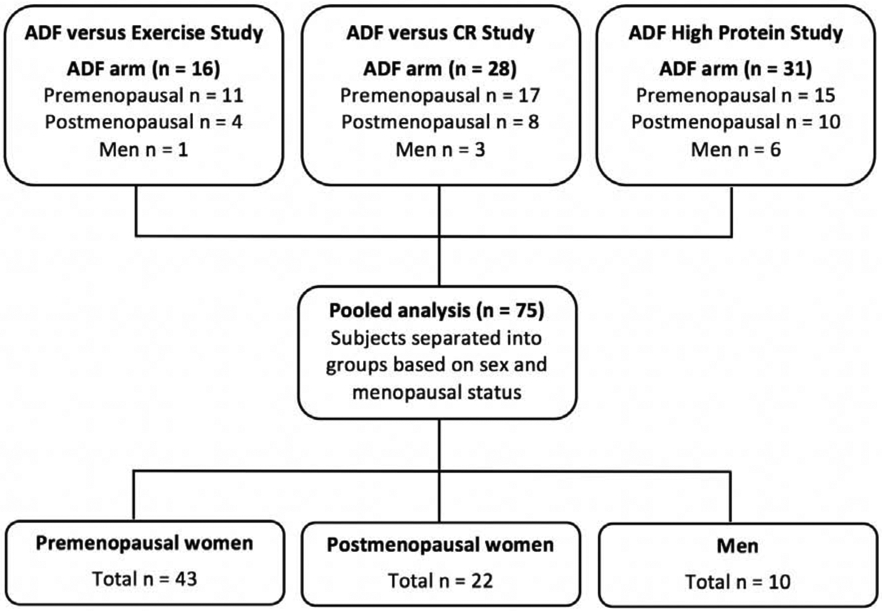
Subject flow chart: Pooled analysis
Table 1.
Baseline characteristics
| Characteristic | Premenopausal Women |
Postmenopausal Women |
Men | P-value |
|---|---|---|---|---|
| n | 43 | 22 | 10 | |
| Age (y) | 43 ± 9 a | 55 ± 6 b | 45 ± 11 a | <0.001 |
| Race or ethnic group | ||||
| White | 6 (14%) | 5 (23%) | 2 (20%) | 0.43 |
| Black | 27 (63%) | 11 (50%) | 5 (50%) | |
| Asian | 2 (5%) | 1 (5%) | 1 (10%) | |
| Hispanic | 8 (19%) | 5 (23%) | 2 (20%) | |
| Other | 0 (0%) | 0 (0%) | 0 (0%) | |
| Body weight and composition | ||||
| Body weight (kg) | 97 ± 15 a | 87 ± 11 b | 110 ± 19 c | 0.001 |
| Height (cm) | 165 ± 17 a | 161 ± 7 a | 177 ± 6 b | 0.01 |
| Body-mass index (kg/m2) | 36 ± 6 | 34 ± 4 | 35 ± 6 | 0.06 |
Values are expressed as means ± SD.
P value: One-way ANOVA with Tukey’s post-hoc test for continuous variables (means not sharing a common letter are significantly different). McNemar test for categorical variables.
Body weight and adherence to ADF in women versus men
Body weight significantly decreased from baseline in premenopausal women (−4.6 ± 3.2%), postmenopausal women (−6.5 ± 3.2%) and men (−6.2 ± 4.4%) by week 12 (main effect of time, P < 0.001) (Figure 2A). There were no significant differences between groups for weight loss (no group × time interaction). Adherence to the fast day calorie goal is reported in Figure 2B. On fast days, actual energy intake was significantly higher than prescribed in all groups, with no differences between groups (no group × time interaction). Specifically, premenopausal women ate an average of 447 ± 516 kcal/d more (P = 0.01) than prescribed on fast days by week 12. Postmenopausal women ate an average of 389 ± 357 kcal/d more (P = 0.01) than prescribed and men ate 470 ± 552 kcal/d more (P = 0.01) than prescribed on fast days by week 12.
Figure 2. Weight loss and dietary adherence.
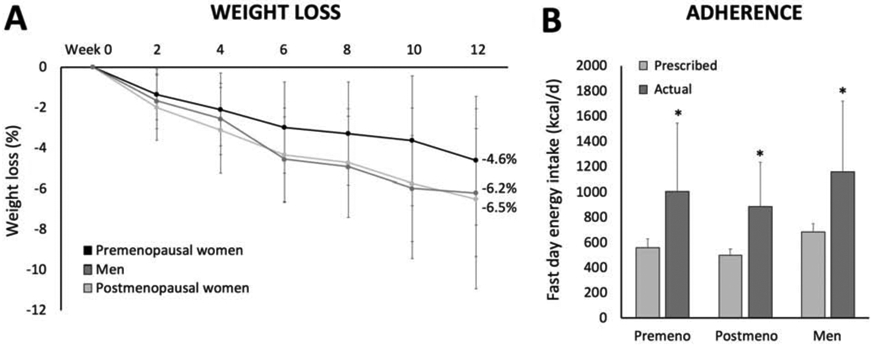
Values are expressed as means ± SD. A. Body weight significantly decreased from baseline in premenopausal women, postmenopausal women and men by week 12 (main effect of time, P < 0.001), with no difference between groups (no group × time interaction). B. Actual energy intake on the fast day was significantly greater (P < 0.01) than prescribed for premenopausal women, postmenopausal women, and men, with no difference between groups.
Metabolic risk factor changes by ADF in women versus men
Metabolic disease risk factors are reported in Table 2. Body weight, BMI, fat mass and lean mass significantly decreased from baseline to week 12 for premenopausal women, postmenopausal women, and men (main effect of time, P < 0.001 for all comparisons), with no differences between groups (no group × time interaction). Glucose remained unchanged over the course of the trial in all groups. Fasting insulin and HOMA-IR (measure of insulin resistance) significantly decreased (main effect of time, P = 0.02) in all groups, with no differences between groups (no group × time interaction). LDL cholesterol decreased in all groups (main effect of time, P = 0.004), but postmenopausal women experienced greater decreases versus premenopausal women (group × time interaction, P = 0.01). HDL cholesterol and triglycerides remained unchanged in all groups. Significant reductions were noted for systolic blood pressure (main effect of time, P = 0.007) and diastolic blood pressure (main effect of time, P <0.001) in premenopausal women, postmenopausal women and men, with no significant differences between groups (no group × time interaction). Heart rate remained unchanged in all groups by week 12.
Table 2.
Metabolic disease risk factors
| Variables | Premenopausal (n = 43) |
Postmenopausal (n = 22) |
Men (n = 10) |
P-value Time |
P-value Group × Time |
|||
|---|---|---|---|---|---|---|---|---|
| Baseline | Week 12 | Baseline | Week 12 | Baseline | Week 12 | |||
| Body weight (kg) | 97 ± 15 | 92 ± 15 | 87 ± 11 | 81 ± 10 | 110 ± 19 | 104 ± 19 | <0.001 | 0.26 |
| BMI (kg/m2) | 36 ± 6 | 35 ± 6 | 34 ± 4 | 32 ± 3 | 35 ± 6 | 33 ± 6 | <0.001 | 0.33 |
| Fat mass (kg) | 45 ± 11 | 42 ± 11 | 38 ± 7 | 34 ± 7 | 40 ± 15 | 35 ± 14 | <0.001 | 0.21 |
| Lean mass (kg) | 50 ± 7 | 48 ± 7 | 47 ± 6 | 45 ± 5 | 67 ± 9 | 66 ± 9 | <0.001 | 0.30 |
| Glucose (mg/dl) | 92 ± 12 | 92 ± 10 | 92 ± 10 | 94 ± 10 | 96 ± 15 | 93 ± 10 | 0.63 | 0.33 |
| Insulin (μlU/mL) | 18 ± 14 | 13 ± 9 | 11 ± 4 | 9 ± 5 | 20 ± 7 | 15 ± 8 | 0.02 | 0.26 |
| HOMA-IR | 4.1 ± 3.7 | 3.0 ± 2.2 | 2.5 ± 1.1 | 2.1 ± 1.1 | 4.7 ± 1.7 | 3.4 ± 2.1 | 0.02 | 0.27 |
| LDL chol. (mg/dl) | 107 ± 33 | 108 ± 34 a | 129 ± 27 | 116 ± 28 b | 120 ± 26 | 107 ± 25 ab | 0.004 | 0.01 |
| HDL chol. (mg/dl) | 56 ± 14 | 55 ± 12 | 61 ± 14 | 56 ± 14 | 48 ± 8 | 46 ± 8 | 0.06 | 0.52 |
| Triglycerides (mg/dl) | 90 ± 51 | 94 ± 46 | 120 ± 55 | 108 ± 53 | 136 ± 76 | 124 ± 56 | 0.30 | 0.31 |
| Systolic BP (mm Hg) | 124 ± 17 | 121 ± 18 | 125 ± 15 | 117 ± 14 | 125 ± 8 | 119 ± 13 | 0.007 | 0.39 |
| Diastolic BP (mm Hg) | 83 ± 14 | 80 ± 11 | 85 ± 12 | 76 ± 10 | 91 ± 22 | 85 ± 20 | <0.001 | 0.16 |
| Heart rate (bpm) | 76 ± 12 | 74 ± 10 | 70 ± 8 | 68 ± 9 | 74 ± 7 | 76 ± 10 | 0.87 | 0.51 |
Values are expressed as means ± SD. BP: Blood pressure, HOMA-IR: Homeostatic Model Assessment-Insulin Resistance.
P-value: Repeated measures ANOVA with groups (premenopausal women, postmenopausal women and men) as the between-subject factor and time (baseline and week 12) as the within-subject factor. Means not sharing a common letter are significantly different (group × time interaction).
Dietary intake and physical activity during ADF in women versus men
Dietary intake and physical activity are reported in Table 3. Energy intake decreased significantly on the feast day (main effect of time, P = 0.01) and fast day (main effect of time, P = 0.01), versus baseline, in all groups by week 12. There were no differences between groups for energy intake on feast days or fast days at week 12 (no group × time interaction). Percent energy from protein, carbohydrates and fat remained unchanged from baseline to week 12 in all groups. Similarly, intake of cholesterol and fiber did not change over the course of the trial. Physical activity (measured as steps/d) significantly increased (main effect of time, p = 0.004) from baseline to week 12 in premenopausal women, postmenopausal women, and men, with no difference between groups.
Table 3.
Dietary intake and physical activity
| Variable | Premenopausal women (n = 43) |
Postmenopausal women (n = 22) |
Men (n = 10) |
||||||
|---|---|---|---|---|---|---|---|---|---|
| Baseline | Week 12 Feast day |
Week 12 Fast day |
Baseline | Week 12 Feast day |
Week 12 Fast day |
Baseline | Week 12 Feast day |
Week 12 Fast day |
|
| Energy (kcal) | 1919 ± 868 | 1512 ± 479* | 1005 ± 536* | 2008 ± 1113 | 1464 ± 377* | 885 ±345* | 1868 ± 580 | 1653 ± 389* | 1154 ± 563* |
| Protein (% kcal) | 17 ± 5 | 20 ± 8 | 23 ± 12 | 18 ± 13 | 24 ± 9 | 30 ± 12 | 25 ± 14 | 30 ± 5 | 32 ± 9 |
| Carbohydrates (% kcal) | 45 ± 10 | 44 ± 12 | 45 ± 13 | 48 ± 14 | 42 ± 13 | 36 ± 14 | 44 ± 12 | 40 ± 10 | 37 ± 12 |
| Fat (% kcal) | 38 ± 10 | 36 ± 10 | 32 ± 11 | 34 ± 13 | 34 ± 6 | 34 ± 6 | 31 ± 11 | 30 ± 5 | 31 ± 5 |
| Cholesterol (mg) | 282 ± 146 | 247 ± 134 | -- | 263 ± 195 | 248 ± 163 | -- | 445 ± 214 | 315 ± 91 | -- |
| Fiber (g) | 16 ± 8 | 12 ± 5 | 9 ± 3 | 17 ± 5 | 13 ± 5 | 8 ± 4 | 21 ± 5 | 13 ± 8 | 12 ± 8 |
| Steps/d | 5998±2356 | 7162±3420* | -- | 7464±3532 | 8473±3496* | -- | 6472 ±3240 | 8987±4596* | -- |
Values are expressed as means ± SD.
Main effect of time (baseline versus week 12), repeated measures ANOVA.
No group × time interaction for any parameter.
Discussion
Results from this pooled analysis demonstrate that premenopausal women, postmenopausal women, and men lose similar amounts of weight (~5-6%) during short-term ADF (12-weeks). Adherence to ADF was suboptimal in all groups, with each group eating 400-500 kcal more than prescribed on the fast day. Reductions in fat mass, lean mass, fasting insulin, insulin resistance and blood pressure did not vary according to sex or menopausal status. The only variable that differed across groups was LDL cholesterol, with postmenopausal women observing greater decreases when compared to premenopausal women.
Contrary to our hypothesis, postmenopausal women did not lose greater amounts of weight during ADF when compared to premenopausal women and men. We formulated our initial hypothesis based on data showing that postmenopausal women lost twice as much weight (12%) as premenopausal women (6%) after 24-weeks of ADF [17]. Interestingly, these significant differences were not observed in the present study which ran for a shorter duration (12-weeks). It is possible, however, that these differences would only become significant over longer periods of intermittent fasting (>24 weeks). Alternatively, it is likely that our study was not adequately powered to detect differences between these groups. The postmenopausal women lost ~2% more body weight than premenopausal women by week 12. However, due to small sample sizes and high variability, differences between these groups of women were not significant. Larger and longer-term studies that specifically examine whether menopausal status influences weight loss during fasting will be required to answer this important question.
The degree of weight loss achieved with ADF also did not vary between men and women. In the present study, both sexes lost 5-6% of body weight after 12 weeks of fasting. In a recent review [21], the effectiveness of dietary weight loss interventions was compared between male and female participants. Results reveal that men lost more absolute weight than women with daily calorie restriction (7.0 kg versus 5.3 kg, respectively) over 12 weeks [21]. However, when these weight changes were expressed as percentages, i.e. taking into consideration baseline body weight, weight loss was not significantly different between men and women (6.2% versus 5.0%, respectively) [21]. Only one study [18] to date has compared body weight changes between sexes during intermittent fasting. After 8 weeks of ADF, similar degrees of weight loss were achieved by male and female participants (4.6% versus 4.2%, respectively) [18]. Though findings are still limited, it would appear as though men and women achieve similar weight loss with short-term intermittent fasting.
Reductions in fat mass and lean mass by ADF did not differ between postmenopausal and premenopausal women. Menopause is associated with a redistribution of adipose tissue from subcutaneous to visceral fat depots [22, 23]. The rapid fall in levels of estrogen and sex-hormone binding globulin (SHBG) contribute to these body composition changes [22, 23]. It has been postulated that these groups of women may react differently to weight loss interventions due to hormonal changes that occur during menopause. Surprisingly, however, no study to date has directly compared the weight loss efficacy of any dietary intervention in postmenopausal versus premenopausal women. Though several randomized controlled trials have been performed in either premenopausal [24-26] or postmenopausal women [27-29], to our knowledge, a head to head comparison has not yet been made. As such, how changes in body composition vary according to menopausal status during periods of dietary restriction, remains largely unknown. In contrast, several studies have compared these endpoints between male and female participants. In a recent large-scale (n = 2500) multinational study [30], it was shown that men lost more fat mass and retained more lean mass than women during 8 weeks of a very low-calorie diet. Contrary to these findings, other clinical trials [31, 32] and a systematic review [33] have shown no differences between sexes for body composition changes during periods of weight loss. Thus, there is still no consensus on whether body composition changes during periods of energy restriction are sex-specific.
Dietary adherence was suboptimal in all groups. On the fast days, participants were instructed to consume approximately 500-600 kcal/d. However, throughout the trial, both men and women were eating an extra 400-500 kcal/d more than prescribed. As such, fast day energy intake was closer to 1000 kcal/d in all groups. However, it is possible that the participants were consuming closer to the prescribed number of calories on fast days at the beginning of the study, and then this level of adherence slowly diminished throughout the 12-week trial. Unfortunately, we did not assess dietary intake on a weekly basis, so this assumption is difficult to verify. If the subjects were adherent with the fast day calorie goal (500-600 kcal), it is estimated that the total weight loss would have been closer to ~9% by the end of the trial. This poor level of adherence to ADF has been reported in several other recent trials [10, 12, 34]. We originally hypothesized that postmenopausal women would be more compliant with the ADF protocol, which would in turn yield greater weight loss in this group. It has been postulated that postmenopausal women may have better adherence to weight loss interventions since they may have more spare time, when compared to premenopausal women [26, 35]. Postmenopausal women are less likely to still be caring for small children, which can be very time consuming. It has also been hypothesized that postmenopausal women are more likely to know what diets work best for them, since they have had more time, than their younger counterparts, to experiment with different weight loss approaches. All of these factors could contribute to better weight loss success. However, these assumptions did not appear to influence the degree of weight loss achieved by these women in the present study.
Insulin resistance was reduced similarly in premenopausal women (−27%), postmenopausal women (−16%) and men (−28%) after 12 weeks of ADF. Evidence suggests that female sex is associated with greater insulin sensitivity due to higher circulating levels of estrogen [36]. The mechanisms by which estrogen may improve insulin sensitivity include: enhancing glucose transport to the muscle [37], decreasing hepatic glucose production [38], and protecting pancreatic beta-cell function and survival [39]. Adipose tissue distribution also plays a role. Men typically have greater visceral fat mass, compared to women, which is associated with lower whole-body insulin sensitivity [40]. Though the underlying mechanisms have been defined, the effects of sex on insulin sensitivity during periods of weight loss are less clear. While the majority of studies report no sex-based differences in insulin resistance with weight loss [30, 41, 42], a recent trial reported greater improvements in women [36]. Findings from these clinical trials are difficult to compare, however, as some studies did not separate premenopausal from postmenopausal women, and the contribution of visceral fat mass loss was not assessed. Nevertheless, findings to date appear to show little influence of sex or menopausal status on changes in insulin sensitivity with weight loss.
Sex differences in plasma lipids were also assessed. LDL cholesterol levels decreased more in postmenopausal women compared to premenopausal women. This effect may be due, in part, to the slightly greater weight loss experienced by postmenopausal (6.5%) versus premenopausal women (4.6%). In addition, postmenopausal women had higher levels of LDL cholesterol at baseline (129 mg/dl) when compared to the premenopausal women (107 mg/dl). Since the premenopausal women were already in the healthy range for LDL cholesterol at baseline [43], it is not surprising that this lipid parameter was not further improved. As for HDL cholesterol levels, no differences were noted between male and female participants after 12 weeks of ADF. This is surprising as women have been shown to experience greater reductions in HDL cholesterol versus men after periods of weight loss [44, 45]. Lower levels of HDL cholesterol in women have been correlated to rapid decreases in subcutaneous fat in the femoral and gluteal regions [45]. It should be noted, however, that the studies which demonstrate these sex-based differences ran for longer durations (24-weeks) and achieved greater weight loss (>8%), than the present study. Since our study was shorter (12 weeks) and yielded less weight loss, (~5-6%), this could explain why no differences in HDL cholesterol were noted between males and females.
This secondary analysis has several limitations. First, the study included very few men (n = 10). The small number of male participants may have limited our power to detect significant differences between groups. Second, the study was short (12-weeks). It is possible that if the trials were longer (>24 weeks) significant differences in weight loss between groups would have been detected. Third, we used food records to quantify adherence with the ADF diets. It is well known that individuals with obesity underreport energy intake by 20–40% in food logs. Thus, our adherence and energy intake data are most likely inaccurate. Fourth, we did not assess other key determinants of weight loss, including education level, employment status, income level, marriage status, etc. The variables play an important part in an individual’s weight loss success, and may have confounded the present analysis. Fifth, changes in visceral fat mass between groups was not assessed. Visceral fat mass plays a key role in insulin resistance and lipid metabolism, and should be measured in future trials with similar objectives.
In summary, our pooled analysis reveals that premenopausal women, postmenopausal women, and men achieve comparable weight loss (5-6%) and body composition changes with short-term of ADF. We also show that key metabolic risk factors, such as fasting insulin, insulin resistance, and blood pressure, improve similarly in each of these groups. LDL cholesterol was reduced to a greater extent in postmenopausal women, suggesting that ADF may confer added cardio-protection in this group of women. Taken together, these findings suggest that the weight loss and metabolic benefits of ADF do not generally vary according to sex or menopausal status. These findings may help clinicians to decide which population groups benefit most from an ADF approach.
Highlights.
This study examined if the weight loss efficacy of ADF differs between women and men.
Results show that women and men lose similar amounts of weight (~5-6%) with ADF.
Pre and postmenopausal women lose similar amounts of weight (~5-7%) with ADF.
Thus, the weight loss efficacy of ADF does not vary according to sex or menopausal status.
Acknowledgments
We would like to thank the participants for their time and effort in participating in the clinical trials.
Funding: NIH (NHLBI) R01HL106228, Nestle Health Sciences, AHA 12PRE8350000
Footnotes
Disclosure: KAV has a consulting relationship with the sponsor of the research, Nestle Health Sciences. The other authors have no conflicts of interest to disclose.
Trial registration: Clinicaltrials.gov, NCT00960505; NCT03528317.
Publisher's Disclaimer: This is a PDF file of an unedited manuscript that has been accepted for publication. As a service to our customers we are providing this early version of the manuscript. The manuscript will undergo copyediting, typesetting, and review of the resulting proof before it is published in its final form. Please note that during the production process errors may be discovered which could affect the content, and all legal disclaimers that apply to the journal pertain.
References
- [1].de Cabo R, Mattson MP. Effects of Intermittent Fasting on Health, Aging, and Disease. N Engl J Med. 2019;381:2541–51. [DOI] [PubMed] [Google Scholar]
- [2].Patterson RE, Sears DD. Metabolic Effects of Intermittent Fasting. Annu Rev Nutr. 2017;37:371–93. [DOI] [PubMed] [Google Scholar]
- [3].Bhutani S, Klempel MC, Kroeger CM, Trepanowski JF, Varady KA. Alternate day fasting and endurance exercise combine to reduce body weight and favorably alter plasma lipids in obese humans. Obesity (Silver Spring). 2013;21:1370–9. [DOI] [PubMed] [Google Scholar]
- [4].Catenacci VA, Pan Z, Ostendorf D, Brannon S, Gozansky WS, Mattson MP, et al. A randomized pilot study comparing zero-calorie alternate-day fasting to daily caloric restriction in adults with obesity. Obesity (Silver Spring). 2016;24:1874–83. [DOI] [PMC free article] [PubMed] [Google Scholar]
- [5].Eshghinia S, Mohammadzadeh F. The effects of modified alternate-day fasting diet on weight loss and CAD risk factors in overweight and obese women. J Diabetes Metab Disord. 2013;12:4. [DOI] [PMC free article] [PubMed] [Google Scholar]
- [6].Heilbronn LK, Civitarese AE, Bogacka I, Smith SR, Hulver M, Ravussin E. Glucose tolerance and skeletal muscle gene expression in response to alternate day fasting. Obes Res. 2005;13:574–81. [DOI] [PubMed] [Google Scholar]
- [7].Hoddy KK, Kroeger CM, Trepanowski JF, Barnosky A, Bhutani S, Varady KA. Meal timing during alternate day fasting: Impact on body weight and cardiovascular disease risk in obese adults. Obesity (Silver Spring). 2014;22:2524–31. [DOI] [PubMed] [Google Scholar]
- [8].Hutchison AT, Liu B, Wood RE, Vincent AD, Thompson CH, O'Callaghan NJ, et al. Effects of Intermittent Versus Continuous Energy Intakes on Insulin Sensitivity and Metabolic Risk in Women with Overweight. Obesity (Silver Spring). 2019;27:50–8. [DOI] [PubMed] [Google Scholar]
- [9].Johnson JB, Summer W, Cutler RG, Martin B, Hyun DH, Dixit VD, et al. Alternate day calorie restriction improves clinical findings and reduces markers of oxidative stress and inflammation in overweight adults with moderate asthma. Free Radic Biol Med. 2007;42:665–74. [DOI] [PMC free article] [PubMed] [Google Scholar]
- [10].Kalam F, Gabel K, Cienfuegos S, Wiseman E, Ezpeleta M, Steward M, et al. Alternate day fasting combined with a low-carbohydrate diet for weight loss, weight maintenance, and metabolic disease risk reduction. Obes Sci Pract. 2019;5:531–9. [DOI] [PMC free article] [PubMed] [Google Scholar]
- [11].Klempel MC, Kroeger CM, Varady KA. Alternate day fasting (ADF) with a high-fat diet produces similar weight loss and cardio-protection as ADF with a low-fat diet. Metabolism. 2013;62:137–43. [DOI] [PubMed] [Google Scholar]
- [12].Trepanowski JF, Kroeger CM, Barnosky A, Klempel MC, Bhutani S, Hoddy KK, et al. Effect of Alternate-Day Fasting on Weight Loss, Weight Maintenance, and Cardioprotection Among Metabolically Healthy Obese Adults: A Randomized Clinical Trial. JAMA Intern Med. 2017;177:930–8. [DOI] [PMC free article] [PubMed] [Google Scholar]
- [13].Varady KA, Bhutani S, Church EC, Klempel MC. Short-term modified alternate-day fasting: a novel dietary strategy for weight loss and cardioprotection in obese adults. Am J Clin Nutr. 2009;90:1138–43. [DOI] [PubMed] [Google Scholar]
- [14].Varady KA, Bhutani S, Klempel MC, Kroeger CM, Trepanowski JF, Haus JM, et al. Alternate day fasting for weight loss in normal weight and overweight subjects: a randomized controlled trial. Nutr J. 2013;12:146. [DOI] [PMC free article] [PubMed] [Google Scholar]
- [15].Bowen J, Brindal E, James-Martin G, Noakes M. Randomized Trial of a High Protein, Partial Meal Replacement Program with or without Alternate Day Fasting: Similar Effects on Weight Loss, Retention Status, Nutritional, Metabolic, and Behavioral Outcomes. Nutrients. 2018;10. [DOI] [PMC free article] [PubMed] [Google Scholar]
- [16].Gabel K, Kroeger CM, Trepanowski JF, Hoddy KK, Cienfuegos S, Kalam F, et al. Differential Effects of Alternate-Day Fasting Versus Daily Calorie Restriction on Insulin Resistance. Obesity (Silver Spring). 2019;27:1443–50. [DOI] [PMC free article] [PubMed] [Google Scholar]
- [17].Barnosky A, Kroeger CM, Trepanowski JF, Klempel MC, Bhutani S, Hoddy KK, et al. Effect of alternate day fasting on markers of bone metabolism: An exploratory analysis of a 6-month randomized controlled trial. Nutr Healthy Aging. 2017;4:255–63. [DOI] [PMC free article] [PubMed] [Google Scholar]
- [18].Varady KA, Hoddy KK, Kroeger CM, Trepanowski JF, Klempel MC, Barnosky A, et al. Determinants of weight loss success with alternate day fasting. Obes Res Clin Pract. 2016;10:476–80. [DOI] [PubMed] [Google Scholar]
- [19].Harlow SD, Gass M, Hall JE, Lobo R, Maki P, Rebar RW, et al. Executive summary of the Stages of Reproductive Aging Workshop + 10: addressing the unfinished agenda of staging reproductive aging. J Clin Endocrinol Metab. 2012;97:1159–68. [DOI] [PMC free article] [PubMed] [Google Scholar]
- [20].Solomon CG, Hu FB, Dunaif A, Rich-Edwards J, Willett WC, Hunter DJ, et al. Long or highly irregular menstrual cycles as a marker for risk of type 2 diabetes mellitus. JAMA. 2001;286:2421–6. [DOI] [PubMed] [Google Scholar]
- [21].Williams RL, Wood LG, Collins CE, Callister R. Effectiveness of weight loss interventions--is there a difference between men and women: a systematic review. Obes Rev. 2015;16:171–86. [DOI] [PMC free article] [PubMed] [Google Scholar]
- [22].Chopra S, Sharma KA, Ranjan P, Malhotra A, Vikram NK, Kumari A. Weight Management Module for Perimenopausal Women: A Practical Guide for Gynecologists. J Midlife Health. 2019;10:165–72. [DOI] [PMC free article] [PubMed] [Google Scholar]
- [23].Kozakowski J, Gietka-Czernel M, Leszczynska D, Majos A. Obesity in menopause - our negligence or an unfortunate inevitability? Prz Menopauzalny. 2017;16:61–5. [DOI] [PMC free article] [PubMed] [Google Scholar]
- [24].Gardner CD, Kiazand A, Alhassan S, Kim S, Stafford RS, Balise RR, et al. Comparison of the Atkins, Zone, Ornish, and LEARN diets for change in weight and related risk factors among overweight premenopausal women: the A TO Z Weight Loss Study: a randomized trial. JAMA. 2007;297:969–77. [DOI] [PubMed] [Google Scholar]
- [25].Harvie MN, Pegington M, Mattson MP, Frystyk J, Dillon B, Evans G, et al. The effects of intermittent or continuous energy restriction on weight loss and metabolic disease risk markers: a randomized trial in young overweight women. Int J Obes (Lond). 2011;35:714–27. [DOI] [PMC free article] [PubMed] [Google Scholar]
- [26].Simkin-Silverman LR, Wing RR, Boraz MA, Kuller LH. Lifestyle intervention can prevent weight gain during menopause: results from a 5-year randomized clinical trial. Ann Behav Med. 2003;26:212–20. [DOI] [PubMed] [Google Scholar]
- [27].Imayama I, Ulrich CM, Alfano CM, Wang C, Xiao L, Wener MH, et al. Effects of a caloric restriction weight loss diet and exercise on inflammatory biomarkers in overweight/obese postmenopausal women: a randomized controlled trial. Cancer Res. 2012;72:2314–26. [DOI] [PMC free article] [PubMed] [Google Scholar]
- [28].Seimon RV, Wild-Taylor AL, Keating SE, McClintock S, Harper C, Gibson AA, et al. Effect of Weight Loss via Severe vs Moderate Energy Restriction on Lean Mass and Body Composition Among Postmenopausal Women With Obesity: The TEMPO Diet Randomized Clinical Trial. JAMA Netw Open. 2019;2:e1913733. [DOI] [PMC free article] [PubMed] [Google Scholar]
- [29].van Gemert WA, Peeters PH, May AM, Doornbos AJH, Elias SG, van der Palen J, et al. Effect of diet with or without exercise on abdominal fat in postmenopausal women - a randomised trial. BMC Public Health. 2019;19:174. [DOI] [PMC free article] [PubMed] [Google Scholar]
- [30].Christensen P, Meinert Larsen T, Westerterp-Plantenga M, Macdonald I, Martinez JA, Handjiev S, et al. Men and women respond differently to rapid weight loss: Metabolic outcomes of a multi-centre intervention study after a low-energy diet in 2500 overweight, individuals with pre-diabetes (PREVIEW). Diabetes Obes Metab. 2018;20:2840–51. [DOI] [PMC free article] [PubMed] [Google Scholar]
- [31].Arciero PJ, Edmonds R, He F, Ward E, Gumpricht E, Mohr A, et al. Protein-Pacing Caloric-Restriction Enhances Body Composition Similarly in Obese Men and Women during Weight Loss and Sustains Efficacy during Long-Term Weight Maintenance. Nutrients. 2016;8. [DOI] [PMC free article] [PubMed] [Google Scholar]
- [32].Gasteyger C, Larsen TM, Vercruysse F, Pedersen D, Toubro S, Astrup A. Visceral fat loss induced by a low-calorie diet: a direct comparison between women and men. Diabetes Obes Metab. 2009;11:596–602. [DOI] [PubMed] [Google Scholar]
- [33].Chaston TB, Dixon JB, O'Brien PE. Changes in fat-free mass during significant weight loss: a systematic review. Int J Obes (Lond). 2007;31:743–50. [DOI] [PubMed] [Google Scholar]
- [34].Wegman MP, Guo MH, Bennion DM, Shankar MN, Chrzanowski SM, Goldberg LA, et al. Practicality of intermittent fasting in humans and its effect on oxidative stress and genes related to aging and metabolism. Rejuvenation Res. 2015;18:162–72. [DOI] [PMC free article] [PubMed] [Google Scholar]
- [35].Jull J, Stacey D, Beach S, Dumas A, Strychar I, Ufholz LA, et al. Lifestyle interventions targeting body weight changes during the menopause transition: a systematic review. J Obes. 2014;2014:824310. [DOI] [PMC free article] [PubMed] [Google Scholar]
- [36].Mauvais-Jarvis F. Menopause, Estrogens, and Glucose Homeostasis in Women. Adv Exp Med Biol. 2017;1043:217–25. [DOI] [PubMed] [Google Scholar]
- [37].Rincon J, Holmang A, Wahlstrom EO, Lonnroth P, Bjorntorp P, Zierath JR, et al. Mechanisms behind insulin resistance in rat skeletal muscle after oophorectomy and additional testosterone treatment. Diabetes. 1996;45:615–21. [DOI] [PubMed] [Google Scholar]
- [38].Matute ML, Kalkhoff RK. Sex steroid influence on hepatic gluconeogenesis and glucogen formation. Endocrinology. 1973;92:762–8. [DOI] [PubMed] [Google Scholar]
- [39].Louet JF, LeMay C, Mauvais-Jarvis F. Antidiabetic actions of estrogen: insight from human and genetic mouse models. Curr Atheroscler Rep. 2004;6:180–5. [DOI] [PubMed] [Google Scholar]
- [40].de Mutsert R, Gast K, Widya R, de Koning E, Jazet I, Lamb H, et al. Associations of Abdominal Subcutaneous and Visceral Fat with Insulin Resistance and Secretion Differ Between Men and Women: The Netherlands Epidemiology of Obesity Study. Metab Syndr Relat Disord. 2018;16:54–63. [DOI] [PubMed] [Google Scholar]
- [41].Wang TN, Chang W, Chiu YW, Lee CY, Lin KD Relationships between changes in leptin andinsulin resistance levels in obese individualsfollowing weight loss. J of Medical Sciences. 2013;29:436–43. [DOI] [PMC free article] [PubMed] [Google Scholar]
- [42].Luscombe-Marsh ND, Noakes M, Wittert GA, Keogh JB, Foster P, Clifton PM. Carbohydrate-restricted diets high in either monounsaturated fat or protein are equally effective at promoting fat loss and improving blood lipids. Am J Clin Nutr. 2005;81:762–72. [DOI] [PubMed] [Google Scholar]
- [43].Grundy SM, Stone NJ. 2018 American Heart Association/American College of Cardiology/Multisociety Guideline on the Management of Blood Cholesterol-Secondary Prevention. JAMA Cardiol. 2019;4:589–91. [DOI] [PubMed] [Google Scholar]
- [44].Romero-Moraleda B, Peinado Lozano AB, Morencos Martinez E, Lopez-Plaza B, Gomez Candela C, Calderon Montero FJ, et al. Lipid profile response to weight loss program in overweight and obese patient is related with gender and age. Nutr Hosp. 2015;31:2455–64. [DOI] [PubMed] [Google Scholar]
- [45].Yatsuya H, Jeffery RW, Erickson DJ, Welsh EM, Flood AP, Jaeb MA, et al. Sex-specific HDL cholesterol changes with weight loss and their association with anthropometric variables: the LIFE study. Obesity (Silver Spring). 2011;19:429–35. [DOI] [PMC free article] [PubMed] [Google Scholar]