

Abstract
Background:
Prenatal alcohol exposure (PAE) has been identified as one of the leading preventable causes of developmental disabilities but early identification of those impacted has been challenging. This study evaluated the use of infant cardiac orienting responses (CORs), which assess neurophysiological encoding of environmental events and are sensitive to the impact of PAE, to predict later Fetal Alcohol Spectrum Disorder (FASD) status.
Methods:
Mother-infant dyads from Ukraine were recruited during pregnancy based on the mother’s use of alcohol. Participants (n = 120) were then seen at 6 and 12 months when CORs were collected and in the preschool period when they were categorized as having (1) fetal alcohol syndrome (FAS), (2) partial FAS (pFAS), (3) alcohol-related neurodevelopmental disorder (ARND), (4) PAE and no diagnosis, or (5) no PAE and no diagnosis. To assess CORs, stimuli (auditory tones and pictures) were presented using a fixed-trial habituation/dishabituation paradigm. Heart rate (HR) responses were aggregated across the first 3 habituation and dishabituation trials and converted to z-scores relative to the sample’s mean response at each second by stimuli. Z-scores greater than 1 were then counted by condition (habituation or dishabituation) to compute a total risk index.
Results:
Significant group differences were found on total deviation scores of the CORs elicited from visual but not auditory stimuli. Those categorized as pFAS/FAS had significantly higher total deviation scores than did those categorized as ARND or as having no alcohol-related diagnosis with or without a history of PAE. Receiver operating characteristic curve analysis of the visual response yielded an area under the curve value of .765 for predicting to pFAS/FAS status.
Conclusions:
A score reflecting total deviation from typical HR during CORs elicited using visual stimuli in infancy may be useful in identifying individuals who need early intervention as a result of their PAE.
Keywords: Fetal alcohol spectrum disorders, information processing, early identification
INTRODUCTION
Prenatal alcohol exposure (PAE) has been identified as one of the leading preventable causes of developmental disabilities but early identification of those impacted has been challenging. PAE impacts the developing brain by altering the overall size, cytoarchitecture, function, and connectivity (Ashwell and Zhang, 1996, Wilhelm and Guizzetti, 2015, Moore et al., 2014, Lebel et al., 2011, Coles and Li, 2011), resulting in complex neurobehavioral impairments that have the potential, if untreated, to impact the quality of life of affected individuals throughout their lifespan (Kable et al., 2016b). Recent findings have indicated that as many as 2–5% of first-graders in the U.S. are affected by PAE (May et al., 2018) but most alcohol-affected individuals are misdiagnosed or their diagnosis is completely missed (Chasnoff et al., 2015). This is particularly true of infants and toddlers where identification of neurobehavioral impairment is also limited by the poor sensitivity of the clinical assessment tools (Bornstein and Krasnegor, 1989) that are available for assessing alcohol-related neurobehavioral impairment.
Identifying early biomarkers of prenatal alcohol-related brain damage is an important step in improving our identification of individuals negatively impacted by PAE as such biomarkers could serve to improve identification and accessing early intervention services to maximize the neuroplasticity associated with the rapid brain maturation that occurs in the first few years of life (Fox et al., 2010). One such biomarker is the cardiac orienting response (COR), which can be collected as early as 4–6 months of age. CORs have been sensitive to the impact of PAE in human (Kable and Coles, 2004, Kable et al., 2016a, Kable et al., 2015) and preclinical models of exposure (Hunt and Phillips, 2004, Morasch and Hunt, 2009). They enable oxygen to be gated to the central nervous system and away from the periphery increasing the brain’s oxygen supply needed for more advanced processing of information and learning (Sokolov, 2002). CORs are characterized by a specific pattern of heart rate (HR) deceleration (Graham and Jackson, 1970) in the presence of novel or interesting stimuli with the trough reflecting the degree of neurophysiological encoding and sustained interest to the stimuli (Richards, 1995). In humans, CORs collected in the first 6-months of life have been found in response to the onset of a variety of stimuli (Berg et al., 1971, Brown et al., 1977, Lewis et al., 1966) and to be predictive of later neurodevelopmental status (O’Connor, 1980, O’Connor et al., 1984). Electrical stimulation of the medial prefrontal cortex in preclinical studies has resulted in a COR in the absence of external stimulation (Powell et al., 1994) with the signal traveling to the thalamus and then to the heart via the 10th cranial nerve. These responses can provide an early index of the efficiency of the neural circuitry that gates energy resources between basic attention and arousal systems needed to effectively process information (Ruff and Rothbart, 1996) and may provide an early estimate of altered brain functioning that could be used to identify alcohol-affected individuals in need of early intervention services.
The predictive validity of CORs was evaluated in two studies using machine learning models in the Ukrainian cohort from which the participants were sampled for this study. The first study (Mesa et al., 2017b) established that each post-second second HR value and key features of the COR, including the speed of the response and the average HR during the trough phase, were predictive of 12-month neurodevelopmental outcome on standardized testing. In the subsequent study, the predictive validity of CORs obtained at both 6 and 12 months was assessed relative to their preschool cognitive status, indicating that the combination of both CORs and standardized testing at 6 months resulted in a negative predictive value, reflecting the number of true negatives relative to negative results, of 84% and a positive predictive value, reflecting the number of true positives relative to positive results, of 64% (Mesa et al., 2017a). In other words, 64% of the time when the model predicted delay, the preschooler was delayed and 84% of the time when the infant screened normal, they would be normal as a preschooler. Ideally, screening instruments identify those who are in need of further testing and exclude those who do not need these resources. As a screening tool, CORs are able to effectively delineate those who are less likely to need expensive habilitative care, follow-up or monitoring services, thereby permitting targeting of these resources very early in development to those most at risk. In addition, a negative screen may also serve to reduce parental concerns about the impact of PAE to their child.
Although the previous analyses focused on the prediction of CORs to later neurodevelopmental risk, the predictive validity associated with identifying Fetal Alcohol Spectrum Disorders (FASDs) is unclear. This current analysis focuses on the extent to which CORs can be used to identify individuals on the spectrum of fetal alcohol effects using an index of deviation of the typical pattern of HR deceleration that occurs as a function of encoding a novel stimulus. Using CORs collected at 6 and 12 months, an index of deviation was formulated and then evaluated to determine whether or not the index of deviation differentiated individuals with FASDs relative to non-affected individuals. The previously existing sample was also enriched with a second wave of COR data collection using different equipment and stimulus presentation software. Individuals identified as having an FASD in the preschool period were hypothesized to have higher levels of overall deviation in their COR responses.
MATERIALS AND METHODS
Overview of Recruitment and Procedures
All participants used in this study were part of a prospective study on the impact of PAE on developmental outcomes and the impact of prenatal micronutrient supplementation that were recruited between 2007 and 2015 in two cities (Khmelnytsky and Rivne) in Ukraine in collaboration with the OMNI-Net Birth Defects Program and as part of the Collaborative Initiative on Fetal Alcohol Spectrum Disorders (CIFASD). Enrollment was based on maternal use of alcohol just prior to or during pregnancy. Mothers were categorized as being either (1) low or no alcohol users or (2) moderate to heavy alcohol users. Follow-up assessments were scheduled for 6 and 12 months and later in the preschool period between 3.5 to 4.5 years of age. During the infant follow-up visits, CORs were collected during habituation/dishabituation paradigms. FASD status was subsequently determined at the preschool period by integrating information from physical exams and standardized assessments of neurodevelopmental functioning for a subset of the sample (n=120). Approval to conduct the study was obtained from the Institutional Review Boards at the University of California San Diego, La Jolla, CA, USA, and the Lviv National Medical University, Lviv, Ukraine.
Maternal Recruitment and Interview Procedures.
A trained research nurse recruited women during their prenatal care visits and interviewed them at enrollment, third trimester, and postpartum to assess demographics, lifestyle, and substance use in pregnancy, including maternal alcohol and tobacco consumption. A timeline follow-back procedure was used to assess alcohol consumption. Absolute ounces of alcohol per day (ozAA/day) and per drinking day (ozAA/drinking day) were computed using amount, type, and frequency of alcohol for the period just prior to enrollment and around conception. Moderate to heavy drinking was defined as at least one or more of the following during the month around conception or in the most recent month: (a) weekly heavy episodic or binge drinking (5 or more), (b) five or more episodes of 3–4 standard drinks, or (c) 10 episodes of 1–2 standard drinks. Information about the risks of alcohol consumption during pregnancy was provided. The comparison group, termed the no to low group, was defined as having all three of the following: (a) no binge episodes, (b) minimal or no alcohol in the month around conception, and (c) no continued drinking in pregnancy. Of those in the no to low group, 89.9% were abstainers from alcohol throughout the entire pregnancy. Additional details regarding recruitment and enrollment are available (Kable et al., 2016a, Kable et al., 2015, Coles et al., 2015, Chambers et al., 2014).
Follow-Up Assessment Procedures
COR Assessment.
Infants were placed into an age-appropriate child seat and their mothers were allowed to observe the testing but were instructed to be non-responsive to their child. A fixed trial habituation/dishabituation paradigm, consisting of 10 habituation trials followed by 5 dishabituation trials, was used to assess neurophysiological encoding and dishabituation of both visual and auditory stimuli. The auditory stimuli consisted of a standard stimulus of alternating 400 and 1,000 hz pure tones presented contiguously for 2 sec each with a 5 msec controlled linear rise and fall time for each tone during the habituation trials and a novel stimulus consisting of alternating 700 hz and 1000 hz pure tones presented in a similar format during the dishabituation trials. The visual stimuli consisted of chromatic Caucasian faces of a baby and a woman. Stimuli were selected based on previous developmental literature indicating their predictive validity to later cognitive status (O’Connor, 1980, O’Connor et al., 1984, Fagan, 1970) and were found to differentiate individuals with a history of PAE during infancy (Kable and Coles, 2004, Kable et al., 2015) and toddler periods of development (Kable et al., 2016a). Each trial consisted of the stimuli being presented for 12 seconds followed by a 12 second inter-stimulus interval. For the visual stimuli, the card was present for the duration and for the auditory stimuli, 3 presentations of the sound pairs were presented sequentially within the 12 second interval. A black screen was presented during the inter-stimulus interval for both types of stimuli. The order of the stimulus modality (Auditory-Visual vs. Visual-Auditory) were randomized but which stimuli served as the habituation and dishabituation stimuli within a modality was fixed.
Cardiac responses to the stimuli were monitored continuously using an electrocardiogram (EKG) amplifier connected to a data acquisition computer that was triggered by the stimulus presentation software. HR was sampled prior to the first trial of the habituation/dishabituation paradigm for each stimulus type (auditory or visual) to obtain a baseline HR level and then 12 seconds after the onset of each trial within the paradigm. Two different systems were used to collect CORs over the course of the study. In the first wave of the study, James Long Company (JLC) stimulus presentation software, EKG amplifier, and physiology software were used. In the second wave, E-Prime® presentation software was used to present the stimuli and Biopac’s BioNomadix® wireless physiology was used for data acquisition in combination with Biopac Model (MP150) for EKG data amplification and ACQKnowledge 4.4 software for data processing. The child’s arousal level was rated for each trial using a scale ranging from 1–7 (Als et al., 1977). For those who were in either state 1- Deep Sleep or State 7 - Vigorous Crying, testing was discontinued after two consecutive trials of either stage. Data from only the first three trials of the habituation and dishabituation trials were used for analysis as the magnitude of the COR typically is diminished beyond this (Kable and Coles, 2004, O’Connor, 1980).
Computation of the COR Index Scores.
HR values in the first three habituation and dishabituation trials were averaged by post-second stimulus onset, stimulus type (auditory and visual), and equipment type (JLC or Biopac). HR values were then converted to z-score values within each post-sec value using 707 JLC and 224 Biopac COR samples that were collected in Ukraine to formulate the characteristics of the distribution. Z-score values of greater than 1 for each 12 sec post stimulus onset were summed to derive an index of deviation from the normal pattern of HR response. This resulted in estimates of deviation on the habituation and dishabituation trials. Deviation scores such as this are routinely used in assessing abnormalities in neuropsychological responses (Crawford and Garthwaite, 2008). Z-scores greater than +1.0, reflecting a standard deviation above the HR of the mean of the entire sample, were then counted and summed to formulate an overall COR Index score of deviation from the average COR response. Z-score values below this threshold were scored as 0, indicating that the HR response was not significantly impaired relative to the group mean at a given second. This was done separately for both auditory and visual stimuli. Scores ranged from 0, indicating no deviation, to 24, indicating deviation on each of the 24 seconds sampled (12 sec of habituation and 12 sec of dishabituation). Only participants who had complete data for all 12 sec of the habituation and dishabituation trials were used for this analysis. The COR Index scores represent values of deviation from the typical heart rate deceleration seen in response to encoding novel stimuli. Our previous work (Kable and Coles, 2004) indicated that the average trials to habituation was 8 for both alcohol-exposed and non-exposed infants, suggesting that the lower magnitude of the deceleration response that is being assessed by this score is indexing individual differences in neurophysiological encoding and not differences in habituation.
FASD Status Determination:
A subset of children in the Ukrainian prospective cohort were seen in the preschool period when they were categorized as having fetal alcohol syndrome (FAS), partial FAS (pFAS), or as having alcohol-related neurodevelopmental disorder (ARND) using the modified Hoyme guidelines (Hoyme et al., 2016) (see Table 1). PAE was determined from maternal report obtained at recruitment during pregnancy. Those categorized as Moderate to Heavy Alcohol Users were defined as having PAE and those categorized as having Low or No Alcohol were not. Physical examinations were conducted by local geneticists or pediatricians who were trained by Dr. Kenneth Lyons Jones to assess growth and alcohol-related dysmorphology. Growth percentiles were calculated using the Centers for Disease Control and Prevention growth charts (Kuczmarski et al., 2002) from these exams conducted on children during their infant and toddler visits (< = 2 years of age) to classify children as less than or equal to the 10th percentile for height, weight, and head circumference. Neurobehavioral status was assessed using Ukrainian translations of the nonverbal portions of the Differential Ability Scales, 2nd edition (DAS-II) (Elliot, 2007) and the Child Behavior Checklist (CBCL) (Achenbach, 2009). Neurocognitive testing was conducted by local psychologists who were trained and supervised by study investigators. For the DAS-II, scores at or below 85 on the Nonverbal Reasoning Cluster, Spatial Cluster, and Special Nonverbal Composite Cluster scores were indicative of cognitive impairment. For the CBCL, the upper quartile of the sample was used as the cut-off for each CBCL subscale (Anxious/Depressed, Withdrawn/Depressed, Attention, Affective Problems, Anxiety Problems, Attention Deficit/Hyperactivity Problems, and Oppositional Defiant Problems) and summary scores (Internalizing Problems and Externalizing Problems). The upper quartile was chosen rather than the 1.5 SD used in a previous study implementing these criteria (May et al., 2018) as a result of lower than expected variability in the Ukrainian cohort.
Table 1.
Fetal Alcohol Spectrum Disorder Diagnostic Classification1
| Fetal Alcohol Syndrome | A classification of fetal alcohol syndrome requires all features specified in points 1 through 4
|
| Partial Fetal Alcohol Syndrome | For children with documented prenatal alcohol exposure, a classification of partial fetal alcohol syndrome requires features 1 and 2
|
| Alcohol-Related Neurodevelopmental Disorder | Requires features 1 and 2
|
Adapted from Hoyme et al, 2016
Due to small numbers, participants who met criteria for pFAS or FAS were combined for analysis (pFAS/FAS group). A total of 96 participants did not receive an FASD diagnosis (No Diagnosis Group), 19 were categorized as having ARND (ARND Group) and 5 were categorized as having pFAS/FAS. The No Diagnosis group included 70 participants categorized as being in the No Low exposure group (No PAE/No Diagnosis) and 26 in the Moderate to Heavy Exposure group (PAE/No Diagnosis). The ARND group consisted of 16 who met criteria on behavioral impairment, 1 who met criteria on cognitive impairment, and 2 that met criteria on both. The pFAS/FAS group consisted of 2 who met criteria for FAS/behavioral, 1 FAS/cognitive, and 2 pFAS/behavioral. Specific details regarding the criteria used for each category are outlined in Table 1.
Data Analysis
Data were analyzed using SPSS 26.0 ®. Group differences in the characteristics of the mother and child were examined using chi-square tests to assess differences in frequency distributions and analysis of variance (ANOVA) to assess mean differences in continuous variables. Mixed model analysis was used to assess group differences in COR deviation scores for the total score by stimulus type (Auditory or Visual). Between subjects’ factor was FASD status with four levels (No PAE/No Diagnosis, PAE/No Diagnosis, ARND, pFAS/FAS). Cohort age at assessment (6 or 12 months), equipment type (JLC or Biopac), and baseline HR were used as covariates. To deal with the unbalanced data in this sample, estimation was obtained using restricted maximum likelihood (REML). This method imputes missing values, generates parameter estimates, repeats this procedure using the estimates until there are minimal differences between iterations, and makes adjustments to the degrees of freedom for each iteration (McKnight, 2007, Evans et al., 2001). Post hoc comparisons were then carried out to contrast significant group effects using least squares means. We hypothesized that children who were not exposed to PAE would have lower scores than all of the alcohol-exposed groups and that those in the pFAS/FAS group would have the highest total deviance scores. Finally, a receiver operating characteristic (ROC) curve analysis was conducted to assess the Total COR Deviation Index’s predictive validity.
RESULTS
Group Characteristics of Sample
Significant group differences were found in maternal characteristics, including level of maternal education (χ (6) = 16.867, p < .010), smoking behavior during pregnancy (χ (9) = 49.017, p < .0001), and maternal alcohol use in pregnancy as assessed by recruitment group status (χ (3) = 110.736, p < .0001), absolute outcomes of alcohol per day at conception (F (3, 115) = 39.616, p < .0001, and binge drinking in pregnancy (χ (3) = 70.000, p < .0001) (See Table 2 for details). In general, women whose offspring had no PAE and no FASD diagnosis had lower levels of preconceptual maternal drinking and were less likely to binge drink in pregnancy. The women whose offspring were categorized as ARND, self-reported the highest levels of absolute ounces of alcohol per day at the time of conception but those whose offspring who were categorized as pFAS/FAS did not significantly differ from either group.
Table 2.
Characteristics of the Sample by Group Status
| No PAE/No Diagnosis n=70 | PAE / No Diagnosis n=26 | ARND n=19 | FAS/pFAS n=5 | |
|---|---|---|---|---|
| Age at 6-month Visit (years)—mean (SD)** | .56 (.08) | .51 (.08) | .64 (.17) | .52 (.04) |
| Age at 12-month Visit (years)—mean (SD) | 1.12 (.16) | 1.14 (.19) | 1.16 (.23) | 1.03 (.05) |
| Age at Preschool Visit (years)-mean (SD)*** | 3.9 (0.29) | 4.1 (0.43) | 3.8 (.28) | 3.7 (.24) |
| Child’s Gender (N, % Male) | 40 (57.1) | 11 (42.3) | 11 (57.9) | 2 (40.0) |
| DAS Nonverbal Composite-)-mean (SD) * | 92.9 (15.6) | 98.8 (11.3) | 85.5 (19.1) | 86.4 (24.5) |
| Head Circumference Percentile in Preschool Period -mean (SD) | 52.7 (25.7) | 55.3 (28.3) | 48.1 (18.5) | 45.0 (33.7) |
| Height Percentile in Preschool Period -mean (SD) | 48.9 (28.3) | 57.8 (24.6) | 54.8 (31.1) | 31.6 (37.5) |
| Weight Percentile in Preschool Period -mean (SD) | 50.4 (26.3) | 52.0 (23.9) | 52.0 (25.4) | 37.6 (23.0) |
| Maternal Education (N, %)** | ||||
| < High School | 2 (2.9) | 0 (0.0) | 4 (21.1) | 1 (20.0) |
| High School | 32 (45.7) | 10 (38.5) | 11 (57.9) | 2 (40.0) |
| Some college or higher | 36 (51.4) | 16 (61.5) | 4 (21.1) | 2 (40.0) |
| Smoking Status (N,%)**** | ||||
| Never Smoked | 55 (79.7) | 12 (46.2) | 4 (21.1) | 2(40.0) |
| Past smoker (quit before pregnancy) | 6 (8.7) | 4 (15.4) | 2 (10.5) | 0 (0.0) |
| Past smoker (quit after realized pregnant) | 5 (7.2) | 7 (26.9) | 11 (57.9) | 0 (0.0) |
| Current Smoker | 3 (4.3) | 3 (4.3) | 2 (10.5) | 3 (60.0) |
| Prenatal Alcohol Exposure Group Status (N,%)**** | ||||
| No to Low | 64 (100.0) | 0 (0.0) | 0 (0.0) | 1 (20.0) |
| Moderate to Heavy | 0 (0.0) | 26 (100.0) | 19 (100.0) | 4 (80.0) |
| Absolute outcomes of alcohol per day at conception-mean (SD)* | .02 (0.57) | .76 (0.86) | .62 (.44) | .38 (.29) |
| Absolute ounces of alcohol per day at enrollment —mean (SD) | .00 (.00) | .15 (.65) | .02 (.05) | .01 (.02) |
| History of Binge Drinking in Pregnancy (N,%)*** | 1 (1.5) | 21 (80.8) | 12 (63.2) | 3 (60.0) |
T = p < 10,
p < .05,
p < .01,
p < .001;
p < .0001
Relative to the offspring, there were no group differences in the sex distribution or age at the 12-month assessment but at 6-months, the ARND group was significantly older (F (3, 90) = 5.162, p < .002) than the other groups of children (No PAE/No Diagnosis: p < .010; PAE/No Diagnosis: p < .0001, and pFAS/FAS: p < .040). Among those with no diagnosis, those that had a history of PAE were younger than were those without a history of PAE (p < .041). In the preschool period, the PAE/No Diagnosis group was older than the other three groups of children (F (3, 110) = 5.771, p < .001), No PAE/No Diagnosis: p < .003; ARND: p < .009, and pFAS/FAS: p < .036). Relative to nonverbal cognitive functioning, a significant group effect was found (F (3, 110) = 2.875, p < .040) with the ARND group performing lower than did the PAE /No Diagnosis group (p < .006). There were no group differences in growth parameters.
COR Data.
Data were available for this analysis if the individual was seen at either or both of the two infant assessment times (6 or 12 months of age) and in the preschool period. Complete data at each time point on each task (auditory or visual) were available on 50.8 % of the participants and 6.7% had 3 of 4, 35.0% had 2 of 4, and 7.5% had 1 of 4 data points available. There were no group differences in mean number of CORs available by group status (No PAE/No Diagnosis: M = 2.8 (1.1); PAE/No Diagnosis: M = 3.4 (0.85), ARND: M = 3.1 (1.1); and pFAS/FAS: M = 3.6 (.90). Completion of both the auditory and visual assessments was relatively high at a given time point, 88.9% at 6 months and 92.6% at 12 months. The final dataset consisted of 100 auditory and 106 visual COR assessments at 6 months and 77 auditory and 79 visual assessments at 12 months (See Figure 1 for the aggregate COR for the first three habitation and dishabituation trials by second. Error bars reflecting one standard deviation higher than the mean were used to indicate the threshold at which a deviation in HR response would be counted for each second post-stimulus onset as deviant).
Figure 1.
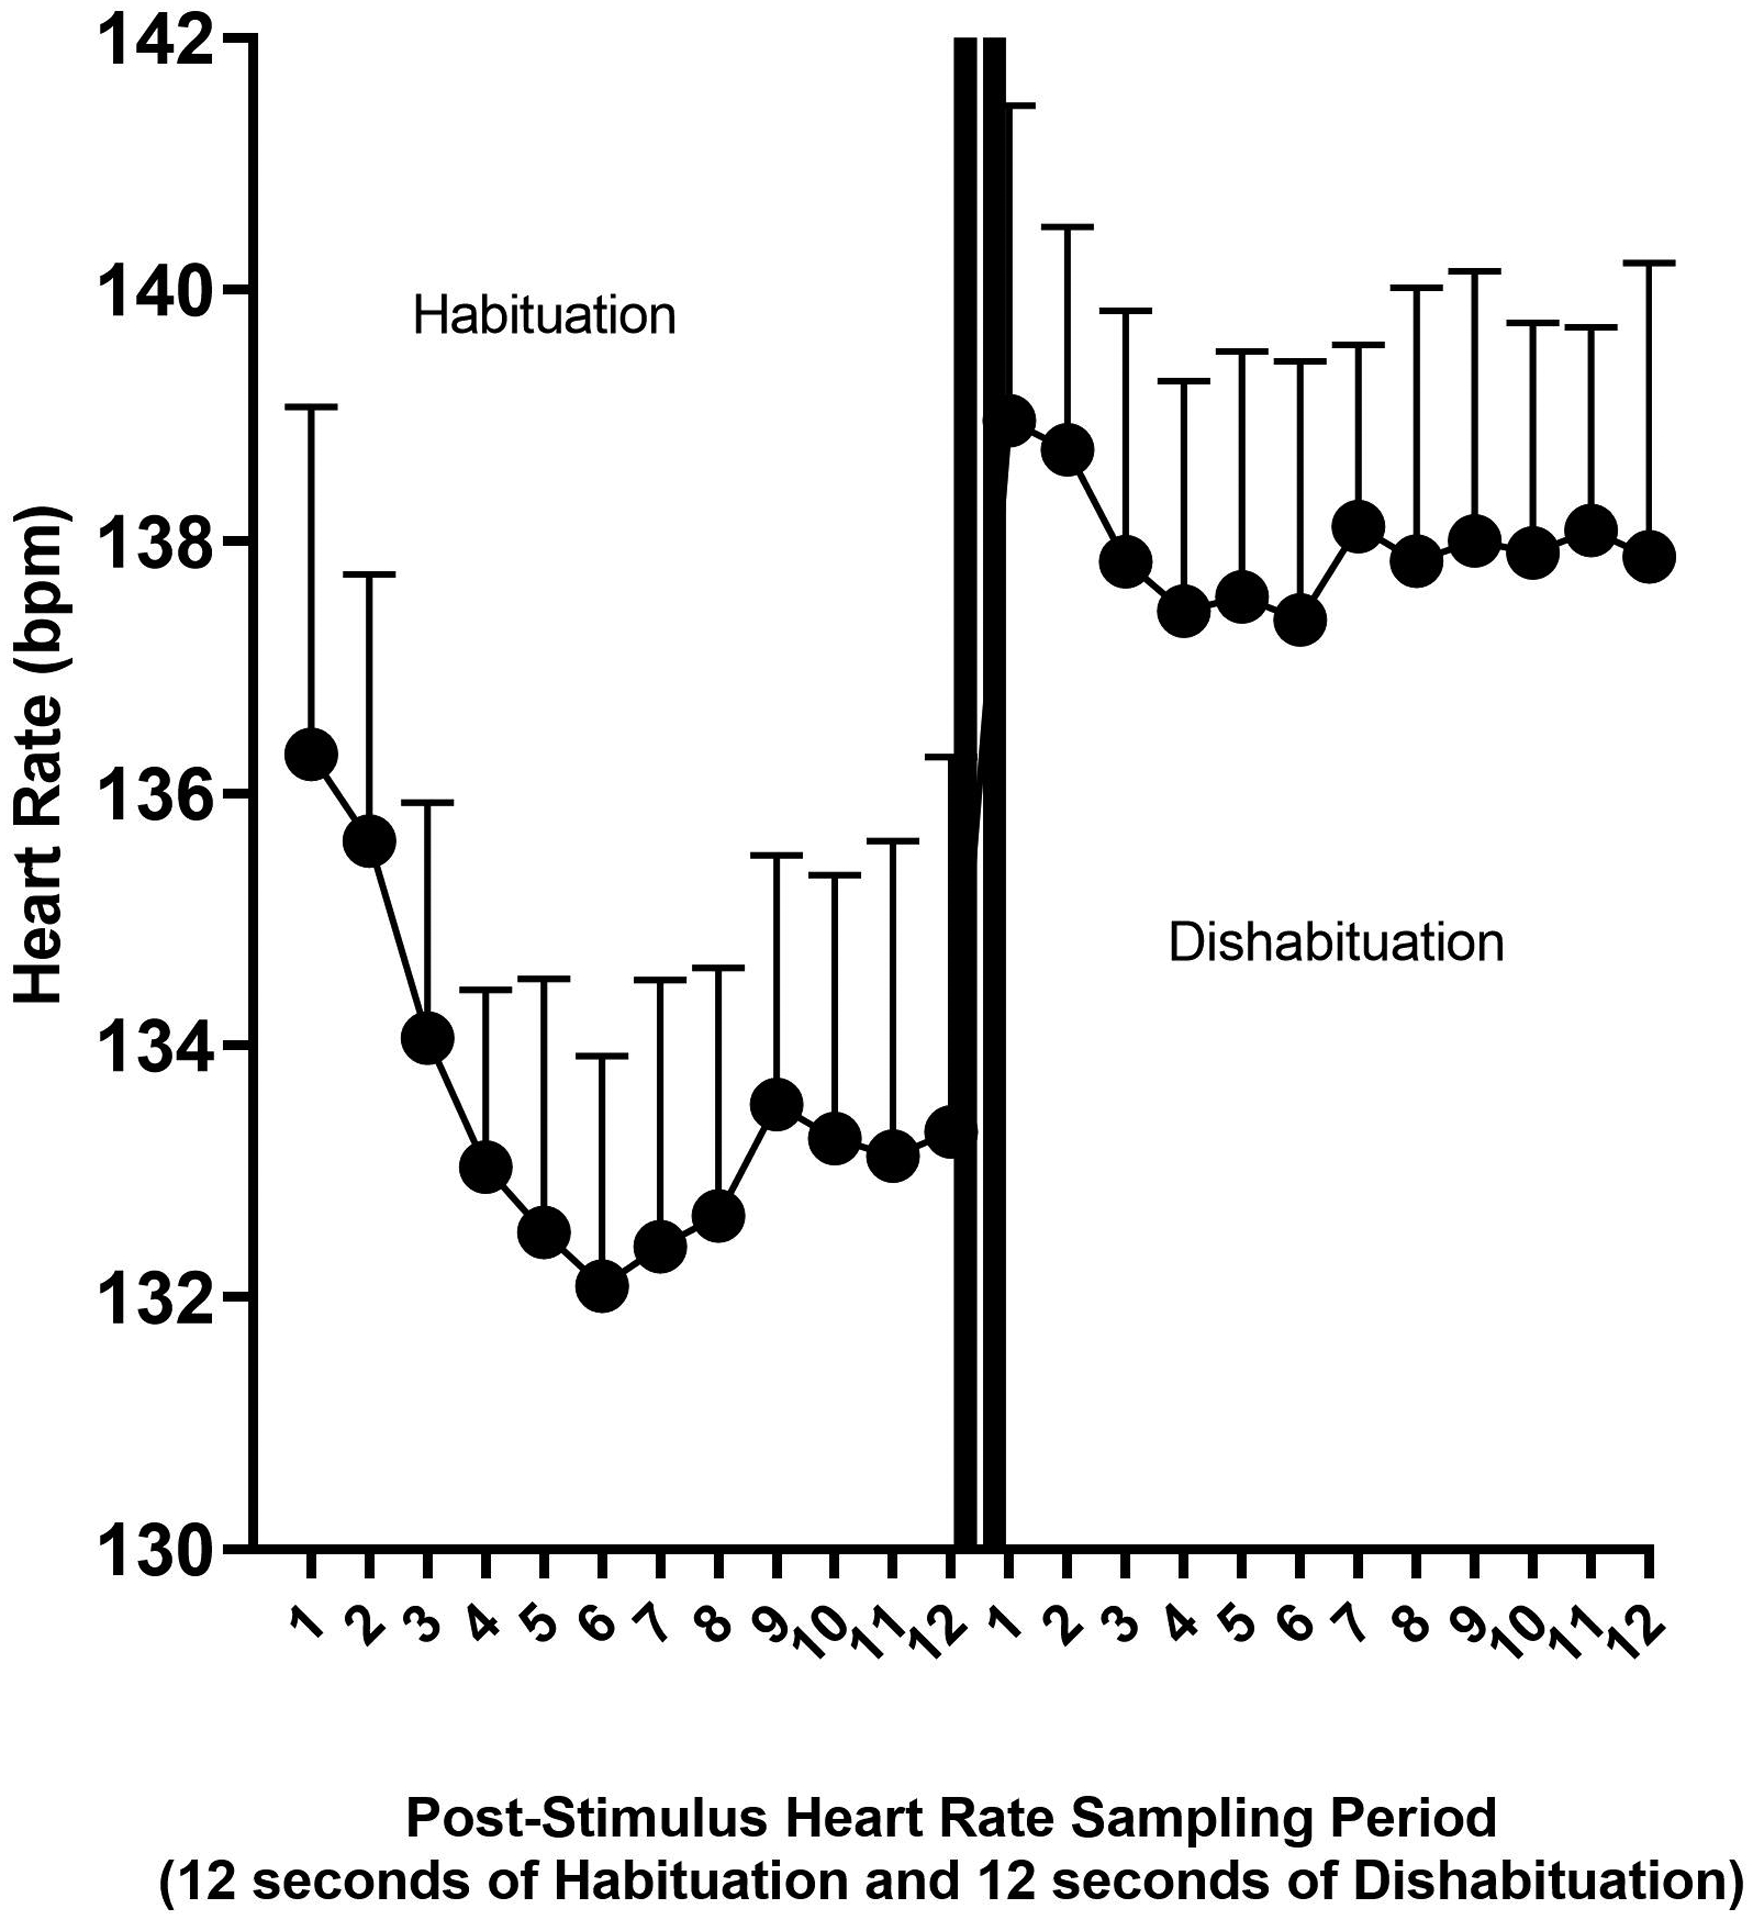
Figure 1 displays the method used to derive the COR Index. The average heart rate is displayed by second post-stimulus onset for the habituation and dishabituation trials, which are separated by two vertical lines. The one standard deviation threshold is reflected at each second to indicate the threshold at which a response was considered deviant. Similar curves were computed for each stimulus (visual or auditory) condition and by equipment type used for data collection. Deviations were then summed to compute a COR Deviation Index.
COR Deviation Index Score Relationships
For both the auditory (r = 0.505, p < .0001) and visual stimuli (r = 0.633, p < .0001), the sum of the deviations for the habituation (Habituation Deviation Index (HDI)) and the dishabituation (Dishabituation Deviation Index (DDI)) trials were correlated and each correlated highly with their respective total deviation score (COR Deviation Index (CDI)) (For auditory stimuli, HDI: r = 0.805, p < .0001 and DDI: r = .919, p < .0001; For visual stimuli, HDI: r = 0.884, p < .0001 and DDI: r = .921, p < .0001). COR Indices were also moderately correlated across stimulus modality (CDI: r = 0.621, p < .0001; HDI: r = 0.396, p < .0001; DDI: r = 0.598, p < .0001). Within age level, the correlation of the CDI across stimulus modality was .648 (p < .0001) at 6-months and .567 (p < .0001) at 12 months. The correlation of the CDI over time within stimulus modality was .557 (p < .0001) for auditory and .311 (p < .020) for visual stimuli.
Group Differences in the COR Index
Group differences were not found on the Auditory CDI but FASD Group status was significant on the Visual CDI (F (3, 91.3) = 2.822, p < .043) after controlling for the covariates of baseline HR (F (1,158.564) = 80.919, p < .0001) and type of equipment (F (1, 128.141) = 6.407, p < .013). The age of assessment (6 or 12 months) was included in the model but was not significant. Post hoc comparisons indicated that deviation in COR responses to visual stimuli in infancy among those children subsequently identified in the preschool period as having pFAS/FAS (M= 8.129, STE = 1.82) was greater than those with ARND (M = 2.244, STE = 0.957, p < .005), those with PAE/No diagnosis (M = 3.410, STE = 0.826, p < .020), and those with No PAE/No Diagnosis (M = 3.869, STE = 0.551, p < .028). See Figure 2 for a bar chart of the means by stimulus type and FASD Group status.
Figure 2.

The average deviation score is reflected by FASD Group status and stimulus condition (auditory and visual).
To assess predictive utility of the total CDI, ROC analysis was conducted on the CDI for both stimuli relative to the prediction of pFAS/FAS group status. Area Under the Curve (AUC) values were non-significant for the auditory stimuli (0.647, p < .253) but were significant for the visual stimuli (0.765, p < .003).
DISCUSSION
PAE has the potential to adversely impact individuals across their lifespan which has been characterized across a spectrum, known as Fetal Alcohol Spectrum Disorders (Calhoun et al., 2006). Some individuals with PAE have no readily observable impact of their exposure as indicated by the presence of alcohol-related dysmorphia, growth deficits, and alcohol-related neurodevelopmental deficits (Day and Richardson, 1991). The variability in impact may be linked to maternal and fetal genetics (Dodge et al., 2014, Fish et al., 2017), timing of exposure (Sulik, 2014), dosage and patterning of the exposure (Feldman et al., 2012, Bandoli et al., 2019), as well as various other co-occurring factors that may contribute to adverse fetal development (i.e. nutritional factors (Keen et al., 2010)). A biomarker is needed to identify those for whom intervention may be most beneficial, particularly during infancy when the brain is still going through rapid development (Fox et al., 2010). CORs collected in infancy, which have been previously found to predict later neurocognitive status, were evaluated in this study to determine if they are also able to predict FASD status. Although we hypothesized that children who were not exposed to PAE would have lower deviation scores than all of the alcohol-exposed groups and that those in the pFAS/FAS group would have the highest total scores, our hypotheses were only partially supported. Those later categorized as pFAS/FAS were distinguished by a score reflecting the total deviation in the cardiac orienting responses.
CORs were not effective in differentiating those identified as having ARND. The range of neurodevelopmental impairment among individuals with ARND is diverse with some having the same degree of neurocognitive impairment as those with pFAS/FAS and others having more subtle learning disability profiles. In this sample, only 3 of 19 met criteria based on cognitive impairment or a combination of cognitive and behavioral impairment while 16 of 19 met criteria based on behavioral impairment alone. The results suggest that CORs are not able to predict the emotional or behavioral impairments often seen in individuals with an FASD. Of concern, is that those classified as having ARND based on only their behavioral impairment in the preschool period may consist of some combination of individuals with prenatal alcohol-related neurodevelopmental compromise that only impacts behavior and individuals who have behavioral impairment resulting from the adverse postnatal environments often associated with maternal substance abuse. In the latter case, the lack of differences on the CORs would be appropriate given that they would be related to postnatal environment and not the direct teratogenic effect of PAE
Within the ARND group, the sample did not have sufficient numbers of individuals who met criteria for neurocognitive impairment to effectively evaluate the CDI’s predictive validity for those with cognitive impairment but who do not have the physical features of FAS. A larger number of ARND children who met criteria based on their neurocognitive impairment would be needed to clarify if CORs are able to index the more subtle neurocognitive deficits or learning disabilities often seen in this population. The manner in which the COR deviation index was derived may have also contributed to lack of differences seen in the ARND group. In this study, the deviation was based on mean values obtained from the total sample rather than deviations from a subset with no PAE and no history of developmental delay. Deviation scores derived from this subset would have likely yielded greater discriminative power and improved differentiation of the ARND group as historically PAE alone results in higher HR values during the COR (Kable and Coles, 2004, Kable et al., 2015, Kable et al., 2016a).
The AUC associated with the ROC analysis for predicting pFAS/FAS status of the Visual CDI was 0.765, which falls in the a category often labeled as acceptable with values above .80, categorized as excellent (Mandrekar, 2010). Previous predictive modeling using machine learning techniques with various indicators of the COR have produced comparable, if not a bit higher (AUC= 0.81), predictive validity when identifying significant developmental delay (Mesa et al., 2017b). Although continued efforts should be made to improve the predictive validity, the levels obtained in both of these studies exceed those of routine breast cancer screening methods, which range from the .60–.70s (Gail and Pfeiffer, 2018). Given that this procedure could be adapted for administration in a typical pediatrician’s office, administered by a trained technician or nurse, and take only about 15 minutes to complete, the development of a scalable methodology to implement this procedure may be an important priority in improving our identification of those adversely impacted by PAE. In a recent large epidemiological study conducted across four U.S. communities, less than 1% of those who met criteria for an FASD were identified within their communities prior to the study (May et al., 2018), indicating an important public health need to improve identification of affected individuals. Future research would need to sample a normal standardization sample of CORs from which to derive a threshold of risk for the CDI to assess its true discriminative power for identifying those negatively impacted by PAE followed by a clinical trial using the screening procedure.
No one measure should be used to screen for any developmental disability, including FASD. The use of COR, along with other screening measures will most likely optimize the identification of those adversely impacted by PAE. Screening for maternal alcohol use in pregnancy and traditional standardized testing all have their place in a system of screening and identification for clinical care. In our previous work using CORs, the highest levels of predictive utility were found by combining screening methods (Mesa et al., 2017b). The most optimal prediction was obtained when adding information regarding standardized neurodevelopmental testing in infancy to parameters of the COR. It is possible that additional screening procedures in infancy that assess emotionality may also improve identification of the ARND group.
The system for classification of FASD used in this study was the modified Hoyme guidelines (Hoyme et al., 2016) outlined in Table 1. Previous research has established that the consistency of the various FASD diagnostic methodologies is poor (Coles et al., 2016) so the results of this study do not necessarily generalize to those identified on the fetal alcohol spectrum classified using alternative diagnostic criteria. In addition, the results may also differ if the sample was older at the time of the FASD assessment so that more subtle variants of neurocognitive impairment, such as math disability and executive functioning deficits, were included in the diagnostic formulation.
The results of this study were consistent with a previous study on CORs within this cohort (Kable et al., 2015) indicating that the visual stimuli were more sensitive than were the auditory stimuli. Although a similar pattern was seen in the mean values of the auditory CDI, the magnitude of the effects did not reach significance. This could indicate that the visual modality is more vulnerable to the impact of PAE than is the auditory. The differences may also just be the result of changes in the difficulty level or discriminative power of the stimuli presented in the different modalities. Using the same stimuli, no differences were found in sensitivity to PAE (Kable and Coles, 2004) but there was a change in the manner in which the visual stimuli were presented across studies. In the original study, the pictures were presented in a traditional Fagan box (Thompson et al., 1991) that limited the infant’s view to either the picture or the black sides of the box. In the Ukrainian cohort, the stimuli were digitized and presented on a computer screen presented in front of the child but their visual field was not occluded on the sides to the same extent. In addition, the Ukrainian site had higher levels of ambient lighting in the test room. This combination of factors may have resulted in more visual distractions available to the infant, resulting in an increased difficulty level of the visual relative to the auditory task.
There were few pre-existing group differences between the groups of infants that were not part of the criteria used to classify the children. For example, maternal use of prenatal alcohol varied by group status. Obviously, average alcohol intake in the No Exposure/No Diagnosis group was lower than among those with PAE or a PAE-related diagnosis. The ARND group had the highest levels of average alcohol exposure. However, this most likely resulted from the fact that the ARND classification required moderate to heavy PAE, whereas the pFAS/FAS group did not as long as there was a convergence of other alcohol-related physical features (see Table 1). Differences in age may have interfered with the understanding of group differences but age level (6 or 12 months) was not significant in the model after controlling for baseline HR values, which was a significant predictor and implicitly encodes individual differences in age level as HR varies by age. There were group differences in maternal education level and pregnancy smoking behavior but the differences were more generalized to PAE rather than specific to pFAS/FAS group status, which is the group that was differentiated by the CDI.
Deviations from the typical levels of HR deceleration during CORs collected in infancy in response to visual stimuli differentiated those later categorized as pFAS or FAS in the preschool period but did not differentiate those classified as ARND. The ARND group in this study was predominantly composed of those with behavioral impairment so it is unclear if CORs could differentiate alcohol-related cognitive impairment in the absence of alcohol-related physical features. The predictive validity of the CORs to differentiate those with pFAS/FAS suggests that it may be a scalable biomarker that could be used to improve recognition of at least some of the infants with PAE who are in need of early intervention services. Large scale use of COR to identify FASD would require the collection of a standardization sample to determine the threshold of risk for FASD that maximizes its predictive utility and a clinical trial to evaluate its utility as a screening measure in the context with which its use is anticipated.
Acknowledgements:
Data analysis and write-up was funded by the NIH Research Grant R01 AA026579-01, funded by the National Institute on Alcohol Abuse and Alcoholism (NIAAA)-Christina Chambers and Julie Kable (MPIs). Data collection was funded by the NIH Research Grant #U01AA014835, funded by the National Institute on Alcohol Abuse and Alcoholism (NIAAA) and the NIH Office of Dietary Supplements (ODS) - Christina Chambers, PI. Data collection was conducted in conjunction with the Collaborative Initiative on Fetal Alcohol Spectrum Disorders (CIFASD), which is funded by grants from the National Institute on Alcohol Abuse and Alcoholism (NIAAA). Additional information about CIFASD can be found at www.cifasd.org. Additional support was provided by USDA Agricultural Research Service intramural projects (5306-51530-019- 00D). The USDA is an equal opportunity provider and employer.
Finally, the authors would like to thank the Ukrainian families who participated in this research and the wonderful staff of the Rivne Oblast Medical Diagnostic Center, the Khmelnytsky Perinatal Center and the OMNI-Net Center.
REFERENCES
- ACHENBACH T 2009. The Achenbach System of Empirically Based Assessment (ASEBA): Development, Findings, Theory, and Applications, Burlington, VT, University of Vermont Research Center for Children, Youth, & Families. [Google Scholar]
- ALS H, TRONICK E, LESTER BM & BRAZELTON TB 1977. The Brazelton Neonatal Behavioral Assessment Scale (BNBAS). J Abnorm Child Psychol, 5, 215–31. [DOI] [PubMed] [Google Scholar]
- ASHWELL KW & ZHANG LL 1996. Forebrain hypoplasia following acute prenatal ethanol exposure: quantitative analysis of effects on specific forebrain nuclei. Pathology, 28, 161–6. [DOI] [PubMed] [Google Scholar]
- BANDOLI G, COLES CD, KABLE JA, WERTELECKI W, YEVTUSHOK L, ZYMAK-ZAKUTNYA N, WELLS A, GRANOVSKA IV, PASHTEPA AO, CHAMBERS CD & CIFASD 2019. Patterns of Prenatal Alcohol Use That Predict Infant Growth and Development. Pediatrics, 143. [DOI] [PMC free article] [PubMed] [Google Scholar]
- BERG K, BERG W & GRAHAM F 1971. Infant heart rate response as a function of stimulus and state. Psychophysiology, 8, 30–44. [DOI] [PubMed] [Google Scholar]
- BORNSTEIN MH & KRASNEGOR NA 1989. Stability and continuity in mental development : behavioral and biological perspectives, Hillsdale, N.J., L. Erlbaum Associates. [Google Scholar]
- BROWN J, LEAVITT L & GRAHAM F 1977. Response to auditory stimuli in 6- and 9-week-old human infants. Developmental Psychobiology, 10, 255–266. [DOI] [PubMed] [Google Scholar]
- CALHOUN F, ATTILIA ML, SPAGNOLO PA, ROTONDO C, MANCINELLI R & CECCANTI M 2006. National Institute on Alcohol Abuse and Alcoholism and the study of fetal alcohol spectrum disorders. The International Consortium. Ann Ist Super Sanita, 42, 4–7. [PubMed] [Google Scholar]
- CHAMBERS CD, YEVTUSHOK L, ZYMAK-ZAKUTNYA N, KORZHYNSKYY Y, OSTAPCHUK L, AKHMEDZHANOVA D, CHAN PH, XU R & WERTELECKI W 2014. Prevalence and predictors of maternal alcohol consumption in 2 regions of Ukraine. Alcohol Clin Exp Res, 38, 1012–9. [DOI] [PMC free article] [PubMed] [Google Scholar]
- CHASNOFF IJ, WELLS AM & KING L 2015. Misdiagnosis and missed diagnoses in foster and adopted children with prenatal alcohol exposure. Pediatrics, 135, 264–70. [DOI] [PubMed] [Google Scholar]
- COLES CD, GAILEY AR, MULLE JG, KABLE JA, LYNCH ME & JONES KL 2016. A Comparison Among 5 Methods for the Clinical Diagnosis of Fetal Alcohol Spectrum Disorders. Alcohol Clin Exp Res, 40, 1000–9. [DOI] [PMC free article] [PubMed] [Google Scholar]
- COLES CD, KABLE JA, KEEN CL, JONES KL, WERTELECKI W, GRANOVSKA IV, PASHTEPA AO & CHAMBERS CD 2015. Dose and Timing of Prenatal Alcohol Exposure and Maternal Nutritional Supplements: Developmental Effects on 6-Month-Old Infants. Matern Child Health J, 19, 2605–14. [DOI] [PMC free article] [PubMed] [Google Scholar]
- COLES CD & LI Z 2011. Functional neuroimaging in the examination of effects of prenatal alcohol exposure. Neuropsychol Rev, 21, 119–32. [DOI] [PubMed] [Google Scholar]
- CRAWFORD JR & GARTHWAITE PH 2008. On the “optimal” size for normative samples in neuropsychology: capturing the uncertainty when normative data are used to quantify the standing of a neuropsychological test score. Child Neuropsychol, 14, 99–117. [DOI] [PubMed] [Google Scholar]
- DAY NL & RICHARDSON GA 1991. Prenatal alcohol exposure: a continuum of effects. Semin Perinatol, 15, 271–9. [PubMed] [Google Scholar]
- DODGE NC, JACOBSON JL & JACOBSON SW 2014. Protective effects of the alcohol dehydrogenase-ADH1B*3 allele on attention and behavior problems in adolescents exposed to alcohol during pregnancy. Neurotoxicol Teratol, 41, 43–50. [DOI] [PMC free article] [PubMed] [Google Scholar]
- ELLIOT CD 2007. Differential Ability Scales, Second Edition, San Antonio, TX, PsychCorp. [Google Scholar]
- EVANS BA, FENG Z & PETERSON AV 2001. A comparison of generalized linear mixed model procedures with estimating equations for variance and covariance parameter estimation in longitudinal studies and group randomized trials. Stat Med, 20, 3353–73. [DOI] [PubMed] [Google Scholar]
- FAGAN JF 3RD 1970. Memory in the infant. J Exp Child Psychol, 9, 217–26. [DOI] [PubMed] [Google Scholar]
- FELDMAN HS, JONES KL, LINDSAY S, SLYMEN D, KLONOFF-COHEN H, KAO K, RAO S & CHAMBERS C 2012. Prenatal alcohol exposure patterns and alcohol-related birth defects and growth deficiencies: a prospective study. Alcohol Clin Exp Res, 36, 670–6. [DOI] [PubMed] [Google Scholar]
- FISH EW, MURDAUGH LB, SULIK KK, WILLIAMS KP & PARNELL SE 2017. Genetic vulnerabilities to prenatal alcohol exposure: Limb defects in sonic hedgehog and GLI2 heterozygous mice. Birth Defects Res, 109, 860–865. [DOI] [PMC free article] [PubMed] [Google Scholar]
- FOX SE, LEVITT P & NELSON CA 3RD 2010. How the timing and quality of early experiences influence the development of brain architecture. Child Dev, 81, 28–40. [DOI] [PMC free article] [PubMed] [Google Scholar]
- GAIL MH & PFEIFFER RM 2018. Breast Cancer Risk Model Requirements for Counseling, Prevention, and Screening. J Natl Cancer Inst, 110, 994–1002. [DOI] [PMC free article] [PubMed] [Google Scholar]
- GRAHAM F & JACKSON J 1970. Arousal systems and infant heart rate responses. Advances in Child Development & Behavior, 5, 59–117. [DOI] [PubMed] [Google Scholar]
- HOYME HE, KALBERG WO, ELLIOTT AJ, BLANKENSHIP J, BUCKLEY D, MARAIS AS, MANNING MA, ROBINSON LK, ADAM MP, ABDUL-RAHMAN O, JEWETT T, COLES CD, CHAMBERS C, JONES KL, ADNAMS CM, SHAH PE, RILEY EP, CHARNESS ME, WARREN KR & MAY PA 2016. Updated Clinical Guidelines for Diagnosing Fetal Alcohol Spectrum Disorders. Pediatrics, 138. [DOI] [PMC free article] [PubMed] [Google Scholar]
- HUNT PS & PHILLIPS JS 2004. Postnatal binge ethanol exposure affects habituation of the cardiac orienting response to an olfactory stimulus in preweanling rats. Alcohol Clin Exp Res, 28, 123–30. [DOI] [PubMed] [Google Scholar]
- KABLE JA & COLES CD 2004. The impact of prenatal alcohol exposure on neurophysiological encoding of environmental events at six months. Alcoholism: Clinical and Experimental Research, 28, 489–496. [DOI] [PubMed] [Google Scholar]
- KABLE JA, COLES CD, JONES KL, YEVTUSHOK L, KULIKOVSKY Y, WERTELECKI W, CHAMBERS CD & CIFASD 2016a. Cardiac Orienting Responses Differentiate the Impact of Prenatal Alcohol Exposure in Ukrainian Toddlers. Alcohol Clin Exp Res, 40, 2377–2384. [DOI] [PMC free article] [PubMed] [Google Scholar]
- KABLE JA, COLES CD, KEEN CL, URIU-ADAMS JY, JONES KL, YEVTUSHOK L, KULIKOVSKY Y, WERTELECKI W, PEDERSEN TL & CHAMBERS CD 2015. The impact of micronutrient supplementation in alcohol-exposed pregnancies on information processing skills in Ukrainian infants. Alcohol, 49, 647–56. [DOI] [PMC free article] [PubMed] [Google Scholar]
- KABLE JA, O’CONNOR MJ, OLSON HC, PALEY B, MATTSON SN, ANDERSON SM & RILEY EP 2016b. Neurobehavioral Disorder Associated with Prenatal Alcohol Exposure (ND-PAE): Proposed DSM-5 Diagnosis. Child Psychiatry Hum Dev, 47, 335–46. [DOI] [PubMed] [Google Scholar]
- KEEN CL, URIU-ADAMS JY, SKALNY A, GRABEKLIS A, GRABEKLIS S, GREEN K, YEVTUSHOK L, WERTELECKI WW & CHAMBERS CD 2010. The plausibility of maternal nutritional status being a contributing factor to the risk for fetal alcohol spectrum disorders: the potential influence of zinc status as an example. Biofactors, 36, 125–35. [DOI] [PMC free article] [PubMed] [Google Scholar]
- KUCZMARSKI R, OGDEN C, GUO S & AL E 2002. 2000 CDC growth charts for the United States: Methods and development. National Center for Health Statistics. Vital Health Stat 11. [PubMed] [Google Scholar]
- LEBEL C, ROUSSOTTE F & SOWELL ER 2011. Imaging the impact of prenatal alcohol exposure on the structure of the developing human brain. Neuropsychol Rev, 21, 102–18. [DOI] [PMC free article] [PubMed] [Google Scholar]
- LEWIS M, KAGAN J, CAMPBELL H & KALAFAT J 1966. The cardiac response as a correlate of attention in infants. Child Development, 37, 63–71. [Google Scholar]
- MANDREKAR JN 2010. Receiver operating characteristic curve in diagnostic test assessment. J Thorac Oncol, 5, 1315–6. [DOI] [PubMed] [Google Scholar]
- MAY P, CHAMBERS C, KALBERG W, ZELNNER J, FELDMAN H, BUCKLEY D, KOPALD D, JASKEN J, XU R, HONERKAMP-SMITH G, TARAS H, MANNING M, ROBINSON L, ADAM M, ABDUL-RAHMAN O, VAUX K, JEWETT T, ELLIOT A, KABLE JA, ASHOOMOFF N, FALK D, ARROYO J, HERELD D, RILEY EP, CHARNESS M, COLES C, WARREN KR, JONES KL & HOYME HE 2018. Prevalence of Fetal Alcohol Spectrum Disorders in 4 US Communities JAMA, 319, 474–482. [DOI] [PMC free article] [PubMed] [Google Scholar]
- MCKNIGHT PE 2007. Missing data : a gentle introduction, New York, Guilford Press. [Google Scholar]
- MESA D, KABLE J, YEVTUSHOK Y, KULIKOVSKY Y, WERTELECKI W, COLEMAN T & CHAMBERS C 2017a. The use of cardiac orienting responses as an early and scalable biomarker of alcohol-related neurodevelopmental impairment in later age children. Alcoholism Clinical and Experimental Research, 41. [DOI] [PMC free article] [PubMed] [Google Scholar]
- MESA DA, KABLE JA, COLES CD, JONES KL, YEVTUSHOK L, KULIKOVSKY Y, WERTELECKI W, COLEMAN TP, CHAMBERS CD & CIFASD 2017b. The Use of Cardiac Orienting Responses as an Early and Scalable Biomarker of Alcohol-Related Neurodevelopmental Impairment. Alcohol Clin Exp Res, 41, 128–138. [DOI] [PMC free article] [PubMed] [Google Scholar]
- MOORE EM, MIGLIORINI R, INFANTE MA & RILEY EP 2014. Fetal Alcohol Spectrum Disorders: Recent Neuroimaging Findings. Curr Dev Disord Rep, 1, 161–172. [DOI] [PMC free article] [PubMed] [Google Scholar]
- MORASCH KC & HUNT PS 2009. Persistent Deficits in Heart Rate Response Habituation Following Neonatal Binge Ethanol Exposure. Alcoholism: Clinical & Experimental Research, 33, 1596–1604. [DOI] [PMC free article] [PubMed] [Google Scholar]
- O’CONNOR MJ 1980. A comparison of preterm and full-term infants on auditory discrimination at four months and on Bayley Scales of Infant Development at eighteen months. Child Development, 51, 81–88. [PubMed] [Google Scholar]
- O’CONNOR MJ, COHEN S & PARMELEE AH 1984. Infant auditory discrimination in preterm and full-term infants as a predictor of 5-year intelligence. Developmental Psychology, 20, 159–165. [Google Scholar]
- POWELL DA, WATSON K & MAXWELL B 1994. Involvement of subdivisions of the medial prefrontal cortex in learned cardiac adjustments in rabbits. Behav Neurosci, 108, 294–307. [DOI] [PubMed] [Google Scholar]
- RICHARDS J 1995. Infant cognitive psychophysiology: Normal development and implications for abnormal development outcomes. Advances in Clinical Child Psychology, 17, 77–107. [Google Scholar]
- RUFF HA & ROTHBART MK 1996. Attention in early development: Themes and variations, New York, NY US, Oxford University Press. [Google Scholar]
- SOKOLOV EN 2002. The orienting response in information processing, Mahwah, N.J., L. Erlbaum Associates. [Google Scholar]
- SULIK KK 2014. Fetal alcohol spectrum disorder: pathogenesis and mechanisms. Handb Clin Neurol, 125, 463–75. [DOI] [PubMed] [Google Scholar]
- THOMPSON LA, FAGAN JF & FULKER DW 1991. Longitudinal prediction of specific cognitive abilities from infant novelty preference. Child Dev, 62, 530–8. [PubMed] [Google Scholar]
- WILHELM CJ & GUIZZETTI M 2015. Fetal Alcohol Spectrum Disorders: An Overview from the Glia Perspective. Front Integr Neurosci, 9, 65. [DOI] [PMC free article] [PubMed] [Google Scholar]