

Abstract
Background:
Prenatal alcohol exposure (PAE) is linked to a variety of neurodevelopmental challenges, including social functioning (SF) and executive functioning (EF) deficits. These deficits present differently across developmental stages from preschool age to adolescence.
Method:
The post-hoc analyses described here analyzed data from eighty-three preschool-age children with PAE (early childhood group; ages 2.5–5.0) and ninety-five adolescents (49 with PAE, 46 controls; ages 8–16). Each child completed EF tasks as part of several prior studies. Children’s parents completed social and communication inventories about their child’s abilities. Thirty-three participants from the early childhood group returned for a four-year follow-up and completed both SF and EF measures.
Results:
Both the early childhood and adolescent groups with PAE showed deficits in SF and EF. There was a relationship between SF and EF within the adolescent PAE group that was not present in the adolescent control group or the early childhood PAE group. However, at the four-year follow-up (Mage= 8.45), those originally in the early childhood PAE group also demonstrated this relationship.
Conclusions:
These findings support previous research on EF/SF deficits in adolescents with PAE while also addressing a gap in the literature concerning early childhood research on this topic. Additionally, these findings suggest that the relationship between EF and SF deficits may strengthen throughout development. This line of research may highlight sensitive periods for SF and EF training in children with PAE and may suggest that FASD programs consider targeting EF training as a component in social skill interventions.
Keywords: Fetal Alcohol Spectrum Disorder, social behavior, executive function, development
INTRODUCTION
Prenatal alcohol exposure (PAE) is a leading cause of neurodevelopmental disorders in the United States, affecting approximately 2–5% of the population (May et al., 2009). Alcohol exposure in-utero can have teratogenic effects on the brain leading to atypical development in a variety of domains. Children and adolescents with Fetal Alcohol Spectrum Disorders (FASDs) often present with a variety of neurodevelopmental challenges that can include cognitive, behavioral, and adaptive functioning deficits (Kully‐Martens et al., 2012; Mattson et al., 2011). These effects manifest differently throughout an individual’s lifespan. Executive functioning (EF) deficits and social functioning (SF) deficits are generally assumed to be persistent across ages (Connor and Streissguth, 1996). Previous literature has suggested that there is a potential link between SF and EF abilities in adolescents prenatally exposed to alcohol (Doyle et al., 2018; Schonfeld et al., 2006). However, the developmental associations during early childhood have yet to be explored.
Executive Functioning Deficits
EF is a broad construct comprising multiple facets of cognition including working memory, shifting, planning, problem solving, and inhibitory control (Blair et al., 2005). EF can refer more specifically to one’s ability to set goals, plan, adapt, self-monitor, and adjust accordingly within different contexts. Deficits in this area can result in difficulty processing information, problems carrying out actions systematically, and poor daily-functioning (Rabinovici et al., 2015). EF deficits in children and adolescents with PAE are common and are so central to an individual’s functioning that they have even been incorporated as criteria into some FASD diagnostic systems (Kodituwakku et al., 2001; Mattson et al., 1999; Rasmussen, 2005). The most common EF deficits exhibited by individuals of all ages with PAE are in the domains of inhibition, verbal fluency, set shifting, working memory, problem solving, and concept formation (Mattson et al., 2019). The majority of research on EF in PAE focuses on middle to late childhood and adolescence (ages 6–18) and much less is known about EF during the preschool age-range (0–5), despite the fact that EF has been shown to develop as early as one year of age and to increase exponentially throughout the preschool years in typical development (Carlson, 2005; Zelazo and Müller, 2011).
The small available EF literature in younger children with PAE does, in fact, suggest that measurable deficits emerge as early as the preschool years. Fuglestad et al., (2015) demonstrated that EF deficits in inhibitory control and cognitive flexibility are present in preschool age children (3–5.5 years) with PAE. Additionally, Water and colleagues (2020) found that - not only do preschoolers with PAE have EF deficits - but, their performance on a Delay of Gratification task was predictive of inhibitory control in middle childhood as measured by the NIH Toolbox Flanker Task. This suggests possible continuity in EF across early childhood, and beyond, in those with PAE. Since the current analyses utilized the same samples as Fuglestad et al. 2015 and de Water et al. 2020, we will not be analyzing these specific cognitive measures longitudinally within this specific early childhood sample here.
Although a significant proportion of EF research in typical development focuses on the crucial preschool age range, studies have shown that EF abilities continue to develop throughout childhood and adolescence (e.g. from ages 7 to 17 in (Best and Miller, 2010) and ages 4 to 12 in Luciana and Nelson, 2002). In neurotypical individuals, EF skills such as inhibition, set shifting, and impulse control are evident early in childhood (age 6) and continue to develop at various rates throughout adolescence (Welsh et al., 1991). In contrast, children and adolescents with FASD continue to struggle with EF skills into adulthood on measures of cognitive flexibility, inhibition, planning, set shifting, working memory, and emotion-related EF tasks (Connor et al., 2000; Mattson et al., 1999; Rasmussen, 2005). These EF deficits occur, regardless of the presence of FAS facial features, suggesting that individuals across the FASD spectrum (i.e. Fetal Alcohol Syndrome (FAS), partial FAS, alcohol-related neurodevelopmental disorder (ARND) may struggle in these EF domains; (Connor et al., 2000; Kodituwakku et al., 2001). It is important to note that cognitive deficits are a component of most FASD diagnostic systems and, EF deficits are actually a criterion for diagnosis in some diagnostic systems.
Social Functioning Deficits
The analyses presented here focus on SF skills related to social interaction and communication ability (as reported by parents). At a basic level, social functioning encompasses a child’s ability to engage in joint attention, exhibit social reciprocity, and to utilize perspective taking (Soto-Icaza et al., 2015). In the preschool age range, the focus of social skills development centers around sharing, interacting in a positive way with peers, cooperating, and regulating one’s own emotions (McClelland and Morrison, 2003). Throughout the transition to middle childhood, children must learn to form and maintain friendships while learning to manage behavior in school and home settings (Sorlie et al., 2020). By the time a child reaches adolescence, the complexity of social interactions increases dramatically. Adolescents become more aware of the perspectives of others and must navigate relational situations independently of a parent (Choudhury et al., 2006).
In addition to a dearth of early childhood research on EF deficits in PAE, there is also a paucity of SF deficit research for this age group, with the majority of available research falling between six years and adolescence (Kelly et al., 2000). This gap in literature calls for more examination of preschool and early childhood social behaviors in PAE populations.
During middle childhood and adolescence, individuals with PAE show marked deficits in SF across a variety of different studies. Jirikowic and colleagues (2008) demonstrated that individuals ages five to eight with an FASD had significantly lower scores across all parent-reported measures of adaptive functioning (including social interaction and communication) when compared to a typically developing sample. Similar findings were shown in six to thirteen-year-old children with FAS who performed poorly on measures of interpersonal relationship skills, use of play and leisure, and coping skills when compared to those with similar IQ scores and typically developing children (Thomas et al., 1998). Adolescents (13 to 20 years old) with FASD also scored lower on measures of social and communication ability when compared to both typically developing controls and IQ-matched individuals with a specific learning disability (Åse et al., 2012).
Relationship between Social and Executive Functioning
Many aspects of EF, such as inhibitory control, self-regulation, and attention are skills that are integral to navigating social interaction (Diamond, 2013; Watson et al., 1999). Social cognition is a construct in which social behaviors and perceptions are guided by underlying cognitive processes, such as the EF skills of attention and decision-making (Adolphs, 2001). Throughout development, as EF ability increases, social interactions begin to place a heavier emphasis on these cognitive processes (Holmes et al., 2016). Additionally, similar brain regions are engaged in both types of functioning. Both the prefrontal and anterior cingulate cortices have demonstrated relations to both executive functioning and social behavior (Adolphs, 2001). Here, we examine how this EF/SF interaction applies to children and adolescents with PAE.
PAE research during middle childhood and adolescence has demonstrated a clear link between SF and EF. Schonfeld and colleagues (2006) utilized parent-report measures of both EF and SF and determined that EF deficits (specifically the ability to regulate and inhibit one’s behavior) were predictive of SF deficits in children age six to eleven. This association was seen across FAS, partial FAS, and ARND. Similar EF/SF associations are also evident in children ages ten to sixteen. Spatial working memory and inhibitory skills were found to be associated with communication ability for both the PAE and control groups (Doyle et al., 2018).
Because SF has been understudied in preschool age children with PAE, there is also a gap in research of potential links with EF ability in this age range. Exploring the link between EF deficits and SF deficits across development may help shape age-appropriate interventions for SF deficits in children and adolescents with PAE.
The aims of the current study are to examine: 1) the magnitude of EF and SF deficits in children and adolescents with PAE; 2) associations between these two deficits at different time points across development; 3) 4-year longitudinal changes in EF and SF in children with PAE; and 4) whether EF-SF associations differ between adolescents with and without PAE. We hypothesized that children with PAE would perform more poorly than non-exposed controls on all measures of EF and SF. We also predicted that EF deficits would be significantly associated with SF deficits across developmental stages. In these analyses, we integrated data from multiple prior studies within our lab that cover the age range of three to sixteen to examine EF and SF across different developmental stages in children with PAE.
METHODS AND MATERIALS
General
Data included in the current analyses were derived from two previous studies: a randomized controlled trial (comprising the current “early childhood cohort”) and a case-control study as part of the Collaborative Initiative on Fetal Alcohol Spectrum Disorders (CIFASD-4; the current “adolescent cohort”). Additional information about the CIFASD project can be found at www.cifasd.org or (Mattson et al., 2010). Participants were recruited from the University of Minnesota’s FASD Clinic within the last 10 years (2010–2020). Further details about the samples and procedures are included in the original studies (Wozniak et al., 2020, 2017, 2015, 2013). Control participants were recruited via mailings, online advertisements, and a University statewide research outreach program. PAE was determined through medical, adoption, and legal records. Sample descriptions are found in Tables 1 and 2 for both cohorts. Cohort-specific methods and materials are described in detail below. For both studies, participants underwent an informed consent process (i.e. parents provided written informed consent for the child) and all procedures were approved through the University of Minnesota’s Institutional Review Board. All participants were seen for physical examination by physician KLJ or JKE as part of determining their FASD diagnosis.
Table 1.
Characteristics of the early childhood PAE cohort by group
| N(%) or mean (SD) | Early Child Iteration 1 (n=60) | Early Child Follow-Up (n=33) | Early Child Iteration 2 (n=27) |
|---|---|---|---|
| Age | 3.84 (0.78) | 8.45 (0.95) | 4.33 (0.96) |
| Gender | |||
| Male | 22 (36.7%) | 15 (45.5%) | 15 (55.6%) |
| Female | 38 (62.3%) | 18 (54.5%) | 12 (44.4%) |
| Race | |||
| White | 25 (41.7%) | 13 (39.4%) | 11 (40.7%) |
| Black or African American | 14 (23.3%) | 7 (21.2%) | 3 (11.1%) |
| American Indian/Alaska Native | 11 (18.3%) | 6 (18.2%) | 3 (11.1%) |
| Asian | 2 (3.3%) | 2 (6.1%) | 3 (11.1%) |
| Native Hawaiian or Other Pacific Islander | 0 (0.0%) | 0 (0.0%) | 0 (0.0%) |
| More than One Race | 8 (13.3%) | 5 (15.1%) | 7 (25.9%) |
| IQ | -- | 90 (13.20) | 92 (12.59) |
| Alcohol Exposure | |||
| Confirmed | 50 (83.3%) | 28 (84.8%) | 26 (96.3%) |
| Suspected | 10 (16.7%) | 5 (15.2%) | 1 (3.7%) |
| Other Drug Exposure | |||
| None | 16 (26.7%) | 10 (30.3%) | 6 (22.2%) |
| Confirmed/Suspected | 44 (73.7%) | 23 (69.7%) | 21 (77.8%) |
| Dysmorphic Facial Features | |||
| Lip (score 4 or 5) | 36 (59.0%) | 18 (54.5%) | 12 (44.4%) |
| Philtrum (score 4 or 5) | 36 (59.0%) | 20 (60.6%) | 11 (40.7%) |
| Palpebral Fissure (≤10th percentile) | 43 (70.5%) | 23 (69.7%) | 17 (63.0%) |
| ≥ 2 Facial Features Present | 37 (60.7%) | 18 (54.5%) | 12 (44.4%) |
| Growth Deficiency (≤10th percentile) | |||
| Height | 14 (23.0%) | 7 (21.2%) | 3 (11.1%) |
| Weight | 13 (21.3%) | 7 (21.2%) | 3 (11.1%) |
| Deficient Brain Growth (≤10th percentile) | |||
| Occipital-Frontal Circumference (OFC) | 19 (31.1%) | 10 (30.3%) | 7 (25.9%) |
| IOM Diagnostic Category | |||
| FAS | 10 (16.7%) | 4 (12.1%) | 1 (3.7%) |
| Partial FAS | 26 (43.3%) | 13 (39.4%) | 12 (44.4%) |
| ARND | 24 (40.0%) | 16 (48.5%) | 14 (51.9%) |
Note: PAE= Prenatal Alcohol Exposure; FAS= Fetal Alcohol Syndrome; ARND = Alcohol Related Neurodevelopmental Disorder. The 16 participants with suspected alcohol exposure were included for the following reasons: the 10 individuals in the early childhood iteration 1 group and the 5 individuals in the follow-up group all meet criteria for either pFAS or FAS; the 1 individual in the early childhood iteration 2 group meets criteria for pFAS. The early childhood follow-up group consists of individuals from the first iteration of the study only.
Table 2.
Characteristics of the adolescent cohort by group
| N(%) or mean (SD) | PAE (n=49) | Control (n=46) |
|---|---|---|
| Age | 11.67 (2.37) | 12.02 (2.60) |
| Gender | ||
| Male | 23 (46.9%) | 24 (52.2%) |
| Female | 26 (53.1%) | 22 (47.8%) |
| Race | ||
| White | 23 (46.9%) | 43 (93.5%) |
| Black or African American | 7 (14.3%) | 0 (0.0%) |
| American Indian/Alaska Native | 2 (4.1%) | 1 (2.2%) |
| Asian | 2 (4.1%) | 1 (2.2%) |
| Native Hawaiian or Other Pacific Islander | 1 (2.0%) | 0 (0.0 %) |
| More than One Race | 14 (28.6%) | 1 (2.2%) |
| FSIQ | 92 (14.99) | 115 (12.18) |
| Alcohol Exposure | ||
| Confirmed | 44 (89.8%) | -- |
| Suspected | 5 (10.2%) | -- |
| Other Drug Exposure | ||
| None | 10 (20.4%) | -- |
| Confirmed/Suspected | 39 (79.6%) | -- |
| Dysmorphic Facial Features | ||
| Lip (score 4 or 5) | 13 (26.5%) | 3 (6.5%) |
| Philtrum (score 4 or 5) | 18 (36.7%) | 3 (6.5%) |
| Palpebral Fissure (≤10th percentile) | 4 (8.2%) | 3 (6.5%) |
| ≥ 2 Facial Features Present | 14 (28.5%) | 1 (2.2%) |
| Growth Deficiency (≤10th percentile) | ||
| Height | 5 (10.2%) | 0 (0.0%) |
| Weight | 2 (4.1%) | 3 (6.5%) |
| Deficient Brain Growth (≤10th percentile) | ||
| Occipital-Frontal Circumference (OFC) | 6 (12.2%) | 0 (0.0%) |
| IOM Diagnostic Category | ||
| FAS | 2 (4.1%) | -- |
| Partial FAS | 12 (24.5%) | -- |
| ARND | 27 (55.1%) | -- |
Note: PAE= Prenatal Alcohol Exposure; FSIQ= Full Scale Intelligence Quotient; FAS = Fetal Alcohol Syndrome; ARND = Alcohol-Related Neurodevelopmental Disorder; ten participants in the PAE group and eighteen participants in the control group did not have available physical exam information. The five participants with suspected alcohol exposure were included for the following reasons: four met criteria for partial FAS and one’s adoption records indicated maternal alcohol use along with a biological sibling with an FASD diagnosis.
Early Childhood Cohort
Participants
Data from the early childhood cohort (n = 87; ages 2.5–5.0 years at enrollment) were collected as part of a randomized, double-blind, placebo-controlled trial of the supplement choline. The criteria for alcohol exposure within this cohort were derived from the 4-Digit Diagnostic Code for FASD (Astley and Clarren, 2004): enrolled participants met level 3 (some) or level 4 (high) risk classifications. There were 16 participants with suspected alcohol exposure included in the study for the following reasons: 10 individuals in the first early childhood iteration and 5 individuals in the follow-up group all met criteria for either pFAS or FAS; one individual in the second early childhood iteration met criteria for pFAS. Results of these trials will not be repeated here as they have been published elsewhere (Wozniak et al., 2013, 2015, 2020). As the data were derived from the trial, half of this sample received the nutrient choline, and half received placebo. There were no significant group differences (placebo v. control) across all primary EF and SF outcome measures for the first iteration of this study and, therefore, the data were collapsed across group (placebo and choline). The second iteration of this study is ongoing and the blind has not been broken on the intervention. A break-down of cognitive and parent-report measures from the early childhood cohort can be found in Table 3. Four years after their initial visit, 33 participants (Mage= 8.45, SDage= 0.95) from the first iteration of this study returned for long-term follow-up visits.
Table 3.
Cognitive Tests Administered by Cohort and Study Phase
| Cognitive Test | E.C. Cohort: Iteration 1 (n=60) | E.C. Cohort: Iteration 2 (n=27) | E.C. Follow-up (n=33) | Adolescence Cohort (n=95) |
|---|---|---|---|---|
| CBCL | ✓ | |||
| Delay of Gratification | ✓ | |||
| DKEFS | ✓ | |||
| EF Scale for PreK | ✓ | |||
| MEFS | ✓ | |||
| NIH-T: DCCS | ✓ | ✓ | ||
| NIH-T: Flanker | ✓ | ✓ | ✓ | |
| NIH-T: List Sort | ✓ | |||
| SB-5 | ✓ | |||
| SIB-R | ✓* | ✓ | ||
| Vineland | ✓ | |||
| WISC-V | ✓ |
Note: Only 12 participants completed the SIB-R in phase 1, as it was added on at a later time point. It was not included in the main analyses for this reason. E.C. = early childhood; CBCL = Child Behavior Checklist; DKEFS = Delis-Kaplan Executive Function System; MEFS = Minnesota Executive Function Scale; NIH-T = National Institute of Health Toolbox; DCCS = Dimensional Change Card Sort; SB-5 = Stanford-Binet 5th Edition; SIB-R = Scales of Independent Behavior- Revised; WISC-V = Wechsler Intelligence Scale for Children Fifth Edition.
Social Functioning Measures
For the early childhood cohort, the parent-report Scales of Independent Behavior-Revised (SIB-R; Bruininks et al., 1996) served as the measure of social functioning. The SIB-R is an assessment of adaptive functioning and problem behaviors across settings (home, work, school, community). The reliability and validity of this measure fall in the moderate to high range (Strauss et al., 2006). Parents were asked to assess their child’s typical performance on a variety of behaviors on a four-point Likert-scale (0 = never/ does not do, 1 = does-but not well-¼ of the time, 2 = does fairly well - ¾ of the time, 3 = does very well- almost always). Results include a Broad Independence Composite and four domain scores (M = 100, SD = 15). Here, the dependent measure was the Social domain score, with higher scores indicating better social ability. This measure was collected in the second iteration of the study only.
For the early childhood follow-up group, the Child Behavior Checklist for Ages 6–18 (CBCL/ 6–18; Achenbach and Rescorla, 2001) served as the measure of social functioning. The CBCL is completed by a parent and addresses various behaviors their child has exhibited over the past six months on a 3-point Likert-scale. Here, the dependent measure was the Social t-score (M=50, SD=10), with higher scores indicating better social ability. The Social scale score has shown test-retest reliability of 0.93 and has demonstrated moderate to high content, criterion-related, and construct validity (Achenbach and Rescorla, 2001).
Executive Functioning Measures
The following early childhood cohort EF measures are categorized according to specific EF ability assessed. Not all cognitive tests were administered during each iteration, see Table 3 for details.
Cognitive Flexibility EF Measures:
Three measures were used: the EF Scale for Preschoolers (Carlson, 2010), MEFS (Carlson and Zelazo, 2014), and NIH Toolbox’s DCCS Task (Gershon et al., 2013; Weintraub et al., 2013). All three tasks measure cognitive flexibility and inhibition by asking participants to switch between different sets of rules when sorting cards either using physical cards (i.e., The EF Scale for Preschoolers) or via iPad (i.e., MEFS, NIH Toolbox’s DCCS Task).
The EF Scale for Preschoolers has seven levels and a participant’s score is the highest level passed. This task is the experimental predecessor to the MEFS. The MEFS generates a variety of EF performance outcome scores; the nationally standardized score (M = 100, SD = 15) was the dependent measure here. The MEFS has shown high test-retest reliability (ICC = .93) and has proven to be a valid measure of executive functioning (Carlson, 2017). The DCCS task, a subtest of the NIH Toolbox, generates T-scores (M = 50, SD = 10), with higher scores indicating better performance. The NIH toolbox cognition assessment has high reliability and validity for young children (Weintraub et al., 2013). This cognition assessment includes the DCCS task, Flanker task, and list sort working memory task (described in further detail within the adolescent cohort methods section below).
Inhibitory Control EF Measures:
The delay of gratification task (DoG) (Beck et al., 2011; Mischel et al., 1989) required the child to choose a preferred treat (i.e., crackers, fruit snacks, or raisins) and then decide between a small or large portion of that preferred treat. After successful training, the participant was told that they could wait until the examiner returned to the testing room and they would receive the larger portion of the treat or, if they did not want to wait, they could ring the bell to alert the examiner to return and receive the smaller portion of the treat immediately. The treats remained in the room with the child while the examiner was away. Inhibitory control ability was measured by the total amount of time the participant was able to wait before ringing the bell, ranging from zero to ten minutes. Note, the DoG paradigm is an experimental task and not a clinical instrument and somewhat limited information about its psychometric properties is available. However, previous research has demonstrated its sensitivity to typical development, and intraclass correlations used to assess test-retest reliability are in the acceptable .75–.80 range (Beck et al., 2011).
The Flanker task, a subtest of the NIH Toolbox, is a task of inhibition and attention that involves identifying with a button press the direction of a specific arrow on the screen while ignoring the surrounding distractors. This task generates T-scores (M = 50, SD = 10), with higher scores indicating better inhibitory skill / attentional control. The dependent measure utilized was the Flanker fully-corrected t-score.
Working Memory EF Measure:
The Working Memory score from the Stanford-Binet Intelligence Scales, 5th Edition (Roid, 2003) was included in the current analyses. It has a mean of 100 and a standard deviation of 15.
Adolescent Cohort
Participants
This set of analyses consisted of a PAE group (n=49) and a control group (n=46), recruited between 2017 and 2020 from the University of Minnesota’s FASD Clinic. Those in the PAE group had evidence of >13 drinks/week or >4 drinks per occasion once/week at any point during pregnancy. If information regarding the exact amount of alcohol use was not accessible, FASD diagnostic criteria were met based on medical records, physical examination records, and/or adoption records (Table 2). Control participants had no history of alcohol exposure during pregnancy or only minimal exposure (less than one drink per week, never more than two drinks per occasion). Control participants were excluded for diagnosis of a psychiatric disorder. This criterion was not applied to the PAE group as many children and adolescents with PAE have comorbid psychiatric disorders (Burd et al., 2003). Because comorbid psychiatric diagnoses are central to FASD and partly the result of the PAE itself, it is not possible to remove the influence of these co-morbid conditions statistically (we discuss the limitations posed by this factor later in the paper). Individuals were excluded from either group if they had a developmental disorder, used substances personally, had MRI contraindications (e.g. dental hardware, implanted metal devices, claustrophobia), a history of traumatic brain injury, a neurological condition, an extremely low birth weight (below 1500 grams), or a diagnosed psychiatric condition that would interfere with participation (e.g. psychosis).
Social Functioning Parent-Report Measure
For the adolescent cohort, parent-reported SF was measured by the Vineland Adaptive Behavior Scales -Third Edition (Vineland-3; Sparrow et al., 2016), a parent-report of the child’s current ability. Each question is structured in a Likert-scale format (0 = Never, 1 = Sometimes, 2 = Usually or Often). Standard scores are provided across a variety of different adaptive functioning domains (M = 100, SD = 15). The Socialization and Communication domains (which are correlated, PAE group: r = .681, p < .001; Control group: r = .661, p < .001) were used in these analyses, with higher scores indicating better social/communication skills. Both domains have exhibited high reliability (.96 and .95 respectively) and have been shown to have construct validity in the assessment of social skills (Sparrow et al., 2016)
Executive Functioning Measures
The following adolescent cohort EF measures are categorized according to specific EF ability assessed.
Cognitive Flexibility EF Measures:
The NIH Toolbox (Gershon et al., 2013;Weintraub et al., 2013) DCCS task total score, described previously, and the DKEFS TMT- Number Letter Switching were used as measures of cognitive flexibility. The DKEFS (Delis et al., 2001) TMT requires participants to connect numbers and letters in the correct order, measuring both shifting and attention abilities. These subtests produced standard scores (M=10, SD=3), with higher scores indicating better performance. The DKEFS VF- Category Switching is also a measure of cognitive flexibility. Participants are required to switch back and forth between naming items from two different categories. The DKEFS has shown reliability values above .80 across the entire test (including VF, TMT, and the CWI task mentioned below) and has shown to be a valid assessment of executive functioning (Delis et al., 2004).
Inhibitory Control EF Measures:
The NIH Toolbox (Gershon et al., 2013; Weintraub et al., 2013) Flanker task, described previously, and the DKEFS (Delis et al., 2001; Delis et al., 2004) CWI- Inhibition task were used as measures of inhibitory control. The CWI-Inhibition task requires participants to block interfering stimuli during a color/word naming task. This subtest utilized standard scores (M=10, SD=3), with higher scores indicating better performance.
Working Memory EF Measures:
The NIH Toolbox (Gershon et al., 2013; Weintraub et al., 2013) LSWM subtest was utilized as an EF outcome measure. This task consists of sorting and sequencing both visual and auditory stimuli. T-scores (M = 50, SD = 10) result, with higher scores indicating better performance.
The WISC-V (Wechsler, 2014) was administered as a measure of overall cognitive functioning. Full scale IQ scores are included in the descriptive data in Table 2. For the EF analysis, the Digit Span score was used. This task involved the participant recalling a set of numbers in various different sequences. This task utilized standard scores (M=10, SD =3), with higher scores indicating better working memory ability. The WISC-V both highly reliable and a valid measure of intelligence in children (Wechsler, 2014).
Data Analysis
IBM SPSS Statistics for Macintosh, Version 26 was utilized for this set of integrative post-hoc analyses. Deficits for the early childhood group (including follow-up) were determined via one-sample t-tests with a test value of either 50 (for measures yielding T-scores, which have a mean of 50) or 100 (for measures yielding standard scores, which have a mean of 100) because there was no control group for comparison. For the first iteration of the early childhood study (see Table 3 for specific cognitive and social measures), partial correlations (controlling for age) were used for the EF and SF measures that did not have age-adjusted standard scores (DoG and EF Scale for PreK). The second iteration of the early childhood study and the follow-up early childhood group analyses utilized Pearson’s r correlations for the age-adjusted scores. Each iteration was analyzed separately due to the varying measures administered.
For the adolescent cohort, independent samples t-tests compared the control and PAE groups. Linear regressions were utilized to examine the relationship between EF and SF as well as to examine whether PAE moderates this relationship, with FDR correction for multiple comparisons. Chi-square analyses were utilized to determine group differences (PAE v. control) on demographic information, see results section for more detail.
RESULTS
Early Childhood Cohort
Within the early childhood PAE cohort, scores on all measures of EF and SF were significantly different than test norms, with means falling below expectations. See Figure 1. For all EF and SF measures, the early childhood group did not show significant correlations aside from trend-level significance for the SB-5 working memory standard scores and the SIB-R social scale (r = .418, p =.075). See Table 3 for a breakdown of the tests administered by early childhood group iteration.
Figure 1.
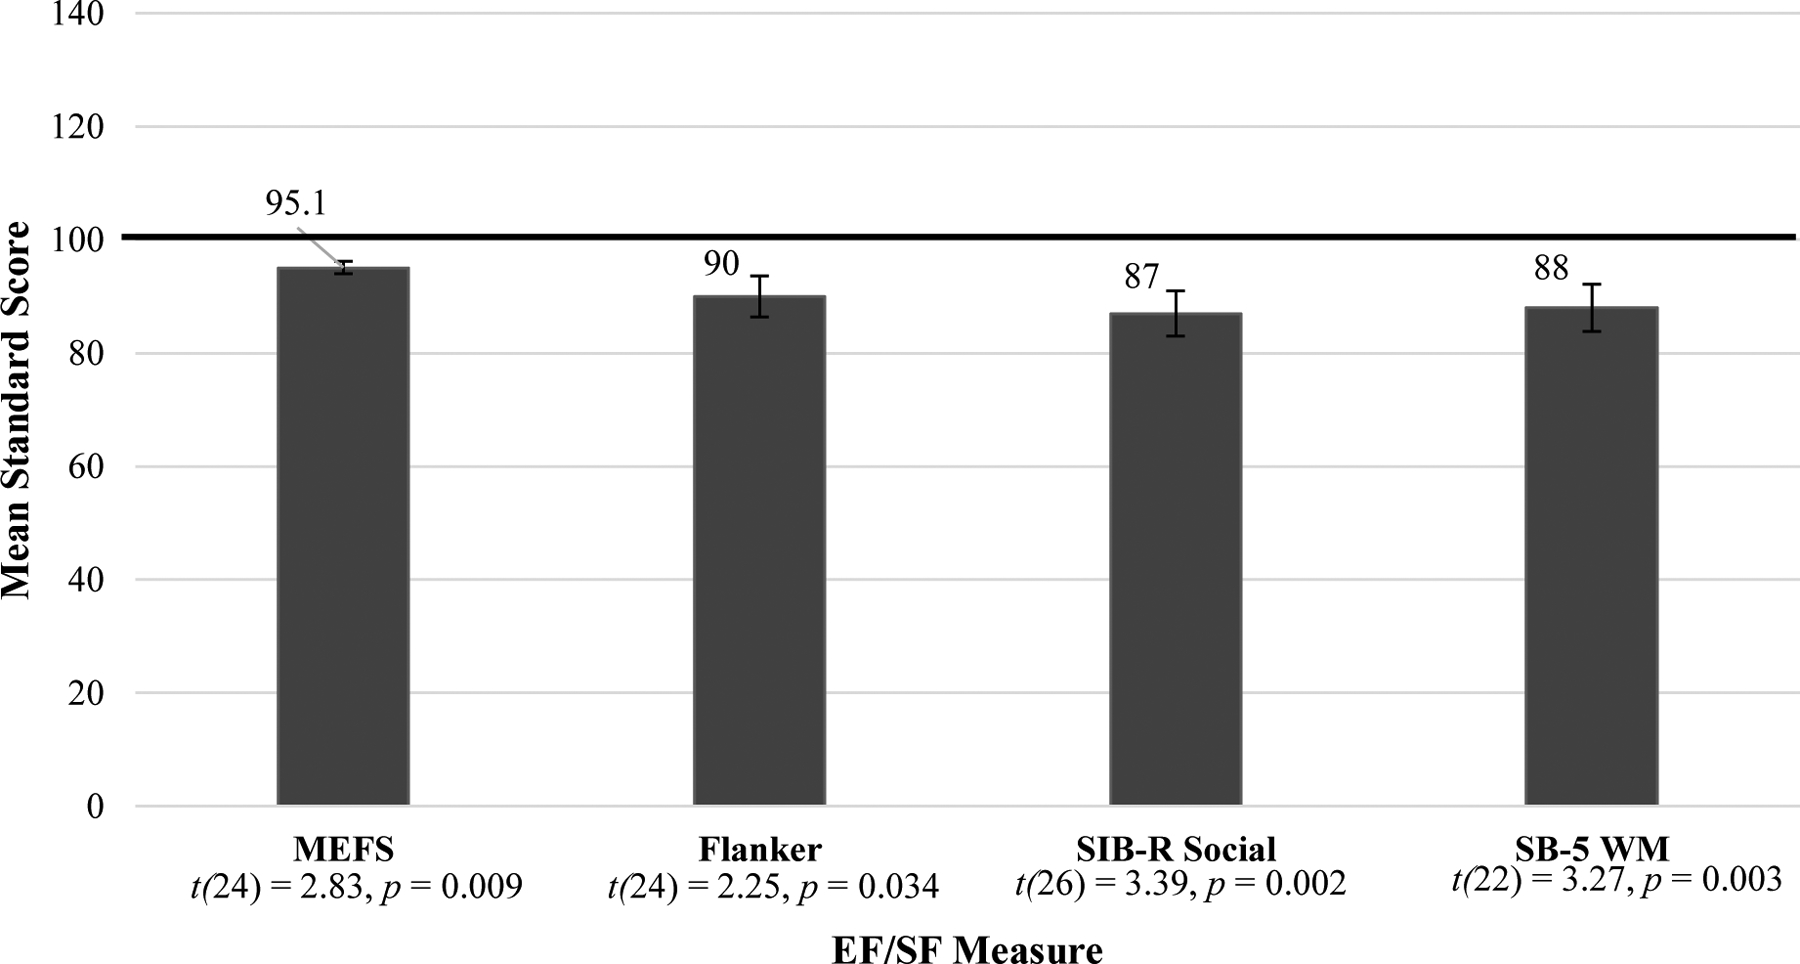
Early Childhood EF/SF Standard Score Means
NOTE: The Flanker mean score was converted from a t-score to a standard score. EF = Executive Functioning; SF = Social Functioning; MEFS = Minnesota Executive Function Scale (n=25); Flanker = Flanker Inhibitory Control and Attention Task (n=25); SIB-R = Scales of Independent Behavior – Revised (n=27); SB-5 WM = Stanford Binet 5th Edition WM scale (n=23). All scores were significantly below the mean, see one sample t-tests above.
For this cohort at the four-year follow-up, all EF and SF standard scores were significantly different than test norms, with means in the below-average range of performance (Figure 2). Correlations for this cohort at follow-up were significant between the CBCL Social Skills measure and the Dimensional Change Card Sort fully corrected t-score (r =.411, p < 0.05; see Figure 3). The card sorting task in the early childhood group was significantly correlated with the Dimensional Change Card Sort task at this group’s four-year follow up (r =.448, p = 0.028).
Figure 2.
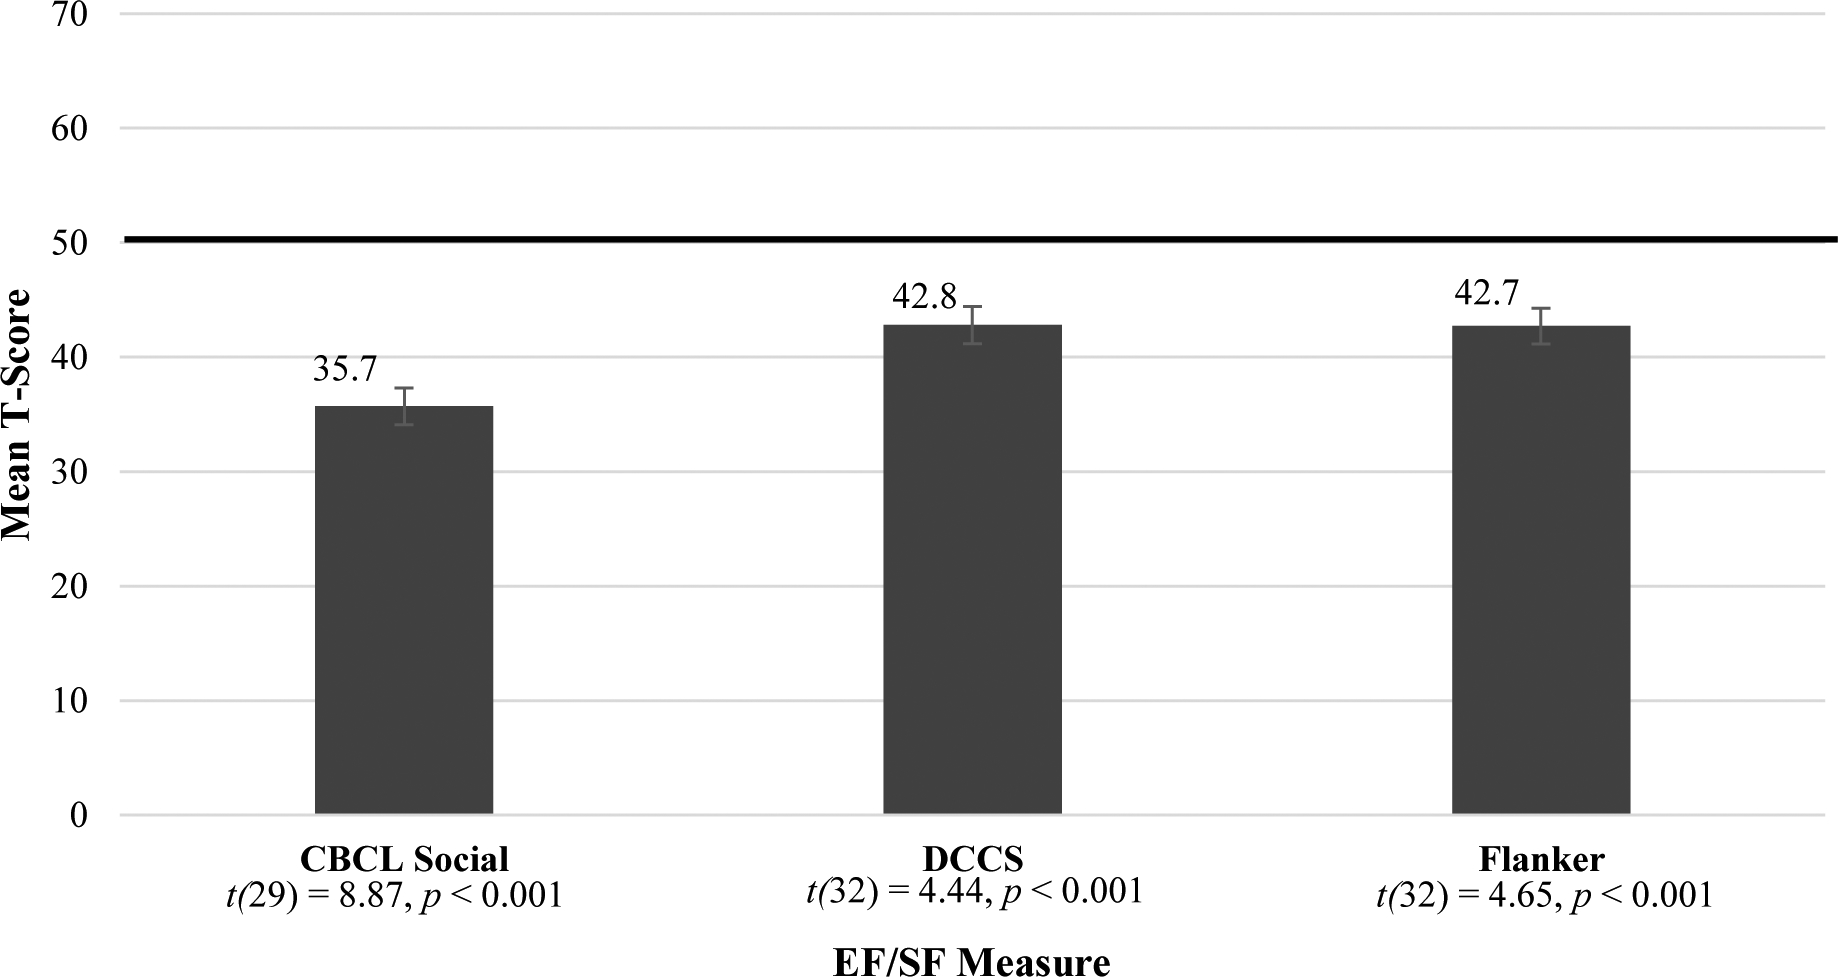
Early Childhood Follow-Up Standard Scores Means
NOTE: CBCL= Child Behavior Checklist (n=30); DCCS = Dimensional Change Card Sort (n=33); Flanker = Flanker Inhibitory Control and Attention Task (n=33). All scores were significantly below the mean, see one-sample t-tests above.
Figure 3.
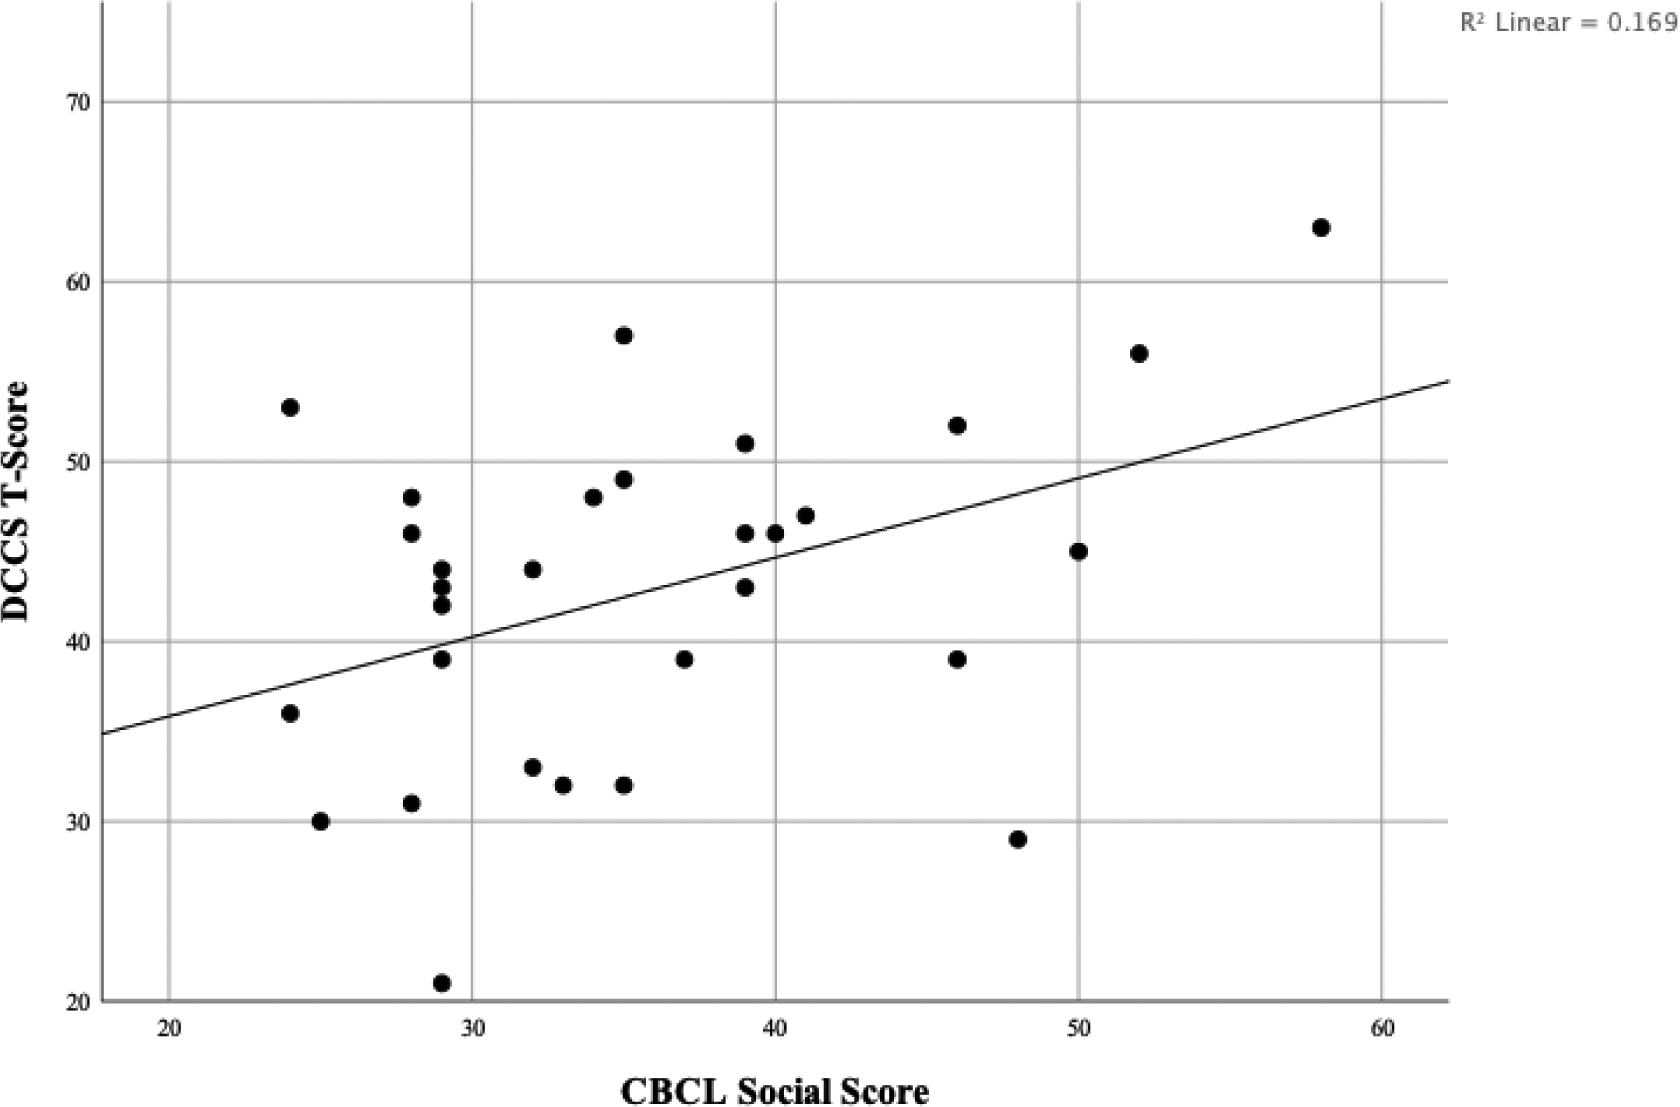
Early Childhood Follow-Up EF/SF Relationship
NOTE: EF = Executive Functioning; SF= Social Functioning; CBCL = Child Behavior Checklist; DCCS = Dimensional Change Card Sort
Adolescent Cohort
Participant Demographics by Group
Chi-square analyses were performed to test for differences in gender, race, and ethnicity; only race was significant; there were more self-identified white participants in the control group compared to the PAE group (x2 (5) = 25.925, p < .001). To test for a possible confounding effect of race, multiple ANOVAs compared racial categories for all SF and EF measures. Only one measure showed a significant difference by race, the Flanker Inhibitory Control and Attention task (F (5,89) = 2.478, p < .05). This is discussed in further detail within the limitations section. Additionally, an independent-samples t-test determined that there was not a group difference for age.
EF and SF Group Differences
As with the early childhood group, the adolescent PAE group showed below-average mean scores across all EF and SF measurements. The control group showed average mean scores in all domains (Figures 4–6). T-tests comparing PAE and control groups were significant across all domains of social and executive functioning examined (Table 4).
Figure 4:
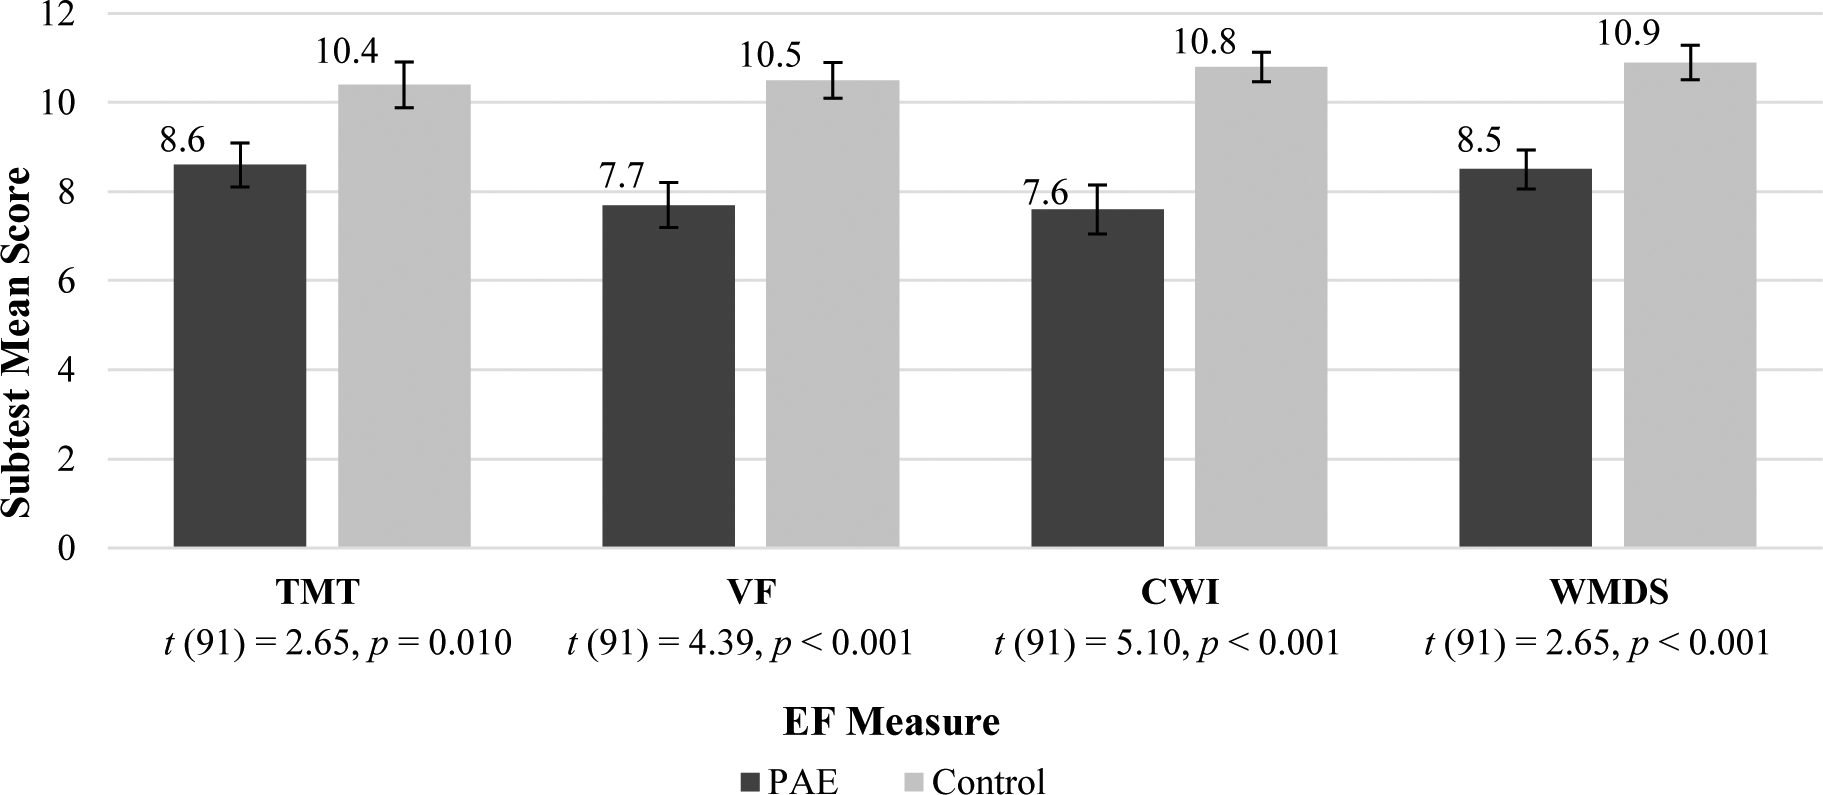
Adolescent EF Subtest Mean Scores
NOTE: EF = Executive Functioning; PAE = Prenatal Alcohol Exposure; TMT= Trail Making Task Number-Letter Switching (Npae = 48, Ncontrol = 45); VF= Verbal Fluency Switching(Npae = 47, Ncontrol = 46); CWI = Color Word Interference Inhibition(Npae = 47, Ncontrol = 46); WMDS = Working Memory Digit Span (Npae = 48, Ncontrol = 45). All group differences were significant, see above t-tests.
Figure 6.
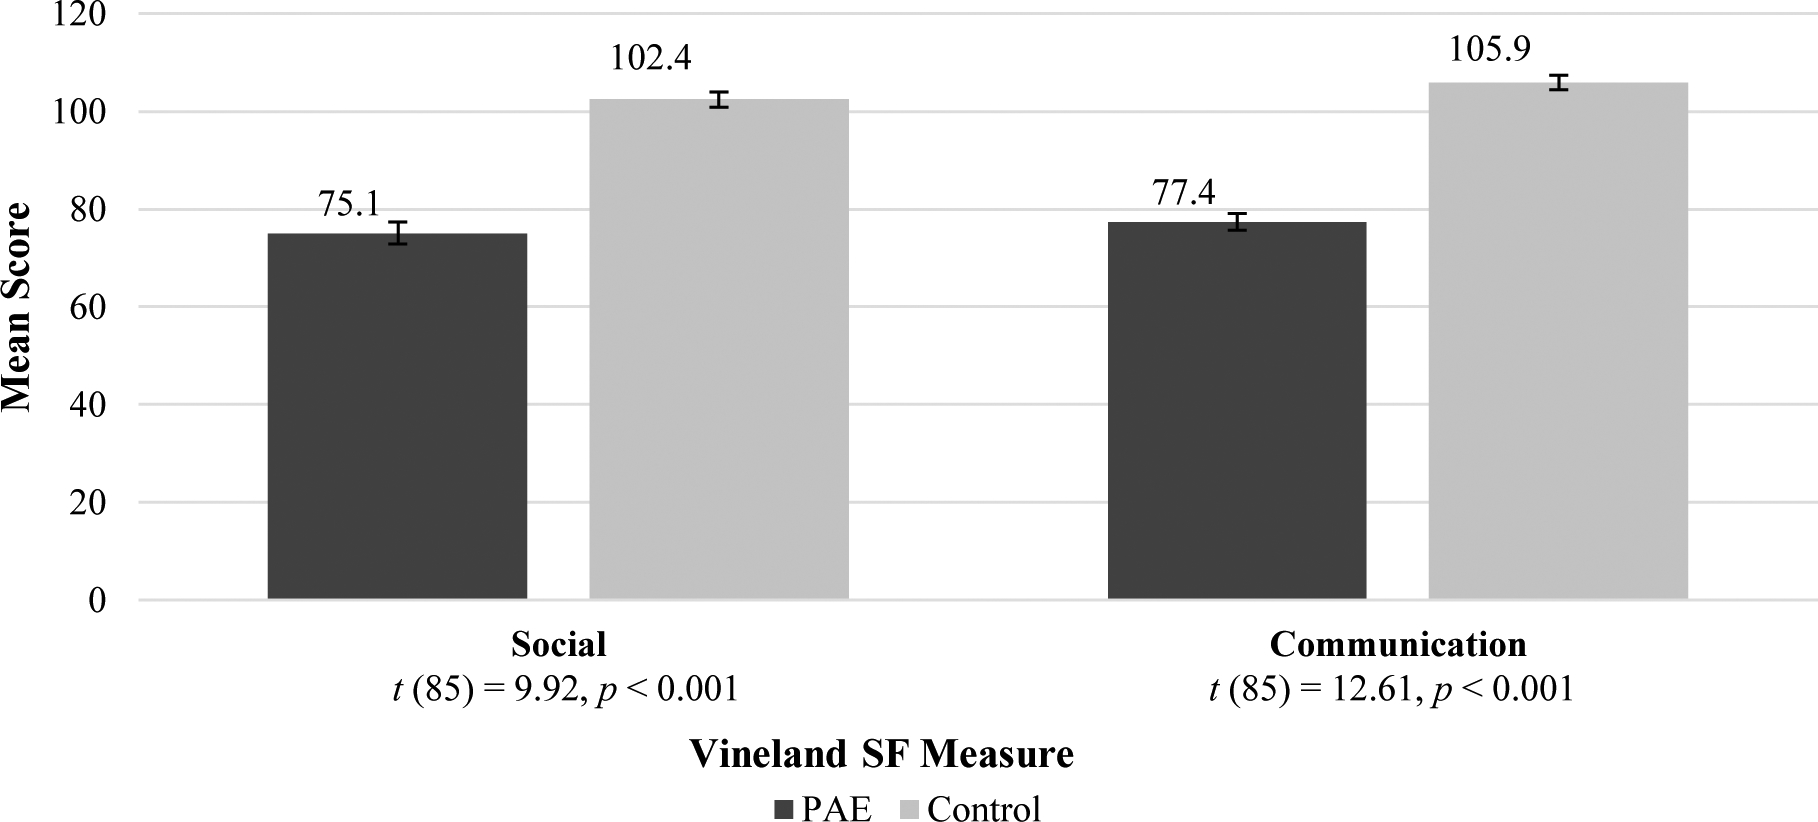
Adolescent SF Mean Standard Scores
NOTE: SF = Social Functioning; PAE = Prenatal Alcohol Exposure. Both scales (Npae = 44; Ncontrol = 43) had significant group differences, see above t-tests.
Table 4.
Group differences on Executive Function and Social Measures in Adolescence
| PAE n = 49 | Control n = 46 | ||||||
|---|---|---|---|---|---|---|---|
| M | SD | M | SD | df | T | Sig. | |
| DKEFS TMT #/Letter | 8.56 | 3.41 | 10.44 | 3.44 | 91 | −2.649 | .010 |
| DKEFS VF Switching | 7.70 | 3.46 | 10.54 | 2.73 | 91 | −4.387 | .000 |
| DKEFS CWI Inhibition | 7.55 | 3.78 | 10.80 | 2.19 | 91 | −5.067 | .000 |
| NIH Toolbox DCCS | 45.92 | 11.20 | 50.70 | 10.78 | 93 | −2.115 | .037 |
| NIH Toolbox Flanker | 38.08 | 8.72 | 44.50 | 8.29 | 93 | −3.674 | .000 |
| NIH Toolbox List Sort | 44.70 | 11.23 | 49.63 | 8.39 | 90 | −2.388 | .019 |
| WISC Digit Span | 8.52 | 3.03 | 10.89 | 2.60 | 91 | −4.034 | .000 |
| Vineland Socialization | 75.11 | 14.94 | 102.42 | 10.24 | 85 | −9.922 | .000 |
| Vineland Communication | 77.41 | 11.32 | 105.91 | 9.68 | 85 | −12.608 | .000 |
Note: PAE = Prenatal Alcohol Exposure; DKEFS = Delis-Kaplan Executive Function System; TMT #/Letter = Trail Making Task Number/Letter Switching; VF = Verbal Fluency; CWI = Color Word Interference; NIH = National Institute of Health; DCCS = Dimensional Change Card Sort; WISC = Wechsler Intelligence Scale for Children
Linear Regressions between EF and SF by Group
Simple linear regressions describe the relationship between EF and the Vineland Social scale, split by group. Within the PAE group, the EF measures of DKEFs Trail Making Test (TMT) Number/Letter Switching, NIH Toolbox Dimensional Change Card Sort (DCCS), NIH Toolbox Flanker Task, and NIH Toolbox List Sort were all significantly related to the Vineland Social scale. DKEFS Color Word Interference (CWI)-Inhibition and the WISC Digit Span task both exhibited trend-level significance. See Table 5.
Table 5.
Regression Analysis for Executive Function Predicting Vineland Social Skills in Adolescents with PAE
| EF Measure | B | 95% CI | β | t | p | FDR p |
|---|---|---|---|---|---|---|
| DCCS | 0.772 | [0.409, 1.135] | 0.552 | 4.291 | <0.001 | <0.001 |
| DKEFS CWI | 1.137 | [−0.034, 2.307] | 0.296 | 1.963 | 0.057 | 0.077 |
| DKEFS TMT | 1.798 | [0.537, 3.060] | 0.410 | 2.879 | 0.006 | 0.018 |
| DKEFS VF | 1.123 | [−0.224, 2.471] | 0.257 | 1.685 | 0.100 | 0.100 |
| FICA | 0.634 | [0.119,1.149] | 0.358 | 2.482 | 0.017 | 0.029 |
| LSWM | 0.530 | [0.149, 0.911] | 0.406 | 2.810 | 0.008 | 0.018 |
| WMDS | 1.391 | [−0.096, 2.879] | 0.283 | 1.889 | 0.066 | 0.077 |
Note: PAE = Prenatal Alcohol Exposure; EF = executive functioning; FDR = false discovery rate; DCCS = Dimensional Change Card Sort Task; DKEFS = Delis-Kaplan Executive Function System; TMT = Trail Making Task; VF = Verbal Fluency; FICA = Flanker Inhibitory Control and Attention; LSWM= List Sort Working Memory; WMDS = Working Memory Digit Span
There were no significant relationships between the EF and SF measures within the Control group. See Table 6.
Table 6.
Regression Analysis for Executive Function Predicting Vineland Social Skills in Adolescent Controls
| EF Measure | B | 95% CI | β | t | p |
|---|---|---|---|---|---|
| DCCS | 0.138 | [−0.169, 0.445] | 0.140 | 0.907 | 0.370 |
| DKEFS CWI | 0.109 | [−1.405,1.622] | 0.023 | 0.145 | 0.885 |
| DKEFS TMT | −0.238 | [−1.163, 0.687] | −0.081 | −0.519 | 0.606 |
| DKEFS VF | −1.068 | [−2.245,0.108] | −0.275 | −1.834 | 0.074 |
| FICA | 0.200 | [−0.193, 0.592] | 0.159 | 1.029 | 0.310 |
| LSWM | 0.263 | [−0.104, 0.629] | 0.221 | 1.448 | 0.155 |
| WMDS | −0.033 | [−1.269,1.202] | −0.009 | −0.055 | 0.957 |
Note: PAE = Prenatal Alcohol Exposure, DCCS = Dimensional Change Card Sort Task; DKEFS = Delis-Kaplan Executive Function System; TMT = Trail Making Task; VF = Verbal Fluency; FICA = Flanker Inhibitory Control and Attention; LSWM= List Sort Working Memory; WMDS = Working Memory Digit Span
Moderation Analysis
Linear multiple regression analyses describe the moderating effect of prenatal alcohol exposure on the relationship between EF and SF. For all analyses, the EF measure and PAE status (exposed or unexposed) were entered in the first step of the regression analysis. The interaction term between the EF measure and PAE status was entered in the second step of the regression analysis to test whether it explained a significant amount of the variance of the social skills scores. PAE explained a significant amount of variance for the Vineland Social scale when examining the EF measures of DKEFS Trails (ΔR2 = .04, F(1, 82) = 6.929, p =0.010), DKEFS Verbal Fluency (ΔR2 = .03, F(1, 81) = 5.597, p =0.020), and NIH Toolbox DCCS (ΔR2 = .03, F(1, 83) = 7.187, p =.009). Thus, PAE was a significant moderator of the relationship between these EF measures and SF. See Figure 7. PAE did not explain a significant amount of variance when looking at the EF measures of DKEFS CWI, NIH Toolbox Flanker and List Sort, as well as the WISC Digit span.
Figure 7.
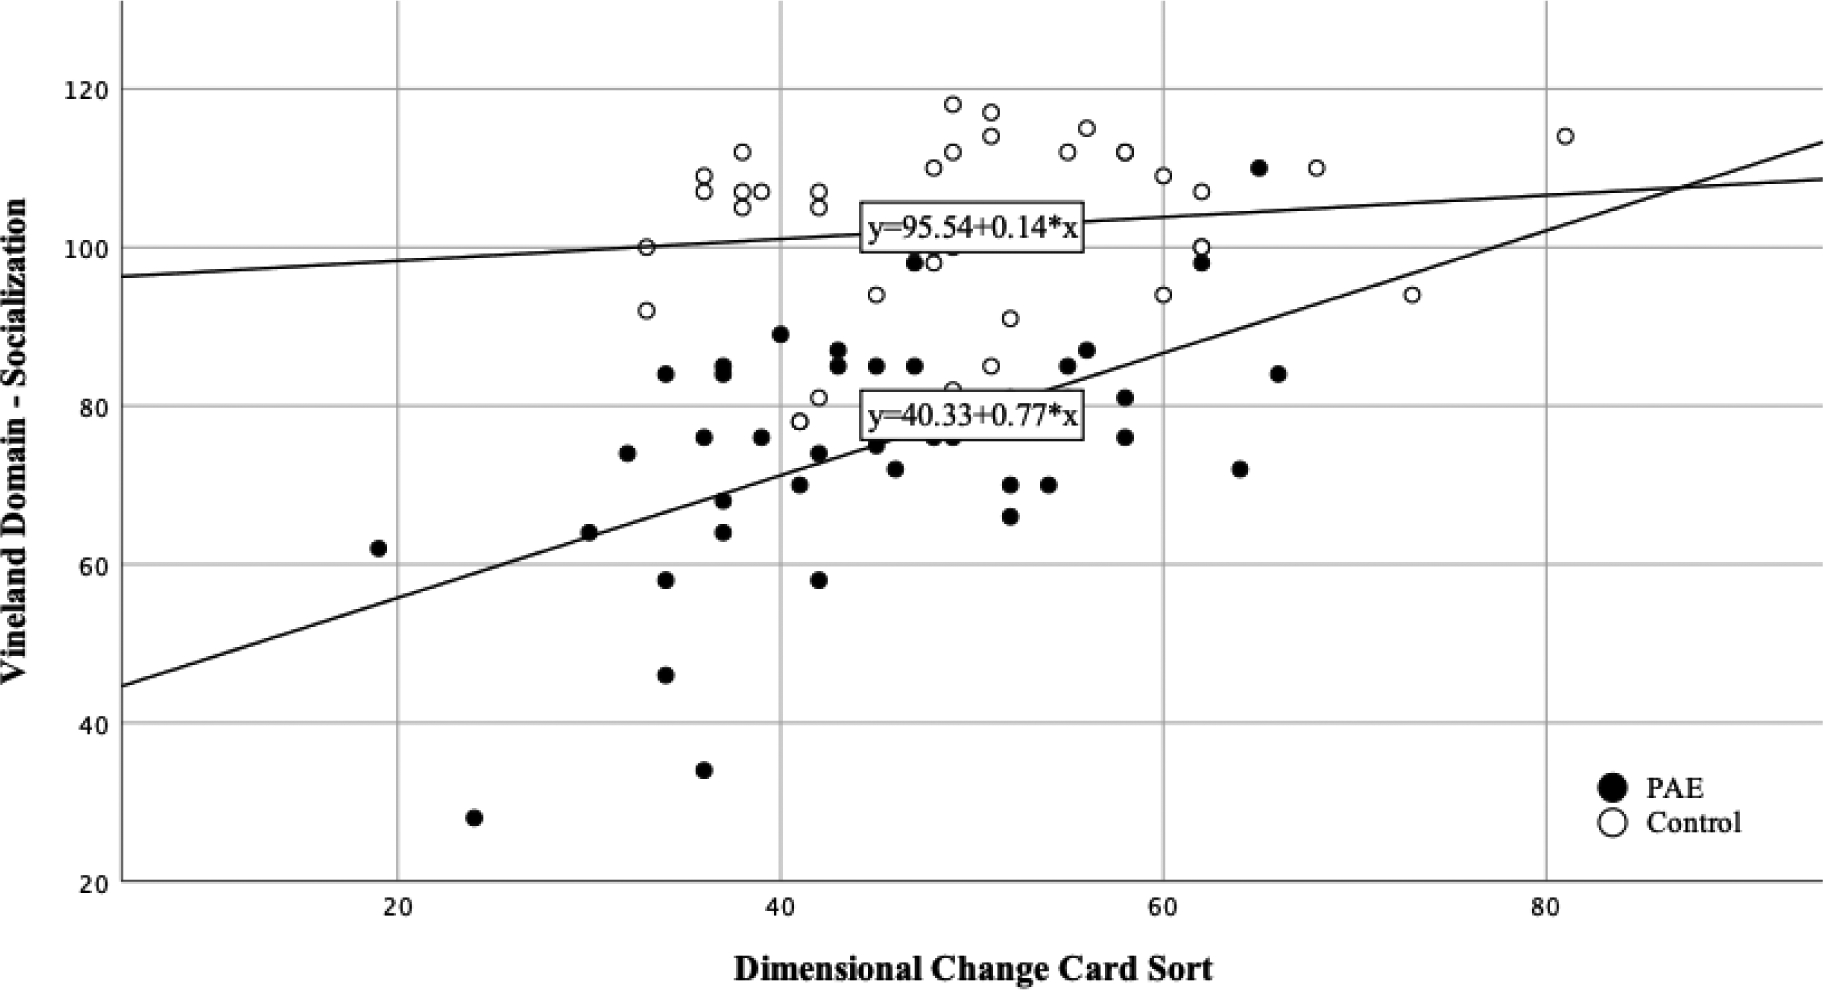
Social and Executive Functioning Ability by PAE Group
NOTE: PAE= Prenatal Alcohol Exposure
DISCUSSION
The primary goal of this set of integrated post-hoc analyses was to explore EF and SF in PAE - from preschool through adolescence - and to explore the relationships between these two domains at multiple points in development. We hypothesized that children with PAE would exhibit lower scores on measures of EF and SF compared to their non-exposed counterparts at all ages, and this was reflected in our results. Additionally, we predicted that lower scores on measures of EF would be associated with lower scores on measures of SF in the groups with PAE. We found that this trend did exist in the adolescent cohort and the early-childhood follow-up cohort (beginning at age eight), but this relationship was not yet apparent during the preschool years.
Our findings of deficits for those with PAE on EF and SF measures are consistent with the existing literature (Kodituwakku et al., 2001; Mattson et al., 1999; Rasmussen, 2005). The current set of analyses adds to the literature by providing EF and SF data from the preschool years - an understudied age range in PAE. The data suggest that future efforts may consider the role of EF interventions (cognitive training targeting inhibitory control, cognitive flexibility, working memory, sequencing, and verbal fluency) as a possible adjunct for social skill interventions in older children and adolescents with PAE.
One novel finding from these data was the differential relationships between EF and SF that we observed depending on developmental stages. Although EF and SF were unrelated in the preschool age range, they were significantly related by early childhood (mean age of 8.45) at follow-up and they were significantly related in the adolescent cohort as well. For context, Whaley and colleagues (2001) have shown that children with PAE show a decline in socialization between early and later childhood compared to a clinical sample of children without PAE. This change in EF/SF relationship could signify a difference in the underlying cognitive functions required to support friendships and social skills more generally in the preschool years versus in mid-childhood and adolescence. Previous work has demonstrated that preschool-age children tend to choose friends based on their similarities in gender, age, and race, and play preferences (Aboud and Mendelson, 1996; Hartup, 2005), while older children and adolescents shift towards basing friendships on similar values, personality, popularity, and matched levels of externalizing behaviors (Franken et al., 2016; Shin, 2017; Urberg et al., 2016). As children transition into adolescence, many peer interactions and friendships place a heavier emphasis on communication ability instead of play style or ability (Holmes et al., 2016). The shift toward friendships requiring more advanced and nuanced social skills likely requires more cognitive load, particularly in terms of EF. This aligns with the findings of the present study, as deficits in specific tasks associated with cognitive flexibility (TMT, DCCS) were associated with poorer social functioning ability in the adolescent cohort. Increasing demand for EF due to the advances in requirements for friendships could explain why the correlation between EF and SF only manifested later in our sample of children with PAE.
Following the finding of a tighter linkage between EF and SF later in development, perhaps EF intervention may be considered as an adjunct to other social skill interventions beginning later in childhood but before the onset of adolescence. For example, Nash (2012) used a 12-week program modeled after the Alert Program for Self-Regulation and targeted children with PAE between the ages of 8 and 12. After the intervention, children in the treatment group displayed improvements in their ability to recognize emotions in others and solve social cognitive problems. In other words, their EF intervention had a secondary benefit of improving SF in these children with PAE. Additionally, their finding suggests that other interventions that focus on improving EF could potentially be used to improve SF with some modification (Pritchard Orr et al., 2018). Similar results were found with EF interventions in children with Autism Spectrum Disorders (ASDs); the Unstuck and On Target (UOT) program is an EF training intervention that has been shown to improve social skills in children ages eight to eleven with an ASD diagnosis (Kenworthy et al., 2014). It is worth noting that individuals with ASD and FASD share many similarities in regard to social and communication ability (Stevens et al., 2013) as well as executive functioning deficits (Corbett et al., 2009).
Starting EF interventions, similar to the UOT and Alert Program, earlier in development may or may not be as beneficial to social skills development as a result of looser linkage between the two domains of skills during early childhood. These interventions could focus on inhibition, attention, and overall cognitive flexibility, as this study suggests these domains are linked to social outcomes. However, more research is needed to further characterize the developmental trajectory of the relationships between EF and SF in children with PAE.
Limitations
Although this post-hoc set of analyses explored relationships between EF and SF from early childhood through adolescence, by circumstance, our sample did not include children ages six to seven. This specific age range lies directly before where we saw a change in the relationship between EF and SF (age 8) and is also around the transition from early childhood to middle childhood/adolescence that shows a shift in social relationships (Holmes et al., 2016). Future research will benefit from including this age group to better characterize the relative development of these skills in PAE. We would also note that, although the included SF measures are commonly used and well-validated, there are limitations inherent to the use of parent-reported measures of SF without the inclusion of ratings from other sources or direct measures of child social skills. Parent social functioning, which may be a factor in the child’s social functioning and the parent’s rating of their child’s social ability, was also not examined here. Future studies could utilize social-report measures that cover a variety of observers across settings, such as teacher-report or peer-report evaluations of social ability. It is also worth noting that previous studies have found a discrepancy between EF parent report and EF test performance for children with PAE. Gross and colleagues (2015) found no significant associations between observed child performance on EF tasks and parent-reported EF. Discrepancies in EF report and EF performance may potentially be due to true differences in performance in lab tasks versus daily life or to artifactual EF deficit reports by parents as a result of the high level of behavioral challenges posed by children with FASD. As mentioned previously, many children with FASD have comorbid psychiatric disorders, perhaps partly as a result of the neurodevelopmental impact of PAE. Further studies could examine the mediating factor these psychiatric disorders have on EF and SF outcomes in these children, as many psychiatric disorders can result in EF deficits (Teivaanmäki et al., 2019). It should be noted that direct measures of language / social-language abilities were not available within these studies and future studies should examine these concepts as potential covariates of the relationship between EF and SF. Additionally, the lack of a control group in the younger cohort poses limitations to the interpretation of the data. Lastly, the adolescent PAE group had more non-white participants than the adolescent control group. Despite utilizing standard scores that account for race, one EF measure displayed a significant difference in performance by race.
Conclusions
In summary, we found that children with PAE have deficits in both social and executive functioning across various developmental stages. Beginning around age eight, a relationship between these two deficits was measurable. The same relationship did not exist in early childhood in individuals with PAE and was also not present in control participants without PAE. These findings could assist in pinpointing a sensitive period for social and executive functioning training in children with PAE. Additionally, these results could help to inform FASD programs in targeting cognitive training as a method of potentially improving social functioning.
Figure 5.
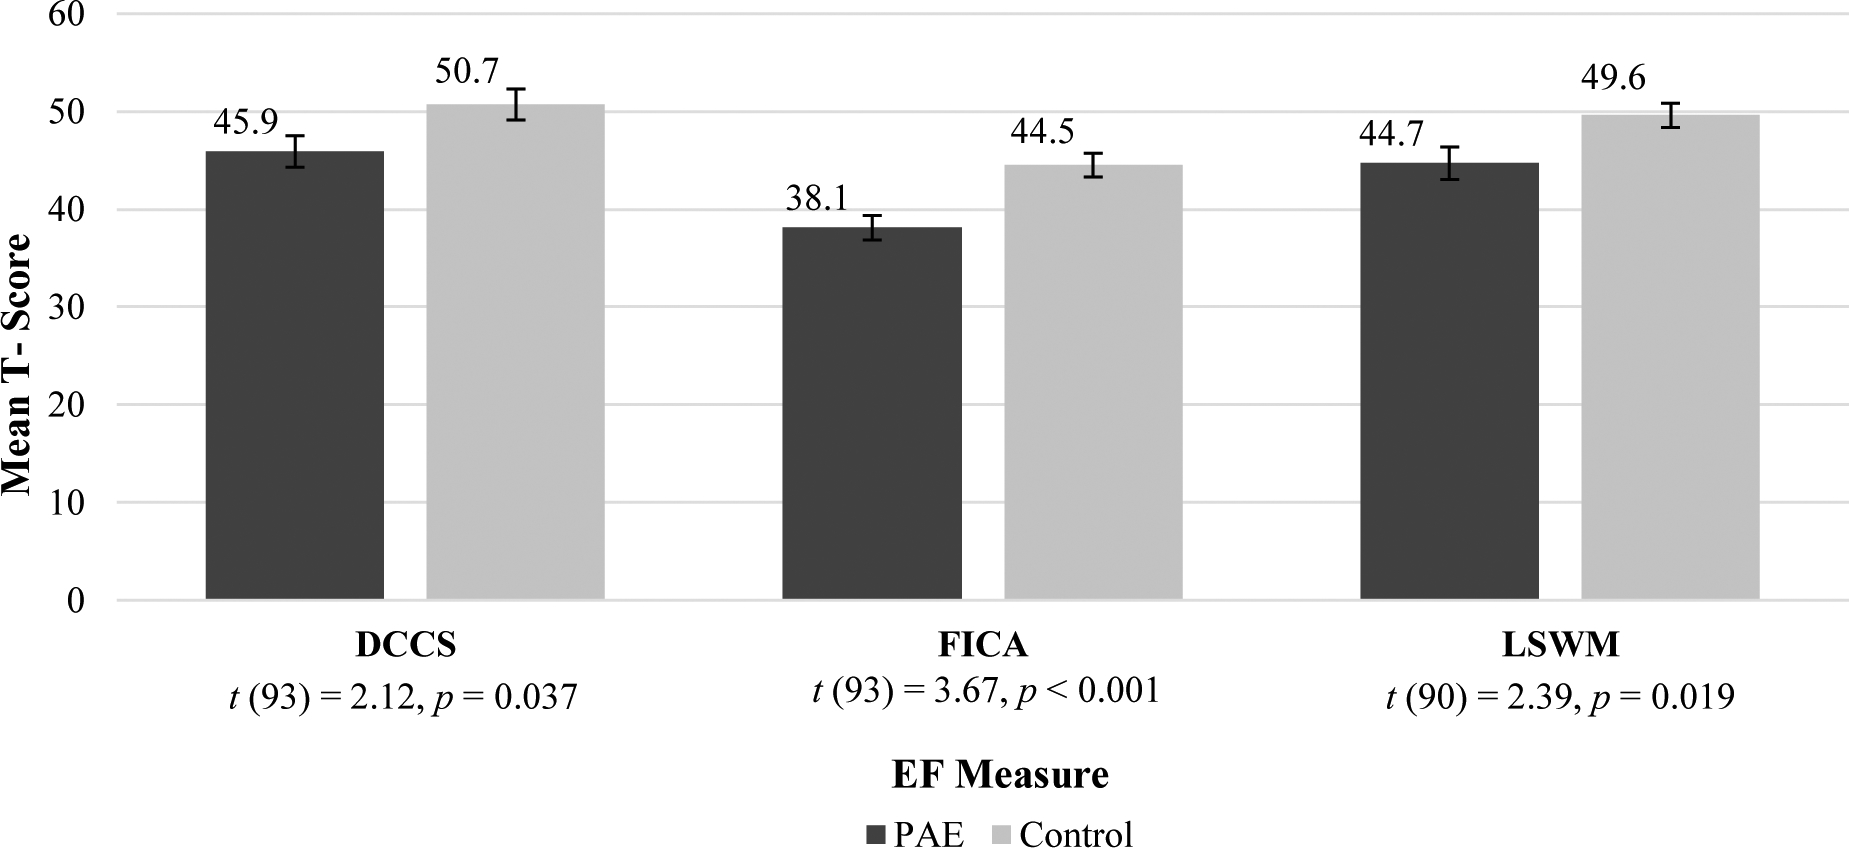
Adolescent EF Mean T-Scores
NOTE: EF = Executive Functioning; PAE = Prenatal Alcohol Exposure; TMT= Trail Making Task Number-Letter Switching (Npae = 48, Ncontrol = 45); VF= Verbal Fluency Switching(Npae = 47, Ncontrol = 46); CWI = Color Word Interference Inhibition(Npae = 47, Ncontrol = 46); WMDS = Working Memory Digit Span (Npae = 48, Ncontrol = 45). All group differences were significant, see above t-tests.
Sources of Support:
R01AA024123, R33AA019580, R21AA019580, R01AA024123-05, R01AA024123-05S1 awarded by the National Institute on Alcohol Abuse and Alcoholism (NIAAA). Part of this work was done in conjunction with the Collaborative Initiative on Fetal Alcohol Spectrum Disorders (CIFASD). Additional information about CIFASD can be found at www.cifasd.org. Support for the CIFASD portion of this research was provided by the NIAAA (5U01AA026102, 5U01AA014834, 5U24AA014815, 5U24AA014811, 5U24AA014815-16, 3U24AA014815-16S1).
Footnotes
Conflicts of Interest: None to report.
REFERENCE LIST
- Aboud FE, Mendelson MJ, 1996. Determinants of friendship selection and quality: Developmental perspectives, in: The Company They Keep: Friendship in Childhood and Adolescence, Cambridge Studies in Social and Emotional Development. Cambridge University Press, New York, NY, US, pp. 87–112. [Google Scholar]
- Achenbach TM, Rescorla LA, 2001. Manual for the ASEBA School-Age Forms and Profiles. University of Vermont Research Center for Children, Youth, & Families, Burlington, VT. [Google Scholar]
- Adolphs R, 2001. The neurobiology of social cognition. Current Opinion in Neurobiology. 11, 231–239. 10.1016/S0959-4388(00)00202-6 [DOI] [PubMed] [Google Scholar]
- Åse F, Ilona A-R, Mirjam K, Pekka S, Eugene HH, Sarah MN, Marit K, 2012. Adaptive behaviour in children and adolescents with foetal alcohol spectrum disorders: a comparison with specific learning disability and typical development. Eur. Child Adolesc. Psychiatry 21, 221–231. 10.1007/s00787-012-0256-y [DOI] [PMC free article] [PubMed] [Google Scholar]
- Astley SJ, Clarren SK, 2004. Diagnostic Guide for Fetal Alcohol Syndrome and Related Conditions: The 4-Digit Diagnositc Code. 3rd ed. Washington, DC: University of Washington; https://depts.washington.edu/fasdpn/pdfs/guide04.pdf [Google Scholar]
- Beck DM, Schaefer C, Pang K, Carlson SM, 2011. Executive Function in Preschool Children: Test–Retest Reliability. J. Cogn. Dev 12, 169–193. 10.1080/15248372.2011.563485 [DOI] [PMC free article] [PubMed] [Google Scholar]
- Best JR, Miller PH, 2010. A Developmental Perspective on Executive Function. Child Dev. 81, 1641–1660. 10.1111/j.1467-8624.2010.01499.x [DOI] [PMC free article] [PubMed] [Google Scholar]
- Blair C, Zelazo PD, Greenberg MT, 2005. The Measurement of Executive Function in Early Childhood. Dev. Neuropsychol 28, 561–571. 10.1207/s15326942dn2802_1 [DOI] [PubMed] [Google Scholar]
- Boroda E, Krueger AM, Bansal P, Schumacher MJ, Roy AV, Boys CJ, Lim KO, Wozniak JR, 2020. A randomized controlled trial of transcranial direct-current stimulation and cognitive training in children with fetal alcohol spectrum disorder. Brain Stimulat. 13, 1059–1068. 10.1016/j.brs.2020.04.015 [DOI] [PubMed] [Google Scholar]
- Burd L, Cotsonas-Hassler TM, Martsolf JT, Kerbeshian J, 2003. Recognition and management of fetal alcohol syndrome. Neurotoxicol. Teratol., The Four State Fetal Alcohol Consortium: Clinical and Epidemiologic Findings 25, 681–688. 10.1016/j.ntt.2003.07.020 [DOI] [PubMed] [Google Scholar]
- Carlson SM, 2017. Minnesota Executive Function Scale Technical Report. Reflection Sciences; St. Paul, MN. [Google Scholar]
- Carlson SM, 2010. Executive Function Scale for Preschoolers Technical report. Inst. Child Dev; Univ. Minn. [Google Scholar]
- Carlson SM, 2005. Developmentally Sensitive Measures of Executive Function in Preschool Children. Dev. Neuropsychol 28, 595–616. 10.1207/s15326942dn2802_3 [DOI] [PubMed] [Google Scholar]
- Carlson SM, Zelazo PD, 2014. Minnesota Executive Function Scale - Test Manual. Reflection Sciences, Saint Paul, MN. [Google Scholar]
- Choudhury SC, Blakemore S, Charman T, 2006. Social cognitive development during adolescence. Social Cognitive and Affective Neuroscience. 1, 165–172. 10.1093/scan/nsl024 [DOI] [PMC free article] [PubMed] [Google Scholar]
- Connor PD, Sampson PD, Bookstein FL, Barr HM, Streissguth AP, 2000. Direct and Indirect Effects of Prenatal Alcohol Damage on Executive Function. Dev. Neuropsychol 18, 331–354. 10.1207/S1532694204Connor [DOI] [PubMed] [Google Scholar]
- Connor PD, Streissguth AP, 1996. Effects of Prenatal Exposure to Alcohol Across the Life Span. Alcohol Health Res. World 20, 170–174. [PMC free article] [PubMed] [Google Scholar]
- Corbett BA, Constantine LJ, Hendren R, Rocke D, Ozonoff S, 2009. Examining executive functioning in children with autism spectrum disorder, attention deficit hyperactivity disorder and typical development. Psychiatry Res. 166, 210–222. 10.1016/j.psychres.2008.02.005 [DOI] [PMC free article] [PubMed] [Google Scholar]
- de Water E, Krueger AM, Lindgren C, Fuglestad AJ, Rockhold M, Sandness KE, Eckerle JK, Fink BA, Boys CJ, Wozniak JR, 2020. Early delay of gratification predicts later inhibitory control and academic performance in children with prenatal alcohol exposure. Child Neuropsychol. [DOI] [PMC free article] [PubMed] [Google Scholar]
- Delis DC, Kaplan E, Kramer JH, 2001. Delis-Kaplan Executive Function System (D-KEFS). APA PsychTests. [Google Scholar]
- Delis DC, Kramer JH, Kaplan E, Holdnack J, 2004. Reliability and validity of the Delis-Kaplan Executive Function System: An update. 10, 301–303. 10.1017/S1355617704102191 [DOI] [PubMed] [Google Scholar]
- Diamond A, 2013. Executive Functions. Annu. Rev. Psychol 64, 135–168. 10.1146/annurev-psych-113011-143750 [DOI] [PMC free article] [PubMed] [Google Scholar]
- Doyle LR, Moore EM, Coles CD, Kable JA, Sowell ER, Wozniak JR, Jones KL, Riley EP, Mattson SN, CIFASD, 2018. Executive Functioning Correlates With Communication Ability in Youth With Histories of Heavy Prenatal Alcohol Exposure. J. Int. Neuropsychol. Soc. JINS 24, 1026–1037. 10.1017/S1355617718000772 [DOI] [PMC free article] [PubMed] [Google Scholar]
- Franken A, Prinstein MJ, Dijkstra JK, Steglich CEG, Harakeh Z, Vollebergh WAM, 2016. Early Adolescent Friendship Selection Based on Externalizing Behavior: the Moderating Role of Pubertal Development. The SNARE Study. J. Abnorm. Child Psychol 44, 1647–1657. 10.1007/s10802-016-0134-z [DOI] [PMC free article] [PubMed] [Google Scholar]
- Fuglestad AJ, Whitley ML, Carlson SM, Boys CJ, Eckerle JK, Fink BA, Wozniak JR, 2015. Executive functioning deficits in preschool children with Fetal Alcohol Spectrum Disorders. Child Neuropsychol. J. Norm. Abnorm. Dev. Child. Adolesc 21, 716–731. 10.1080/09297049.2014.933792 [DOI] [PMC free article] [PubMed] [Google Scholar]
- Gershon RC, Wagster MV, Hendrie HC, Fox NA, Cook KF, Nowinski CJ, 2013. NIH Toolbox for Assessment of Neurological and Behavioral Function. Neurology 80, S2–S6. 10.1212/WNL.0b013e3182872e5f [DOI] [PMC free article] [PubMed] [Google Scholar]
- Gross AC, Deling LA, Wozniak JR, Boys CJ, 2015. Objective measures of executive functioning are highly discrepant with parent-report in fetal alcohol spectrum disorders. Child Neuropsychol. 21, 531–538. 10.1080/09297049.2014.911271 [DOI] [PubMed] [Google Scholar]
- Hartup WW, 2005. Peer Interaction: What Causes What? J. Abnorm. Child Psychol 33, 387–394. 10.1007/s10802-005-3578-0 [DOI] [PubMed] [Google Scholar]
- Holmes CJ, Kim-Spoon J, Deater-Deckard K, 2016. Linking Executive Function and Peer Problems from Early Childhood through Middle Adolescence. J. Abnorm. Child Psychol 44, 31–42. 10.1007/s10802-015-0044-5 [DOI] [PMC free article] [PubMed] [Google Scholar]
- Jirikowic T, Kartin D, Olson HC, 2008. Children with Fetal Alcohol Spectrum Disorders: A Descriptive Profile of Adaptive Function. Can. J. Occup. Ther 75, 238–248. 10.1177/000841740807500411 [DOI] [PubMed] [Google Scholar]
- Kelly SJ, Day N, Streissguth AP, 2000. Effects of prenatal alcohol exposure on social behavior in humans and other species. Neurotoxicol. Teratol 22, 143–149. [DOI] [PMC free article] [PubMed] [Google Scholar]
- Kenworthy L, Anthony LG, Naiman DQ, Cannon L, Wills MC, Luong‐Tran C, Werner MA, Alexander KC, Strang J, Bal E, Sokoloff JL, Wallace GL, 2014. Randomized controlled effectiveness trial of executive function intervention for children on the autism spectrum. J. Child Psychol. Psychiatry 55, 374–383. 10.1111/jcpp.12161 [DOI] [PMC free article] [PubMed] [Google Scholar]
- Kodituwakku PW, Kalberg W, May PA, 2001. The Effects of Prenatal Alcohol Exposure on Executive Functioning. Alcohol Res. Health 25, 192–198. [PMC free article] [PubMed] [Google Scholar]
- Kully‐Martens K, Denys K, Treit S, Tamana S, Rasmussen C, 2012. A Review of Social Skills Deficits in Individuals with Fetal Alcohol Spectrum Disorders and Prenatal Alcohol Exposure: Profiles, Mechanisms, and Interventions. Alcohol. Clin. Exp. Res 36, 568–576. 10.1111/j.1530-0277.2011.01661.x [DOI] [PubMed] [Google Scholar]
- Lucuana M, Nelson CA, 2002. Assessment of neuropsychological function through use of the Cambridge Neuropsychological Testing Automated Battery: performance in 4-to 12-year-old children. Dev. Neurospychol 22, 595–624. [DOI] [PubMed] [Google Scholar]
- Mattson SN, Bernes GA, Doyle LR, 2019. Fetal Alcohol Spectrum Disorders: A Review of the Neurobehavioral Deficits Associated with Prenatal Alcohol Exposure. Alcoholism: Clinical and Experimental Research. 6, 1049–1062. 10.1111/acer.14040 [DOI] [PMC free article] [PubMed] [Google Scholar]
- Mattson SN, Crocker N, Nguyen TT, 2011. Fetal Alcohol Spectrum Disorders: Neuropsychological and Behavioral Features. Neuropsychol. Rev 21, 81–101. 10.1007/s11065-011-9167-9 [DOI] [PMC free article] [PubMed] [Google Scholar]
- Mattson SN, Foroud T, Sowell ER, Jones KL, Coles CD, Fagerlund Å, Autti-Rämö I, May PA, Adnams CM, Konovalova V, Wetherill L, Arenson AD, Barnett WK, Riley EP, 2010. Collaborative Initiative on Fetal Alcohol Spectrum Disorders: Methodology of Clinical Projects. Alcohol Fayettev. N 44, 635–641. 10.1016/j.alcohol.2009.08.005 [DOI] [PMC free article] [PubMed] [Google Scholar]
- Mattson SN, Goodman AM, Caine C, Delis DC, Riley EP, 1999. Executive Functioning in Children With Heavy Prenatal Alcohol Exposure. Alcohol. Clin. Exp. Res 23, 1808–1815. 10.1111/j.1530-0277.1999.tb04077.x [DOI] [PubMed] [Google Scholar]
- May PA, Gossage JP, Kalberg WO, Robinson LK, Buckley D, Manning M, Hoyme HE, 2009. Prevalence and epidemiologic characteristics of FASD from various research methods with an emphasis on recent in-school studies. Dev. Disabil. Res. Rev 15, 176–192. 10.1002/ddrr.68 [DOI] [PubMed] [Google Scholar]
- McClelland MM, Morrison FJ, 2003. The emergence of learning-related social skills in preschool children. Early Childhood Research Quarterly. 18, 206–224. 10.1016/S0885-2006(03)00026-7 [DOI] [Google Scholar]
- Mischel W, Shoda Y, Rodriguez ML, 1989. Delay of Gratification in Children. Science 244, 933–938. [DOI] [PubMed] [Google Scholar]
- Nash K, 2012. Improving Executive Functioning in Children with Fetal Alcohol Spectrum Diosrders Using the Alert Program for Self Regulation [Doctoral Dissertation, University of Toronto]. [Google Scholar]
- Pritchard Orr AB, Keiver K, Bertram CP, Clarren S, 2018. FAST Club: The Impact of a Physical Activity Intervention on Executive Function in Children With Fetal Alcohol Spectrum Disorder. Adapt. Phys. Act. Q 35, 403–423. 10.1123/apaq.2017-0137 [DOI] [PubMed] [Google Scholar]
- Rasmussen C, 2005. Executive Functioning and Working Memory in Fetal Alcohol Spectrum Disorder. Alcohol. Clin. Exp. Res 29, 1359–1367. 10.1097/01.alc.0000175040.91007.d0 [DOI] [PubMed] [Google Scholar]
- Rabinovici GD, Stephens ML, Possine KL, 2015. Executive Dysfunction. Continuum Lifelong Learning in Neurology. 21, 646–659. 10.1212/01.CON.0000466658.05156.54 [DOI] [PMC free article] [PubMed] [Google Scholar]
- Roid GH, 2003. Stanford Binet intelligence scales (5th ed.). Itasca, IL: Riverside Publishing. [Google Scholar]
- Schonfeld AM, Paley B, Frankel F, O’Connor MJ, 2006. Executive Functioning Predicts Social Skills Following Prenatal Alcohol Exposure. Child Neuropsychol. 12, 439–452. 10.1080/09297040600611338 [DOI] [PubMed] [Google Scholar]
- Shin H, 2017. Friendship Dynamics of Adolescent Aggression, Prosocial Behavior, and Social Status: The Moderating Role of Gender. J. Youth Adolesc 46, 2305–2320. 10.1007/s10964-017-0702-8 [DOI] [PubMed] [Google Scholar]
- Sørlie M, Hagen KA, Nordahl KB, 2020. Development of social skills during middle childhood: Growth trajectories and school-related predictors. International Journal of School & Educational Psychology. 10.1080/21683603.2020.1744492 [DOI] [Google Scholar]
- Soto-Icaza P, Aboitiz F Billeke P, 2015. Development of social skills in children: neural and behavioral evidence for the elaboration of cognitive models. Frontiers in Neuroscience. 9, 333 10.3389/fnins.2015.00333 [DOI] [PMC free article] [PubMed] [Google Scholar]
- Sparrow SS, Cicchetti DV, Saulnier CA, 2016. Vineland adaptive behaviors scales, Third edition (Vineland-3) Bloomington: NCS Pearson, Inc. [Google Scholar]
- Stevens SA, Nash K, Koren G, Rovet J, 2013. Autism characteristics in children with fetal alcohol spectrum disorders. Child Neuropsychol. 19, 579–587. 10.1080/09297049.2012.727791 [DOI] [PubMed] [Google Scholar]
- Strauss E, Sherman EMS, Spreen O, 2006. A compendium of neuropsychological tests. 3rd ed. Oxford University Press, New York. [Google Scholar]
- Teivaanmäki S, Hudanpää H, Kiuru N, Aronen E, Närhi V, Klenberg L, 2020. Heterogeneity of executive functions among preschool children with psychiatric symptoms. European Child & Adolescent Psychiatry. 29, 1237–1249. 10.1007/s00787-019-01437-y [DOI] [PMC free article] [PubMed] [Google Scholar]
- Thomas SE, Kelly SJ, Mattson SN, Riley EP, 1998. Comparison of Social Abilities of Children with Fetal Alcohol Syndrome to Those of Children with Similar IQ Scores and Normal Controls. Alcohol. Clin. Exp. Res 22, 528–533. 10.1111/j.1530-0277.1998.tb03684.x [DOI] [PubMed] [Google Scholar]
- Urberg KA, Degirmencioglu SM, Tolson JM, 2016. Adolescent Friendship Selection and Termination: The Role of Similarity: J. Soc. Pers. Relatsh 10.1177/0265407598155008 [DOI] [Google Scholar]
- Watson AC, Nixon CL, Wilson A, Capage L, 1999. Social interaction skills and theory of mind in young children. Dev. Psychol 35, 386–391. 10.1037/0012-1649.35.2.386 [DOI] [PubMed] [Google Scholar]
- Wechsler D, 2014. WISC-V : Wechsler Intelligence Scale for Children. NCS Pearsons, Inc., San Antonio, Texas. [Google Scholar]
- Weintraub S, Dikmen SS, Heaton RK, Tulsky DS, Zelazo PD, Bauer PJ, Carlozzi NE, Slotkin J, Blitz D, Wallner-Allen K, Fox NA, Beaumont JL, Mungas D, Nowinski CJ, Richler J, Deocampo JA, Anderson JE, Manly JJ, Borosh B, Havlik R, Conway K, Edwards E, Freund L, King JW, Moy C, Witt E, Gershon RC, 2013. Cognition assessment using the NIH Toolbox. Neurology 80, S54–S64. 10.1212/WNL.0b013e3182872ded [DOI] [PMC free article] [PubMed] [Google Scholar]
- Welsh MC, Pennington BF, Groisser DB, 1991. A normative‐developmental study of executive function: A window on prefrontal function in children. Dev. Neuropsychol 7, 131–149. 10.1080/87565649109540483 [DOI] [Google Scholar]
- Whaley SE, O’Connor MJ, Gunderson B, 2001. Comparison of the Adaptive Functioning of Children Prenatally Exposed to Alcohol to a Nonexposed Clinical Sample. Alcohol. Clin. Exp. Res 25, 1018–1024. 10.1111/j.1530-0277.2001.tb02311.x [DOI] [PubMed] [Google Scholar]
- Wozniak JR, Fink BA, Fuglestad AJ, Eckerle JK, Boys CJ, Sandness KE, Radke JP, Miller NC, Lindgren C, Brearley AM, Zeisel SH, Georgieff MK, 2020. Four-year follow-up of a randomized controlled trial of choline for neurodevelopment in fetal alcohol spectrum disorder. J. Neurodev. Disord 12, 9 10.1186/s11689-020-09312-7 [DOI] [PMC free article] [PubMed] [Google Scholar]
- Wozniak JR, Fuglestad AJ, Eckerle JK, Fink BA, Hoecker HL, Boys CJ, Radke JP, Kroupina MG, Miller NC, Brearley AM, Zeisel SH, Georgieff MK, 2015. Choline supplementation in children with fetal alcohol spectrum disorders: a randomized, double-blind, placebo-controlled trial. Am. J. Clin. Nutr 102, 1113–1125. 10.3945/ajcn.114.099168 [DOI] [PMC free article] [PubMed] [Google Scholar]
- Wozniak JR, Fuglestad AJ, Eckerle JK, Kroupina MG, Miller NC, Boys CJ, Brearley AM, Fink BA, Hoecker HL, Zeisel SH, Georgieff MK, 2013. Choline supplementation in children with Fetal Alcohol Spectrum Disorders (FASD) has high feasibility and tolerability. Nutr. Res. N. Y. N 33 10.1016/j.nutres.2013.08.005 [DOI] [PMC free article] [PubMed] [Google Scholar]
- Wozniak JR, Mueller BA, Mattson SN, Coles CD, Kable JA, Jones KL, Boys CJ, Lim KO, Riley EP, Sowell ER, 2017. Functional Connectivity Abnormalities and Associated Cognitive Deficits in Fetal Alcohol Spectrum Disorders (FASD). Brain Imaging Behav. 11, 1432–1445. 10.1007/s11682-016-9624-4 [DOI] [PMC free article] [PubMed] [Google Scholar]
- Zelazo PD, Müller U, 2011. Executive function in typical and atypical development, in: The Wiley-Blackwell Handbook of Childhood Cognitive Development, 2nd Ed Wiley-Blackwell, pp. 574–603. [Google Scholar]