

Abstract
Background:
Co-infection with hepatitis B virus (HBV) and human immunodeficiency virus (HIV) is common in sub-Saharan Africa (SSA) and can rapidly progress to cirrhosis and hepatocellular carcinoma. Recent data demonstrate ongoing HBV transmission among HIV-infected adults in SSA, suggesting that complications of HIV/HBV co-infection could be prevented with HBV vaccination. Because HBV vaccine efficacy is poorly understood among HIV-infected persons in SSA, we sought to characterize the humoral response to the HBV vaccine in HIV-seropositive Ugandan adults.
Methods:
We enrolled HIV-infected adults in Kampala, Uganda without serologic evidence of prior HBV infection. Three HBV vaccine doses were administered at 0, 1 and 6 months. Anti-HBs levels were measured 4 weeks after the third vaccine dose. “Response” to vaccination was defined as anti-HBs levels ≥10 IU/L and “high response” as ≥100 IU/L. Regression analysis was used to determine predictors of response.
Results:
Of 251 HIV-positive adults screened, 132 (53%) had no prior HBV infection or immunity and were enrolled. Most participants were women [89 (67%)]; median (IQR) age was 32 years (27–41), and 68 (52%) had received antiretroviral therapy (ART) for >3 months. Median (IQR) CD4 count was 426 (261–583), and 64 (94%) of the 68 receiving ART had undetectable plasma HIV RNA. Overall, 117 (92%) participants seroconverted to the vaccine (anti-HBs ≥10 IU/L), with 109 (86%) participants having high-level response (anti-HBs ≥100IU/L). In multivariate analysis, only baseline CD4 >200 cells/mm3 was associated with response [OR=6.97 (1.34–34.71), p=0.02] and high-level response [OR=4.25 (1.15–15.69)], p=0.03].
Conclusion:
HBV vaccination was effective in eliciting a protective humoral response, particularly among those with higher CD4 counts. Half of the screened patients did not have immunity to HBV infection, suggesting a large at-risk population for HBV infection among HIV-positive adults in Uganda. Our findings support including HBV vaccination as part of routine care among HIV-positive adults.
Keywords: Immune response, Hepatitis B vaccine, HIV seropositive adults, sub-Saharan Africa
Introduction
Both hepatitis B (HBV) and human immunodeficiency virus (HIV) are endemic in sub-Saharan Africa (SSA), with an estimated 60 million persons with HBV infection and 25.6 million persons living with HIV [1, 2]. In Uganda, approximately 4–17% of HIV-infected individuals are co-infected with HBV [3–6]. Co-infection results in high rates of persistent HBV infection, with potential consequences of cirrhosis, liver failure and hepatocellular carcinoma [7]. The HIV-induced proinflammatory state may also drive HBV-related liver disease progression, and emerging data suggest that HBV may also accelerate HIV progression in SSA [8, 9].
Recent work in Uganda shows that if we follow 1000 HIV-infected adults for a period of 1 year, 12 will get HBV infection [10], suggesting that many liver-related complications of HIV/HBV co-infection could be prevented by timely HBV vaccination. The standard HBV vaccine regimen has a ≥ 90% efficacy in the healthy population [11, 12], but its efficacy in the HIV-infected population is less clear, with reported rates ranging from 34–88.6% [13–18], and factors associated with response include CD4 T-cell count, plasma HIV RNA, age, gender, co-infection with hepatitis C virus, alcohol abuse and duration of antiretroviral therapy (ART) [13, 15, 16, 19]. Moreover, knowledge on the efficacy of HBV in HIV-infected populations in Africa is limited as only one of these studies was performed among adults in SSA [15].
Uganda, like many other countries in SSA, introduced routine infant HBV vaccination at the beginning of this millennium (2002) [20] and still strives to improve its third hepatitis B vaccine dose coverage among children[21]. Currently, HBV vaccination of HIV-infected adults in Uganda is not standard practice. To evaluate the potential efficacy of HBV immunization in this population, we measured the humoral response to the hepatitis B vaccine in HIV-infected adults attending an urban HIV clinic in Kampala, Uganda.
Methods
Study participants:
Participants were recruited from the Communicable Diseases Clinic of Mulago National Referral Hospital, which serves as the teaching hospital for Makerere University in Kampala, Uganda. This large urban HIV care centre offers HIV counselling and testing services and provides ART based on the national guidelines that recommend initiation of ART at the earliest opportunity regardless of disease stage, CD4 T-cell count or HIV viral load [22]. The centre does not offer routine hepatitis B screening or vaccination services to adults. All adult clients (≥18 years old) who presented for care during the period of November 2015 to October 2016 were asked to participate in this study and those who provided written informed consent were screened. A standardized form was used to capture data on socio-demographic factors, hepatitis B and HIV history. Current CD4 count, ART status and ART regimen were abstracted from the participant medical charts. We excluded patients who had a history of hypersensitivity to vaccines or intolerance to any of the HBV vaccine components as well as those who were pregnant, had decompensated liver disease or hepatocellular carcinoma. Those who met the eligibility criteria were screened for HBV infection as well as immunity to HBV using qualitative hepatitis serologic tests: hepatitis B surface antigen (HBsAg) marker (HBsAg; Murex DiaSorin, Dartford, United Kingdom), hepatitis B core antibody-total (anti-HBc total; Murex DiaSorin, Dartford, United Kingdom) and the antibody to the hepatitis B surface antigen (anti-HBs) (DiaSorin LIAISON anti-HBs II assay (DiaSorin, Saluggia, Italy). Both ART-experienced and ART-naïve participants that tested negative for all the above markers were enrolled. Blood for plasma HIV ribonucleic acid (RNA) testing by polymerase chain reaction (PCR) assay (Roche Taqman©) was obtained prior to vaccination.
Vaccination and measurement of response:
All participants received 20 μg of three vaccine doses (Euvax, LG Sciences) into the deltoid muscle using the standard HBV vaccination schedule of 0, 1 and 6 months. The hepatitis B surface antibody (anti-HBs) titer levels were measured at 4 weeks after the third vaccine dose (DiaSorin LIAISON anti-HBs II assay, DiaSorin, Saluggia, Italy). All hepatitis B serologic tests were processed at the immunology laboratory of the Makerere University College of Health Sciences while HIV RNA was tested at the Makerere University Walter Reed Project laboratory in Kampala, Uganda.
Outcomes and definitions:
The immune response to the HBV vaccine is assessed by measuring antibody levels, with anti-HBs titer levels ≥10U/L traditionally considered protective. A higher cut off of ≥100U/L has also been used for assessment of response based on evidence that higher post primary vaccination titer levels may be needed to maintain protection for a long time [23–26]. Consequently, we evaluated two primary study outcomes: 1) immune response to the HBV vaccine defined as anti-HBs titre levels ≥ 10IU/L, and 2) high-level immune response defined as anti-HBs titre levels ≥ 100IU/L at 4 weeks after receiving the third dose of the HBV vaccine. Predictor variables evaluated for HBV vaccine response included socio-demographic and clinical factors: age, gender, alcohol use, cigarette smoking, HIV WHO disease stage, body mass index (BMI), ART use, baseline CD4 T-cell count and HIV RNA levels.
Statistical analysis:
Data were analyzed using STATA software package, version 14.0 (College Station, Texas, USA). Descriptive characteristics of the patients were summarized. Categorical variables were evaluated by means of proportions and percentages, while medians (interquartile range) were obtained for the continuous variables. The HIV viral load was log transformed. Response was assessed at two anti-HBs titer levels: ≥10 and ≥100. Since the data were not of a normal distribution, the differences in the median levels of predictor variables at both anti-HBs titer cut-off levels were assessed by the Mann Whitney U test. Logistic regression was conducted to evaluate the variables that were associated with the humoral response. For univariate analysis, continuous variables such as CD4, HIV viral load, BMI, duration on ART and age were stratified. CD4 was also analyzed as a continuous linear predictor. Variables with a p-value <0.2 were included in multivariate logistic regression. Results of the association of the variables to the outcome were summarized by odds ratios, 95% confidence intervals and p values. Statistical significance was considered at a 2-sided p-value of ≤0.05.
All study participants provided written informed consent. This study was approved by the Institutional Review Boards of the Fred Hutchinson Cancer Research Center, School of Medicine Makerere University College of Health Sciences, Mulago Hospital and the Uganda National Council of Science and Technology. Clearance was granted by the Uganda National Drug Authority. This study was registered with ClinicalTrials.gov (reference number NCT02316444).
Results
Of the 251 persons who were screened, 116 were excluded because they were immune (anti-HBs positive; n=27), previously infected with HBV (anti-HBc positive; n=79) or chronic carriers (HBsAg positive; n=10). We enrolled 135 participants with no HBV immunity, of whom two withdrew consent and one died before receipt of the vaccine (Figure 1). The 132 participants who entered the study were predominately women 89 (67%), and the median (IQR) age of the participants was 32 (27–41) years (Table 1). Sixty eight (52%) participants had received ART for ≥3 months; of these 68 participants, 64 (94%) had undetectable HIVRNA (<34 copies/mL). The median (IQR) CD4 T-cell count was 426 cells/μL (261–583), however CD4 T-cell count data was not available among 24 (18%) participants. A comparison of participants with and without CD4 T-cell count data showed that demographic and clinical characteristics were similar between the groups, although those with missing CD4 T-cell count values were more likely to be on ART and on ART for a longer duration (Supplemental Table S1).
FIGURE 1: FLOWCHART OF PARTICIPANTS.
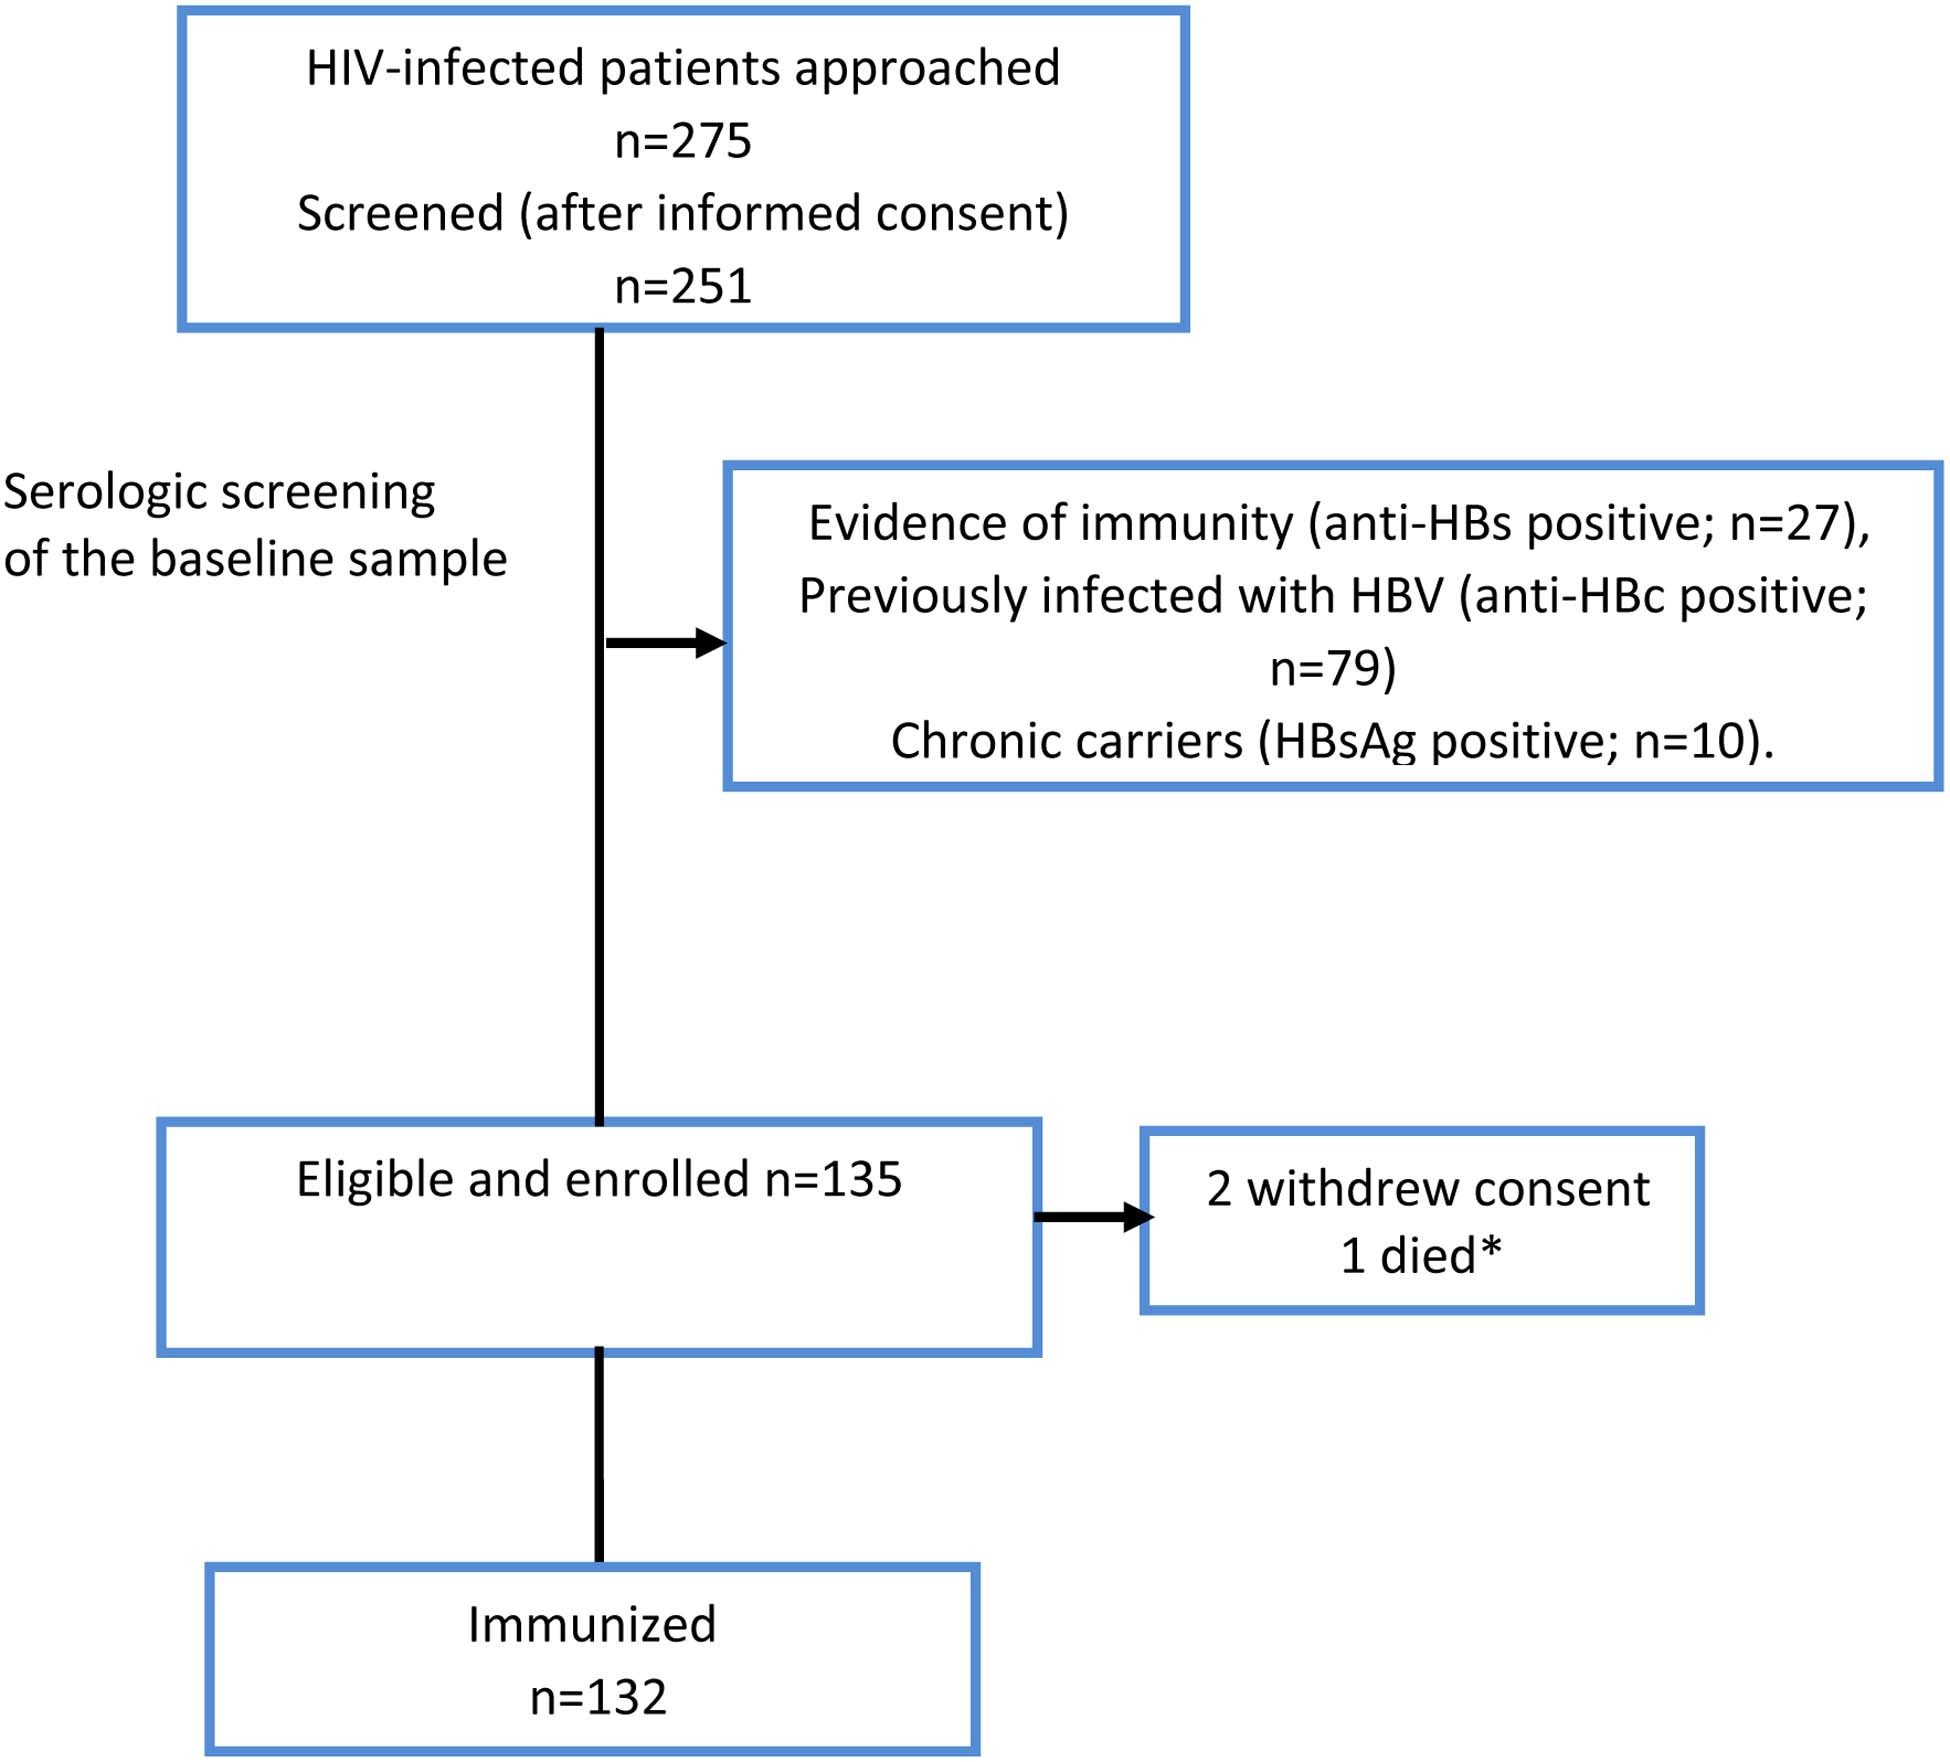
Participant selection process: A total of 251 patients were screened for inclusion in the study. Of these, 116 were excluded because of they were either immune or currently / previously infected with HBV. The remaining individuals were enrolled. The results of the laboratory tests are as summarized above. Anti-HBc = antibody to HBV core antigen; HBsAg = hepatitis B surface antigen; anti-HBs = antibody to hepatitis B surface antigen. * Died before enrollment
TABLE 1:
DEMOGRAPHIC AND CLINICAL CHARACTERISTICS OF STUDY PARTICIPANTS.
| Variable | Total N=132 | |
|---|---|---|
| Women, n (%) | 89 (67.4) | |
| Age (years), Median (IQR) | 32(27–41) | |
| Body mass index (BMI)1 Median (IQR) | 24.6 (21.5–28.0) | |
| Experienced | 68 (51.5) | |
| ART regimen | ||
| TDF based | 71 (75.5) | |
| Non-TDF based | 23 (24.5) | |
| Duration on ART (months) Median (IQR) | 5.1 (0–34.6) | |
| 1 | 54 (40.9) | |
| 2 | 42 (31.8) | |
| 3 | 30 (22.7) | |
| 4 | 6 (4.6) | |
| CD4 Overall3 Median (IQR) | 426 (261–583) | |
| HIV viral load log10 (copies/mL)4 | 3.71 (3.46–3.98) | |
| <34 (undetectable) | 64 (48.5) | |
| Education (%) | ||
| Pre-primary and Primary | 46 (34.8) | |
| Post primary | 86 (65.2) | |
| 0–3 | 66 (50.4) | |
| ≥4 | 65 (49.6) | |
| Yes | 12 (9.1) | |
| Yes | 21 (15.9) | |
| Yes | 31 (23.5) | |
| Never | 116 (87.9) | |
| Current | 2 (1.5) | |
| Past | 14 (10.6) | |
TDF= tenofovir, 3TC= lamivudine, EFV= efavirenz, NVP=Nevirapine, AZT= Zidovudine, LPVr=boosted lopinavir,
missing data for 4 participants,
ART naïve definition <3/12 on ART,
missing CD4 results in 24,
geometric mean computation didn’t factor in the 64/132 whose HIV viral load was undetectable.
missing data in 1 participant
All 132 participants received both the baseline vaccine dose and the 1-month dose, and 127 received the 6month dose. Five participants did not receive the third dose as they were lost to follow up. Humoral response was assessed in the 127 participants who had completed the standard vaccination series and provided post vaccination sera. Overall, 117 (92%) individuals seroconverted to the vaccine. The majority of participants (109; 86%) were high-level responders with anti-HBs titer levels ≥100IU/L; 8 (6%) were low-level responders (anti-HBs levels 10–99 IU/L); and 10 (8%) were non-responders (titer levels <10 IU/L). As compared with non-responders, responders (anti-HBs >10 IU/L) were more likely to have a higher median (IQR) CD4 T-cell count [426 (271–592) vs 263.5 (77.5–473.5) cells/μL, p=0.09]. There was no statistically significant difference between the groups in median (IQR) log10 HIV viral load level [1.23 (1.23–3.92) vs 3.19 (1.23–4.83) copies/mL, p=0.27] or in median (IQR) duration on ART [7.1 (0.0–34.8) vs 2.6 (0.23–40.9) months, p=0.88] (Table 2). High level responders (anti-HBs ≥100IU/L) were more likely than low level responders (anti-HBs 10–99IU/L) and non-responders (anti-HBs <10) to have a higher median (IQR) CD4 count [426 (298–593) vs 239 (101–443) cells/μL, p= 0.01] and a lower median (IQR) log10 HIV viral load level [1.23 (1.23–3.80) vs 3.80 (1.23–4.77) copies/mL, p=0.03], but there was no difference in median (IQR) duration on ART [11.0 (0–37.9) vs 1.3 (0–22.6) months, p=0.30] (Table 2). There was a 16% higher anti-HBS for each 100 CD4 cells/mL (P = 0.01) (supplementary figure 1).
TABLE 2.
DESCRIPTIVE CHARACTERISTICS BY RESPONSE LEVEL
| All Responders vs Non-responders | High-level Response vs Low level and Non-Responders | |||||
|---|---|---|---|---|---|---|
| Parameter (median, IQR) | All Responders Anti-HBs ≥10IU/mL N=117 | Non-responders Anti-HBs<10IU/mL N=10 | P-value | High-level responders Anti-HBs ≥100IU/mL N=109 | Low Level Responders and non-responders Anti-HBs <100IU/mL N=18 | p-value |
| CD4 count* (cells/μL) | 426 (271– 592) | 263.5 (77.5–473.5) | 0.09 | 426 (298–593) | 239 (101–443) | 0.01 |
| HIV viral load log 10 (copies/mL) | 1.23 (1.23–3.92) | 3.19 (1.23–4.82) | 0.27 | 1.23 (1.23– 3.80) | 3.80 (1.23–4.77) | 0.03 |
| Duration on ART (months) | 7.1 (0.0–34.8) | 2.6 (0.23–40.9) | 0.88 | 11.03 (0.0–37.9) | 1.27 (0.0–22.6) | 0.30 |
| BMI | 24.7 (21.9–28.1) | 23.3 (20.2–25.0) | 0.29 | 24.73 (22.67–29.05) | 24.18 (21.2–27.1) | 0.20 |
Compared to table 1, 5 participants without the vaccine response data are also omitted
Among the 24 with missing CD4 T-cell data, 22 were responders and 20 high-level responders
BMI results missing for 4 participants; all high-level responders
In univariate analysis, CD4 T- cell count >200 cells/μL at enrollment was associated with both response [OR=6.31 (1.40–28.39), p= 0.02] and high-level response [OR=5.32 (1.55–18.24), p=0.01] (Table 3). In multivariate analysis, only the baseline CD4 T-cell count was associated with both response [OR=6.97 (1.34–34.71), p=0.02] and high-level response [OR=4.25 (1.15–15.69)], p=0.03] (Table 4). None of the other demographic or clinical variables was significantly associated with either level of response in multivariate analysis.
TABLE 3.
UNIVARIATE ANALYSIS OF HUMORAL RESPONSE BY LOGISTIC REGRESSION
| All responders Anti-HBs ≥10IU/mL N=117 | High-level responders Anti-HBs ≥100IU/mL N=109 | |||
|---|---|---|---|---|
| Odds Ratio (95% CI) | P-value | Odds Ratio (95% CI) | p-value | |
| Gender | ||||
| Men | Ref | Ref | ||
| Women | 0.23 (0.03–1.89) | 0.10 | 0.60 (0.18–1.97) | 0.39 |
| Age | ||||
| <30 | Ref | Ref | ||
| 30–39 | 0.58 (0.09–3.64) | 0.32 | 1.66 (0.45–6.14) | 0.50 |
| ≥40 | 0.29 (0.05–1.61) | 0.77 (0.246–2.44) | ||
| Education | ||||
| ≤primary | Ref | Ref | ||
| ≥secondary | 3.00 (0.80–11.25) | 0.10 | 4.61 (1.59–13.32) | 0.01 |
| ART status | ||||
| Naïve | Ref | Ref | ||
| Exposed | 1.09(0.30–3.96) | 0.90 | 1.42(0.52–3.87) | 0.49 |
| Duration on ART | ||||
| < 12 months | Ref | Ref | ||
| 12–24 | 0.98 (0.11–9.06) | 0.84 | 0.52 (0.12–2.29) | 0.20 |
| ≥24 | 1.51 (0.36–6.35) | 2.21 (0.66–7.41) | ||
| ART regimen | ||||
| TDF-based | Ref | Ref | ||
| Non-TDF based | 0.98 (0.18–5.25) | 0.87 | 1.11 (0.28–4.44) | 0.98 |
| None | 1.50 (0.29–7.85) | 0.97 (0.30–3.09) | ||
| CD4 T-cell count* | ||||
| ≤200 | Ref | Ref | ||
| >200 | 6.31 (1.40–28.39) | 0.02 | 5.32 (1.55–18.24) | 0.01 |
| HIV viral load | ||||
| Undetectable (<34) | Ref | Ref | ||
| Detectable (≥34) | 0.65 (0.17–2.44) | 0.52 | 0.46 (0.16–1.30) | 0.13 |
Among the 24 with missing CD4 T-cell data, 22 were responders and 20 high-level responders
TABLE 4.
MULTIVARIATE ANALYSIS OF HUMORAL RESPONSE
| All Response Anti-HBs ≥10IU/mL N=117 | High-level response Anti-HBs ≥100IU/mL N=109 | |||
|---|---|---|---|---|
| Odds Ratio (95% CI) | p-value | Odds Ratio (95% CI) | p-value | |
| CD4 T-cell count >200 (cells/μL) | 6.97 (1.34–34.71) | 0.02 | 4.25 (1.15–15.69) | 0.03 |
| HIV viral load (detectable) | 0.31 (0.08–1.28) | 0.11 | ||
| Education (>secondary) | 2.66 (0.55–12.79) | 0.22 | 3.35 (0.98–11.64) | 0.06 |
| Gender | 0.21 (0.02–2.02) | 0.18 | ||
Discussion
Our study is among the first to evaluate the humoral response to the HBV vaccine in a HIV-infected population in SSA. We found that 135 of 251 (>50%) persons screened did not have prior infection or immunity to HBV infection. This observation suggests there is a very large at-risk population for HBV infection among HIV-positive adults in Uganda. Following vaccination, we demonstrated a high humoral response rate to the HBV vaccine in our HIV–infected adult cohort that is similar to that reported in healthy populations [12]. This high response rate differs from some studies that showed sub-optimal seroconversion rates to the standard HBV vaccine series among HIV-positive individuals [19, 27–29], but it is similar to a study in Thailand that also found high HBV vaccine response rates among HIV-infected adults with fully suppressed HIV viral load and CD4 T-cell count of ≥200cells/μ [16]. Given the importance of immune status in vaccine response, it is possible that the participants’ degree of immune reconstitution differed among the studies despite apparently similar baseline CD4 T-cell counts documented in these studies. Of note, some authors reported the mean as opposed to the median CD4 T-cell counts of their study populations [28–30], and the reported CD4 data was often skewed as reflected by wide interquartile ranges [19, 27], which makes it challenging to determine if participant immune function as measured by CD4 was comparable across studies and may in fact contribute to differences observed in vaccine response. In addition, recent data indicate that host immunogenetics – particularly human leukocyte antigen (HLA) type – may influence response to HBV vaccine response [31–33], which were not accounted for in our study or the other studies evaluating vaccine response in HIV-infected individuals. These potential unmeasured genetic differences further highlight the importance of evaluating vaccine efficacy in diverse populations and geographic regions as we have done in this study.
We observed that a low CD4 T-cell count (<200 cell/μl) was associated with a poor response to the vaccine and, conversely, higher CD4 T-cell counts were associated with both levels of response. Previous studies have also reported high CD4 T-cell counts as a predictor of favorable humoral response [15, 16, 29]. Immunologically, the protective antibody against the HBV (anti-HBs) falls in the IgG class, and its production therefore requires a critical mass of CD4 T-cells. It is therefore likely that severe immunosuppression would lead to a poor response to the vaccine since depletion of CD4 T-cells over the course of HIV infection could impair antibody secretion [34].
We found no relationship between baseline HIV viral load and HBV vaccine immune response, contrary to what has been reported by other studies[15, 19, 27]. The fact that an undetectable HIV viral load was not associated with vaccine response in our study may be in part due to the fact that not all participants had evidence of immune reconstitution despite HIV viral suppression. Sixteen participants in our study had undetectable HIV viral load levels and a CD4 T-cell count of >=500 cell/μl; however, 6 participants with suppressed HIV viral load had a CD4 T-cell count under200 cell/μl. It is challenging to identify the independent contribution of ART use, HIV viral load and the CD4 T-cell count to the immune response to the HBV vaccine. However, our observation that HIV viral load and duration of ART were not independent predictors of vaccine response suggests that a reconstituted immune system as reflected by a higher CD4 T-cell count is most important to mounting an effective anti-HBV response.
The observed association between CD4 T-cell count and vaccine response has important clinical implications, especially in the era of “test and treat” in which HIV viral load is the primary measure of ART effectiveness rather than CD4 T-cell count [22]. Recent work shows that in Uganda and some other low and middle income countries, many patients with HIV still present for ART during advanced stages of the infection [35, 36] and that HIV viral load suppression is not necessarily associated with higher CD4 T-cell counts [37, 38]. Measurement of CD4 T-cell count prior to administration of the HBV vaccine may therefore be important to ensure that CD4 levels are sufficient to provide a likely response.
Our study population of predominantly young females (67%) of age range 27–41 fits the patterns of the local prevalence of these viral infections. Data from the recently-conducted Uganda national behaviour sero survey show that women within the above age range are more likely to be infected with HIV than their male counterparts. However, in the same range, current HBV infection was more likely to occur in males than in females [39].
Our study observed an association of education level with high level response in univariate analysis, although this association was not maintained in multivariate analysis. Of interest, a retrospective study of 437 HIV-infected adults in Greece also found that education level and lack of health insurance were associated with a poor response to the HBV vaccine [40]. It is possible that higher education is associated with better health seeking behaviors that may include early initiation of ART and better adherence to these medications. Our study did not capture data on health insurance as only a minority of individuals in Uganda are covered by private health insurance plans.
Our decision to assess our results at two different anti-HBs thresholds of 10 IU/L and 100 IU/L was in response to emerging concerns that the validity of the traditionally used cutoff of ≥10 IU/L may not be a surrogate for effective long-term response to the vaccine [41, 42] and whether the >10 IU/L threshold can accurately predict response in both the healthy and the HIV-infected sub-population. Furthermore, an increasing body of literature suggests that higher primary post vaccination anti-HBs titer levels are a stronger predictor for a persistently high humoral response [11, 24] and thus are the ideal. However, in our study the pre-vaccination CD4 count predicted response at both thresholds with the vast majority of our study population hitting the higher titer threshold of >100 IU/L, suggesting that the vaccine is effective for long-term protection in this HIV-infected sub-population. Some data however suggests that persons with anti-HBs titer levels <10IU/L may still be protected from HBV and that those who attain protective antibody titer levels may still be at risk of infection. This suggests that humoral response is an incomplete measure of the protective immunity and that vaccine-induced cell mediated immune response may also play a role in protection [42–44]. In the future, we plan to explore cell -mediated immune responses to HBV vaccination in our HIV infected population.
Currently, there is no consensus on how the best approach to confer immunity to non-responders Based on the available evidence, European HIV/AIDS, American liver association and CDC [45–48] guidelines propose several re-vaccination strategies: repeating the standard vaccination protocol once the viral load is fully suppressed on ART and the CD4 cell count is >350–500 cells/μL, applying a more intense vaccination protocol at 0,1,2, and 12 months, giving a booster dose or a new cycle with 40 μg (doubling the vaccine dose). These individuals may also benefit from a tenofovir-based ART regimen as it associated with a protective effect against incident HBV [10, 46, 49] as a bridging measure to successful vaccination.
Our study has some limitations. The CD4 T-cell counts of our participants were abstracted from their clinic charts, and this variable was missing among 24 (18%) of our participants. Overall, there were no differences in demographic or clinical characteristics of participants with or without CD4 T-cell data except that those with missing CD4 T-cell test results were more likely to be on ART and on ART for a longer duration. This finding is in line with current clinical practice in Uganda and much of SSA in which ART-experienced, virally-suppressed patients do not receive routine CD4 T-cell count monitoring. Most of the participants with missing CD4 T-cell counts (20/24; 83%) responded to the HBV vaccine, and it is likely that the majority of these participants would have had a CD4 T-cell count over 200 cell/μl. Therefore, the missing data would most likely have introduced a conservative bias to our findings and our observation that CD4 T-cell count over 200 cell/μl was associated with good response to the HBV vaccine may actually have been stronger if all participants had contributed CD4 T-cell data to the analysis. Secondly, we did not evaluate the cell mediated-response which could potentially constitute another arm of the immune system that confers protection against HBV infection.
Conclusion
Despite these limitations, our study is one of the first studies to evaluate the predictors of humoral response to the HBV vaccine in a HIV-infected population in SSA. We found that a high proportion of HIV-infected adults presenting to the HIV clinic did not have evidence of prior exposure or immunity to HBV infection and were at-risk of infection, underscoring the need for routine HBV testing and provision of HBV vaccination in this population. Even as childhood HBV vaccination has expanded in many countries in SSA, there is still a substantial number of young adults that neither received nor completed the three-HBV vaccine protocol [50]. Importantly, our study demonstrated protective anti-HBV immune responses were achieved by the large majority of HIV-infected adults, particularly among adults with CD4 T-cell counts >200 cell/μl. Together, these findings demonstrate the need for and the efficacy of routine HBV vaccination in HIV-infected adults, and support including HBV vaccination as part of routine HIV care in SSA.
Supplementary Material
Acknowledgment:
The authors wish to thank the staff of the Mulago Hospital, Kiruddu Hospital, Uganda Cancer Institute, Makerere University Department of Medicine and Fred Hutchinson Cancer Research Center for their contribution to the current study. We are also grateful to the study staff and participants. We are indebted to Marla Husnik for assistance with the study design and to Dr. Anna Wald for her review of the manuscript.
Funding: This study was funded in part by a D43 Grant on HIV-associated malignancies sponsored by the US National Institute of Health (D43 CA153720-01), NIH research training grant R25TW009345 funded by the Fogarty International Center through the Fogarty Global Health Fellowship, NIH Grant Number P30 AI027757 funded by the National Institute of Allergy and Infectious Disease, NIH Grant Number D43TW010132 supported by Office Of The Director, National Institutes Of Health (OD), National Institute Of Dental & Craniofacial Research (NIDCR), National Institute Of Neurological Disorders And Stroke (NINDS), National Heart, Lung, And Blood Institute (NHLBI), Fogarty International Center (FIC), National Institute On Minority Health And Health Disparities (NIMHD) through Makerere University (NURTURE fellowship) and the Uganda Cancer Institute /Africa Development Bank Scholarship and in part (SJR) by the Division of Intramural Research, National Institute of Allergy and Infectious Diseases (NIAID). The content of this publication is solely the responsibility of the authors and do not necessarily represent the official views of the supporting offices.
Footnotes
Publisher's Disclaimer: This is a PDF file of an unedited manuscript that has been accepted for publication. As a service to our customers we are providing this early version of the manuscript. The manuscript will undergo copyediting, typesetting, and review of the resulting proof before it is published in its final form. Please note that during the production process errors may be discovered which could affect the content, and all legal disclaimers that apply to the journal pertain.
Declaration of interests
The authors declare that they have no known competing financial interests or personal relationships that could have appeared to influence the work reported in this paper.
References
- 1.WHO Global Hepatitis Report 2017, http://www.who.int/hepatitis/publications/global-hepatitis-report2017/en.
- 2.https://www.unaids.org/sites/default/files/media_asset/UNAIDS_FactSheet_en.pdf.
- 3.Katusiime C, et al. , Characteristics of Sexually Transmitted Infections among High-Risk HIV-Positive Patients Attending an Urban Clinic in Uganda. J Int Assoc Provid AIDS Care, 2016. 15(1): p. 36–41. [DOI] [PubMed] [Google Scholar]
- 4.Calisti G, et al. , Epidemiology of HBV infection in a cohort of Ugandan HIV-infected patients and rate and pattern of lamivudine-resistant HBV infection in patients receiving antiretroviral therapy. Trans R Soc Trop Med Hyg, 2015. 109(11): p. 723–9. [DOI] [PubMed] [Google Scholar]
- 5.Price H, et al. , Hepatitis B serological markers and plasma DNA concentrations. Aids, 2017. 31(8): p. 1109–1117. [DOI] [PMC free article] [PubMed] [Google Scholar]
- 6.Baseke J, Musenero M, and Mayanja-Kizza H, Prevalence of hepatitis B and C and relationship to liver damage in HIV infected patients attending Joint Clinical Research Centre Clinic (JCRC), Kampala, Uganda. Afr Health Sci, 2015. 15(2): p. 322–7. [DOI] [PMC free article] [PubMed] [Google Scholar]
- 7.Singh KP, et al. , HIV-hepatitis B virus coinfection: epidemiology, pathogenesis, and treatment. Aids, 2017. 31(15): p. 2035–2052. [DOI] [PMC free article] [PubMed] [Google Scholar]
- 8.Idoko J, et al. , Impact of hepatitis B virus infection on human immunodeficiency virus response to antiretroviral therapy in Nigeria. Clin Infect Dis, 2009. 49(8): p. 1268–73. [DOI] [PMC free article] [PubMed] [Google Scholar]
- 9.Ladep NG, et al. , Rates and impact of hepatitis on human immunodeficiency virus infection in a large African cohort. World J Gastroenterol, 2013. 19(10): p. 1602–10. [DOI] [PMC free article] [PubMed] [Google Scholar]
- 10.Seremba E, et al. , Hepatitis B incidence and prevention with antiretroviral therapy among HIV-positive individuals in Uganda. Aids, 2017. 31(6): p. 781–786. [DOI] [PMC free article] [PubMed] [Google Scholar]
- 11.Lu J, et al. , Comparison of anti-HBs persistence after hepatitis B vaccination on two-dose schedule and three-dose schedule among adults: results from a 12-year follow up study in China. Hum Vaccin Immunother, 2019. 15(5): p. 1171–1176. [DOI] [PMC free article] [PubMed] [Google Scholar]
- 12.Van Den Ende C, et al. , The immunogenicity and safety of GSK’s recombinant hepatitis B vaccine in adults: a systematic review of 30 years of experience. Expert Rev Vaccines, 2017. 16(8): p. 811–832. [DOI] [PubMed] [Google Scholar]
- 13.Mena G, Garcia-Basteiro AL, and Bayas JM, Hepatitis B and A vaccination in HIV-infected adults: A review. Hum Vaccin Immunother, 2015. 11(11): p. 2582–98. [DOI] [PMC free article] [PubMed] [Google Scholar]
- 14.Fuster F, et al. , CD4/CD8 ratio as a predictor of the response to HBV vaccination in HIV-positive patients: A prospective cohort study. Vaccine, 2016. 34(16): p. 1889–95. [DOI] [PubMed] [Google Scholar]
- 15.Irungu E, et al. , Immune response to hepatitis B virus vaccination among HIV-1 infected and uninfected adults in Kenya. J Infect Dis, 2013. 207(3): p. 402–10. [DOI] [PMC free article] [PubMed] [Google Scholar]
- 16.Chaiklang K, et al. , Comparison of immunogenicity and safety of four doses and four double doses vs. standard doses of hepatitis B vaccination in HIV-infected adults: a randomized, controlled trial. PLoS One, 2013. 8(11): p. e80409. [DOI] [PMC free article] [PubMed] [Google Scholar]
- 17.Fonseca MO, et al. , Randomized trial of recombinant hepatitis B vaccine in HIV-infected adult patients comparing a standard dose to a double dose. Vaccine, 2005. 23(22): p. 2902–8. [DOI] [PubMed] [Google Scholar]
- 18.Chonwattana W, et al. , Hepatitis B vaccination uptake and correlates of serologic response among HIV-infected and uninfected men who have sex with men (MSM) in Bangkok, Thailand. Vaccine, 2016. 34(17): p. 2044–50. [DOI] [PubMed] [Google Scholar]
- 19.Launay O, et al. , Safety and immunogenicity of 4 intramuscular double doses and 4 intradermal low doses vs standard hepatitis B vaccine regimen in adults with HIV-1: a randomized controlled trial. Jama, 2011. 305(14): p. 1432–40. [DOI] [PubMed] [Google Scholar]
- 20.Guido François, C. D, M. Jeffrey Mphahlele, Rosemary Burnett, Guido Van Hal, André Meheus, Hepatitis B vaccination in Africa: mission accomplished? The Southern African Journal of Epidemiology and Infection, 2008. 23 (1): 24–28. [Google Scholar]
- 21.Uganda: WHO and UNICEF estimates of immunization coverage: 2016. revision.
- 22.Consolidated Guidelines for Prevention and Treatment of HIV in Uganda, Ministry of Health, 2016.
- 23.Launay O, et al. , Long-term Immune Response to Hepatitis B Virus Vaccination Regimens in Adults With Human Immunodeficiency Virus 1: Secondary Analysis of a Randomized Clinical Trial. JAMA Intern Med, 2016. 176(5): p. 603–10. [DOI] [PubMed] [Google Scholar]
- 24.Lopes VB, et al. , Long-term response rates of successful hepatitis B vaccination in HIV-infected patients. Vaccine, 2013. 31(7): p. 1040–4. [DOI] [PubMed] [Google Scholar]
- 25.Lara AN, et al. , Long-term protection after hepatitis B vaccination in people living with HIV. Vaccine, 2017. 35(33): p. 4155–4161. [DOI] [PubMed] [Google Scholar]
- 26.Hadler SC, et al. , Long-term immunogenicity and efficacy of hepatitis B vaccine in homosexual men. N Engl J Med, 1986. 315(4): p. 209–14. [DOI] [PubMed] [Google Scholar]
- 27.Bailey CL, Smith V, and Sands M, Hepatitis B vaccine: a seven-year study of adherence to the immunization guidelines and efficacy in HIV-1-positive adults. Int J Infect Dis, 2008. 12(6): p. e77–83. [DOI] [PubMed] [Google Scholar]
- 28.Rock C, et al. , Impact of a new vaccine clinic on hepatitis B vaccine completion and immunological response rates in an HIV-positive cohort. J Infect Public Health, 2013. 6(3): p. 173–8. [DOI] [PubMed] [Google Scholar]
- 29.Pettit NN, et al. , Factors associated with seroconversion after standard dose hepatitis B vaccination and high-dose revaccination among HIV-infected patients. HIV Clin Trials, 2010. 11(6): p. 332–9. [DOI] [PubMed] [Google Scholar]
- 30.Fuster F, et al. , CD4/CD8 ratio as a predictor of the response to HBV vaccination in HIV-positive patients: A prospective cohort study. Vaccine, 2016. 34(16): p. 1889–95. [DOI] [PubMed] [Google Scholar]
- 31.Nishida N, et al. , Key HLA-DRB1-DQB1 haplotypes and role of the BTNL2 gene for response to a hepatitis B vaccine. 2018. 68(3): p. 848–858. [DOI] [PMC free article] [PubMed] [Google Scholar]
- 32.Zhang Z, et al. , Host Genetic Determinants of Hepatitis B Virus Infection. Front Genet, 2019. 10: p. 696. [DOI] [PMC free article] [PubMed] [Google Scholar]
- 33.Davila S, et al. , New genetic associations detected in a host response study to hepatitis B vaccine. Genes Immun, 2010. 11(3): p. 232–8. [DOI] [PubMed] [Google Scholar]
- 34.Brenchley JM, et al. , CD4+ T cell depletion during all stages of HIV disease occurs predominantly in the gastrointestinal tract. J Exp Med, 2004. 200(6): p. 749–59. [DOI] [PMC free article] [PubMed] [Google Scholar]
- 35.Global Trends in CD4 Cell Count at the Start of Antiretroviral Therapy: Collaborative Study of Treatment Programs. Clin Infect Dis, 2018. 66(6): p. 893–903. [DOI] [PMC free article] [PubMed] [Google Scholar]
- 36.Wanyenze RK, et al. , Missed opportunities for HIV testing and late-stage diagnosis among HIV-infected patients in Uganda. PLoS One, 2011. 6(7): p. e21794. [DOI] [PMC free article] [PubMed] [Google Scholar]
- 37.Reynolds SJ, et al. , Failure of immunologic criteria to appropriately identify antiretroviral treatment failure in Uganda. Aids, 2009. 23(6): p. 697–700. [DOI] [PMC free article] [PubMed] [Google Scholar]
- 38.Moore DM, et al. , CD4+ T-cell count monitoring does not accurately identify HIV-infected adults with virologic failure receiving antiretroviral therapy. J Acquir Immune Defic Syndr, 2008. 49(5): p. 477–84. [DOI] [PubMed] [Google Scholar]
- 39.Ministry of Health, Uganda. Uganda Population-based HIV Impact Assessment (UPHIA) 2016–2017: Final Report. Kampala: Ministry of Health; July, 2019. . [Google Scholar]
- 40.Tsachouridou O, et al. , Predictors of humoral response to recommended vaccines in HIV-infected adults. Comp Immunol Microbiol Infect Dis, 2017. 54: p. 27–33. [DOI] [PubMed] [Google Scholar]
- 41.Mancinelli S, et al. , Antibody response to hepatitis B vaccine in HIV-exposed infants in Malawi and correlation with HBV infection acquisition. 2018. 90(6): p. 1172–1176. [DOI] [PubMed] [Google Scholar]
- 42.Jack AD, et al. , What level of hepatitis B antibody is protective? J Infect Dis, 1999. 179(2): p. 489–92. [DOI] [PubMed] [Google Scholar]
- 43.Gelinas L, et al. , Hepatitis B Virus Vaccine–Induced Cell-Mediated Immunity Correlates with Humoral Immune Response following Primary Vaccination during Infancy. ImmunoHorizons, 2017. 1(4): p. 42–52. [Google Scholar]
- 44.Linnemann CC and Askey PA, Susceptibility to hepatitis B despite high titre anti-HBs antibody. Lancet, 1984. 1(8372): p. 346–7. [DOI] [PubMed] [Google Scholar]
- 45.Geretti AM, et al. , British HIV Association Guidelines on the Use of Vaccines in HIV-Positive Adults 2015. HIV Med, 2016. 17 Suppl 3: p. s2–s81. [DOI] [PubMed] [Google Scholar]
- 46. https://www.eacsociety.org/files/guidelines-10.1_5.pdf.
- 47.Terrault NA, et al. , Update on Prevention, Diagnosis, and Treatment of Chronic Hepatitis B: AASLD 2018 Hepatitis B Guidance. Clin Liver Dis (Hoboken), 2018. 12(1): p. 33–34. [DOI] [PMC free article] [PubMed] [Google Scholar]
- 48.Schillie S, et al. , Prevention of Hepatitis B Virus Infection in the United States: Recommendations of the Advisory Committee on Immunization Practices. MMWR Recomm Rep, 2018. 67(1): p. 1–31. [DOI] [PMC free article] [PubMed] [Google Scholar]
- 49.Shilaih M, et al. , Dually Active HIV/HBV Antiretrovirals as Protection Against Incident Hepatitis B Infections: Potential for Prophylaxis. J Infect Dis, 2016. 214(4): p. 599–606. [DOI] [PubMed] [Google Scholar]
- 50.Breakwell L, et al. , The status of hepatitis B control in the African region. Pan Afr Med J, 2017. 27(Suppl 3): p. 17. [DOI] [PMC free article] [PubMed] [Google Scholar]
Associated Data
This section collects any data citations, data availability statements, or supplementary materials included in this article.