

Abstract
Purpose:
Health-related quality of life (HRQoL) is a multidimensional concept comprising multiple domains such as physical, emotional, and social well-being. Many analyses use a sum score to represent the construct. However, this approach implies that gain in one domain can compensate for a deficit in another, and thus such analyses may not capture HRQoL profiles. Additionally, within-individual change over time, such as improvement in one domain but deterioration in another, may not be detected. The objectives of this research are to demonstrate the utility of a non-compensatory approach by (1) evaluating this approach applied to HRQoL data, and (2) comparing the approach to a compensatory method.
Methods:
Data from a sample of 653 breast cancer survivors (BCS) provided five measurement time points over 18 months. We analyzed the scores from five domains on the FACT-B questionnaire (physical, functional, social, and emotional well-being and breast cancer-related concerns) using the multivariate hidden Markov model (MHMM), a non-compensatory approach that identifies different HRQoL states and associated BCS subgroups and their trajectories.
Results:
The MHMM delineated six states. States 1 and 2 had low well-being scores across all domains, with state 2 slightly better than state 1. States 3 and 4 had similar overall HRQoL scores, but different profiles with compensation occurring across the domains of both physical and social well-being. States 5 and 6 had almost identical overall scores with compensation occurring between the domains of both social and emotional well-being. Over time, states 3–6 mostly “communicated” with each other (with moderate probabilities of transitioning between states). Compensation across domains could mask subtle changes occurring in BCS. We found that a trend analysis using both compensatory and non-compensatory approaches showed improvement in the HRQoL in BCS over time.
Conclusion:
The non-compensatory analysis of FACT-B shows differential profiles and trajectories in the HRQoL of BCS not captured by the sum score or one-domain-at-a-time approach.
Keywords: FACT-B, Masking due to compensation, Transition analysis, Social well-being, Emotional well-being, Sum score
Introduction
Health-related quality of life (HRQoL) is a frequently used patient reported outcome in oncology. Measures of HRQoL are used to assess the impact of cancer and treatment side effects on patients’ physical, mental, and social well-being. HRQoL data aid in the evaluation of treatment toxicity and inform patient and clinician decision-making. The data are also becoming increasing important for assessing the needs and care of cancer survivors in alleviating “physical and psychological symptoms that persist or occur beyond active cancer treatment and to improve quality of life” [1].
HRQoL measures typically comprise several domains that reflect the multidimensional nature of quality of life measurement [2]. For example, the FACT-B questionnaire [3] includes physical, social, emotional, functional, and breast-specific domains. Often, these domains are considered in aggregate, such that a sum score is used to represent the overall HRQoL. Moreover, scores from respondents are typically averaged to derive summary measures. The SF-36 [4] yields 8 scale scores and is most frequently analyzed in terms of two weighted summary scores, MCS and PCS, and a single preference-based score. Compared to a multidimensional domain-level analysis, the summary score approach has such advantages as easier interpretation and less complicated analysis. The sum score approach has been frequently used in cancer studies [5, 6]. Unfortunately, this approach can also mask significant heterogeneity among respondents with markedly different HRQoL profiles.
Consider the following example of a hypothetical study population. Half of the subjects have a high HRQoL score while half of them have a low score. The mean HRQoL score would suggest an average HRQoL and does not take into account that HRQoL varies widely within the sample. In another example, HRQoL is reported to be average for most subjects. However, half of the respondents are high in physical well-being and low in emotional well-being, and half are low in physical and high in emotional well-being. The sum score cannot distinguish these differences. In other words, a high score in one domain can be said to compensate for a low score in another domain such that two total scores are similar, yet the HRQoL profiles are different. The sum score treats such varieties the same even though the study participants may have dramatically different needs and priorities. We introduce the term masking due to compensation (MDTC) to refer to this type of confounding.
To address this variation, one approach is to examine each HRQoL domain independently. Indeed, many have argued the case for quality of life measurements at levels of domains of function [7]. In other words, individual domain scores are analyzed separately and inferences would be made from each separate analysis. However, this approach is not ideal. Analyzing domains separately does not take into account how a person’s HRQoL domains are related and that such a relationship could be heterogeneous.
The issue of MDTC remains even when HRQoL domains are considered as predictors in analytic methods such as multiple regression or survival analyses. HRQoL sum scores or individual domain scores could be included as predictors. It has been demonstrated that multidimensional assessments of symptoms and HRQoL domains are more accurate in predicting survival than global HRQoL measures [2, 8]. However, even using domain scores as predictors does not necessarily solve the issue of MDTC, because methods such as linear multiple regression are inherently compensatory. When individual domain scores are entered into a linear model as predictors, deficits in one domain would be compensated by elevated values in another, as the different effects are additive. Although interaction terms could be included to alleviate possible compensation, the approach is often limited to pairwise interactions between domains, because higher-order interactions are extremely cumbersome to interpret. Additionally, including many interactions in a model increases multicollinearity dramatically.
As these examples illustrate, alternative non-compensatory methods are needed to capture contemporaneous variability in HRQoL domains. Ideally, these methods could also examine changes longitudinally. Non-compensatory approaches for cross-sectional data include latent class/profile analyses [9–11] and cluster analyses [12–14]. Latent class and latent profile analyses are both model-based methods for grouping individuals into different HRQoL profiles. A cluster analysis, on the other hand, uses nonparametric methods and heuristics to derive subgroups of individuals with similar HRQoL measures in all domains. Both of these methods jointly analyze multiple domain outcomes, and a high score in one domain does not compensate for a low score in another. Other multivariate statistical methods are also possible for circumventing the MDTC phenomenon; one example is multidimensional scaling [15]. However, many of these methods are limited to cross-sectional data.
The Multivariate Hidden Markov Model (MHMM; [16–19]) is a non-compensatory longitudinal approach with the potential to delineate different subgroups of individuals. Subgroups are differentiated according to a profile of domain scores consisting of multiple variables, hereafter called profile variables. Individuals within a subgroup are relatively homogeneous with respect to the profile variables. These subgroups can then be further analyzed, allowing for the determination of not only HRQoL characteristics, but also for the size of the groups and movement between them. One can also look at variables such as sociodemographics and treatment characteristics associated with the subgroups. The MHMM that we use in the current study allows mixed-mode continuous and discrete profile variables to develop a joint HRQoL profile and can include covariates. With roots in the engineering and machine learning literature, [20] the MHMM is in a special family of graphical models and functionally overlaps with the latent Markov model [21, 22]. As a special case of graphical models, the MHMM has been proven to be highly adaptable for handling a broad range of applications, including imaging and genetics. Predictive models can be formed, for example, for transitions between different statuses of individuals over time. The MHMM is also highly scalable—that is, it has the ability to handle large data.
In this study, to illustrate the non-compensatory approach for analyzing HRQoL data, we applied the MHMM to a sample of 653 breast cancer survivors (BCS) and compared this approach to a traditional temporal analysis using an overall sum score as well as domain scores. This sample was selected because the comparison required a sufficiently large, longitudinal dataset that measures HRQoL. Specifically, the current analyses have several goals: to determine and characterize subgroups based on HRQoL domains derived using the FACT-B questionnaire (Objective 1); to determine the prevalence of these subgroups at five separate time points (Objective 2); and to examine transitions between subgroups over time (Objective 3). Finally, we contrast the MHMM-based, non-compensatory results with those of the sum score approach (Objective 4).
Methods
Study sample
This was a secondary analysis of a longitudinal study of age-related differences in adjusting to a breast cancer diagnosis. Details on study recruitment and eligibility are reported elsewhere [23]. Briefly, women were recruited within 8 months of breast cancer diagnosis from Memorial Sloan Kettering Cancer Center (MSKCC) and the University of Texas (UT)-Southwestern Center for Breast Care between 2002 and 2006 and followed until 2008. Eligibility criteria included a first-time diagnosis of stage I-III breast cancer, age ≥ 18 years, and ability to read and write English. Data were collected at 5 time points: the initial baseline survey (administered within 8 months of breast cancer diagnosis), and 3, 6, 12, and 18 months following completion of the baseline survey. The self-administered questionnaire included questions on symptoms, sociodemographics, HRQoL, and psychosocial factors. A medical chart review was performed one year after the first survey to obtain treatment-related data. Wake Forest School of Medicine (WFSM) was the leading institution of the study and also served as study coordinating center. All 3 sites (WFSM, MSKCC, and UT-Southwestern) received approval from their Institutional Review Boards (WFSM IRB number BG01–100). Study participants did not sign consent forms. They were mailed a baseline survey to complete and survey completion was considered as consent.
Measures
HRQoL
The Functional Assessment of Cancer Therapy–Breast (FACT-B) [3] questionnaire was used to measure cancer-related QOL. The FACT-B consists of the FACT General (FACT-G) subscales (26 items) and the Breast Cancer Specific Concerns subscale (BCSC, 9 items). FACT-G consists of four domains of well-being: physical, social/family, emotional, and functional. Therefore, together with the BCSC, there are a total of five domains. Items are based on a five-point scale and refer to the past seven days. Items are summed within a domain to derive a domain-level score, and higher scores reflect better HRQoL. Overall HRQoL is the sum of domain scores, with a possible range of 0 to 140.
Cancer-related variables
Cancer-related variables obtained from medical charts included cancer stage (I, II, or II) as defined at diagnosis based on tumor size, lymph node status, and metastases, as well as two treatment variables: chemotherapy status (ever yes/no) and radiation (ever yes/no). Baseline values of treatment variables were used in the study.
Statistical analysis
To address Objective 1, we first verified the FACT-B factor structure such that the domain scores as identified in the original FACT-B instrument could be appropriately applied to this sample. The confirmatory factor analysis for this purpose produced goodness-of-fit statistics including RMSE, CFI, and TLI. Factor analysis was conducted using software program Mplus v7.0 [24]. Based on the factor analysis results, domain scores were used as profile variables. The MHMM was then used to derive different HRQoL subgroups of respondents. Like the latent profile analysis, the MHMM uses multiple variables (in this case domain scores) to form an HRQoL profile and determine the appropriate number of subgroups, K, for capturing both intra-individual and inter-individual variation. The Bayesian Information Criterion (BIC) [25] was used to determine K. Models with a range of K were tested and, as recommended, the model with the lowest BIC value was selected [17–19]. Substantive consideration was also applied (e.g., subgroup size) to decide the final K. The MHMM assumes that over the course of a study, BCS may change subgroup membership. The Markov assumption asserts that the likelihood of a person’s transition to another subgroup or remaining within the same subgroup depends only on the subgroup membership at that specific point in time. Figure 1 visualizes the structure and parameters in the MHMM for the BCS data.
Fig. 1.
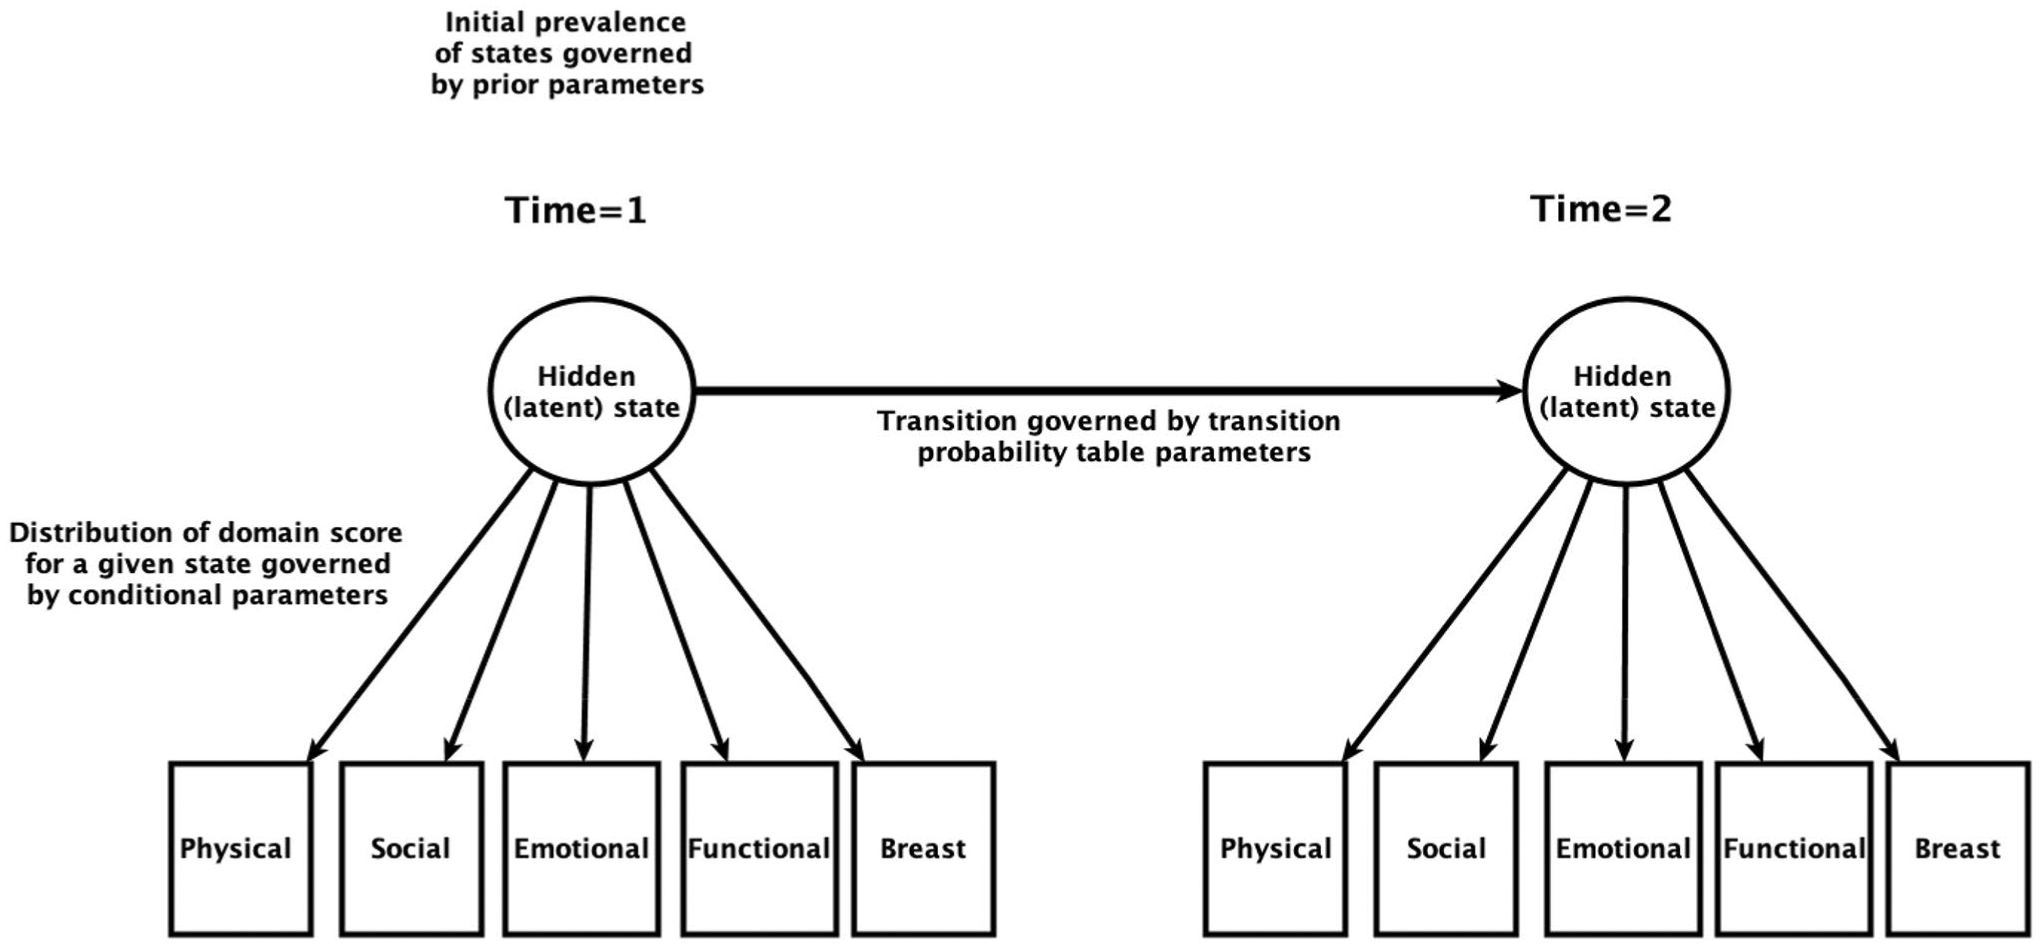
Visual representation of the multivariate hidden Markov model for breast cancer survivor data. Only two time points are shown. The number of hidden (latent) states K is determined by the Bayesian Information Criterion. The three sets of parameters governing the behavior of the MHMM are illustrated in text
Once the subgroups were established after both statistical and substantive considerations, we analyzed the profile of each and reported interpretations. Descriptive statistics were used to report subgroup characteristics in terms of demographic, cancer stage, and cancer treatment status variables. For Objectives 2 and 3 that examined the prevalence and probabilities of transitioning from one subgroup to another, we reported summaries of parameters estimated by the MHMM regarding individuals’ trajectories in the different subgroups. For Objective 4, we visualized domain score trends and overall FACT-B scores and contrasted the results with those derived from the MHMM.
Results
Sample characteristics
Out of 740 surveys mailed to women deemed eligible from chart reviews or telephone screening, 653 women completed baseline surveys, for an initial response rate of 88%. Baseline surveys were completed from as soon as 3 days post-diagnosis to 8 months post-diagnosis. A total of 565 women remained in the study by the final survey, for a retention rate of 86.5%. Completion of all parts of the survey questionnaire by respondents was high: for instance, at baseline, 12 months, and 18 months, all of the 565 respondents filled out the questionnaire. At six months, only one woman skipped the questionnaire.
Table 1 (last column) shows the characteristics of the total sample at baseline. The average age of the sample was 54.9 years. The majority (89.6%) was White and most (87.4%) attained education beyond high school, and 71.7% were married or partnered. Most of the sample had been diagnosed with stage I (51.8%) or stage II (40.1%) breast cancer. Two-thirds (66.9%) had received chemotherapy, 72.3% received radiation, and 63.7% had undergone surgery. The overall FACT-B mean (standard deviation, SD) score was 101.9 (21.2). This was consistent with FACT-B scores in similar samples. For example, in another US sample of n = 295 breast cancer patients, the (adjusted) FACT-B mean score was 106.8 (19.6) [26].
Table 1.
Sample characteristics by state (baseline)
| State 1, n = 181 | State 2, n =106 | State 3, n =156 | State 4, n =61 | State 5, n = 66 | State 6, n =83 | Total n =653 | |
|---|---|---|---|---|---|---|---|
| Age (years ± SD) | 50.1 ± 11.8 | 54.0 ± 12.7 | 55.1 ± 12.1 | 61.2 ± 13.6 | 57.1 ± 10.9 | 59.5 ± 11.7 | 54.9 ± 12.6 |
| Race (%) | |||||||
| White | 80.1 | 92.5 | 89.1 | 95.1 | 98.5 | 96.4 | 89.6 |
| Other | 19.9 | 7.5 | 10.9 | 4.9 | 1.5 | 3.6 | 10.4 |
| Education (%) | |||||||
| High school or less | 17.1 | 12.7 | 11.5 | 6.6 | 3.0 | 16.9 | 12.6 |
| More than High School | 82.9 | 87.3 | 88.5 | 93.4 | 97.0 | 83.1 | 87.4 |
| Partner status (%) | |||||||
| Married/partnered | 67.4 | 75.5 | 75.0 | 67.2 | 80.3 | 66.3 | 71.7 |
| Single, divorced, or widowed | 32.6 | 24.5 | 25.0 | 32.8 | 19.7 | 33.7 | 28.3 |
| Difficulty affording basics (%) | |||||||
| Yes | 34.2 | 16.0 | 17.3 | 6.6 | 6.1 | 8.4 | 18.5 |
| No | 65.8 | 88.0 | 82.7 | 93.4 | 93.9 | 91.6 | 81.5 |
| Stage (%) | |||||||
| I | 30.9 | 59.4 | 48.1 | 68.9 | 80.3 | 59.0 | 51.8 |
| II | 58.6 | 34.9 | 41.0 | 26.2 | 18.2 | 32.5 | 40.1 |
| III | 10.5 | 5.7 | 10.9 | 4.9 | 1.5 | 8.4 | 8.1 |
| Chemotherapy | |||||||
| Yes | 87.6 | 58.5 | 76.3 | 34.4 | 42.4 | 60.2 | 66.9 |
| No | 13.3 | 41.5 | 23.7 | 65.6 | 57.6 | 39.8 | 33.1 |
| Radiation | |||||||
| Yes | 65.2 | 72.6 | 75.6 | 67.2 | 86.4 | 73.5 | 72.3 |
| No | 34.8 | 27.4 | 24.4 | 32.8 | 13.6 | 26.5 | 27.7 |
| Surgery | |||||||
| Yes | 49.2 | 65.1 | 64.7 | 70.5 | 83.3 | 71.1 | 63.7 |
| No | 50.8 | 34.9 | 35.3 | 29.5 | 16.7 | 28.9 | 36.3 |
| FACT-B (mean ± SD) | 74.8 ± 12.0 | 98.2 ± 7.1 | 107.2 ± 9.2 | 116.1 ± 5.4 | 127.3 ± 5.6 | 124.7 ± 9.2 | 101.9 ± 21.2 |
Factor analysis
A confirmatory factor analysis was applied to the data. A panel of statistics indicating goodness-of-fit of the 5-factor model as identified in FACT-B showed good fit (RMSEA = 0.08, CFI = 0.91, and TLI = 0.90) and met the requirements recommended in the literature (RMSEA < 0.08; CFI, TLI > 0.90) [27]. The domain scores formed the profile variables for the subsequent MHMM analysis.
Subgroup profiles
A six-subgroup model (K = 6) was identified as the best-fitting model using the BIC criterion. None of the subgroups was too small for consideration of using a smaller K. Indeed all subgroups had more than 60 participants at baseline (Table 1). As a result, the six-subgroup model was adopted as the final model. Each state in the MHMM represents a combination of domain scores and each subgroup of breast cancer survivors represents the people in that state. The approximate ranking of states by level of HRQoL, was state 1 < state 2 < state 3 ≈ state 4 < state 5 ≈ state 6 (Fig. 2). For ease of interpretation, we categorize the states into three groups with approximately increasing levels of better HRQoL: low HRQoL (states 1 and 2), medium HRQoL (states 3 and 4), and high HRQoL (states 5 and 6). In the low HRQoL group, state 1 exhibited the lowest scores for every domain with scores ranging from − 0.86 to − 1.52 SDs below the mean. State 2 was average in terms of physical well-being and below average in the other 4 domains, but to a lesser degree than state 1. In the medium HRQoL group, state 3 was below average for physical well-being (− 0.5 SD below the mean), above average for social and emotional well-being, and approximately average for functional well-being and BCSC. State 4 was above average in terms of physical, emotional, functional well-being and BCSC, with SDs ranging from 0.33 to 0.63 above the mean, and approximately average in terms of social/family well-being. In the high HRQoL group, state 5 was above average in every domain and particularly high with regard to social well-being (1 SD above the mean). State 6 was also above average on every domain, but particularly high in emotional well-being (1.12 SD above the mean).
Fig. 2.
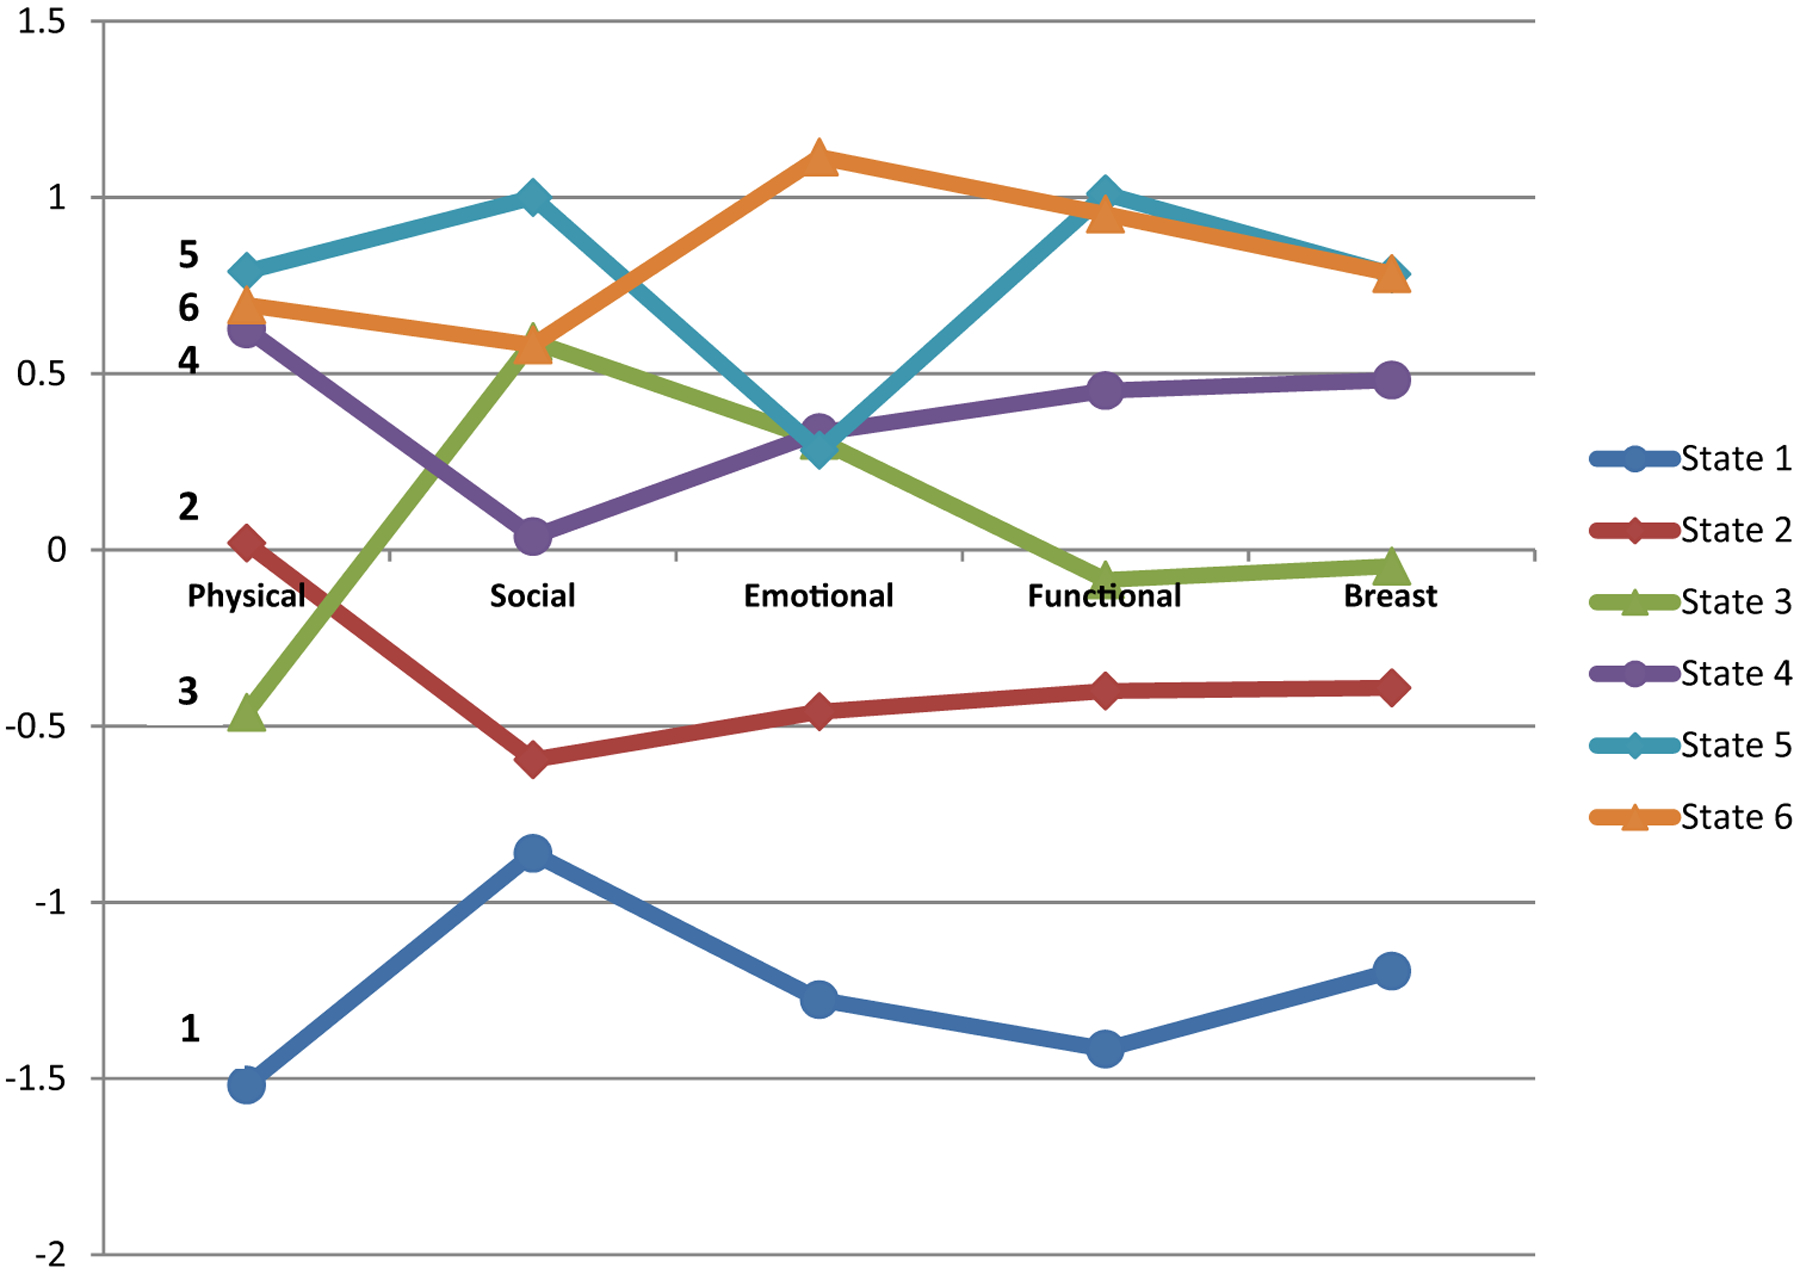
Profile of the HRQoL states with standardized domain scores (y-axis). Profile of states are assumed to be invariant over time but membership of state can change over time
The heterogeneity in the HRQoL profile is related to different background factors, including sociodemographics and cancer-related variables (Table 1). For example, state 1 has a higher proportion of BCS that have difficulty affording the basics and a lower proportion of women with stage 1 breast cancer. On the other hand, state 5 has people with higher levels of education, who are married/partnered, and have no difficulty affording the basics. BCS in this state also have a higher rate of stage 1 cancer, a lower rate of chemotherapy, and higher rates of radiation and surgery.
Subgroup prevalence
The prevalence of each subgroup was noted at each of the five time points: baseline, 3 months, 6 months, 12 months, and 18 months (Fig. 3). Membership in state 1 was highest at baseline (27.7%) and declined progressively until the end of the study, ultimately falling to 8.9%. Membership in state 2 increased from baseline (16.2%) to 3 months (24.2%), and increased at a slower pace thereafter, eventually reaching 28.6%. State 3 gradually diminished over time, falling from 23.9% at baseline to 6.7% at 18 months. State 4 saw a large increase in size from baseline (9.3%) to 3 months (17.9%), nearly doubling in size. Thereafter, smaller increases were noted, eventually rising to 25.6% at 18 months. Prevalence of state 5 changed the least over time, and varied from 8.0% to 10.9%. Finally, state 6 increased incrementally in prevalence over time, going from 12.7% at baseline to 19.3% at 18 months. The largest change in state prevalence was between baseline and three months, suggesting that HRQoL improved in the months further from active treatment. The overall trend was toward improvement in HRQoL over time, driven mainly by decreased membership in state 1 (All Low). However, state 2 (Mostly Low) increased in prevalence. Combined membership in the middle two states (3 and 4) was fairly stable, whereas combined prevalence of the best two states (5 and 6) increased slightly.
Fig. 3.
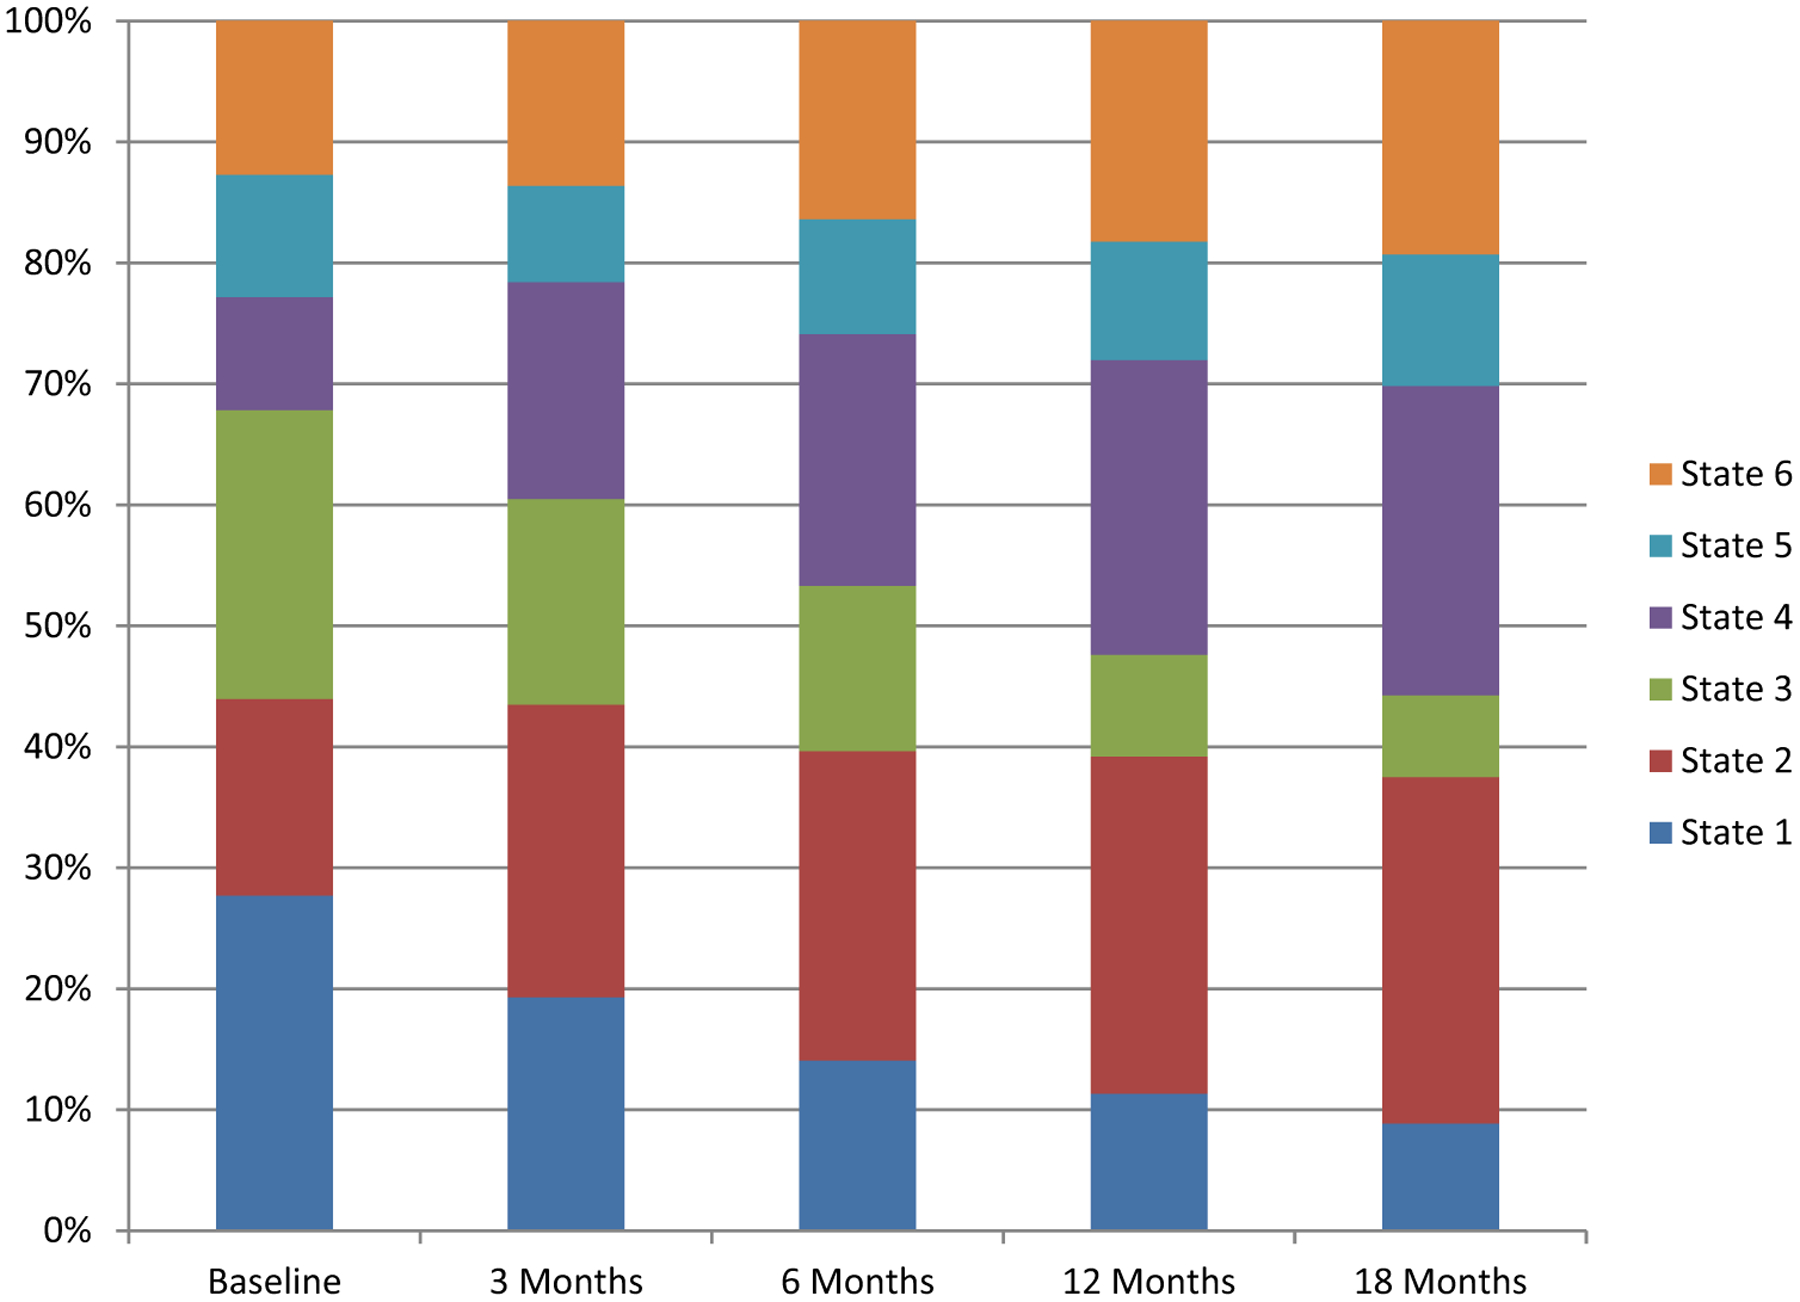
Stacked bar graph for prevalence of the HRQoL states over time
Subgroup transitions
Movement between states can be visualized using directed graphs. Figure 4 shows the transition dynamic between different states. For all 6 states, there was an over 50% chance of remaining in the same state across time points. For movement across states, we focus on the most common transitions (> 10.0% frequency). In state 1, the greatest probability of changing states was moving to state 2 (27.1%), which represents an across-the-board improvement in HRQoL domains. Most persons in state 2 who changed states were likely to move to state 4 (13.0%), which also represent an overall improvement in HRQoL, especially in social well-being. Members of state 3 tended to transition to states 4 and 6 with near equal probability (16.9% and 13.6%, respectively). Members of states 4 and 5 were most likely to move to state 6 (15.4% and 23.2%, respectively). Members of state 5 had an 11% chance of transitioning to state 4, which is one of the transitions towards a state of worse HRQoL of at least 10% frequency. The only other substantial movement towards worse HRQoL was from state 6 to state 4 (18.2%). State 6 members also had a smaller (10.6%) probability of transitioning to state 5. Thus, state 6 mostly communicated with states 4 and 5. The general trend was a tendency to stay in the same state with some movement away from the worst states of HRQoL, as well as more turnover in the moderate and high HRQoL states.
Fig. 4.
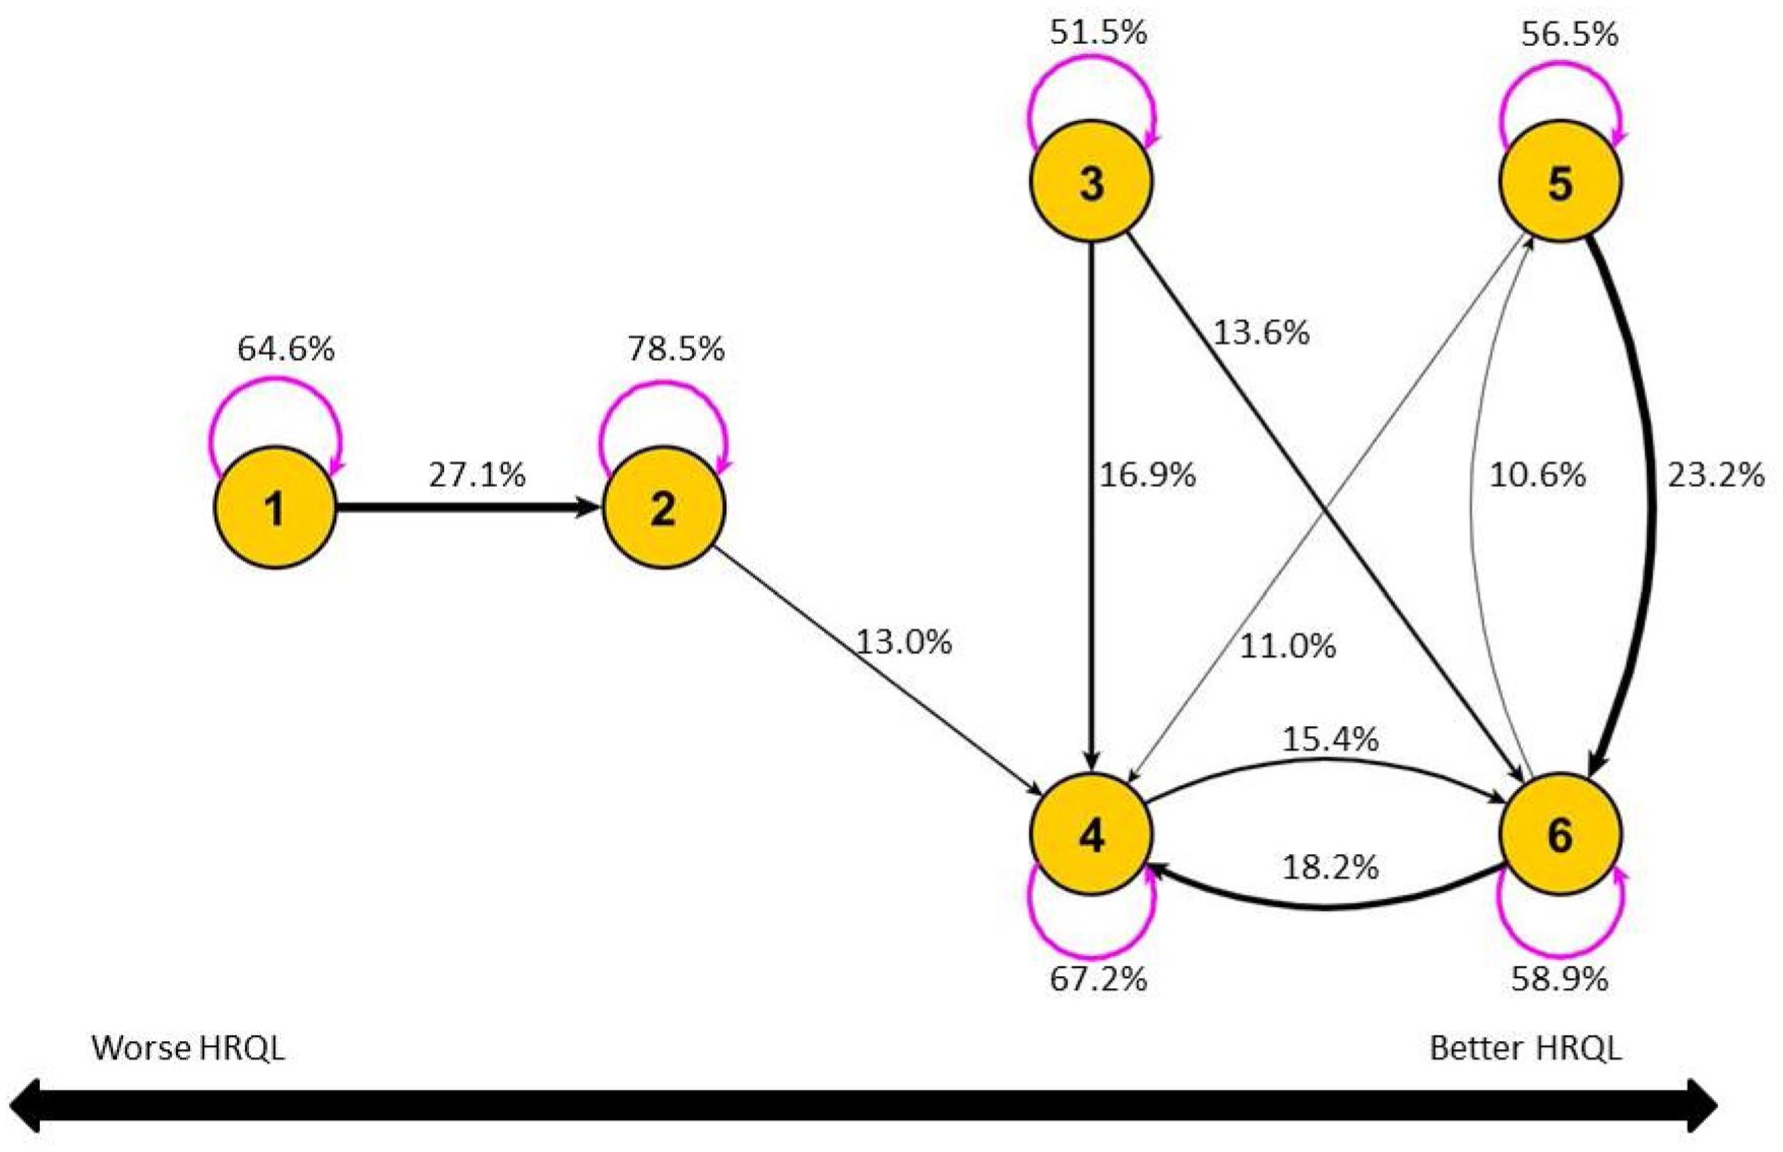
Transition between states over time. Magenta (semi-circular) lines reflect the probability of remaining in the same state across time points. Black (straight or curved) lines reflect transitions to different states. Only transitions with probability > 10% are shown. The figure reflects the fact that state 1 has the lowest HRQoL of any state, followed by state 2. Both states 1 and 2 have worse overall HRQoL score than states 3 and 4, which in turn are worse than states 5 and 6
Compensation across domains
Not unlike a latent class/profile analysis, the non-compensatory approach applied to this sample of BCS demonstrates HRQoL heterogeneity. Remarkably, the within-state variations of HRQoL were much lower than the overall variation. The SD for FACT-B was 21.2 for the total sample. On the other hand, the weighted average SD of FACT-B across states was only 8.9 (range 5.4–12.0, see Table 1). The contrast implies that the non-compensatory analysis indeed derives relatively homogeneous subgroups of BCS.
As mentioned in the Subgroup Profiles subsection, there were three groups with increasing levels of HRQoL (worse, medium, and better), and “subtypes” with subtly different profiles that existed within the groups. Compensation occurred between HRQoL domains within two of the three groups—medium and better. At baseline (18 month), for the better HRQoL group, states 5 and 6 respectively had average FACT-B scores of 127.3 (127.9) and 124.7 (127.4). For the medium HRQoL group, states 3 and 4 respectively had average FACT-B scores of 107.2 (109.0) and 116.1 (116.8). To illustrate the compensatory mechanism across domains, we treated the within-group states in the medium and better groups as “equivalent.” In the following discussion, when comparing states within groups we will use the term better (worse) to refer to relatively better (worse) value, which does not necessarily imply that the value is better when compared to other states outside the group.
Take for example, a comparison of the two states: 5 and 6 within the better HRQoL group. The total FACT-B scores are very similar for these two states. The average scores for the physical, functional, and breast cancer-specific domains were practically identical (Fig. 2), whereas the average scores for the social and emotional domains differed. Thus, the almost identical values in overall FACT-B scores could be directly attributed to compensation from the social/family domain for the deficit in the emotional domain (state 5) and vice versa (state 6). Inspection of Figs. 3 and 4 revealed that state 5 (better social, worse emotional) tended to move to state 6 (better emotional, worse social) over time with an averaged transition probability of 23% across two consecutive time points while the movement from state 5 to 6 was less (10.6%). This movement suggests that for BCS with relatively better levels of physical and functional well-being, as well as worse breast cancer-related concerns, social and emotional well-being may have somewhat opposite effects. Examination of only the overall sum scores would have missed this kind of dynamic that happened across the two states.
Within the medium HRQoL group, state 4 had approximately the same average score on physical well-being as the better HRQoL group, but lagged in the other four domains, especially social well-being. On the other hand, compared to state 4, which can be called “worse-social-better-physical,” state 3 compensates for the deficit in physical well-being with higher social well-being score. This “better-social-worse-physical” state is an interesting group that transitioned to the “worse-social-better-physical” with a probability of 17%, suggesting that some BCS in the “better-social-worse-physical” group improved their physical well-being, but also experienced a reduction in their social well-being. Another route of transition for the “better-social-worse-physical” group was to state 6 (13%), suggesting that some members in state 3 improved in their physical well-being as well as in other domains while still maintaining their previous levels of social well-being.
Additionally, the results from analyzing the different profiles of the HRQoL states suggest that the physical well-being, functional well-being, and breast cancer-specific concerns tend to correlate very well (Fig. 2). Compensation did not seem to occur across these domains.
Differentiation in active chemotherapy treatment
Although the 6 MHMM states are statistically differentiated, the clinical relevance of the states can be evaluated by externally relating them to key clinical measures. We used an example to illustrate such clinical relevance. Specifically, we examined if nuanced differences across HRQoL profiles are present in survivors under active chemotherapy versus those survivors that are not—i.e., those who did not receive chemotherapy or were post-chemotherapy treatment. We selected a subsample that consisted of the better HRQoL group (States 5 and 6) at baseline. First, we examined if women under active chemotherapy were different from those that were not in their FACT-B scores. The following potential confounders and covariates were included in a regression analysis: age at diagnosis, race, marital status, education level, difficulty paying bills, stage of cancer, and whether the survivors had undergone radiation therapy. The result indicated that there was no significant difference (p = 0.53) between those in active chemotherapy treatment and others in their overall adjusted FACT-B scores. Next, instead of using the overall FACT-B score, we used MHMM state (State 5 as reference) as the dependent variable. The alternative regression analysis (including the same covariates) showed differentiation between the states—the odds ratio for active chemotherapy was 4.24 (p < 0.01) with a significantly higher percentage of BCS under active chemotherapy in State 5 (53.4%) compared to State 6 (23.7%). In other words, the non-compensatory approach revealed that those in active chemotherapy were more likely to be in State 5 (better-social-worse-emotional) than in State 6 (worse-social-better-emotional). Of note, the FACT-B social well-being domain contains items that are related to social support and communication (e.g., “I got emotional support from my family” and “I am satisfied with family communication about my illness”). Thus, our finding tends to support previous reports that social support increases during the initial stage of chemotherapy and other treatments and decreases post-treatment [28]. Several explanations have been given for the decrease in social support post-treatment, which include support provider burnout, and the decrease in the survivors’ perceived needs for support. On the other hand, it has also been reported that negative affect increases during chemotherapy and can last up to one month therapy ended [29]. In summary, the non-compensatory analysis shows differentiation between active chemotherapy and no chemotherapy/post-treatment in that survivors under active chemotherapy were more likely to be in the better-social-worse-emotional state. The traditional approach using sum score did not detect such differentiation.
Discussion
In summary, the analysis presented here demonstrates how important knowledge about individuals can be extracted from a non-compensatory approach to quality of life. Compensatory models that “compress” different domain measures into a single dimension—whether by sum score, principal component, or other unidimensional method—mask variations across different quality of life domains and limit insight into HRQoL differences. As cautioned by Lowton [30], “the searches for unidimensionality, for the single concept of medical quality of life, and for deviations expressed only as decrements are attempts at oversimplifications that a society concerned with individual differences cannot afford.”
For longitudinal data, the compensatory approach to HRQoL has been predominantly used for understanding trends [31]. Here, we use data from BCS to illustrate the difference between compensatory and non-compensatory approaches for trend analysis. Figures 5 and 6 respectively show the summary FACT-B score and the individual domain scores over time. The overall summary HRQoL score in FACT-B shows a general upward trend, which is reflected in the domain scores, with the exception of social well-being and emotional well-being. Although this kind of trend analysis of individual domain and summary scores is useful, they do not reveal how individual scores tend to move together or separately, as the non-compensatory approach shows. In addition, the scores do not express the full story of possible compensatory mechanisms across HRQoL domains that occur over time. Indeed, this is missed opportunity for cases in which only a summarized approach or a one-domain-at-a-time-analysis is performed for understanding the HRQoL patterns of change for cancer survivor cohorts.
Fig. 5.
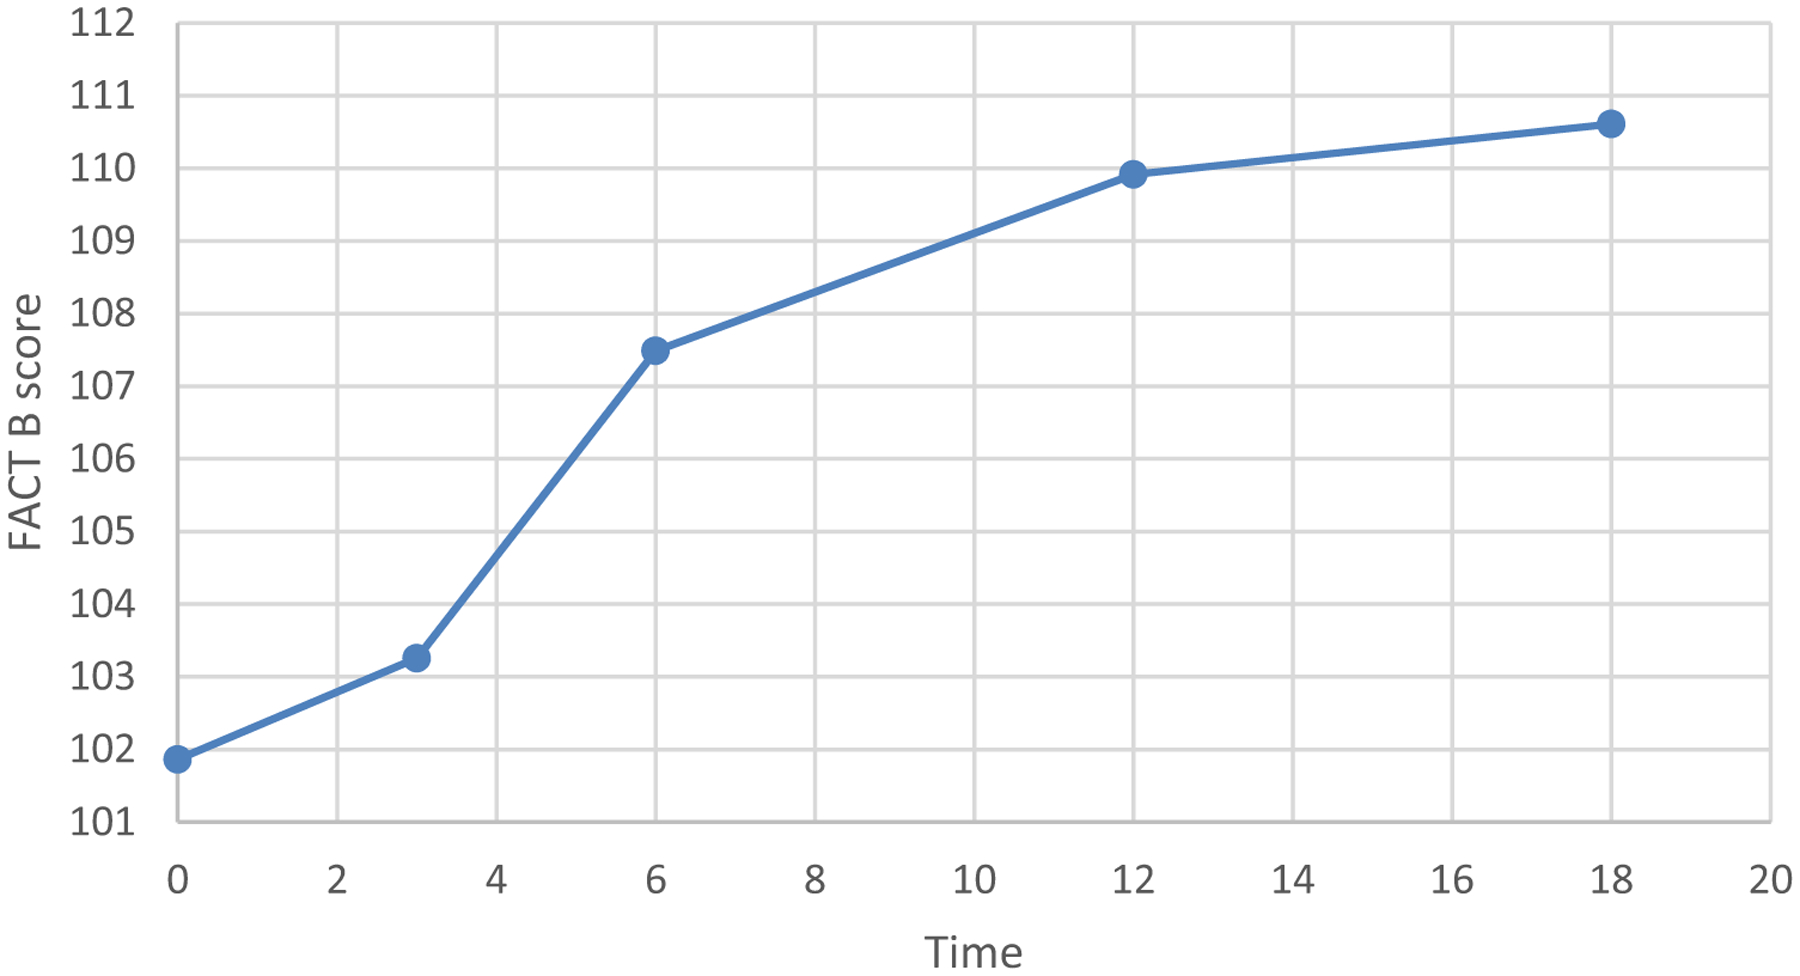
Time trend for FACT-B sum score. Time is in months since diagnosis
Fig. 6.
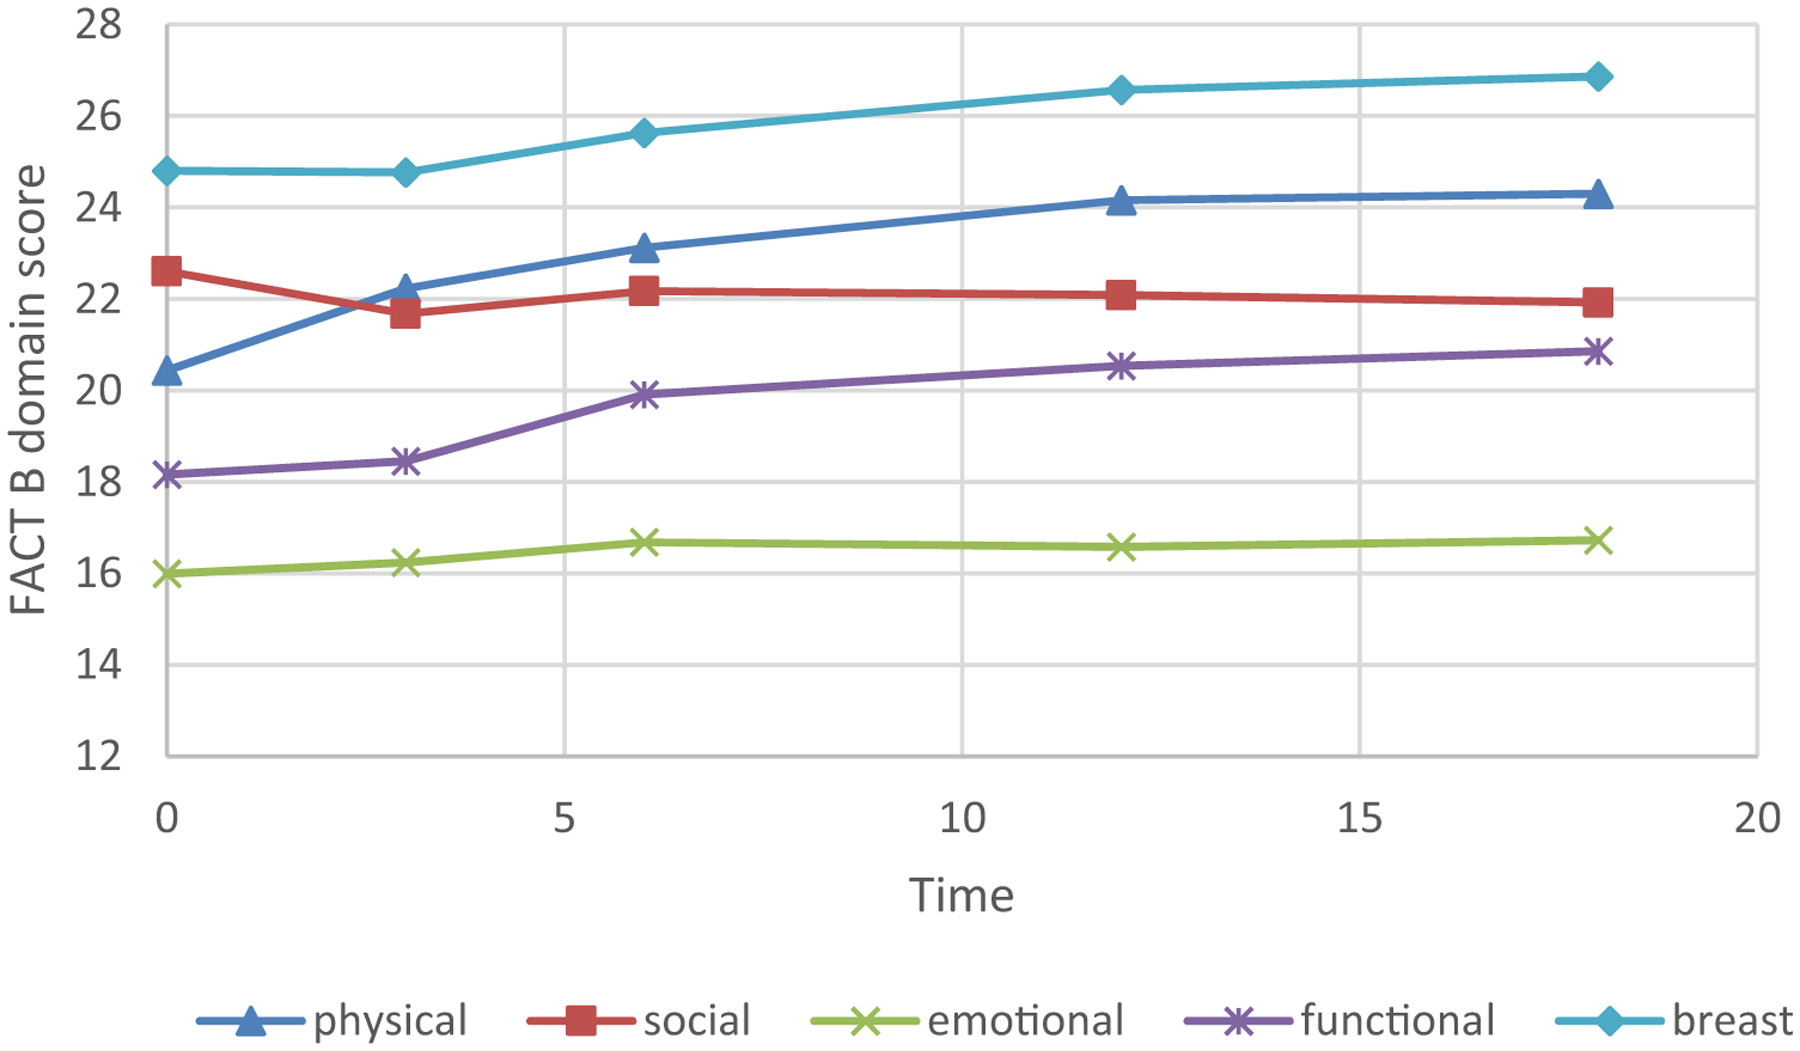
Time trends for 5 individual QOL domains. Time is in months since diagnosis
The MHMM analysis demonstrates how trends in HRQoL can be delineated over time beyond summary scores. Results of this MHMM analysis indicate that most BCS were likely to remain in the same state between any two time points. However, state membership still showed some change, with a proportion of BCS consistently remaining in the same state at every time point. Figure 4 shows “oscillations” between some states (e.g., state 4 and state 6). For some BCS, it is possible, for example, that social well-being was high at an earlier stage of recovery, but they relied less on such support at a later stage when physical and functional well-being improved and breast cancer concerns subsided. Over time, state 1 (All Low) diminished in size, suggesting most BCS eventually moved out of the worst HRQoL state (Fig. 3). Further evidence of a general trend toward improvement is shown in Fig. 4, which indicates no major (defined as > 10% frequency) pathways into the worst HRQoL states (states 1 and 2). This finding suggests that over time, relatively few BCS “deteriorate” and enter the worst HRQoL states, whereas relatively more BCS improve in their HRQoL, but have different improvement patterns across domains.
As pointed out by a reviewer, a compensatory approach also masks changes across domains. For example, one might be interested in sorting individuals into observed changes across all domains. Consider an individual that scored better than average on domain A at baseline and about average at follow-up (negative change), but scored worse than average on domain B and about average at follow-up (positive change). If the sum score is used, then this individual would not be differentiated from another individual who registered no change in both domains A and domain B. It is possible to use a non-compensatory approach such as MHMM to examine change patterns. For example, change scores from baseline across multiple domains can be used to form a change profile in MHMM. Non-compensatory approaches complement compensatory methods for understanding respondent priorities as differences across domains in HRQoL. From our results, it appears that a compensatory model is sufficient to capture the composite construct of physical well-being, functional well-being, and breast cancer-specific concerns as these domains move in sync. Social and emotional well-being tend to behave independently of the others and present different needs for services or care. A non-compensatory analysis could therefore inform intervention studies that target specific domains, as well as clinical trials where one might expect to see different change patterns over time. Targeted management strategies derived from patients’ HRQoL profiles may be more effective than generalized approaches.
Study limitations
This study has several limitations. In this article, we focus only on comparing non- compensatory and compensatory approaches to HRQoL outcomes. One limitation is thus that other risk factors are not included in the analysis. It is possible to determine predictors of HRQoL membership by state, and two approaches, at the least, can be considered. First, trajectories derived from the MHMM can be categorized and tools such as multinomial regression can be used to assess baseline predictors. An alternative approach is to examine HRQoL states at each time point as a repeated measure for an individual and apply longitudinal modeling tools such as a mixed-effect analysis to the data [19]. In either case, predictors of state membership could be identified, thus potentially revealing who is likely to have a favorable or unfavorable HRQoL trajectory. A second limitation is that the sample we analyzed represents a relatively homogeneous population of BCS (predominantly White, relatively high education). Our sample characteristics are rather common in BCS studies, in part due to risk factors for the disease (e.g., later and fewer births, which are more characteristic of women who have spent many years getting an education). Given the limitation, our specific findings may not be generalizable to other populations. Further empirical investigation is required for assessing whether findings from the current non-compensatory approach to HRQoL can be generalized to other populations. Finally, it is important for clinicians and others who work with patients on an individual basis to remember that even though this type of methodology identifies subgroups of BCS who are relatively homogeneous in terms of their HRQoL profile (relative to between-state heterogeneity), there is still non-reducible heterogeneity that exists among individual patients within a state.
Funding
The research is supported by the following grants: NIH U10 CA081851; UL1TR001420-01; Department of Defense Grant DAMD17-01-1-0447.
Footnotes
Data availability Data can be requested through email to the corresponding author or co-author Dr. Nancy Avis. Code availability The Multivariate hidden Markov model program can be freely downloaded from the following link: https://dmgm.wfuhs.arane.us/.
Conflicts of interest There is no conflict of interest to declare.
References
- 1.Miller KD, Nogueira L, Mariotto AB, Rowland JH, Yabroff KR, Alfano CM, et al. (2019). Cancer treatment and survivorship statistics, 2019. CA: A Cancer Journal for Clinicians, 69, 363–385. [DOI] [PubMed] [Google Scholar]
- 2.Bloom JR, Petersen DM, & Kang SH (2007). Multidimensional quality of life among long-term (5+ years) adult cancer survivors. Psycho-Oncology, 16, 691–706. [DOI] [PubMed] [Google Scholar]
- 3.Cella DF, Tulsky DS, Gray G, Sarafian B, Linn E, Bonomi A, et al. (1993). The Functional Assessment of Cancer Therapy scale: Development and validation of the general measure. Journal of Clinical Oncology, 11(3), 570–579. [DOI] [PubMed] [Google Scholar]
- 4.Ware JE Jr., & Sherbourne CD (1992). The MOS 36-item short-form health survey (SF-36). I. Conceptual framework and item selection. Medical Care, 30, 473–483. [PubMed] [Google Scholar]
- 5.Luutonen S, Sintonen H, Stormi T, & Salminen E (2014). Health-related quality of life during adjuvant radiotherapy in breast cancer. Quality of Life Research, 23, 1363–1369. [DOI] [PubMed] [Google Scholar]
- 6.Murasawa H, Sugiyama T, Matsuoka Y, Okabe T, Okabe T, Hino A, et al. (2019). Health utility and health-related quality of life of Japanese prostate cancer patients according to progression status measured using EQ-5D-5L and FACT-P. Quality of Life Research, 28, 2383–2391. [DOI] [PubMed] [Google Scholar]
- 7.Naughton MJ, & Shumaker SA (2003). The case for domains of function in quality of life assessment. Quality of Life Research, 12(Suppl 1), 73–80. [DOI] [PubMed] [Google Scholar]
- 8.Chang VT, Thaler HT, Polyak TA, Kornblith AB, Lepore JM, & Portenoy RK (1998). Quality of life and survival: The role of multidimensional symptom assessment. Cancer, 83, 173–179. [DOI] [PubMed] [Google Scholar]
- 9.Miaskowski C, Dunn L, Ritchie C, Paul SM, Cooper B, et al. (2015). Latent class analysis reveals distinct subgroups of patients based on symptom occurrence and demographic and clinical characteristics. Journal of Pain Symptom Management, 50(1), 28–37. [DOI] [PMC free article] [PubMed] [Google Scholar]
- 10.Pud D, Ben Ami S, Cooper BA, Aouizerat BE, Cohen D, et al. (2008). The symptom experience of oncology outpatients has a different impact on quality-of-life outcomes. Journal of Pain Symptom Management, 35(2), 162–170. [DOI] [PubMed] [Google Scholar]
- 11.Rossi A, Marconi M, Mannarini S, Minelli I, Fusie C, et al. (2019). Cancer-related distress and problems: A latent class analysis approach. Journal of Clinical Oncology, 37(Suppl), 15. [Google Scholar]
- 12.Langford DJ, Paul SM, Cooper B, Kober KM, Mastick J, et al. (2016). Comparison of subgroups of breast cancer patients on pain and co-occurring symptoms following chemotherapy. Supportive Care in Cancer, 24(2), 605–614. [DOI] [PubMed] [Google Scholar]
- 13.Gwede CK, Small BJ, Munster PN, Andrykowski MA, & Jacobsen PB (2008). Exploring the differential experience of breast cancer treatment-related symptoms: A cluster analytic approach. Supportive Care in Cancer, 16(6), 925–933. [DOI] [PMC free article] [PubMed] [Google Scholar]
- 14.Fukuoka Y, Lindgren TG, Rankin SH, Cooper BA, & Carroll DL (2007). Cluster analysis: a useful technique to identify elderly cardiac patients at risk for poor quality of life. Quality of Life Research, 16, 1655–1663. [DOI] [PubMed] [Google Scholar]
- 15.Kemmler G, Holzner B, Kopp M, et al. (2002). Multidimensional scaling as a tool for analysing quality of life data. Quality of Life Research, 11, 223–233. [DOI] [PubMed] [Google Scholar]
- 16.MacDonald IL, & Zucchini W (2000). Hidden Markov and other models for discrete-valued time series. Boca Raton: Chapman & Hall/CRC. [Google Scholar]
- 17.Ip EH, Zhang Q, Rejeski J, Harris T, & Kritchevsky S (2013). Partially ordered mixed hidden Markov model for the disablement process of older adults. Journal of American Statistical Association, 108(502), 370–380. [DOI] [PMC free article] [PubMed] [Google Scholar]
- 18.Rejeski WJ, Ip EH, Bertoni A, Bray GA, Evans G, Gregg EW, et al. (2012). Lifestyle change and mobility in aging obese adults with type 2 diabetes. New England Journal of Medicine, 366, 1209–1217. [DOI] [PMC free article] [PubMed] [Google Scholar]
- 19.Avis NE, Marshall SA, Levine B, & Ip EH (2017). Longitudinal examination of symptom profiles among breast cancer survivors. Journal of Pain Management, 53, 703–710. [DOI] [PMC free article] [PubMed] [Google Scholar]
- 20.Rabiner LR (1989). A tutorial on Hidden Markov Models and selected applications in speech recognition. Proceedings of the IEEE, 77(2), 257–286. [Google Scholar]
- 21.Colllins ML, & Lanza ST (2010). Latent class and latent transition analysis. Hoboken, NJ: Wiley. [Google Scholar]
- 22.Kenzik K, Martin MY, Fouad MN, & Pisu M (2015). Health-related quality of life in lung cancer survivors: Latent class and latent transition analysis. Cancer, 121(9), 1520–1528. [DOI] [PMC free article] [PubMed] [Google Scholar]
- 23.Avis NE, Levine B, Naughton MJ, Case DL, Naftalis E, & Van Zee KJ (2013). Age-related longitudinal changes in depressive symptoms following a breast cancer diagnosis and treatment. Breast Cancer Research And Treatment, 139(1), 199–206. [DOI] [PMC free article] [PubMed] [Google Scholar]
- 24.Muthén LK, & Muthén BO (1998–2011). Mplus user’s guide. Sixth Edition Los Angeles, CA: Muthén & Muthén. [Google Scholar]
- 25.Schwarz GE (1978). Estimating the dimension of a model. Annals of Statistics, 6(2), 461–464. [Google Scholar]
- 26.Brady MJ, Cella DF, Mo F, Bonomi AE, Tulsky DS, Lloyd SR, et al. (1997). Reliability and validity of the functional assessment of cancer therapy-breast quality-of-life instrument. Journal of Clinical Oncology, 15, 974–986. [DOI] [PubMed] [Google Scholar]
- 27.Hu L, & Bentler PM (1999). Cutoff criteria for fit indexes in covariance structure analysis: Conventional criteria versus new alternatives. Structural Equation Modeling, 6, 1–55. [Google Scholar]
- 28.Arora NK, Finney Rutten LJ, Gustafson DH, Moser R, & Hawkins RP (2007). Perceived helpfulness and impact of social support provided by family, friends, and health care providers to women newly diagnosed with breast cancer. Psycho-Oncology, 16, 474–486. [DOI] [PubMed] [Google Scholar]
- 29.Buick DL, Petrie KJ, Booth R, Probert J, Benjamin C, & Harvey V (2000). Emotional and functional impact of radiotherapy and chemotherapy on patients with primary breast cancer. Journal of Psychosocial Oncology, 18, 39–62. [Google Scholar]
- 30.Lawton MP (1991). a multidimensional view of quality of life in Frail Elders In Birren JE, Rowe JC, Lubben JE, & Deutchman DE (Eds.), The concept and measurement of quality of life in the Frail Elderly (pp. 3–27). Cambridge, MA: Academic Press. [Google Scholar]
- 31.Cotogni P, De Carli L, Passera R, Amerio ML, Agnello E, Fadda M, et al. (2017). Longitudinal study of quality of life in advanced cancer patients on home parenteral nutrition. Cancer Medicine, 6, 1799–1806. [DOI] [PMC free article] [PubMed] [Google Scholar]