

Abstract
Background:
Obstructive sleep apnoea (OSA) is an important factor in the development and progression of heart failure (HF). The prevalence of OSA is higher in patients with HF than in the general population. We sought to test the hypothesis that OSA severity was predictive of ventricular function and cardiac injury [as assessed by high-sensitivity cardiac troponin I(hs-cTnI)].
Methods:
A total of 60 patients were recruited after evaluation for sleep disturbances using the Jenkins Sleep Questionnaire (JSQ) and Epworth Sleepiness Scale (ESS). Subsequently, they underwent polysomnography thus confirming the diagnosis of OSA and were equally divided into three groups according to OSA severity grade. Following polysomnography, the next morning patients underwent venous blood sampling and echocardiography.
Results:
We observed a statistically significant association (P = 0.009) between diastolic dysfunction grades and severity grades of OSA. All the three diastolic dysfunction variables E/A ratio, deceleration time and E/e’ ratio had a significant association(P < 0.05) with severity grades of OSA. There was a marginally significant positive correlation (ρ = 0.3244, p = 0.04) between AHI events per hour and mitral E/e’ ratio. There was a statistically significant association(P < 0.001) between hs-cTnI value among different severity grades of OSA.
Conclusions:
Here in our study, we found OSA a potential risk factor for development of myocardial injury and diastolic dysfunction. Severe grades of OSA are associated with higher grades of diastolic dysfunction and circulating levels of hs-cTnI. These data are consistent with the notion of a vicious cycle of frequent apnoea's or hypoxemia and recurrent myocardial injury, which could increase the risk of heart failure especially diastolic dysfunction in OSA.
Keywords: Obstructive sleep apnoea, Heart failure, Diastolic dysfunction, High-sensitivity cardiac troponin I
1. Introduction
Cardiovascular diseases (CVDs), are a leading cause of global morbidity and mortality. In 2017, Global Burden of Diseases (GBD), Injuries, and Risk factor study reported that around 17.8 million deaths worldwide occur due to CVD. Moreover, CVD mortality is more common in low-and middle-income countries thus it becomes indispensable to prevent and treat cardiometabolic risk factors [1,2].
Social development and modernization have led to increasing prevalence of lifestyle disorders such as CVDs, Diabetes Mellitus 2 (DM2), obesity, sleep-disordered breathing (SDB) and in particular obstructive sleep apnoea (OSA) worldwide [3].
According to literature-based analysis by Benjafield et al., the estimated global prevalence using American academy of sleep medicine (AASM) 2012 diagnostic criteria was 936 million (95% CI 903—970) adults aged 30–69 years (male and female) including roughly 425 million (399–450) adults having moderate to severe OSA globally. Geographical distribution is published in the study shows the greatest number of the affected population belongs to China, followed by the USA, Brazil, and India [4].
Sleep is typically defined as a resting state for the brain and cardiorespiratory systems. During NREM sleep, there is a decrease in metabolic demand, heart rate, blood pressure, and ventilatory motor outputs to respiratory muscles especially in upper airway. These changes are attributed to an increase in parasympathetic (vagal nerve) activity during NREM sleep. In susceptible individuals, decrease in hypoglossal motor output lead to narrowing of upper airway and increase in upper airway resistance. Thus, considerable breathing efforts against totally or partially occluded upper airway can occur due to dysfunction of upper airway muscle leading to apnoea and hypopnea events. These events lead to intermittent hypoxia and sleep fragmentation resulting in sleep disruption. The repeated cycles of upper airway collapse and sleep disruption with hypoxemia are associated with an upsurge in sympathetic activity thus resulting in acute blood pressure elevations, the release of inflammatory mediators and also an increase in insulin resistance [5-7].
Recently, an OSA association with many different forms of CVD including hypertension, heart failure, coronary artery disease, and stroke has been well established. Patients with OSA have increased morbidity and mortality due to cardiovascular complications [8-10]. HF is one of the escalating public health problems worldwide in part due to the association of an aging population [6,11,12]. Population-based studies from Germany, Spain, and Italy have estimated the prevalence of HF was around 1.6% in women and 1.8% in men, with a considerable increase in number in advanced age (≥65 years) [13-16]. Of note, OSA may be a risk factor for the development and progression of HF. The prevalence of OSA is higher in patients with HF with reduced ejection fraction (HFrEF) or HF with preserved ejection fraction (HFpEF) than in the general population [15-17].
The current study aimed to investigate the association of different severities of obstructive sleep apnoea with diastolic dysfunction in North India. Our objective was to test the hypothesis that OSA severity predicts cardiac function and injury {using high-sensitivity cardiac troponin I(hs-cTnI) levels} in a Northern Indian population.
2. Methods
2.1. Study design and participants
The study protocol was approved by the Ethics Committee, All India Institute of Medical Sciences, New Delhi. The recruitment of patients was conducted between July 2017 and November 2019 in the Sleep clinic, Department of Medicine, All India Institute of Medical Sciences, New Delhi.
We screened 350 patients who presented with symptoms and signs of OSA, with the recruitment flow represented in Fig. 1. They were eligible if: (1) patients of either gender of age more than 18 years; (2); patients with AHI more than five events/hour and they were willing to sign an informed consent form. Patients were excluded if: (1) they were previously diagnosed with cardiac diseases, central sleep apnoea, liver diseases, acute or chronic kidney diseases, chronic infections like tuberculosis, human immunodeficiency virus, DM2, and hypothyroidism; and (2) patients declining consent or not willing to follow up in future.
Fig. 1.
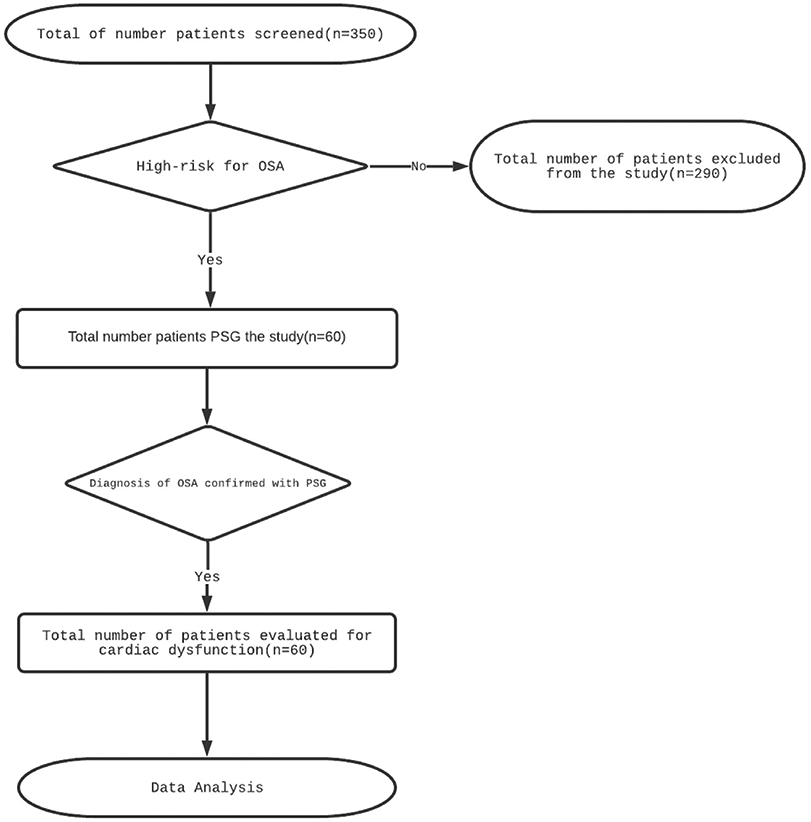
Flow chart showing enrolment of patients in the study.
Abbreviation: OSA; Obstructive sleep apnea, PSG; Polysomnography
After obtaining informed consent, medical history including evaluation for sleep disturbances using Jenkins Sleep Questionnaire (JSQ) and Epworth Sleepiness Scale (ESS), demographic and anthropometric data were recorded. Finally, a total of 60 patients were recruited in the study. Subsequently, all patients underwent polysomnography thus confirming the diagnosis of OSA and were equally divided into three groups according to their respective severity grade of OSA. The next morning patients underwent venous blood sampling and echocardiography.
2.2. Blood sampling
All the venous blood samples were collected in serum tubes on the morning following the polysomnography. High-sensitivity cardiac troponin I(hs-cTnI) was determined using the VIDAS® 30 multiparametric immunoassay system. The low limit of the detection of hs-cTnI assay is < 1.5 ng/L, and the upper reference limit (corresponding to the 99% in a healthy population) is ≥ 100 ng/L.
2.3. Anthropometric variables
We measured height, weight, body mass index (BMI), neck length, percentage predicted neck circumference (PPNC), waist and hip circumference. BMI was calculated as weight in kilograms (kg) divided by height in meters squared (m2) and the range of values according to Indian standards are: <18.5-underweight, 18.5–22.9 = normal, 23–24.9 = overweight, 25–29.9 = moderate obesity, 30–34.9 kg/m2 = severe obesity. Percentage predicted neck circumference (PPNC) was calculated using Davies and Stradling formula ie PPNC = 100 x NC/0.55 × 4 + 310. Height was measured using a stadiometer and weight was measured using Tanita body composition analyser.
2.4. Polysomnography variables
All the patients underwent overnight polysomnography at Sleep Laboratory, Department of Medicine, AIIMS, New Delhi. Polysomnography was done by trained personnel using Alice PDx diagnostic system (Phillips Respironics Inc, Pennsylvania, USA). A split-night diagnostic protocol was used, where we performed diagnostic polysomnography and CPAP titration in one night. The study consisted of a continuous polysomnographic recording of two electroencephalographic(EEG) leads (C3/O1, C3/A2); right and left electro-oculographic leads; and chin electromyography for sleep staging, nasal pressure cannula transducer, oral thermistor, thoraco-abdominal movement detection was monitored through inductive plethysmography, and a finger pulse oximeter that detected oxyhaemoglobin saturation and heart rate. Sleep-stage scoring was done for 30-s intervals according to standard AASM criteria [18]. Apnoea was defined as the complete (≥90%) cessation of airflow, and hypopnea defined as a reduction in airflow or thoracoabdominal excursion lasting for 10 s or more, accompanied by a decrease in oxygen saturation of at least 4%. AHI was defined as the total number of apnoea's plus hypopnoeas per hour of sleep. The AHI is used to categorize OSA severity and patients with an AHI of 5–15,16 to 30, or more than 30 events per hour are considered to have mild, moderate, or severe obstructive sleep apnea, respectively [18,19].
As per split-night diagnostic protocol, in the first half of night, the patients who were tested positive for OSA were started on CPAP treatment in the second half of the sleep study, then started on nasal CPAP titration. The desired CPAP level was defined as the pressure value that abolished all respiratory events, arousals, and oxyhaemoglobin desaturation episodes [20].
2.5. Cardiac function variables
Cardiac function was assessed on the next day of the polysomnography following the collection of the blood samples.
All patients underwent comprehensive echocardiography, performed by a cardiologist according to the American Society of Echocardiography guidelines using Philips IE 33 cardiac ultrasound machine (Philips Medical Systems, Andover, MA, USA). Echocardiography was performed at rest in the left lateral position, the parasternal and apical position and images and cine-loops were stored in digital format and evaluated using software (Q lab, version 4.2, Philips Medical Systems). The echocardiographic data were later evaluated by the same cardiologist who was blinded from the patients’ clinical and sleep data.
A combination of both two-dimensional (2D) measurements and Doppler methods was used to assess left ventricle function. The assessment began with a thorough 2D assessment making note of findings such as LA diameter in systole (LADS), interventricular septum (IVS) thickness, left ventricular diastolic diameter (LVDD) and systolic diameter (LVSD). The Left ventricle ejection fraction (LVEF) was calculated by LV dimensions obtained from 2D imaging according to modified Simpson's rule [21].
Subsequently Doppler-derived indices based on the mitral valve inflow pattern were obtained. The mitral valve inflow was obtained with pulse wave (PW) Doppler in the apical four-chamber view with a 2-mm sample gate placed between the tips of the mitral valve leaflets. The resultant mitral inflow pattern included peak flow velocities in early diastole (E) and peak flow velocity at atrial contraction (A), E/A ratio and mitral valve deceleration time (DT). Further the peak tissue velocities were recorded by PW Doppler analysed at lateral and septal basal region of the mitral annulus for early (é) and late (á) diastolic tissue velocities, and thus mitral E/é filling index was calculated. Diastolic function was defined in accordance to the American Society of Echocardiography (ASE) and European Association of Echocardiography [now European Association of Cardiovascular Imaging (EACVI)] guidelines as follows: 1) normal diastolic function (average E/e′ <10 and mitral E/A ≥ 0.8); 2) Grade I diastolic dysfunction (average E/e′ <10 and mitral E/A ≤ 0.8); and 3) Grade II diastolic dysfunction (average E/e′ 10–14 and mitral E/A >0.8 to 2); and Grade III diastolic dysfunction (average E/e′> 15 and mitral E/A >2) [22].
2.6. Statistical analysis
Data were analysed using statistical software STATA 15.0. Categorical data were expressed as frequency and percentage. Quantitative data were expressed as mean ± S.D and median (min–max), if it followed normal and skewed distribution respectively. One-way ANOVA with t-test post hoc (with Bonferroni correction) was used to compare variables that followed normal distribution. Kruskal–Wallis test with post hoc Mann–Whitney U-test (with Bonferroni correction) was used to compare variables that followed skewed distribution. Chi square/Fischer's exact tests were used to find the association between categorical variables. Spearman correlation coefficient was used to fine the correlation between AHI events per hour and E/e’ ratio. Analysis of covariance (ANCOVA) was carried out to see the difference in various 2D echocardiographic and diastolic dysfunction parameters among OSA severity categories by adjusting known confounders (age, BMI and blood pressure). A p-value of less than 0.05 was considered statistically significant.
3. Results
A total of 60 patients participated in the study with their baseline characteristics shown in Table 1. The majority of our OSA patientsberculosis, human immunodeficiency virus, DM2, and hypothyroi were middle aged males and the mean age was 43.9 ± 13.2 years. The anthropometric parameters like BMI, waist and hip circumference were found to increase with the severity of OSA. In the study a predominant proportion of patients was overweight or obese with a mean BMI of 29.9 ± 8.7 kg/m2.
Table 1.
Baseline demographic parameters and their association with grades of severity of OSA.
| Variables | Total(n = 60) | Mild OSA(n = 20) | Moderate OSA(n = 20) | Severe OSA(n = 20) | p-value |
|---|---|---|---|---|---|
| mean ± SD | mean ± SD | mean ± SD | mean ± SD | ||
| Age (years) | 43.9 ± 13.2 | 43.7 ± 14 | 42.65 ± 13.23 | 45.55 ± 12.43 | 0.7 |
| Male, n (%) | 54(90) | 20(100) | 18(90) | 16(80) | 0.1 |
| BMI (kg/m2) | 29.9 ± 8.7 | 26.5 ± 7.10 | 32.82 ± 9.68 | 30.63 ± 7.58 | 0.06 |
| Hip(cm) | 105.6 ± 15.6 | 98.9 ± 11.99 | 110.05 ± 17.84 | 107.74 ± 13.91 | 0.05 |
| Waist(cm) | 107.8 ± 17.2 | 98.05 ± 16.42 | 106.6 ± 17.6 | 109.7 ± 15.29 | 0.08 |
| Systolic BP | 120.1 ± 29.2 | 128.6 ± 10 | 118.3 ± 30.1 | 112.6 ± 39.1 | 0.2 |
| Diastolic BP | 77.3 ± 18.8 | 80.1 ± 6.3 | 76.7 ± 19.7 | 74.8 ± 26.1 | 0.6 |
OSA, obstructive sleep apnea; BP, Blood Pressure.
All the OSA patients had a median AHI of 17.65(min 5.1 and max 116.9) events per hour. The mean score of JSQ and ESS were 13.2 ± 2.9 and 11.5 ± 5.31 respectively.
As summarised in Table 2 the baseline and minimum saturation showed an increasing and decreasing trend respectively with severity of OSA. Both the baseline and minimum saturation was significantly lower in severe OSA as compared to mild OSA. The total sleep time with SaO2<90% was significantly higher in the severe OSA patients while lowest in the mild OSA patients.
Table 2.
Severity grades of OSA and their association with polysomnographic and cardiac variables.
| Variables | Mild OSA(n = 20) | Moderate OSA(n = 20) | Severe OSA(n = 20) | p-value |
|---|---|---|---|---|
| Mean ± SD | Mean ± SD | Mean ± SD | ||
| Polysomnographic variables | ||||
| ESS | 9.8 ± 4.1 | 11.4 ± 5.4 | 13.4 ± 5.6 | 0.10 |
| JSQ | 12.4 ± 2.5 | 13.1 ± 3.4 | 14.1 ± 2.7 | 0.01 |
| Total sleep time | 312.4 ± 89.7 | 252.7 ± 59.5 | 257.4 ± 51.8# | 0.01 |
| N1 stage | 22.4 ± 9.7 | 27.9 ± 12.1 | 26 ± 14.5 | 0.31 |
| N2 stage | 34.6 ± 9.8 | 36.8 ± 8.9 | 41.6 ± 9.4 | 0.07 |
| N3 stage | 29.5 ± 8.7 | 22.7 ± 10.5 | 23.1 ± 11.7 | 0.08 |
| REM Sleep | 13.3 ± 8.8 | 11.5 ± 7.9 | 10.3 ± 6.8 | 0.51 |
| Baseline saturation (SaO2) | 96.3 ± 0.7 | 95.6 ± 1.5 | 94.6 ± 2.3# | 0.01 |
| Minimum Saturation | 85.4 ± 3.7 | 82 ± 5.9 | 70.2 ± 11.4#$ | <0.01 |
| PLMS index | 1.9 ± 3.5 | 1.6 ± 3.5 | 1.4 ± 2.7 | 0.62 |
| Sat<90(%TST) (median, min–max) | 1.5(0–46.7) | 2.2(0–27.5) | 18.7(0–118.9)#$ | 0.001 |
| Echocardiographic variables | ||||
| Left ventricles 2dimensional parameters | ||||
| IVS thickness(mm) | ||||
| Unadjusted | 11.4 ± 1.9 | 10.4 ± 1.9 | 9.7 ± 1.7# | 0.02 |
| Adjusted** | 10.8 ± 0.45 | 10.7 ± 0.44 | 10.4 ± 0.44 | 0.3 |
| LADS(mm) | ||||
| Unadjusted | 24.9 ± 2.8 | 25.6 ± 2.7 | 26.4 ± 2.3 | 0.2 |
| Adjusted** | 25.3 ± 0.62 | 25.4 ± 0.61 | 26.3 ± 0.62 | 0.6 |
| LVDS(mm) | ||||
| Unadjusted | 31.6 ± 3.6 | 31.5 ± 2.7 | 32.5 ± 2.1 | 0.5 |
| Adjusted** | 31.3 ± 0.67 | 31.6 ± 0.68 | 32.9 ± 0.68 | 0.2 |
| LVDD(mm) | ||||
| Unadjusted | 45.9 ± 5.8 | 44.5 ± 4.5 | 45.1 ± 1.5 | 0.8 |
| Adjusted** | 45.6 ± 1.2 | 44.9 ± 1.1 | 45.1 ± 1.1 | 0.3 |
| Aorta(mm) | ||||
| Unadjusted | 18.1 ± 4.4 | 19.2 ± 4.9 | 20.8 ± 3.8 | 0.1 |
| Adjusted** | 18.3 ± 1.1 | 19.4 ± 1.0 | 20.5 ± 1.1 | 0.9 |
| Diastolic dysfunction parameters | ||||
| MV E/A ratio | ||||
| Unadjusted | 1.3 ± 0.18 | 1.21 ± 0.18 | 1.10 ± 0.23# | 0.001 |
| Adjusted** | 1.3 ± 0.04 | 1.22 ± 0.04 | 1.11 ± 0.04# | 0.01 |
| Deceleration Time (msec) | ||||
| Unadjusted | 165.1 ± 20.2 | 180.7 ± 22.0* | 179.6 ± 21.3# | 0.001 |
| Adjusted** | 165.1 ± 4.7 | 180.2 ± 4.0* | 180.6 ± 4.9 | 0.04 |
| Mitral E/e’ | ||||
| Unadjusted | 4.3 ± 1.68 | 5.89 ± 1.74 | 6.76 ± 2.9# | 0.002 |
| Adjusted** | 4.2 ± 0.42 | 5.6 ± 0.46 | 6.81 ± 0.43# | 0.03 |
| Left ventricular ejection fraction | ||||
| Ejection fraction (%) | ||||
| Unadjusted | 62.6 ± 3.85 | 60.05 ± 3.73 | 60 ± 3.87 | 0.06 |
| Adjusted** | 62.5 ± 0.93 | 59.9 ± 0.92 | 60 ± 0.93 | 0.11 |
| Cardiac Biomarker measurements | ||||
| hs-cTnI | ||||
| Unadjusted | 1.1 ± 0.50 | 1.5 ± 0.17* | 4.2 ± 3.21# | <0.001 |
| Adjusted** | 1.4 ± 0.41 | 1.5 ± 0.41* | 4.4 ± 0.41# | <0.001 |
OSA, obstructive sleep apnea; AHI, apnea hypopnea index; PLMS, Periodic limb movements; JSQ, Jenkins sleep questionnaire; REM, rapid eye movement sleep; ESS, Epworth Sleepiness Scale; Sat<90(%TST), total sleep time with SaO2<90% (% of total sleep time); LV, left ventricular; LA left atrium, IVS, interventricular septum; LVDS, LV diameter in systole; LVDD, LV diameter in diastole; LADS, LA diameter in systole; MV, mitral valve; MV E/A, MV peak flow velocity in early diastole/peak flow velocity in atrial contraction; Mitral E/e’, Mitral peak flow velocity in early diastole/medial e’- velocity; LVEF, LV ejection fraction; High-sensitivity cardiac troponin I, hs-cTnI.
p-value<0.05 Mild vs Severe
p-value<0.05 Mild vs Moderate
p-value<0.05 Severe vs Moderate
Adjusted Mean ± SE
In the study, multivariate analysis was carried out to see the association of OSA with various 2D echocardiographic and diastolic dysfunction parameters after adjusting the relevant variables.
As Table 2 shows, the left ventricular 2D parameters, LA diameter in systole, interventricular septum thickness, left ventricular diastolic diameter and systolic diameters were not significantly different among the OSA severity categories. IVS thickness is, contrary to expectations, highest in the group of mild OSA but after adjusting covariates (age, BMI, and systolic and diastolic BP) there was no significant difference found among IVS and OSA severity categories.
Both diastolic and systolic dysfunction was assessed in the study. All patients LVEF was within a normal range with a mean of 60.8 ± 4.01(min 52 & max 70) %. Diastolic dysfunction was evaluated using three variables E/A ratio, DT and E/e’ ratio listed in Table 2. All three variables had a statistically significant association with different grades of severity of OSA. In post-hoc comparison, we found both E/A and E/e’ were significantly lower in severe OSA in comparison to mild OSA. While in deceleration time moderate and severe OSA patients had significantly higher deceleration time as compared to mild OSA. There was a marginally significant positive correlation (ρ = 0.3244, p = 0.04) between AHI events per hour and mitral E/e’ ratio (Fig. 2). There was a statistically significant association between diastolic dysfunction grades and severity grades of OSA (p = 0.009) Fig. 3 depicts higher diastolic dysfunction grade was observed more commonly in severe OSA (20%) versus the mild OSA patient in which 100% had no diastolic dysfunction.
Fig. 2.

Scatter plot shows the correlation between different cardiac variables and AHI. (A) positive correlation (ρ = 0.3244, p = 0.04) between AHI events per hour and mitral E/e' ratio; (B) positive correlation (ρ = 0.3244, p = 0.04) between AHI events per hour and hs-cTnI. (C) positive correlation (ρ = 0.58, P < 0.001) between T Sat 90% and hs-cTnI. hs-cTnI: high-sensitivity cardiac troponin T; AHI: apnea hypopnea index; T Sat 90%: Total sleep time with SaO2 < 90%.
Fig. 3.
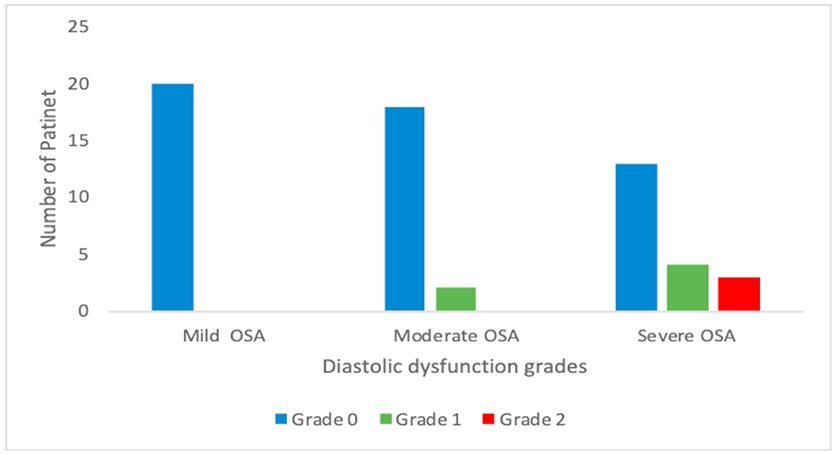
Association between diastolic dysfunction grades and severity grades of OSA. OSA: obstructive sleep apnoea.
There was a statistically significant association between hs-cTnI value among different severity grades of OSA(P ≤ 0.001). In between group comparisons, we found that hs-cTnI levels in severe OSA were significantly higher as compared to mild OSA presented in Table 2. In the study correlation was determined between hs-cTnI and both AHI and Sat<90(%TST) as shown in Fig. 2. Further, there was a significant positive correlation of hs-cTnI was found with AHI events per hour (ρ = 0.69, P < 0.001) and Sat<90(%TST) (ρ = 0.58, P < 0.001).
4. Discussion
In this cross-sectional study of mild to severe OSA, patients were evaluated for left ventricular dysfunction and subclinical myocardial injury. In this study, to the best our ability, we excluded confounding variables like comorbidities or any pharmacological interventions and all patients were not receiving any medication either before or during the study period. We did not exclude overweight and obese patients which are known risk factors for both OSA and cardiovascular diseases. Here in our study, we found OSA a potential risk factor for development of myocardial injury and diastolic dysfunction.
In our study, we have shown that diastolic abnormalities are substantially related to OSA severity. Furthermore, with the increasing severity of OSA we found an increase in the severity of diastolic dysfunction. In our cohort, patients with severity grades of OSA were analysed in contrast to some previously published data wherein patients with the entire spectrum of disease severity were examined without stratification. In our study design, we studied the association of severity grades of OSA with severity grades of diastolic dysfunction. Moreover, several polysomnographic parameters were also analysed to correlate different grades of OSA with diastolic dysfunction. The overall prevalence of diastolic dysfunction in our study was 15% (9 out of 60), while it was 10% (2 out of 20) and 35% (7 out of 20) in moderate OSA and severe OSA patients respectively. The prevalence of diastolic dysfunction was similar to the study by Baguet et al. where the prevalence was 22.7% (34 out of 150). In this study the patients with diastolic dysfunction were older than those with normal diastole (57 ± 9 vs 46 ± 10 years; P < 0.001) [23].
An Indian study done by Varghese et al. evaluated patients with very severe OSA and showed that it was significantly associated with diastolic dysfunction [24]. Our results showed that the severity of diastolic dysfunction increases with the severity of OSA which was also similar to the previous study by Wachter et al. The study done by Wachter et al. and few others did not exclude the cardiac risk factors and hence the study had higher prevalence of diastolic dysfunction even in mild OSA patients [25]. Left ventricular hypertrophy is usually seen in patients with OSA, and interventricular septum thickness, left ventricular mass and left ventricular posterior wall thickness are higher in severe OSA patients. However, in our study none of the 2Dimensional echocardiographic parameters was significantly higher in severe OSA compared to data published by Varghese et al. and Wachter et al. [22,24,25].
One of the ventricular assessment studies in the OSA cohort(n = 353) had shown no association of diastolic dysfunction in OSA but this study used only mitral inflow patterns [26]. As per current guidelines, two or more echocardiographic indices of diastolic function should be in coherence and should be interpreted in background of clinical, other 2D and Doppler parameters.
The use of only mitral inflow pattern as a method for diastolic dysfunction is not recommended. There is no single method or index for accurate prediction of diastolic dysfunction. In our study, we used both mitral inflow patterns and Doppler tissue imaging for accurate prediction of diastolic dysfunction [22]. This approach further strengthens the evidence of diastolic dysfunction in OSA patients in accordance with guidelines. We could not find any significant association of systolic dysfunction with different grades of severity of OSA, a finding consistent with prior reports by Varghese and Wachter [24,25]. Thus, we observed subclinical cardiac functional abnormality in moderate to severe OSA patients which manifests early as diastolic dysfunction.
In our study there was a statistically significant association between hs-cTnI values and severity grades of OSA (P < 0.001). This finding points towards recurrent subclinical myocardial injury due to frequent apnoea or hypoxemia and possible risk of chronic myocardial ischemia and diastolic dysfunction. In the study, there was a significant positive correlation of hs-cTnI was found with AHI events per hour (ρ = 0.69, P < 0.001)and Sat<90(%TST) (ρ = 0.58, P < 0.001). Previous studies have also demonstrated higher OSA severity is associated with higher concentrations of hs-cTnI [11,27,28].
As few studies have reported, OSA leading to chronic intermittent-hypoxia-induced preatherosclerotic remodelling, and accelerating the rate of atherosclerosis and increasing the prevalence of acute and chronic myocardial ischemia [29,30]. Other factors promoting remodelling are insulin resistance-related injury and left ventricular hypertrophy [31,32]. Thus, leading to disturbance in left ventricular diastolic function and reduction in myocardial perfusion. Various small patient population studies have shown an association of diastolic dysfunction and hs-cTnI levels in patients with OSA [23,29,32,33]. Our data strengthen the evidence for an association between OSA and myocardial injury hence leading to chronic myocardial ischemia and diastolic dysfunction.
Our study has some limitations: (1) patients attending hospital clinics are likely to have more severe disease and do not adequately reflect the characteristics of the general population, Thus, our conclusions are limited to the population studied. (2) small sample size. We acknowledge the need for larger studies but we were adequately powered for our main findings. (3) women were not adequately represented in our sample (10% of the patients). Thus, further work is needed to assess for gender differences between groups. (4) no control arm in the study. Thus, we cannot draw conclusions about people without OSA but our goal was to study varying OSA severity. (5) effect of CPAP on diastolic dysfunction and hs-cTnI was not evaluated. (6) Arousal index was not included in the polysomnography variables. (7) split-night protocol was used in the study which may underestimate or overestimate the severity of OSA.
Thus, the reversibility of the observed abnormalities is unclear. Nonetheless, despite these limitations, we view our findings as important and hope that they help to encourage further research in this area.
5. Conclusion
Here in our study, we found OSA a potential risk factor for development of myocardial injury and diastolic dysfunction. Higher severity grades of OSA are associated with higher levels of serum hs-cTnI and greater diastolic dysfunction. Frequent episodes of hypoxemia and/or apnoea causing chronic myocardial injury and diastolic dysfunction may be the underlying a pathogenetic mechanisms of heart failure in patients with OSA.
Acknowledgments
We would like acknowledge the support all staff of Sleep laboratory of Department of Medicine and echocardiography laboratory of Department of Cardiology, AIIMS New Delhi.
Funding sources
This research did not receive any specific grant from funding agencies in the public, commercial, or not-for-profit sectors. Dr. Atul Malhotra is funded by the US National Institutes of Health. All other authors have no financial disclosure relevant to this article.
Footnotes
Conflict of interest
All authors declare that they have no credit and conflict of interest. ResMed provided a philanthropic donation to UC San Diego School of Medicine, San Diego 92121, CA, USA.
References
- [1].GBD 2017 Causes of Death Collaborators. Global, regional, and national age-sex-specific mortality for 282 causes of death in 195 countries and territories, 1980-2017: a systematic analysis for the Global Burden of Disease Study 2017. Lancet Lond Engl 2018. 10;392(10159):1736–88. 10.1016/S0140-6736(18)32203-7. Erratum in: Lancet. 2019 Jun 22;393(10190):e44. Lancet. 2018 Nov 17;392(10160):2170. [DOI] [PMC free article] [PubMed] [Google Scholar]
- [2].GBD 2017 dAlYs and HALE Collaborators. Global, regional, and national disability-adjusted life-years (DALYs) for 359 diseases and injuries and healthy life expectancy (HALE) for 195 countries and territories, 1990-2017: a systematic analysis for the Global Burden of Disease Study 2017. Lancet 2018. November 10;392(10159):1859–922. 10.1016/S0140-6736(18)32335-3. Erratum in: Lancet. 2019 Jun 22;393(10190):e44. [DOI] [PMC free article] [PubMed] [Google Scholar]
- [3].GBD 2015 Risk Factors Collaborators. Global, regional, and national comparative risk assessment of 79 behavioral, environmental and occupational, and metabolic risks or clusters of risks, 1990-2015: a systematic analysis for the Global Burden of Disease Study 2015. Lancet 2016. October 8;388(10053):1659–724, 10.1016/S0140-6736(16)31679-8. Erratum in: Lancet. 2017 Jan 7;389(10064):e1. [DOI] [PMC free article] [PubMed] [Google Scholar]
- [4].Benjafield AV, Ayas NT, Eastwood PR, et al. Estimation of the global prevalence and burden of obstructive sleep apnoea: a literature-based analysis. Lancet Respir Med 2019. August;7(8):687–98, 10.1016/S2213-2600(19)30198-5. [DOI] [PMC free article] [PubMed] [Google Scholar]
- [5].Rechtschaffen A, Bergmann BM, Everson CA, et al. Sleep deprivation in the rat: X. Integration and discussion of the findings. Sleep 1989. February;12(1):68–87. [PubMed] [Google Scholar]
- [6].Drager LF, McEvoy RD, Barbe F, et al. INCOSACT initiative (International collaboration of sleep apnea cardiovascular Trialists). Sleep apnea and cardiovascular disease: lessons from recent trials and need for team science. Circulation 2017. November 7;136(19):1840–50. 10.1161/CIRCULATIONAHA.117.029400. [DOI] [PMC free article] [PubMed] [Google Scholar]
- [7].Lombardi C, Pengo MF, Parati G. Systemic hypertension in obstructive sleep apnea. J Thorac Dis 2018. December;10(Suppl 34):S4231–43. 10.21037/jtd.2018.12.57. [DOI] [PMC free article] [PubMed] [Google Scholar]
- [8].Molnar MZ, Mucsi I, Novak M, et al. Association of incident obstructive sleep apnoea with outcomes in a large cohort of US veterans. Thorax 2015. September;70(9):888–95. 10.1136/thoraxjnl-2015-206970. [DOI] [PMC free article] [PubMed] [Google Scholar]
- [9].Yusuf S, Reddy S, Ounpuu S, et al. Global burden of cardiovascular diseases: part I: general considerations, the epidemiologic transition, risk factors, and impact of urbanization. Circulation 2001. November 27;104(22):2746–53. [DOI] [PubMed] [Google Scholar]
- [10].Zhang Y, Wang W, Cai S, et al. Obstructive sleep apnea exaggerates cognitive dysfunction in stroke patients. Sleep Med 2017. May;33:183–90. 10.1016/j.sleep.2016.11.028. [DOI] [PubMed] [Google Scholar]
- [11].Querejeta Roca G, Redline S, Punjabi N, et al. Sleep apnea is associated with subclinical myocardial injury in the community. The ARIC-SHHS study. Am J Respir Crit Care Med 2013. December 15;188(12):1460–5. 10.1164/rccm.201309-1572OC. [DOI] [PMC free article] [PubMed] [Google Scholar]
- [12].Ponikowski P, Voors AA, Anker SD, et al. 2016 ESC Guidelines for the diagnosis and treatment of acute and chronic heart failure: the Task Force for the diagnosis and treatment of acute and chronic heart failure of the European Society of Cardiology (ESC)Developed with the special contribution of the Heart Failure Association (HFA) of the ESC. Eur Heart J 2016. July 14;37(27):2129–200. 10.1093/eurheartj/ehw128. Erratum in: Eur Heart J. 2016 Dec 30. [DOI] [PubMed] [Google Scholar]
- [13].Savarese G, Lund LH. Global public health burden of heart failure. Card Fail Rev 2017. April;3(1):7–11. 10.15420/cfr.2016:25:2. [DOI] [PMC free article] [PubMed] [Google Scholar]
- [14].Gomez-Soto FM, Andrey JL, Garcia-Egido AA, et al. Incidence and mortality of heart failure: a community-based study. Int J Cardiol 2011. August 18;151(1):40–5. 10.1016/j.ijcard.2010.04.055. [DOI] [PubMed] [Google Scholar]
- [15].Ohlmeier C, Mikolajczyk R, Frick J, et al. Incidence, prevalence and 1-year all-cause mortality of heart failure in Germany: a study based on electronic healthcare data of more than six million persons. Clin Res Cardiol 2015. August;104(8):688–96. 10.1007/s00392-015-0841-4. [DOI] [PubMed] [Google Scholar]
- [16].Ceia F, Fonseca C, Mota T, et al. Prevalence of chronic heart failure in South-western Europe: the EPICA study. Eur J Heart Fail 2002. August;4(4):531–9. [DOI] [PubMed] [Google Scholar]
- [17].Khattak HK, Hayat F, Pamboukian SV, et al. Obstructive sleep apnea in heart failure: review of prevalence, treatment with continuous positive airway pressure, and prognosis. Tex Heart Inst J 2018. June 1;45(3):151–61. 10.14503/THIJ-15-5678. [DOI] [PMC free article] [PubMed] [Google Scholar]
- [18].Berry RB, Budhiraja R, Gottlieb DJ, et al. Rules for scoring respiratory events in sleep: update of the 2007 AASM manual for the scoring of sleep and associated events. Deliberations of the sleep apnea definitions task force of the American academy of sleep medicine. J Clin Sleep Med 2012. October 15;8(5):597–619. 10.5664/jcsm.2172. [DOI] [PMC free article] [PubMed] [Google Scholar]
- [19].Kapur VK, Auckley DH, Chowdhuri S, et al. Clinical practice guideline for diagnostic testing for adult obstructive sleep apnea: an American academy of sleep medicine clinical practice guideline. J Clin Sleep Med 2017. March 15;13(3):479–504. 10.5664/jcsm.6506. [DOI] [PMC free article] [PubMed] [Google Scholar]
- [20].Patil SP, Ayappa IA, Caples SM, et al. Treatment of adult obstructive sleep apnea with positive airway pressure: an American academy of sleep medicine clinical practice guideline. J Clin Sleep Med 2019. February 15;15(2):335–43. 10.5664/jcsm.7640. [DOI] [PMC free article] [PubMed] [Google Scholar]
- [21].Lang RM, Badano LP, Mor-Avi V, et al. Recommendations for cardiac chamber quantification by echocardiography in adults: an update from the American Society of Echocardiography and the European Association of Cardiovascular Imaging. J Am Soc Echocardiogr 2015. January;28(1):1–39. 10.1016/j.echo.2014.10.003. e14. [DOI] [PubMed] [Google Scholar]
- [22].Nagueh SF, Smiseth OA, Appleton CP, et al. Recommendations for the evaluation of left ventricular diastolic function by echocardiography: an update from the American society of echocardiography and the European association of cardiovascular imaging. J Am Soc Echocardiogr 2016. April;29(4):277–314. 10.1016/j.echo.2016.01.011. [DOI] [PubMed] [Google Scholar]
- [23].Baguet JP, Barone-Rochette G, Lévy P, et al. Left ventricular diastolic dysfunction is linked to severity of obstructive sleep apnoea. Eur Respir J 2010. December;36(6):1323–9. 10.1183/09031936.00165709. [DOI] [PubMed] [Google Scholar]
- [24].Varghese MJ, Sharma G, Shukla G, et al. Longitudinal ventricular systolic dysfunction in patients with very severe obstructive sleep apnea: a case control study using speckle tracking imaging. Indian Heart J 2017. May-Jun;69(3):305–10. 10.1016/j.ihj.2016.12.011. [DOI] [PMC free article] [PubMed] [Google Scholar]
- [25].Wachter R, Lüthje L, Klemmstein D, et al. Impact of obstructive sleep apnoea on diastolic function. Eur Respir J 2013. February;41(2):376–83. 10.1183/09031936.00218211. [DOI] [PubMed] [Google Scholar]
- [26].Niroumand M, Kuperstein R, Sasson Z, et al. Impact of obstructive sleep apnea on left ventricular mass and diastolic function. Am J Respir Crit Care Med 2001. June;163(7):1632–6. [DOI] [PubMed] [Google Scholar]
- [27].Zhang XB, Zeng HQ, Du YP, et al. High-sensitivity cardiac troponin T in obstructive sleep apnea patients without cardiovascular diseases: efficacy of CPAP treatment. Chron Respir Dis 2018. May;15(2):157–64. 10.1177/1479972317740127. [DOI] [PMC free article] [PubMed] [Google Scholar]
- [28].Einvik G, Røsjø H, Randby A, et al. Severity of obstructive sleep apnea is associated with cardiac troponin I concentrations in a community-based sample: data from the Akershus Sleep Apnea Project. Sleep 2014. June 1;37(6):1111–6. 10.5665/sleep.3772.1116A-1116B. [DOI] [PMC free article] [PubMed] [Google Scholar]
- [29].Kraiczi H, Caidahl K, Samuelsson A, et al. Impairment of vascular endothelial function and left ventricular filling : association with the severity of apnea-induced hypoxemia during sleep. Chest 2001. April;119(4):1085–91. [DOI] [PubMed] [Google Scholar]
- [30].Castro-Grattoni AL, Alvarez-Buvé R, Torres M, et al. Intermittent hypoxia-induced cardiovascular remodeling is reversed by Normoxia in a mouse model of sleep apnea. Chest 2016. June;149(6):1400–8. 10.1016/j.chest.2015.11.010. [DOI] [PubMed] [Google Scholar]
- [31].Kasai T, Bradley TD. Obstructive sleep apnea and heart failure: pathophysiologic and therapeutic implications. J Am Coll Cardiol 2011. January 11;57(2):119–27. 10.1016/j.jacc.2010.08.627. [DOI] [PubMed] [Google Scholar]
- [32].Baguet JP, Barone-Rochette G, Tamisier R, et al. Mechanisms of cardiac dysfunction in obstructive sleep apnea. Nat Rev Cardiol 2012. December;9(12):679–88. 10.1038/nrcardio.2012.141. [DOI] [PubMed] [Google Scholar]
- [33].Shahar E, Whitney CW, Redline S, et al. Sleep-disordered breathing and cardiovascular disease: cross-sectional results of the Sleep Heart Health Study. Am J Respir Crit Care Med 2001. January;163(1):19–25. 10.1164/ajrccm.163.1.2001008. [DOI] [PubMed] [Google Scholar]