Abstract
Identifying areas for workflow improvement and growth is essential for an interventional radiology (IR) department to stay competitive. Deployment of traditional methods such as Lean and Six Sigma helped in reducing the waste in workflows at a strategic level. However, achieving efficient workflow needs both strategic and tactical approaches. Uncertainties about patient arrivals, staff availability, and variability in procedure durations pose hindrances to efficient workflow and lead to delayed patient care and staff overtime. We present an alternative approach to address both tactical and strategic needs using discrete event simulation (DES) and simulation based optimization methods. A comprehensive digital model of the patient workflow in a hospital-based IR department was modeled based on expert interviews with the incumbent personnel and analysis of 192 days’ worth of electronic medical record (EMR) data. Patient arrival patterns and process times were derived from 4393 individual patient appointments. Exactly 196 unique procedures were modeled, each with its own process time distribution and rule-based procedure-room mapping. Dynamic staff schedules for interventional radiologists, technologists, and nurses were incorporated in the model. Stochastic model simulation runs revealed the resource “computed tomography (CT) suite” as the major workflow bottleneck during the morning hours. This insight compelled the radiology department leadership to re-assign time blocks on a diagnostic CT scanner to the IR group. Moreover, this approach helped identify opportunities for additional appointments at times of lower diagnostic scanner utilization. Demand for interventional service from Outpatients during late hours of the day required the facility to extend hours of operations. Simulation-based optimization methods were used to model a new staff schedule, stretching the existing pool of resources to support the additional 2.5 h of daily operation. In conclusion, this study illustrates that the combination of workflow modeling, stochastic simulations, and optimization techniques is a viable and effective approach for identifying workflow inefficiencies and discovering and validating improvement options through what-if scenario testing.
Keywords: Operational improvement, Workflow modeling, Simulation, Optimization, Simulation-based optimization, What-if scenario analysis, Discrete event simulation, Interventional radiology department
Background
With a recent shift to a patient-centric, value-based care model and an ever-growing demand for their services, Interventional Radiology (IR) departments across the USA have a difficult task of balancing patient experience with financial performance. Long patient wait times have been linked to poorer patient experience, reduced patient satisfaction, and detrimentally influenced the perception of the quality of the received care [1]. Reimbursement reductions and tightening budgets have forced IR departments to look for alternative options to increase their throughput without jeopardizing the quality of the delivered services. One approach to identifying efficiency gaps and improvement opportunities is to use workflow modeling and analysis. Workflow modeling can be facilitated by creating a virtual replica of the real-world workflow: this approach accurately identifies and documents workflow steps and maps them into a computer simulation model. Once the model is validated to closely represent the real-world system, operations research methods can be used to analyze “what-if” scenarios of interest and observe the resulting outcome. Such analysis helps in identifying optimal resource allocation and patient scheduling patterns or be used to evaluate growth opportunities, or forthcoming challenges.
The idea of attaining gains in efficiency by streamlining clinical workflow is not novel. For instance, Beker et al. described using lean methods to evaluate magnetic resonance imaging (MRI) workflow in a tertiary care academic center, discovering that non-value added time represented a third of the total MRI process cycle time [2]. Amir et al. detailed their experience of using data-driven real-time location system (RTLS) with discrete event simulation (DES)–based modeling at an academic breast-imaging center uncovering potential length of stay improvements with equipment upgrades [3]. However, deployment of RTLS is costly and time-intensive. Hence, many researchers have used simulation models to analyze operational performance in a mammography clinic [4], colonoscopy suite [5], and emergency departments [6].
IR operations are a notoriously complex setting, and in the absence of an RTLS, it is necessary to utilize the procedural time stamps currently tracked, supplemented with expert interview data. The expert interviews also serve to obtain critical change management “buy-in” and support from the hospital staff. They also bring important practical insights and provide additional level of detail while capturing the patient workflow. The purpose of this study was (1) to create an accurate digital model of the IR patient workflow, (2) to use the digital workflow model combined with electronic medical record (EMR) data to simulate “what-if” scenarios, and (3) to use simulation-based optimization techniques to explore alternative resource allocation strategies and identify means of increasing throughput and extending operational hours. This approach has the advantage of avoiding costly and time-intensive RTLS hardware deployment.
Methods
Data Gathering
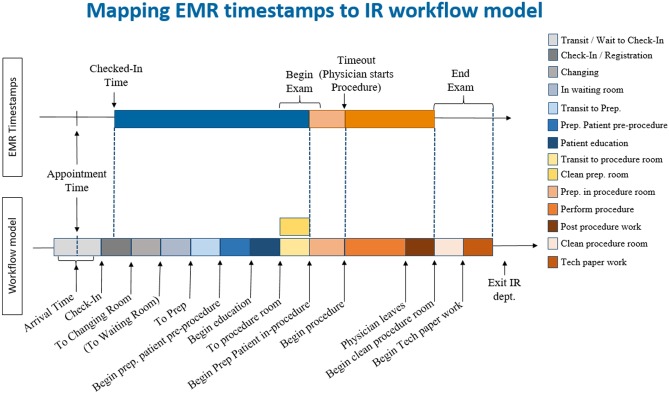
IRB exemption to analyze transactional operational data was granted by our partnering hospital. First, a detailed patient workflow for the IR department was constructed. Data used to create the patient flow was retrieved from EMR system and was further supplemented with in-person interviews. The advantages of using EMR data were two-fold: (1) it contained important timestamps in the patient’s clinical care such as patient’s scheduled appointment and patient’s actual arrival, begin, and end of the patient’s exam and (2) it provided information on procedure name, modality used, practitioner performing the procedure, etc. Such high detailed patient and procedure details retrieved from EMR data provided a broad overview of the workflow, putting in place major events, timings, and defining roles and processes (Fig. 1 top panel). In order to match the real-world processes as closely as possible, we supplemented the EMR data by staff and stakeholder interviews (Fig. 1 bottom panel). The interview process was used to (1) identify undocumented yet necessary activities such as room cleaning and paperwork that are not captured in the EMR system and estimate the duration of these activities, (2) establish staff schedules, (3) identify resource requirements, and (4) create detailed procedure-to-room mappings. Once patient workflow was detailed out, a workflow simulation model reflecting the identified steps and model logic was constructed.
Fig. 1.
Event timestamps obtained from the EMR only (top) vs. workflow timestamps and activities identified via EMR and the interview process (bottom)
Building the Simulation Model
FlexSim healthcare software (Version 5.3, Orem, UT) was used to create a discrete event simulation (DES) model. Within the DES, changes in the state of the system reflect the occurrence of discrete events such as patient arrivals. A digital model of real-world workflow was constructed by representing the resources (human resources such as nurses, technologist, and IR physicians and equipment resources such as scanners), the processes involved in patient care, and the interactions taking place over the course of the day.
The IR department at our partnering facility has four dedicated IR rooms [3 Fluoroscopy (Angio suite), 1 Ultrasound] and one dedicated CT room. There is an additional Bay area where patients are prepped and a few IR procedures such as Paracentesis are performed. The patients who undergo CT-guided intervention are referred to as ‘CT patients’ and other patients as ‘IR patients’.
The first step in building the model was to identify patient groups (i.e., outpatient, inpatient, ED) and their attributes. Each patient group may have a different arrival pattern and a diverging workflow. For instance, additional steps were introduced into the model to reflect anesthesia workflow including the recovery handoff process. Nurses, technologists, and IR physicians were modeled with staff schedules and capacities. Staggered lunch breaks were modeled for staff members. Based on interviews, staff were assumed cross-trained to perform all procedures. The model assumed full staff availability ignoring staff absences due to vacation time or sick leave.
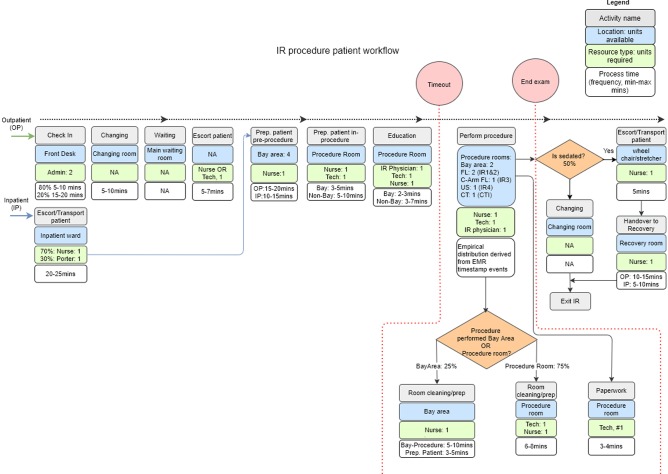
Next, patient activities were outlined, with each activity defined by staff involved, the area the activity is performed, the types of rooms the procedure can be performed, timing to completion, etc. (Fig. 2). Deterministic data on patient schedule and their actual arrival time derived from EMR data were used to model patient arrivals. Each procedure was set with its unique distribution of procedure durations derived from the available time stamps. These distributions were randomly sampled during the simulation runs. In order to account for the stochastic nature of day-to-day variations, a thousand simulation runs over the observed days in the dataset were done for each scenario.
Fig. 2.
Detailed view of the interventional radiology department patient workflow (activities, resources, timings) for outpatient and inpatient populations
Key Performance Indicators
The focus of this paper is limited to the analysis of activities that occur from patient check-in to procedure completion. We tracked the following five KPIs to evaluate the performance of the different “what-if” scenarios. First, last patient exit time was chosen as a proxy for the overall performance of the department on a given day. Second, the patient direct wait time was tracked; referring to the actual wait a patient experienced going through the individual workflow process steps on the day of the procedure. Third, a multi-resource wait time, which accounts for the wait or unavailability of staff and room at each step in the process was monitored. Fourth, patient length of stay which accounts for the duration of time spent by the patient at the facility. Fifth, resource utilization for which the target range was around (75%, 85%).
Model Calibration and Validation
Once the model was completed, a review by the key stakeholders was performed to ensure that all the pertinent steps and processes within the workflow were accounted for in the model. Secondly, a validation study, assessing the accuracy of the model, was conducted. This step was essential to ensure that any recommendations made based on the model results had the anticipated impact when implemented by the department. Therefore, 192 days of deterministic data combined with expert interviews on process flow and their process time were used as input to the model. The resulting model outputs were compared to the known, empirical observations.
Bottleneck Analysis and Scenario Testing
Once validated, the model was used to perform the bottleneck analysis. The purpose of the bottleneck analysis was to identify the root cause of delays and inefficiencies within the workflow and establish points at which improvements could be introduced. In order to test different improvement strategies, scenario testing was done. Over 20 scenarios evaluating approaches for increasing throughput, balancing staff utilization, or reassigning resources were simulated. Actionable scenarios of note included (1) introducing 4 h of additional CT time and additional patients by using a CT scanner in another department, (2) adding extra patients to the schedule throughout the day, and (3) expanding hours of operations of the department by 2.5 h.
Simulation-based scenario testing was used to identify the impact of scheduling 4 h of additional CT room capacity in the morning and in the afternoon and test the effect of adding varied number of additional patients on operational KPIs. Table 1 lists the selected scheduling patterns of the additional exams that are tested to determine its impact on KPIs. In order to model hypothetical, additional exams process times for a CT-guided liver mass biopsy, a common procedure, were sampled.
Table 1.
Impact of scheduling 4 h of additional CT room capacity and additional patients in the morning vs. afternoon
| Scenario | Additional CT availability | Additional patient appointment time | Multi-resource wait time (min) |
|---|---|---|---|
| Base case | - | - | 23 |
| CT Rm + 0 Pt | AM, PM | - | 19, 25 |
| CT Rm + 2 Pt | AM, PM | 9 and 11 a.m., 2 and 4 p.m. | 25, 23 |
| CT Rm + 3 Pt | AM, PM | 9 and 10 and 11 a.m., 2 and 3 and 4 p.m. | 39, 30 |
| CT Rm + 4 Pt | AM, PM | 9 and 10 and 11 a.m. and 12 p.m., 2 and 3 and 4 and 5 p.m. | 61, 27 |
Further scenario testing was done to identify ways of adding extra patients to the schedule without significantly affecting operational KPIs. Table 2 lists the selected scenarios that are tested to determine the influence of adding extra patients. In order to model additional IR exams, process times for an US-guided thyroid biopsy, the most frequently performed IR procedure, were sampled. Staff utilization, patient wait times and LOS were reviewed.
Table 2.
Selected scenarios for testing the influence of adding extra patients to the schedule for different days of the week
| Scenario (DoW: day of week ) | Number of patients in a week day (Monday–Friday) |
Additional patient appointment time | Multi-resource wait time (min) M,Tu,W,Th,F |
|---|---|---|---|
| Base case IR < DoW > | - | - | 21,22,26,22,23 |
| 1_IR_ < DoW > | 1 IR per weekday | 01:00 p.m. | 23,26,31,25,24 |
| 2_IR_ < DoW > | 2 IR per weekday | 01:00 p.m., 02:00 p.m. | 22,29,29,27,30 |
Finally, scenario testing and simulation-based optimization were used to identify a way of extending hours of operation, while fixing the number of hours worked by staff. Since the complexity in workflow makes it challenging to be formulated as a mathematical model, simulation model was used to optimize the required resources (RNs and technologists). Towards this, FlexSim was combined with an optimization engine (OptQuest from OptTek Systems, Boulder, CO). Next, mixed integer linear programming was used to construct optimal staff schedules, meeting the minimum staff requirements, shift and operations hours, etc. These staff schedules were tested in the original base-case simulation model to establish the effect of reduced staff on patient KPIs. To demonstrate the approach, simulations were done for low volume days (Thursdays), demonstrating the effects due to shifts in staff schedule. Table 3 lists the different scenarios tested to determine the optimal number of patients. Process times for US-guided thyroid biopsy procedure and CT-guided liver mass biopsy were sampled respectively in testing these scenarios. Patient waiting and staff utilization were reviewed to identify the optimal combination of procedures.
Table 3.
Impact of expanding hours of operations of the department by 2.5 h (7 a.m.–8 p.m.)
| Scenario | Number of additional patients and appointment time random at the hour | Multi-resource wait time (min) |
|---|---|---|
| Base case | - | 23 |
| 2 CT and 3,4,5 IR |
2 CT: 6 p.m., 7 p.m. 3 IR: 5 p.m. (+ 1 for 5 IR), 6 p.m. (+ 1 for 4 IR), 7 p.m. |
28, 31, 34 |
| 3 CT and 3, 4, 5 IR |
3 CT: 5 p.m., 6 p.m., 7 p.m. 3 IR: 5 p.m. (+ 1 for 5 IR), 6 p.m. (+ 1 for 4 IR), 7 p.m. |
35, 41, 47 |
Results
This work was done at the IR department in a Level 1 trauma hospital with 335 inpatient beds. This IR department performs approximately 6500 procedures per year. For the purposes of this study, 192 days of operations of the IR department were modeled, with 4393 unique patients seen and 196 unique procedures performed during the modeled time window. Only weekdays were considered. On average, 22 procedures were performed in the department on daily basis with actual procedures lasting 37 ± 21 min (Fig. 3). Depending on the day of the week, 3–7 IR physicians, 4–6 technologists, and 5–6 nurses performed the procedures in the 7 a.m.–5:30 p.m. window, with 1 nurse, 1 technologist, and 1 physician covering the 5:30 p.m.–7 a.m. shift.
Fig. 3.
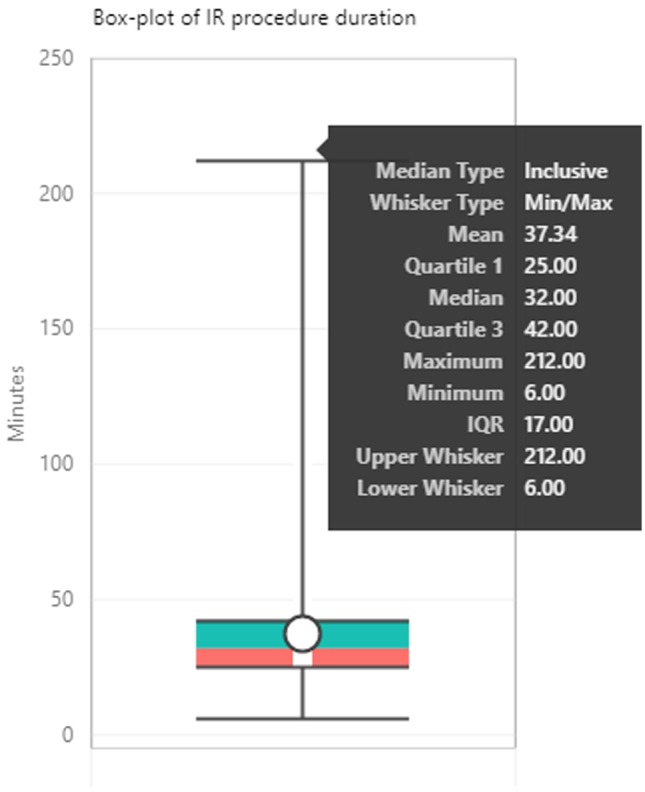
Box-plot of IR procedure duration. Time spent by an IR Physician or Physician assistant performing the IR procedure (Time-out to End Exam)
Model validation was performed by comparing KPIs of the simulation model populated with deterministic values and the empirical data. Procedure times and room allocations were modeled as seen in the empirical data, while pre-procedure timings were kept probabilistic based on the estimates obtained through the interviews. The mean absolute error between simulation results and empirically observed for the last patient exit time over 192 days was 19 ± 16 min (t test p = 0.098).
With IR department DES model validated, the model was used to review patient wait times.
It was showed that 52% and 13% of patients experienced an average wait time of 8 min and > 20 min respectively. Bottleneck analysis revealed that procedure rooms were the greatest contributor to patient wait times, particularly in the first half of the day (Fig. 4). Among all rooms, wait time for CT room contributed the highest (average 7 min) to patient wait time (Fig. 5). Tellingly, the analysis showed minimal impact of staff utilization on the workflow and pointed to opportunities for greater utilization of other IR rooms.
Fig. 4.
Daily average patient wait times by time of day contributed by various factors within the IR department workflow. Shown procedure room waiting times are averaged over five procedure rooms in the IR department
Fig. 5.
Daily patient multi-resource wait times by time of day contributed by individual procedure rooms in the IR department
Multiple scenarios for utilizing additional 4 h of CT room capacity were simulated. Multi-resource wait time for the base-case was 23 min; in the morning, 2 CT patients could be added to maintain comparable to the base-case of 25 min of wait time, while in the afternoon, 4 CT patients could be added for the multi-resource wait time of 27 min (Fig. 6). Peak technologist utilization remained within the desired limits of 85% for all tested scenarios. At its peak, RN utilization was just below and just above the 90% utilization level for the tested scenarios when 3 and 4 CT patients respectively were added in the morning (Fig. 6). Mean LOS remained largely the same for all tested scenarios, with exception of the scenario with four CT patients added in the morning—where mean LOS of 118 min was 12 min higher than the base-case value of 106 min.
Fig. 6.
Average patient multi-resource wait times for scenarios examining addition of varying number of patients with additional 4 h of CT room availability (i.e. existing resources + 4 h of additional CT room borrowed) throughout the day
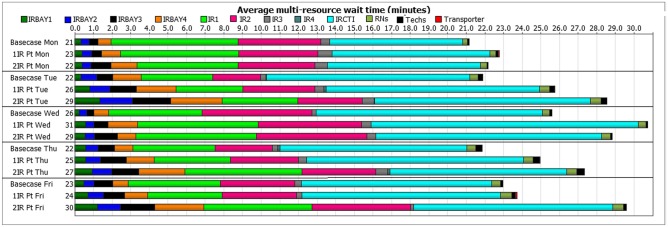
Figure 7 describes the multi-resource wait times seen for different days of the week with and without addition of extra IR patients. Wait times associated with procedure rooms were further reviewed by time of the day for different days of the week without extra IR patients. Morning hours (9 a.m.–12 p.m.) consistently had higher wait times (16 ± 31 min, ranging from 0 to 187 min of wait time for CT room and 5 ± 13 min, ranging from 0 to 107 min of wait time for IR rooms). Afternoon hours (1–3 p.m.) consistently showed lower wait times (7 ± 18 min, ranging from 0 to 104 min of wait time for CT room and 3 ± 10 min, ranging from 0 to 68 min of wait time for IR rooms). A t test for CT room morning vs. afternoon wait time shows a p-value of 2.67E−05 and a t test for IR rooms’ morning vs. afternoon wait time shows a p-value of 0.006; hence, the differences are found to be significant. Staff utilization values were also reviewed. Mean RN utilization increased from 60% (base-case) to 67% (one extra IR patient scenario) and to 68% (two extra IR patients scenario). Mean technologist utilization increased from 48% (base-case) to 53% (one extra IR patient scenario) and to 57% (two extra IR patients scenario).
Fig. 7.
Average patient multi-resource wait times for different days of the week for the base-case and for scenarios when 1 and 2 extra afternoon IR patients were added to the schedule
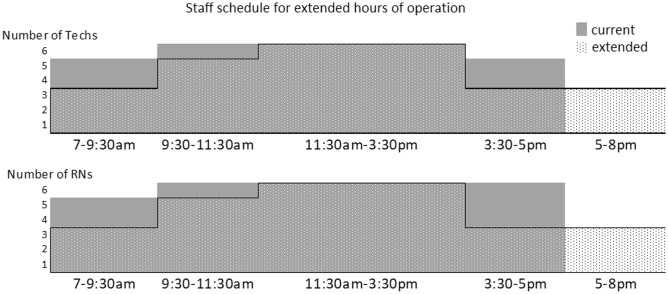
Next, the optimized staff schedule designed to extend hours of operation from 7 a.m.–5:30 p.m. to 7 a.m.–8 p.m., while maintaining same staff numbers (6 RNs and 6 Technologists) was identified and tested. The difference between the original and the proposed schedule is seen in Fig. 8. To allow for better evaluation, the two scenarios were compared within 7 a.m.–5:30 p.m. time window only. The simulations were done for Thursdays. The average patient wait time increased from 7.5 to 23 min with the original and the proposed (extended hours) staff schedules, respectively (Fig. 9). Average utilization for RNs and Technologists stayed the same or increased with the proposed schedule, with peak utilization remaining within the target of 85%. With the proposed staff schedule, the time from check-in to end exam increased by 17% (from mean LOS of 101 min observed with the original schedule to LOS of 118 min for the proposed schedule).
Fig. 8.
Current (solid gray) and proposed-extended hours (dotted) staff schedules with maximum number of 6 technologists and 6 RNs
Fig. 9.
Average patient wait times for current and proposed staff schedules for 7–17:30 h of operation
It was determined that 2 CT and 4 IR patients is the optimal combination of patients that could be added to the schedule during the extended hours of operation. Patient wait time associated with additional 2CT + 4IR patients was 31 min when compared to base-case multi-resource wait time of 23 min. With 2CT + 4IR patients added in the extended hours, mean RN utilization was at 76%, while mean technologist utilization was at 60%, similar to the base-case values of 60% and 48% for mean RN and technologist utilization respectively. LOS for the extended hours was 110 min, similar to the base-case value of 106 min.
Discussion
Workflow improvements have traditionally been tackled via lean or six sigma approaches. Mason et al. systematically reviewed 23 studies covering lean and six sigma methodologies in surgery, which has similar workflow complexities to IR [9]. Three of the six aims identified by the authors were operational in nature (to optimize outpatient efficiency and experience [10], to improve operating theatre efficiency [11], to limit unnecessary cost and LOS [12]) and are relevant for our study. Improvements reported by the majority of the reviewed lean and six sigma studies were tempered by commonly found study design imprecisions and systematic biases [9]. To make conclusions, six sigma and lean studies need to be conducted by design in controlled environments. Unfortunately, only two of the 23 studies reviewed by Mason et al. used controlled cohort design for before and after analysis. Workflow simulations, however, are controlled by design. They allow us to re-design the system in a digital environment, test different scenarios and measure their effectiveness without needing to implement them in real-world. The limitations to workflow simulations arise from (1) accuracy of the assumptions made while building a digital model and (2) the fact that real-world implementation requires controlled experimental studies, which can be challenging to get “buy-in” from clinical collaborators.
Workflow improvement initiatives in IR have also been described in literature ( [7, 8]). None of these approaches, however, have used simulation modeling along with simulation-based optimization, which allows for a more systematic, data-driven approach to workflow optimization. Alternatively, simulation modeling approaches have been used to analyze operational performance in a mammography clinic [4], colonoscopy suit [5], and emergency departments [6] but have not been reported for the IR department setting.
The current study presents the use of workflow modeling, as well as workflow simulation and optimization approaches for operational improvements in the IR setting. The baseline model showed reasonable patient wait times for the majority of patients, while also identifying a subset of patients (13%) experiencing longer wait times (20 + min). This is not an alarming finding in itself; however, as a symptom of a larger problem it could signal limitations for future growth and foreshadow a “stressed” state of affairs. Bottleneck analysis, conducted to understand the sources of the extended patient waiting, showed lack of CT imaging asset/room availability as the primary contributor.
To address CT room demand, the IR department arranged to have 4 h of additional CT room time assigned from outpatient diagnostic imaging. To understand the effects of these scenarios, simulation was used. By only slightly extending base-case wait time of 23 min to 25 and 27 min, allows for 2 or 4 extra CT patients to be added to the morning or the afternoon schedules respectively.
While bottleneck analysis uncovered high CT room demand, it also revealed opportunities for additional IR patients to be added to the schedule. Overall, scenario testing suggested that adding two patients on Mondays and potentially one patient each on Tuesday, Wednesday, Thursday, and Friday should not significantly affect wait times.
Finally, simulation-based optimization was used to identify alternative staff schedules that could accommodate extending hours of operation by 2.5 h. While staff utilization remained within target, the proposed schedule had fewer staff members during the day than the existing schedule. With the existing schedule, procedure rooms served as the main bottleneck; however, with the proposed schedule, bottleneck shifted to RN availability. Without using a simulation model, it would be challenging to identify the dependencies of the interactions and predict the effect of the proposed schedule shifts on staff availability and the patient wait times.
There are a few limitations to this study. The identification of undocumented activities such as changing, patient prep, room cleaning, paperwork, and their respective process times were derived from expert interviews. This human intervention poses a limitation to our approach from scalability point of view and model validation. In addition to this, we assumed staff members are cross-trained across procedures which may not be the case at every facility. Incorporating the capabilities of staff members along with their schedules helps us to test the impact of different schedules for the complex procedures. Finally, we did not conduct a detailed real-world before-and-after comparative analysis as this was outside the scope of this study. However, our partnering hospital provided the following qualitative observations upon implementing the recommendations stated from this paper and how they impacted their real-world KPIs, with the caveat that these improvements would be tough to quantify:
There were essentially two decisions that were supported by the insights coming from the simulation: (1) hiring additional nurse/technologist (which was originally considered before this analysis) would not have removed the bottle neck limiting the rate at which we were able to do CT guided procedures; (2) additional time was re-designated from diagnostic CT imaging to CT guided procedures. So the real world KPI improvements could be:
Saved salary expense (which would have come at little to no incremental revenue)
Decrease in costs associated with add-on CT guided procedures. (The benefit is derived from directing inpatient CT guided procedures to the newly designated diagnostic CT scanner procedural slots. As a result, we experienced overtime savings in the main IR department. Prior to the change, inpatient add-on CT-guided procedural requests commonly resulted in continuation of work into non routine hours of the day, tapping into the on-call team, associated with overtime pay.).
Conclusion
By constructing an accurate simulation model based on EMR data and expert interviews, we were able to perform bottleneck analysis and assess outcomes of multiple scenarios designed to improve throughput and resource utilization, while maintaining reasonable patient experience KPIs. Furthermore, we were able to use simulation-based optimization approach to identify optimized staff schedules, allowing to extend the hours of operation of the department by 2.5 h, while keeping the number of staff members the same.
Acknowledgments
The authors would like to thank Paul McGunigle, Joanie Davis, and the Lahey Hospital (Interventional Radiology) team for the invaluable insights into the workings of the department.
Footnotes
Publisher’s Note
Springer Nature remains neutral with regard to jurisdictional claims in published maps and institutional affiliations.
References
- 1.Bleustein C, Rothschild DB, Valen A, Valatis E, Schweitzer L, Jones R. Wait times, patient satisfaction scores, and the perception of care. Am J Manag Care. 2014;20(5):393–400. [PubMed] [Google Scholar]
- 2.Beker K, Garces-Descovich A, Mangosing J, Hallett ICGD, Mortele KJ. Optimizing MRI Logistics: Prospective Analysis of Performance, Efficiency, and Patient Throughput. AJR. 2017;209(4):836–844. doi: 10.2214/AJR.16.17698. [DOI] [PubMed] [Google Scholar]
- 3.Amir T, Lee B, Woods RW, Mullen LA, Harvey SC. A Pilot of Data-Driven Modeling to Assess Potential for Improved Efficiency in an Academic Breast-Imaging Center. J Digit Imaging. 2019;32:221–227. doi: 10.1007/s10278-018-0159-7. [DOI] [PMC free article] [PubMed] [Google Scholar]
- 4.Coelli FC, Ferreira RB, Almeida RM, Pereira WC. Computer simulation and discrete-event models in the analysis of a mammography clinic patient flow. Comput Methods Programs Biomed. 2007;87(3):201–207. doi: 10.1016/j.cmpb.2007.05.006. [DOI] [PubMed] [Google Scholar]
- 5.Berg B, Denton B, Nelson H, Balasubramanian H, Rahman A, Bailey A, Lindor K. A discrete event simulation model to evaluate operational performance of a colonoscopy suite. Med Decis Making. 2010;30(3):380–387. doi: 10.1177/0272989X09345890. [DOI] [PubMed] [Google Scholar]
- 6.Saghafian S, Austin G, Traub SJ. Operations research/management contributions to emergency department patient flow optimization: Review and research prospects. IIE Trans Healthc Syst Eng. 2015;5(2):101–123. doi: 10.1080/19488300.2015.1017676. [DOI] [Google Scholar]
- 7.Zafar AM, Suri R, Nguyen TK, Petrash CC, Fazal Z. Understanding Preprocedure Patient Flow in IR. J Vasc Interv Radiol. 2016;27(8):1189–1194. doi: 10.1016/j.jvir.2016.05.005. [DOI] [PubMed] [Google Scholar]
- 8.Villarreal MC, Rostad BS, Wright R, Applegate KE. Improving Procedure Start Times and Decreasing Delays in Interventional Radiology: A Department's Quality Improvement Initiative. Acad Radiol. 2015;22(12):1579–1586. doi: 10.1016/j.acra.2015.08.008. [DOI] [PubMed] [Google Scholar]
- 9.Mason SE, Nicolay CR, Darzi A. The use of Lean and Six Sigma methodologies in surgery: A systematic review. The Surgeon. 2015;13(2):91–100. doi: 10.1016/j.surge.2014.08.002. [DOI] [PubMed] [Google Scholar]
- 10.Siddique K, Elsayed SEA, Cheema R, Mirza S, Basu S. One-stop cholecystectomy clinic: An application of lean thinking-can it improve the outcomes? J Perioper Pract. 2012;22(11):360–365. doi: 10.1177/175045891602201103. [DOI] [PubMed] [Google Scholar]
- 11.Schwarz P, Pannes KD, Nathan M, Reimer HJ, Kleespies A, Kuhn N, et al. Lean processes for optimizing OR capacity utilization: prospective analysis before and after implementation of value stream mapping (VSM) Langenbecks Arch Surg. 2011;396(7):1047–1053. doi: 10.1007/s00423-011-0833-4. [DOI] [PubMed] [Google Scholar]
- 12.Niemeijer GC, Flikweert E, Trip A, Does RJ, Ahaus KTB, Boot AF, et al. The usefulness of lean six sigma to the development of a clinical pathway for hip fractures. J Eval Clin Pract. 2013;19:909–914. doi: 10.1111/j.1365-2753.2012.01875.x. [DOI] [PubMed] [Google Scholar]


