

Key Points
Question
Is high-intensity strength training more effective than low-intensity strength training and attention control for the outcomes of knee pain and knee joint compressive forces in participants with knee osteoarthritis?
Findings
In this randomized clinical trial involving 377 participants with knee osteoarthritis, high-intensity strength training, compared with low-intensity strength training and an attention control, did not significantly improve knee pain or knee joint compressive forces at 18 months.
Meaning
These findings do not support the use of high-intensity strength training over low-intensity strength training or attention control in adults with knee osteoarthritis.
Abstract
Importance
Thigh muscle weakness is associated with knee discomfort and osteoarthritis disease progression. Little is known about the efficacy of high-intensity strength training in patients with knee osteoarthritis or whether it may worsen knee symptoms.
Objective
To determine whether high-intensity strength training reduces knee pain and knee joint compressive forces more than low-intensity strength training and more than attention control in patients with knee osteoarthritis.
Design, Setting, and Participants
Assessor-blinded randomized clinical trial conducted at a university research center in North Carolina that included 377 community-dwelling adults (≥50 years) with body mass index (BMI) ranging from 20 to 45 and with knee pain and radiographic knee osteoarthritis. Enrollment occurred between July 2012 and February 2016, and follow-up was completed September 2017.
Interventions
Participants were randomized to high-intensity strength training (n = 127), low-intensity strength training (n = 126), or attention control (n = 124).
Main Outcomes and Measures
Primary outcomes at the 18-month follow-up were Western Ontario McMaster Universities Osteoarthritis Index (WOMAC) knee pain (0 best-20 worst; minimally clinically important difference [MCID, 2]) and knee joint compressive force, defined as the maximal tibiofemoral contact force exerted along the long axis of the tibia during walking (MCID, unknown).
Results
Among 377 randomized participants (mean age, 65 years; 151 women [40%]), 320 (85%) completed the trial. Mean adjusted (sex, baseline BMI, baseline outcome values) WOMAC pain scores at the 18-month follow-up were not statistically significantly different between the high-intensity group and the control group (5.1 vs 4.9; adjusted difference, 0.2; 95% CI, −0.6 to 1.1; P = .61) or between the high-intensity and low-intensity groups (5.1 vs 4.4; adjusted difference, 0.7; 95% CI, −0.1 to 1.6; P = .08). Mean knee joint compressive forces were not statistically significantly different between the high-intensity group and the control group (2453 N vs 2512 N; adjusted difference, −58; 95% CI, −282 to 165 N; P = .61), or between the high-intensity and low-intensity groups (2453 N vs 2475 N; adjusted difference, −21; 95% CI, −235 to 193 N; P = .85). There were 87 nonserious adverse events (high-intensity, 53; low-intensity, 30; control, 4) and 13 serious adverse events unrelated to the study (high-intensity, 5; low-intensity, 3; control, 5).
Conclusions and Relevance
Among patients with knee osteoarthritis, high-intensity strength training compared with low-intensity strength training or an attention control did not significantly reduce knee pain or knee joint compressive forces at 18 months. The findings do not support the use of high-intensity strength training over low-intensity strength training or an attention control in adults with knee osteoarthritis.
Trial Registration
ClinicalTrials.gov Identifier: NCT01489462
This randomized trial compares the effects of high- vs low-intensity strength training vs control on 18-mo knee pain and knee joint compressive force among adults with knee pain and radiographic evidence of osteoarthritis.
Introduction
Osteoarthritis is the most common form of arthritis and a leading cause of disability among adults.1 A report from 2012 estimated that knee osteoarthritis affected more than 250 million people worldwide.2 Clinical guidelines recommend strength training for patients with knee osteoarthritis based on clinical trial evidence of effectiveness.3 Improved strength mediates pain relief,4 enhances psychological well-being,5 maintains cartilage integrity in animal models,6,7 and may increase the shock absorbing capability of lower extremity muscles during walking.8 Limitations of prior randomized trials of strength training for patients with osteoarthritis include the use of training intensities below those recommended by practice guidelines9,10,11,12,13 and use of short-duration interventions, lasting between 6 and 24 weeks.11,12
High-intensity strength training may be detrimental for knee osteoarthritis symptoms due to the greater contact forces exerted on the joint.14 However, a prior study suggested that short-term, high-intensity strength training was safe and well tolerated by older adults with knee osteoarthritis.15 Improving strength gains with intense exercise over the long-term could improve clinical outcomes. The objective of this study was to determine whether high-intensity strength training lowered pain levels and reduced knee joint compressive forces, defined as the maximal tibiofemoral contact force exerted along the long axis of the tibia during walking, compared with low-intensity strength training and attention control.
Methods
Study Design
The Strength Training for Arthritis Trial (START) was an assessor-blinded, single-center (Wake Forest University, Winston-Salem, North Carolina), randomized clinical trial with 3 parallel groups followed up for 18 months. The trial protocol appears in Supplement 1. The Human Subjects Committee of Wake Forest Health Sciences approved this protocol. Participants provided written informed consent.
Participants
The study included ambulatory, community-dwelling adults, 50 years or older with self-reported disability due to knee osteoarthritis (Figure 1). Enrollment occurred between July 2012 and February 2016. Inclusion criteria were (1) mild to moderate radiographic medial tibiofemoral osteoarthritis (Kellgren-Lawrence score, 2 or 3) in at least 1 knee associated with radiographic skyline views demonstrating patellofemoral osteoarthritis (none to moderate severity); (2) neutral (−2° valgus to 2° varus), or varus (≤10° varus) mechanically aligned knee16; (3) body mass index (BMI, calculated as weight in kilograms divided by height in meters squared) ranging from 20 to 45; (4) and no participation in formal strength training more than 30 minutes a week in the past 6 months. All participants continued their medications, including nonsteroidal anti-inflammatory drugs (NSAIDs). If pain decreased, they could reduce them with their physician’s approval.
Figure 1. Participant Flow Through the Study of the Effect of High-intensity Strength Training on Knee Pain and Knee Joint Compressive Forces.
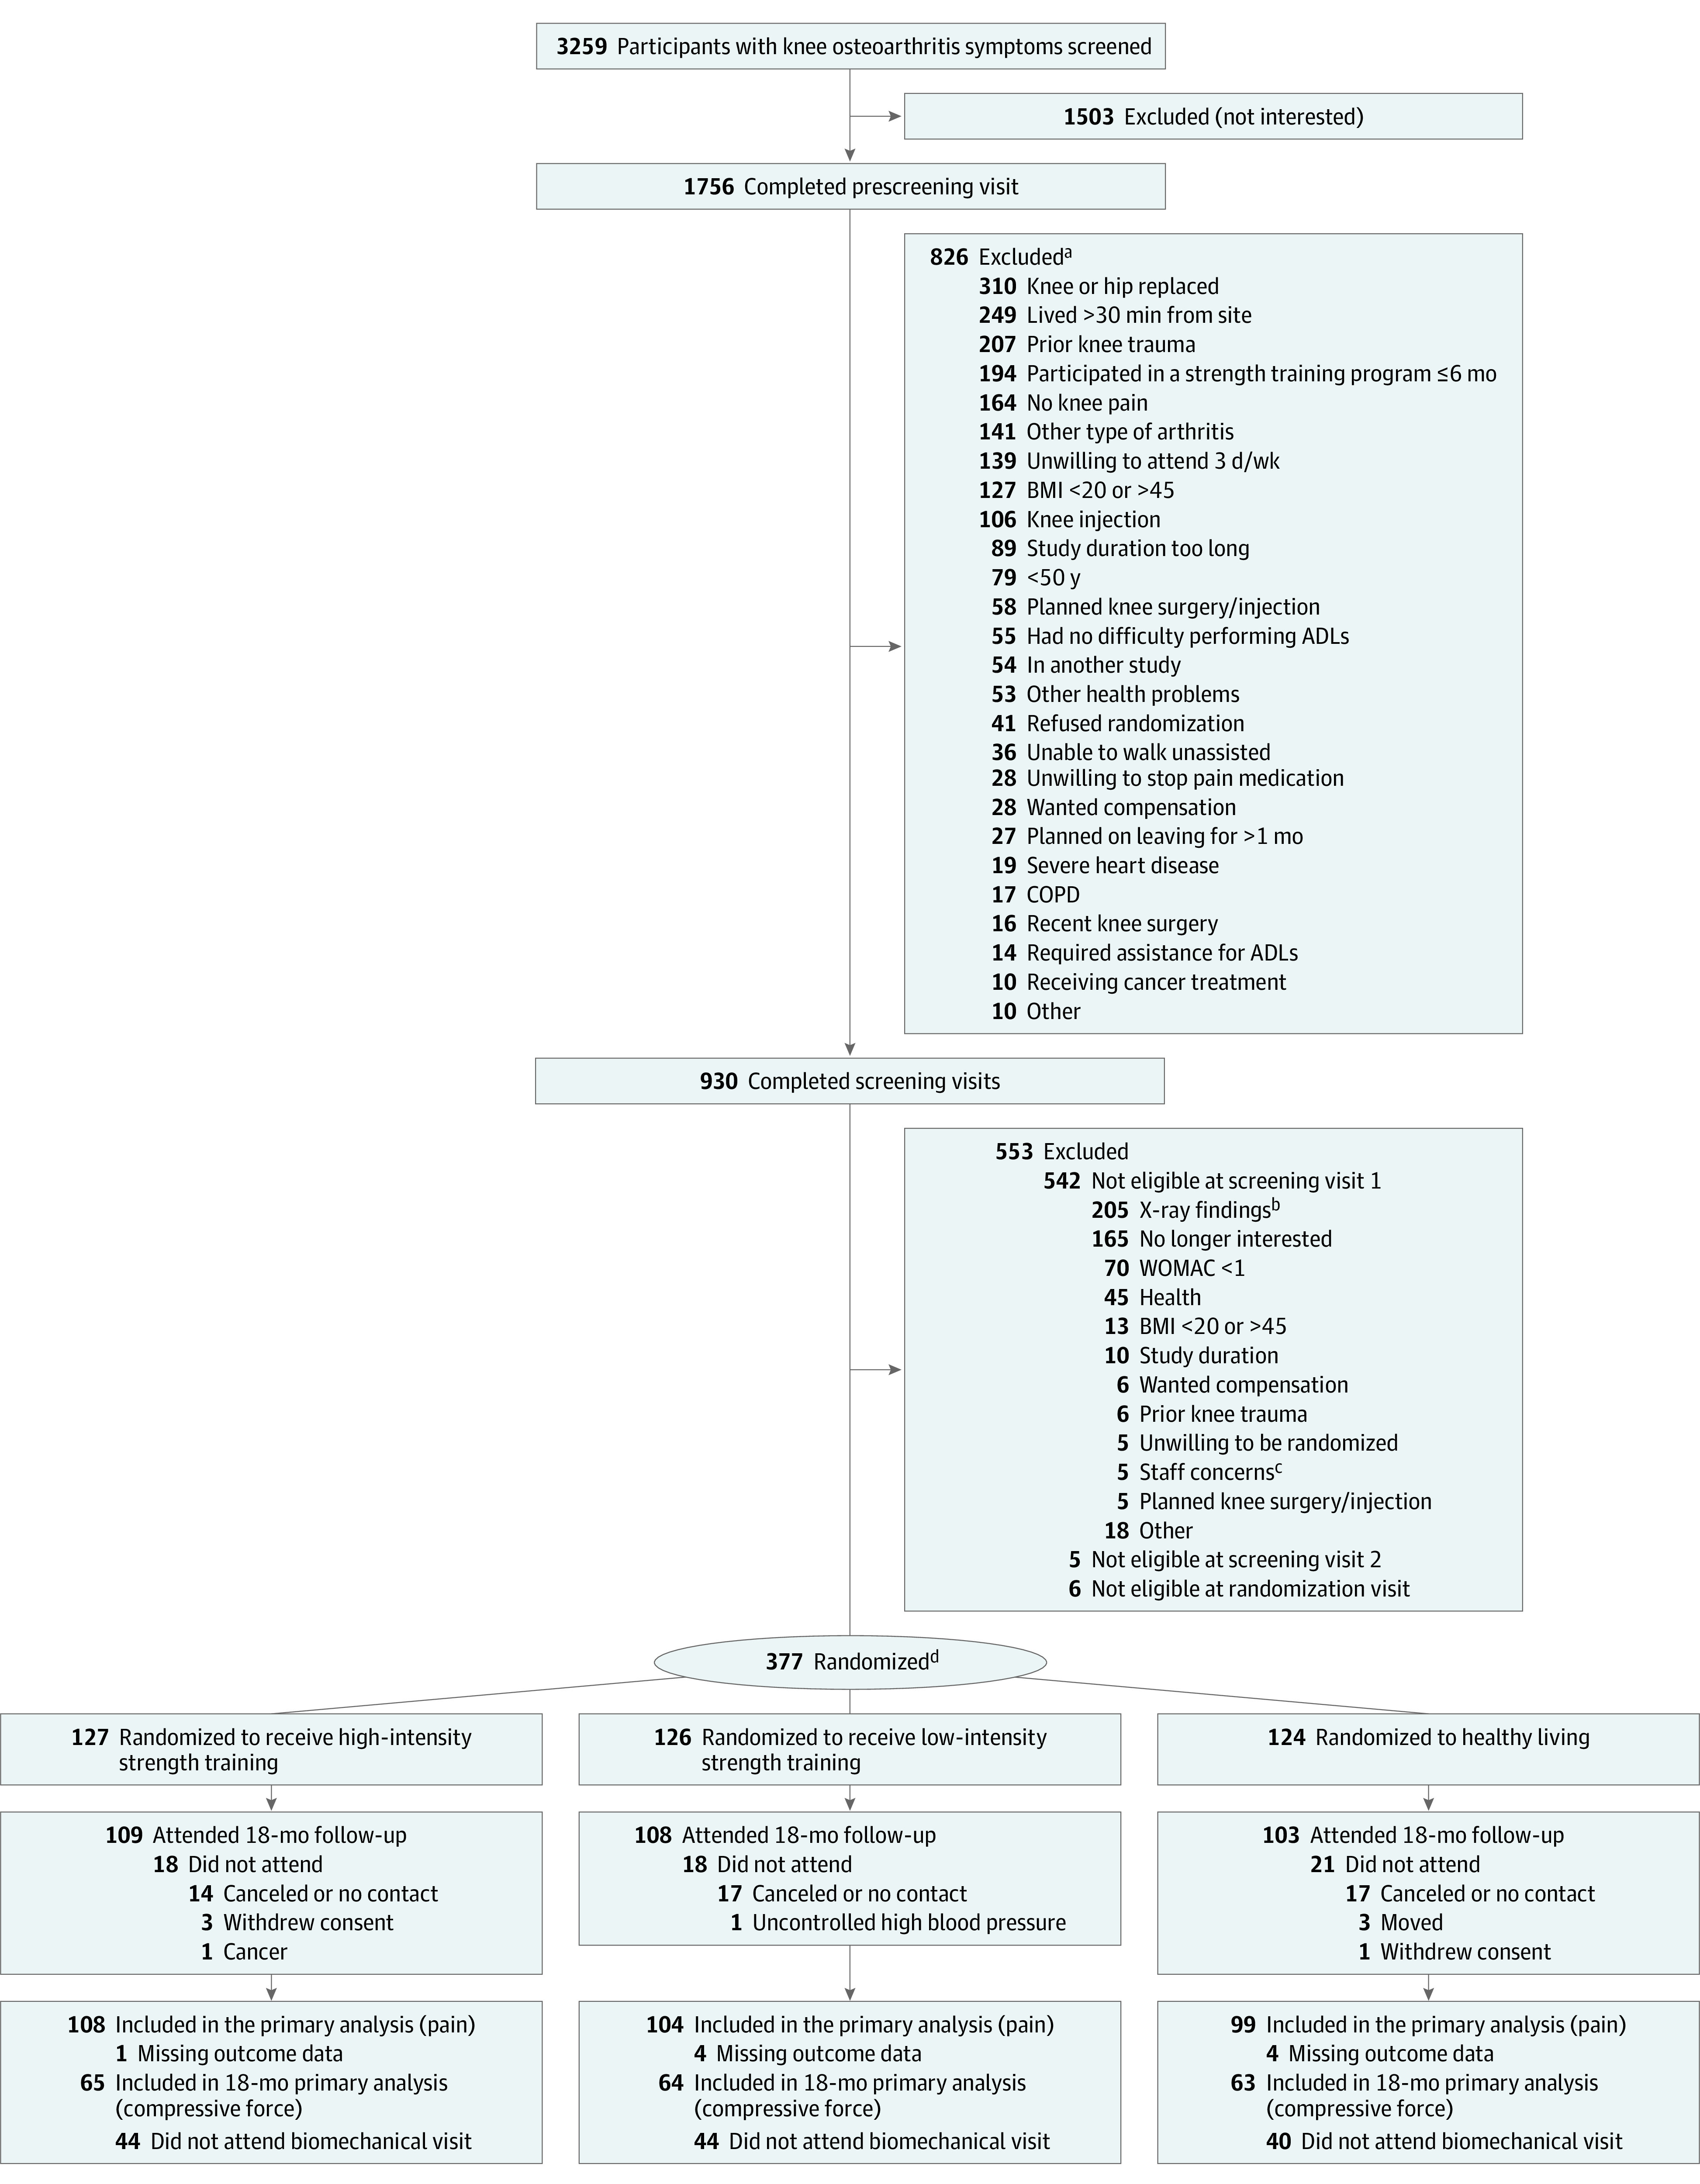
aParticipant may have been ineligible for more than 1 reason.
bPersons excluded due to x-ray for multiple reasons.
cStaff considered participation a danger to themselves or others.
dA stratified block randomization method, stratified by body mass index (BMI) and sex, was used to assign all eligible persons to 1 of 3 intervention groups.
Exclusion criteria included (1) severe patellofemoral osteoarthritis (joint space width, 3 using the Osteoarthritis Research Society International atlas from skyline x-ray views17) (2) lateral more than medial tibiofemoral osteoarthritis; (3) or less than 20 on the Montreal Cognitive Assessment.18
Participants were randomly assigned to treatment groups via a computer-generated permuted block randomization scheme with randomly selected sized blocks of 3, 6, 9, or 12 stratified by sex and baseline BMI (calculated as weight in kilograms divided by height in meters squared). Participants were not aware of the hypotheses tested.
Interventions
Strength Training
Strength training sessions were conducted in groups of participants 3 times weekly over 18 months. Sessions consisted of a 5-minute warm-up, 40-minute training, and 15-minute cooldown conducted 3 times a week at the Wake Forest Clinical Research Center and supervised by staff interventionists. After the first 4 sessions during which participants were taught proper techniques, the maximum amount a participant was capable of lifting in a single repetition was measured (1 repetition maximum [1RM] tests) to determine their starting resistance. The program included 6 lower body exercises, with each leg exercised separately to prevent unequal load distribution between limbs: hip abduction and adduction; leg curl, leg extension, and leg press; and seated calf; and 4 upper body and core exercises: compound row, vertical chest, lower back, and abdomen.
The high-intensity group performed 3 sets of each exercise beginning at 75% of 1RM with 8 repetitions per set for 2 weeks, progressing to 80% of the 1RM with 8 repetitions per set for weeks 3 and 4, 85% of the 1RM with 6 repetitions per set for weeks 5 and 6, and 90% of the 1RM with 4 repetitions per set for weeks 7 and 8. Week 9 was a taper week with alternate exercises and establishing new 1RMs for each exercise. This 9-week block was repeated using the new 1RM values. The low-intensity group used the same 9-week block pattern but performed 3 sets of 15 repetitions at 30% to 40% 1RM of the exercises described above. The target workload per total volume performed during these 9-week cycles was the same regardless of whether the participant was assigned to the high-intensity or low-intensity group.19 To improve adherence and retention, interventionists were trained in standardized behavioral techniques developed in a social cognitive framework.20
Attention Control Group
Participants attended 60-minute group workshops biweekly for the first 6 months and monthly thereafter (total of 24 sessions over 18 months). Details of the control intervention are included in Supplement 1 and the design publication.19
Measurements and Procedures
Primary Outcomes
The 2 primary outcomes at the 18-month (long-term) follow-up were self-reported knee pain using the Likert version of the Western Ontario and McMaster Universities Osteoarthritis Index (WOMAC)21 and maximum knee joint compressive force during walking (minimally clinically important difference [MCID] unknown).
Excessive knee joint compressive forces are an important mechanism in the osteoarthritis disease pathway and are associated with poor clinical and structural outcomes.22,23 The WOMAC knee pain score assesses knee pain over the last 48 hours.24 The total score ranges from 0 to 20 (higher scores indicate greater pain). The MCID in WOMAC pain between groups is 2 on a 20-point Likert scale.25 The pain categories on a 0 to 20 scale are 2 to 8, mild; more than 8 to 14, moderate; more than 14 to 20, severe (transformed from 0-10 scale reported by Kapstad et al26).
Secondary Outcomes
The 2 primary outcomes were also included as prespecified secondary outcomes at the 6-month (short-term) follow-up time point. Prespecified secondary outcomes measured at the 6-month and 18-month follow-up were WOMAC physical function, which assesses the degree of difficulty with activities of daily living in the last 48 hours with the total score range of 0 to 68; higher scores indicate poorer function with a score of 21 or higher indicating physical work limitations27 and the 6-minute walk distance, referred to as a clinical measure of mobility in the study protocol, assessed the maximum distance a participant could walk along a standardized walkway in 6 minutes (MCID, 26-55 m).28
Prespecified secondary outcomes included at 18 months only were disease progression assessed as change in medial tibiofemoral joint space width from bilateral posteroanterior weight-bearing fixed-flexion knee x-rays using a positioning device (SynaFlexer, BioClinica Inc) and modified Lyon-Schuss technique,29 and thigh skeletal muscle volume and thigh fat volume (sum of subcutaneous and intermuscular fat depots) determined using volumetric noncontrast enhanced computed tomography (CT) (VCT 64, GE Healthcare). IL-6 serum levels, knee extensor strength, and hip abductor strength were secondary outcomes for which testing time points were not specified in the protocol. Plasma IL-6 was measured with morning venipuncture samples (50 mL per visit) at least 2 hours after rising and after a 10-hour overnight fast. The IL-6 measure was performed in duplicate using an IL-6 enzyme-linked immunosorbent assay (Quantikine ELISA kits, R&D Systems). The mean value was used in data analysis. Knee extensor strength (termed quadriceps strength in the protocol) and hip abductor strength were measured using a Humac NORM isokinetic dynamometer at 30° per second (Computer Sports Medicine Inc). Prespecified secondary outcomes not included in this report were knee adductor moment; knee anteroposterior shear force; tumor necrosis factor, soluble tumor necrosis factor receptor 1, leptin, serum N-propeptide of collagen IIA, cartilage oligomeric matrix protein, and urinary type II collagen telopeptide levels; and muscle power.
Post Hoc Outcomes
Post hoc outcomes at 6 and 18 months were knee flexor strength and pain medication use (NSAIDS, analgesics, selective serotonin releasing agents, anticonvulsants, and opioids).30 A responder analysis used the Outcome Measures in Rheumatology Clinical Trials and the Osteoarthritis Research Society International (OMERACT-OARSI) criteria31 for minimally clinically important improvement of 20% or more for pain and function at 18 months.
Sample Size and Power Calculations
Trial stratification factors, baseline BMI, and sex were included in all statistical models. A total sample of 372 provided 80% statistical power, assuming 80% retention to detect between-group differences of 1.1 or more (17.6%) in WOMAC pain (20 point scale) and 316 N or more (9.6%) in knee joint compressive force assuming a 2-sided test at a .05/6 = .0083 significance level (3 pairwise comparisons for 2 coprimary outcomes). These values were based on our previous trial32 and pilot study that showed mean differences between strength training and control groups of 1.12 (18%) for pain, and 657 N (20%) for knee joint compressive force. Power was determined based on absolute effects; the relative effects (%) were listed in the protocol for clarity.
Statistical Analyses
Participants were analyzed according to their assigned randomization group even if they were nonadherent to their assigned intervention. Primary analyses were conducted using complete-case data. Prespecified sensitivity analyses were conducted for all participants using multiple imputation methods for missing observations based on baseline and, when available, follow-up data assuming missing data are missing at random.
The primary aim was to determine if high-intensity strength training lowered pain levels and reduced knee joint compressive forces compared with low-intensity strength training and attention control at the 18-month follow-up. These and all other repeated measure continuous outcomes were assessed for significant treatment effects using a repeated measures analysis of covariance (ANCOVA) model using complete case outcome data at 6 and 18 months, adjusted for sex, baseline BMI, and baseline outcome values. The analytic plan focused primarily on pairwise comparisons between treatment groups at 18 months. Pairwise group differences between the primary outcomes of pain and knee joint compressive forces were deemed significant using a Bonferroni-adjusted .0083 2-sided level of significance, accounting for 3 group pairwise comparisons across 2 outcomes.
An adjusted significance level of .05 was used for pairwise comparison of secondary and post hoc outcomes. Short-term effects were determined by using 6-month treatment effect estimates from the primary and secondary outcome models. Outcomes assessed at baseline and 18 months only (joint space width and thigh muscle and fat volume) were compared using an ANCOVA model for treatment effects adjusted for sex, baseline BMI, and baseline outcome values. The study power was calculated for the coprimary outcomes. Given the large number of secondary outcomes and lack of adjustment for multiple comparisons, the secondary outcomes should be interpreted as exploratory.
Post Hoc Analyses
Knee flexion strength pairwise comparisons were performed using repeated measures ANCOVA at 6 and 18 months adjusted for sex, baseline BMI, and baseline outcome values. Longitudinal pain medication use was estimated for each group using a repeated-measures negative binomial regression model fit with treatment group, visit, and their interaction assuming an unstructured covariance, and visit-specific estimates were generated using contrast statements. Sensitivity analyses determined whether results were biased due to missing data via multiple imputation methods. Analyses were conducted on the 2 primary outcomes using the methods described above with additional adjustment for knee varus and valgus frontal plane alignment and patellofemoral osteoarthritis severity. Unadjusted pairwise comparisons used complete case changes from baseline at 6 or 18 months using analysis of variance at the same thresholds as the adjusted models. All statistical analyses were performed using SAS version 9.4 (SAS Institute Inc).
Results
Study Cohort
Table 1 shows the characteristics of randomized participants by group. Among 377 participants randomized (mean age, 65 years; 40% women), 320 (85%) attended the 18-month visit (high-intensity, 109; low-intensity, 108; control, 103) (Figure 1). At 18 months, 311 contributed data for the primary outcome of pain and 192 contributed data for the primary outcome of knee joint compressive force (Table 2). The difference in the number of completers for the 2 primary outcomes was due to missing baseline or follow-up biomechanical gait analyses or both. For the 6-month visit, 310 participants contributed data for the pain outcome, and 196 contributed data for the knee joint compressive force outcome. Noncompleters (no 18-month follow-up data) were comparable with completers, with the exception of age, which was a mean of 65.3 years (SD, 7.7 years) for the completers vs for 63.0 years (SD, 9.6 years) for the noncompleters (P = .04) (eTable 1 in Supplement 2).
Table 1. Demographic and Clinical Characteristics of the Study Participants at Baseline.
| Baseline characteristics | No. (%) | ||
|---|---|---|---|
| Intensity | Control | ||
| High | Low | ||
| No. | 127 | 126 | 124 |
| Age, mean (SD), y | 67 (9) | 64 (8) | 64 (7) |
| Weight, mean (SD), kg | 89 (19) | 89 (18) | 89 (16) |
| Height, mean (SD), m | 1.68 (0.11) | 1.69 (0.10) | 1.68 (0.10) |
| BMI, mean (SD) | 31 (6) | 31 (6) | 32 (5) |
| Sex | |||
| Women | 52 (41) | 51 (41) | 48 (39) |
| Men | 75 (59) | 75 (59) | 76 (61) |
| Racea | |||
| White | 103 (81) | 99 (79) | 94 (76) |
| Black | 20 (16) | 24 (19) | 26 (21) |
| Asian | 2 (2) | 0 | 1 (1) |
| More than 1 race | 2 (2) | 3 (2) | 3 (2) |
| Ethnicity, No./total (%)a,b | |||
| Hispanic | 3/118 (3) | 2/120 (2) | 1/123 (1) |
| Annual household income, $b | |||
| No. | 123 | 124 | 121 |
| <20 000 | 10 (8) | 9 (7) | 7(6) |
| 20 000-34 999 | 14 (11) | 13 (10) | 10(8) |
| 35 000-49 999 | 17 (14) | 23 (19) | 17 (14) |
| 50 000-74 999 | 32 (26) | 23 (19) | 34 (28) |
| 75 000-99 999 | 23 (19) | 25 (20) | 19 (16) |
| ≥100 000 | 27 (22) | 31 (25) | 34 (28) |
| Educationb | |||
| No. | 124 | 124 | 122 |
| <High school | 0 | 2 (2) | 1 (1) |
| High school | 9 (7) | 17 (14) | 5 (4) |
| Vocational school | 11 (9) | 10 (8) | 9 (7) |
| Some college/community college | 34 (27) | 26 (21) | 33 (27) |
| College | 28 (23) | 34 (27) | 32 (26) |
| Post college | 13 (10) | 11 (9) | 8 (7) |
| Graduate degree | 29 (23) | 24 (19) | 34 (28) |
| Comorbid illness, No.c | 127 | 126 | 124 |
| Patellofemoral OA, severity, 1, 2 (mild-moderate)d | 108 (85.7) | 106 (84.1) | 109 (87.9) |
| Hypertension | 71 (56) | 64 (51) | 61 (49) |
| Obesity (BMI ≥30)e | 68 (54) | 66 (52) | 68 (55) |
| Arthritis in other joints | 30 (24) | 26 (21) | 18 (15) |
| Cardiovascular disease | 17 (13) | 8 (6) | 14 (11) |
| Type 2 diabetes | 12 (9) | 14 (11) | 14 (11) |
| Kellgren-Lawrence grade (most affected)f | |||
| 2 | 63 (50) | 64 (51) | 57 (46) |
| 3 | 50 (39) | 48 (38) | 57 (46) |
| 4 | 14 (11) | 14 (11) | 10 (8) |
| WOMAC, mean (SD)g | |||
| Pain (range 0-20) | 7.0 (2.7) | 7.4 (2.6) | 7.2 (2.7) |
| Function (range 0-68) | 25.5 (10.3) | 26.6 (10.7) | 25.0 (10.3) |
Abbreviations: BMI, body mass index, calculated as weight in kilograms divided by height in meters squared; JSW, joint space width; OA, osteoarthritis; OARSI, Osteoarthritis Research Society International; WOMAC, Western Ontario and McMaster Universities Osteoarthritic Index.
Reported on a self-administered demographics questionnaire.
Some variables had a small amount of missing data due to refusing to answer the question.
Reported on a self-administered health history questionnaire (with the exception of patellofemoral OA) as conditions diagnosed by a health care professional. With comorbid illnesses that could exclude patients from participation, final approval or denial for participation provided after patient evaluation by study physician.
Patellofemoral OA measured from skyline view radiograph using the OARSI scale (0, none; 1, mild; 2, moderate; 3, severe).17 Patients with severe (JSW, 3) patellofemoral OA were excluded. One patient was missing baseline skyline view radiographs.
Measured during screening visit.
The Kellgren-Lawrence scale ranges from 0 to 4. A grade of 2 or greater indicates definite osteoarthritis on posteroanterior weight-bearing radiograph. A grade of 2 indicates definite osteophytes and possible joint space narrowing; grade 3, multiple osteophytes, definite joint space narrowing, sclerosis, and possible bony deformity; and grade 4, large osteophytes, marked definite joint space narrowing, severe sclerosis, and definite bony deformity.
The WOMAC index consists of a self-administered questionnaire including 5 questions on pain, and 17 questions on physical function (scale for each question range, 0 no symptoms to 4 extreme symptoms). Composite scores for pain ranged from 0 to 20 and for function 0 to 68. Pain cut points are on a 0 to 20 scale: 2 to 8, mild; more than 8 to 14, moderate; more than 14 to 20, severe (transformed from 0-10 scale reported in26). A function score 21 or higher indicates physical work limitations.27
Table 2. Primary Outcomes at 18-Month Follow-up in a Study of the Effect of High-Intensity Strength Training on Knee Pain and Knee Joint Compressive Forces Among Patients With Knee Osteoarthritis.
| Outcome | Intensity | Control | Mean difference (95% CI) | P valuea | |
|---|---|---|---|---|---|
| High | Low | ||||
| Primary outcomes | |||||
| WOMAC pain (0-20) | |||||
| Baseline mean (SD) | 7.0 (2.7) | 7.4 (2.6) | 7.2 (2.7) | ||
| 18-mo follow-up, unadjusted mean (SD) | 4.9 (3.2) | 4.5 (3.4) | 4.8 (2.9) | ||
| 18-mo absolute change (95% CI) | −2.0 (−2.6 to −1.4) | −2.8 (−3.5 to −2.2) | −2.3 (−2.9 to −1.6) | ||
| No. | 108 | 104 | 99 | ||
| High intensity vs controlb | 0.3 (−0.6 to 1.2) | .56 | |||
| High intensity vs low intensity | 0.8 (−0.1 to 1.7) | .07 | |||
| Low intensity vs control | −0.6 (−1.5 to 0.3) | .22 | |||
| 18-mo adjusted means (95% CI)c | 5.1 (4.5 to 5.7)d | 4.4 (3.8 to 4.9) | 4.9 (4.3 to 5.5) | ||
| No. | 91 | 86 | 84 | ||
| High intensity vs control | 0.2 (−0.6 to 1.1) | .61 | |||
| High intensity vs low intensity | 0.7 (−0.1 to 1.6) | .08 | |||
| Low intensity vs control | −0.5 (−1.4 to 0.3) | .22 | |||
| Knee joint compressive force, Ne | |||||
| Baseline, mean (SD) | 2326 (727) | 2325 (782) | 2261 (691) | ||
| 18-mo follow-up, unadjusted mean (SD) | 2448 (783) | 2498 (813) | 2456 (844) | ||
| 18-mo absolute change (95% CI) | 89 (−59 to 237)f | 116 (−6.2 to 238) | 162 (10 to 314) | ||
| No. | 65 | 64 | 63 | ||
| High intensity vs controlb | −73 (−271 to 124) | .47 | |||
| High intensity vs low intensity | −27 (−223 to 170) | .79 | |||
| Low intensity vs control | −46 (−245 to 152) | .65 | |||
| 18-mo, adjusted means (95% CI) | 2453 (2296 to 2611) | 2475 (2325 to 2625) | 2512 (2352 to 2672) | ||
| No. | 50 | 55 | 48 | ||
| High intensity vs control | −58 (−282 to 165) | .61 | |||
| High intensity vs low intensity | −21 (−235 to 193) | .85 | |||
| Low intensity vs control | −37 (−256 to 181) | .74 | |||
Abbreviation: WOMAC, Western Ontario and McMaster Universities Osteoarthritic Index.
Pairwise comparisons were deemed significant at P ≤ .05/6 = .0083 from the adjusted model.
Unadjusted pairwise comparisons based on 18-month changes.
The model-adjusted outcomes used only participants with complete follow-up data. Sensitivity analyses were conducted to multiply imputed data for participants with missing data under the assumption that data were missing at random (eTable 2 in Supplement 2).
The difference in the number of completers between the unadjusted and adjusted analyses was due to the model-adjusted outcomes using only participants with complete follow-up data.
One pound of force is equal to 4.45 N of force.
The difference in the number of completers in the unadjusted analysis for the 2 primary outcomes was due to missing baseline and/or a follow-up biomechanical gait analysis.
During the first 6 months, patients in the high-intensity group had an adherence rate of 78% vs 77% in the low-intensity group. The overall adherence rates were 66% in the high-intensity group vs 69% in the low-intensity group. Adherence rates for the control group were 83% at 6 months and 80% overall.
Primary Outcomes
There was no statistically significant difference between groups in the mean WOMAC pain at the 18-month (long-term) follow-up, 5.1 in the high-intensity group vs 4.9 in the control group (adjusted difference, 0.2; 95% CI, −0.6 to 1.1; P = .61) and 4.4 in the low-intensity group (adjusted difference, 0.7; 95% CI, −0.1 to 1.6; P = .08). Mean maximum knee joint compressive force was not statistically significantly different between the high-intensity and the 2 other groups: high-intensity vs control, 2453 N vs 2512 N (adjusted difference, −58; 95% CI, −282 to 165 N; P = .61) and high-intensity vs low-intensity, 2453 N vs 2475 N (adjusted difference, −21 N; 95% CI, −235 to 193; P = .85) (Figure 2 and Table 2).
Figure 2. Unadjusted Pain Score and Knee Joint Compressive Force Across the 18-Month Study .
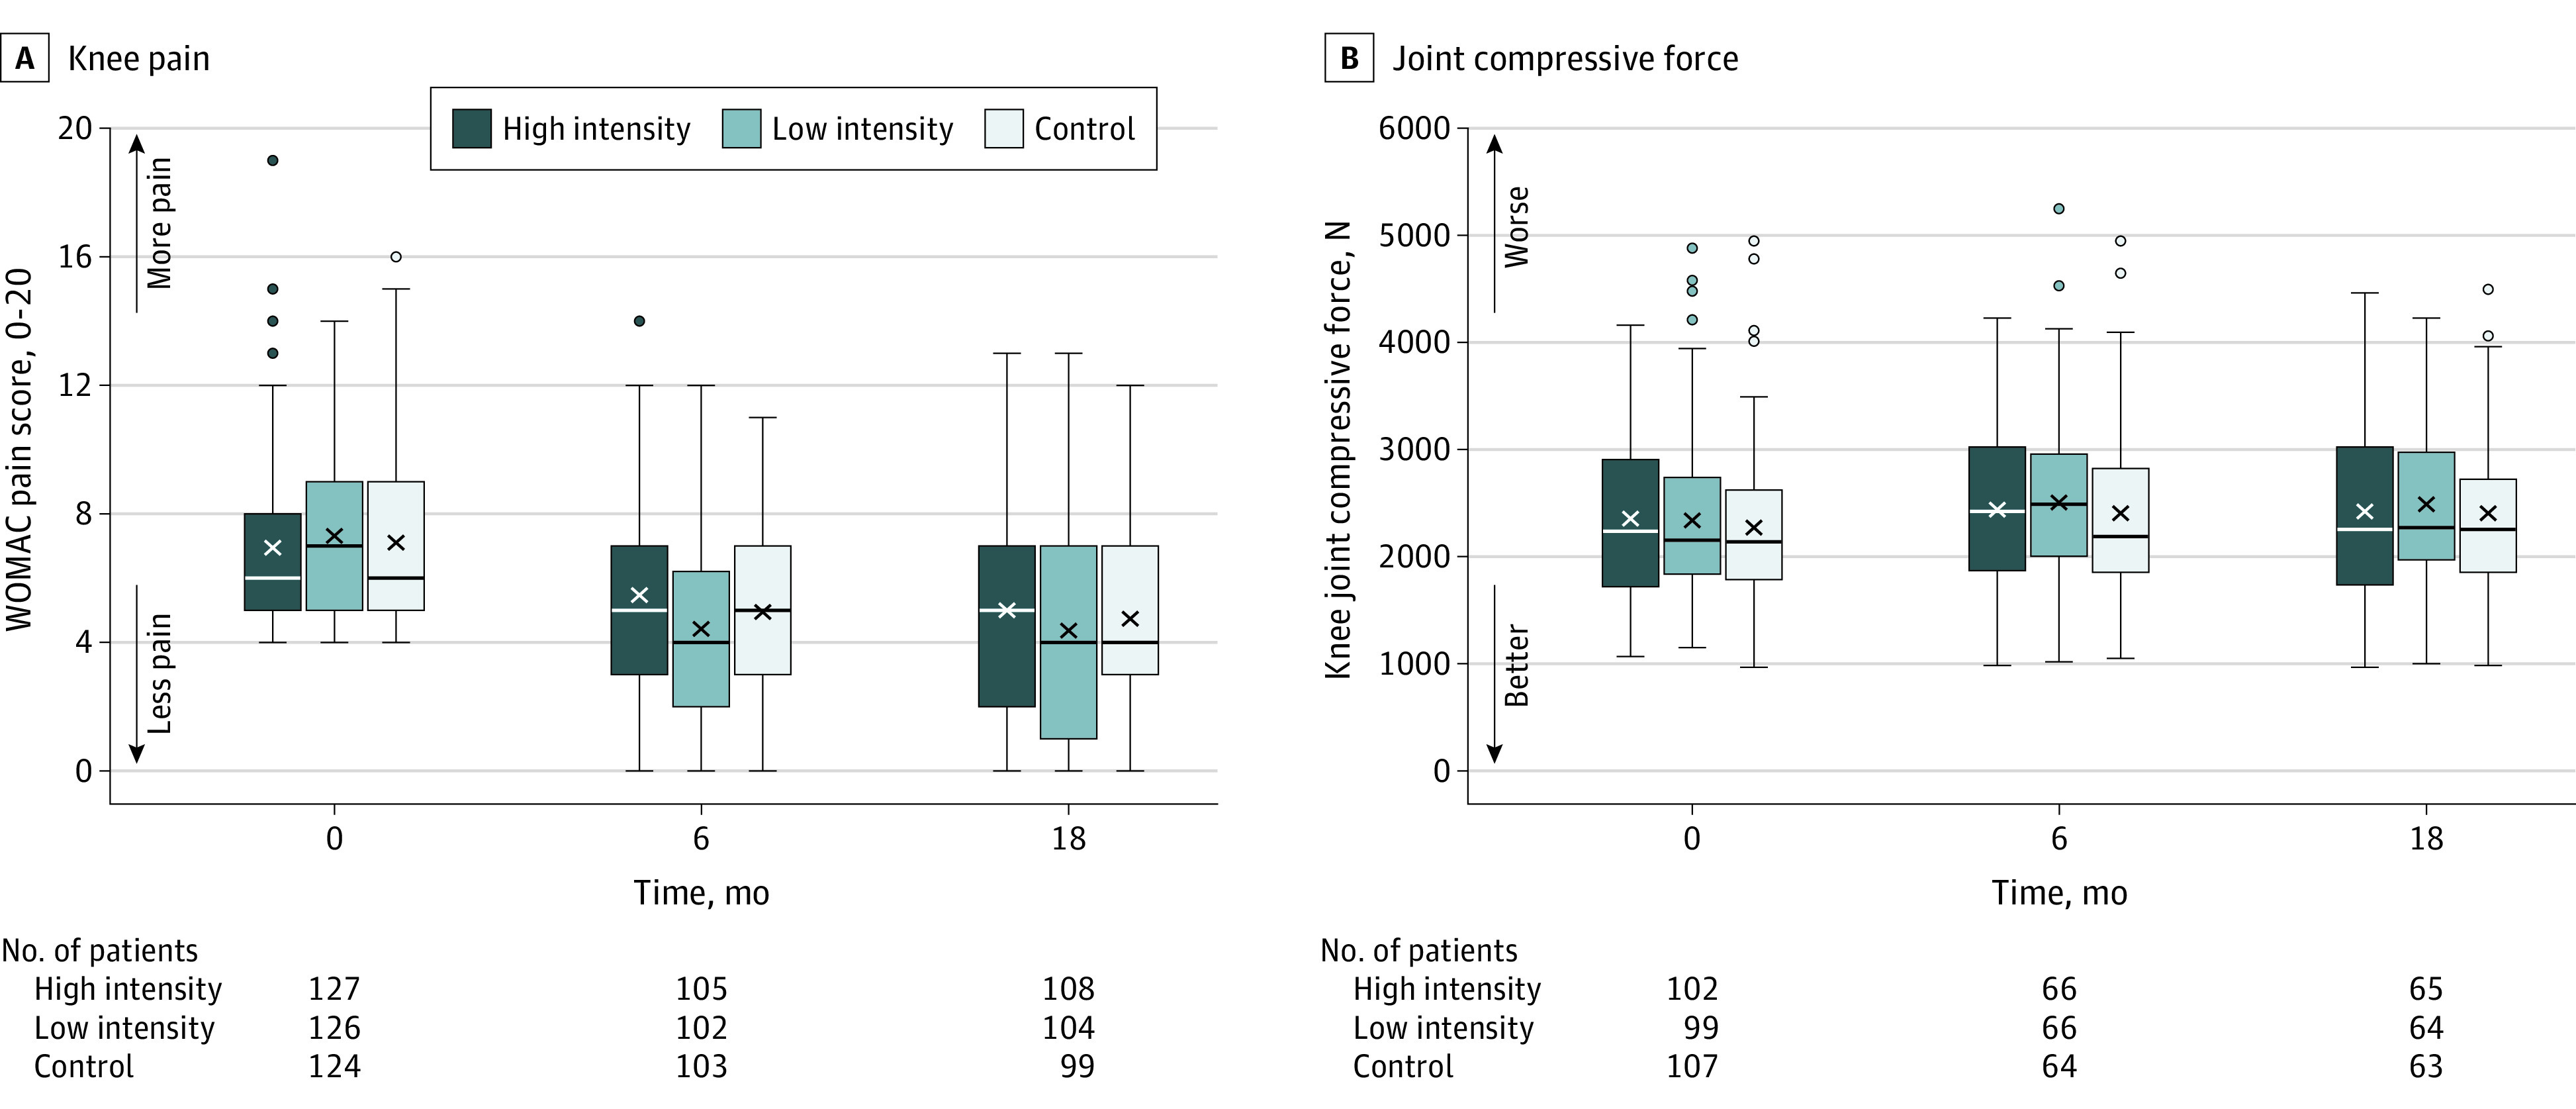
The middle line in the plot boxes represents the median values; the X, the mean values; and the boxes, the interquartile range. The whiskers extend to the most extreme observed values within 1.5 × the interquartile range of the nearer quartile, and the dots represent observed values outside the range. WOMAC indicates Western Ontario and McMaster Universities Osteoarthritic Index.
B, A knee compressive force of 872 N was equivalent to mean body weight. One pound (0.45 kg) of force is equivalent to 4.45 N of force.
Secondary Outcomes
Similar results for the 2 primary outcomes were found without adjustment (Table 2), using multiple imputation, and in post hoc analysis adjusting for knee varus and valgus frontal plane alignment and patellofemoral osteoarthritis severity (eTables 2 and 3 in Supplement 2).
At the 6-month (short-term) follow-up, the low-intensity group had statistically significantly lower WOMAC knee pain (5.6 vs 4.4; adjusted difference, 1.2; 95% CI, 0.5 to 1.9; P = .001) and better WOMAC function (20.8 vs 16.1; adjusted difference, 4.8; 95% CI, 2.4 to 7.2; P < .001) than did the high-intensity group. The knee joint compressive forces were not statistically significantly different at 6 months among groups. The high-intensity group had a mean of 2453 N compared with 2483 N in the control group (adjusted difference, −30 N; 95% CI, −231 to 172; P = .77) and compared with 2536 N in the low-intensity group (adjusted difference, −83 N; 95% CI, −276 to 110; P = .40).
The mean 6-minute walk distance at 6 months was not statistically significantly different between the high-intensity group (493 m) and the control group (508 m; adjusted difference, −14 m; 95% CI, −32 to 3.7; P = .12). But the mean distance walked in the high intensity group was significantly less than in the low-intensity group (mean, 514; m in the low-intensity group (adjusted difference, −21 m; 95% CI, −38 to −3.6; P = .02) (eTable 4 in Supplement 2).
At the 18-month follow-up, comparisons of the mean WOMAC function scores were as follows: high-intensity vs control, 17.8 vs 16.4 (adjusted difference, 1.4; 95% CI, −1.3 to 4.1; P = .32); high-intensity vs low-intensity, 17.8 vs 14.9, adjusted difference, 2.9; 95% CI, 0.2 to 5.6; P = .03) (Table 3 and eFigure 1 in Supplement 2). Changes in the 6-minute walk distance were not statistically significantly different among the groups at 18 months. The mean distance for the high-intensity group was 508 m vs 515 m in the control group (adjusted difference, −6 m; 95% CI, −31 to 18; P = .62) and 514 m in the low-intensity group (adjusted difference, −5 m; 95% CI, −29 to 18; P = .67) (Table 3 and eFigure 1 in Supplement 2).
Table 3. Baseline and Adjusted Secondary and Post Hoc Outcomes at the 18-Month Follow-up in a Study of the Effect of High-Intensity Strength Training on Knee Pain and Knee Joint Compressive Forces Among Patients With Knee Osteoarthritisa.
| Outcomes | Intensity | Control | Mean difference (95% CI) | P valuea | |
|---|---|---|---|---|---|
| High | Low | ||||
| Prespecified secondary outcomes | |||||
| WOMAC function (0-68) | |||||
| Baseline, mean (SD) | 25.5 (10.3) | 26.6 (10.7) | 25.0 (10.3) | ||
| 18 mo, adjusted means (95% CI)b | 17.8 (15.9 to 19.7) | 14.9 (13.0 to 16.8) | 16.4 (14.4 to 18.4) | ||
| No. | 88 | 89 | 88 | ||
| High intensity vs control | 1.4 (−1.3 to 4.1) | .32 | |||
| High intensity vs low intensity | 2.9 (0.2 to 5.6) | .03 | |||
| Low intensity vs control | −1.5 (−4.3 to 1.2) | .27 | |||
| 6-Minute walk distance, m | |||||
| Baseline, mean (SD) | 466 (91) | 479 (90) | 490 (92) | ||
| 18 mo, adjusted means (95% CI) | 508 (492 to 525) | 514 (497 to 530) | 515 (497 to 532) | ||
| No. | 73 | 75 | 67 | ||
| High intensity vs control | −6 (−31 to 18) | .62 | |||
| High intensity vs low intensity | −5 (−29 to 18) | .67 | |||
| Low intensity vs control | −1 (−25 to 23) | .94 | |||
| Knee extensor strength, Nm | |||||
| Baseline, mean (SD) | 72.6 (31.2) | 75.1 (30.2) | 75.9 (32.8) | ||
| 18 mo, adjusted means (95% CI) | 98.5 (94.2 to 102.8) | 93.2 (88.9 to 97.6) | 88.5 (84.0 to 93.0) | ||
| No. | 79 | 78 | 75 | ||
| High intensity vs control | 10.0 (3.8 to 16.2) | .002 | |||
| High intensity vs low intensity | 5.3 (−0.8 to 11.4) | .09 | |||
| Low intensity vs control | 4.7 (−1.5 to 10.9) | .13 | |||
| Hip abductor strength, Nm | |||||
| Baseline, mean (SD) | 62.8 (22.7) | 66.9 (25.4) | 64.7 (22.6) | ||
| 18-mo, adjusted means (95% CI) | 74.6 (71.5 to 77.6) | 74.6 (71.6 to 77.6) | 69.5 (66.5 to 72.6) | ||
| No. | 74 | 77 | 73 | ||
| High intensity vs control | 5.0 (0.7 to 9.3) | .02 | |||
| High intensity vs low intensity | −0.0 (−4.3 to 4.2) | .99 | |||
| Low intensity vs control | 5.0 (0.8 to 9.3) | .02 | |||
| Thigh muscle volume, cm3 | |||||
| Baseline mean (SD) | 662 (183) | 685 (188) | 661 (171) | ||
| 18 mo, adjusted means (95% CI) | 672 (657 to 687) | 679 (664 to 694) | 670 (655 to 685) | ||
| No. | 73 | 76 | 75 | ||
| High intensity vs control | 2 (−20 to 23) | .89 | |||
| High intensity vs low intensity | −8 (−29 to 13) | .48 | |||
| Low intensity vs control | 9 (−12 to 30) | .39 | |||
| Thigh fat volume, cm3 | |||||
| Baseline, mean (SD) | 736 (367) | 712 (351) | 750 (342) | ||
| 18 mo, adjusted means (95% CI) | 712 (683 to 740) | 721 (693 to 749) | 709 (681 to 737) | ||
| No. | 73 | 76 | 75 | ||
| High intensity vs control | 3 (−37 to 42) | .89 | |||
| High intensity vs low intensity | −10 (−49 to 30) | .63 | |||
| Low intensity vs control | 12 (−27 to 51) | .54 | |||
| Log IL-6c | |||||
| Baseline, mean (SD) | 1.0 (0.7) | 0.9 (0.6) | 0.9 (0.7) | ||
| 18 mo, adjusted means (95% CI) | 0.9 (0.8 to 1.0) | 0.9 (0.8 to 1.0) | 0.9 (0.8 to 1.0) | ||
| No. | 88 | 93 | 85 | ||
| High intensity vs control | 0.0 (−0.1 to 0.2) | .88 | |||
| High intensity vs low intensity | 0.0 (−0.1 to 0.2) | .58 | |||
| Low intensity vs control | −0.0 (−0.2 to 0.1) | .70 | |||
| Joint space width, mm | |||||
| Baseline, mean (SD) | 3.1 (1.3) | 3.0 (1.5) | 3.0 (1.4) | ||
| 18 mo, adjusted means (95% CI) | 2.9 (2.8 to 3.1) | 2.8 (2.7 to 2.9) | 2.8 (2.6 to 2.9) | ||
| No. | 83 | 84 | 81 | ||
| High intensity vs control | 0.2 (−0.0 to 0.4) | .054 | |||
| High intensity vs low intensity | 0.1 (−0.0 to 0.3) | .12 | |||
| Low intensity vs control | 0.0 (−0.1 to 0.2) | .68 | |||
| Post hoc outcome | |||||
| Knee flexor strength, Nm | |||||
| Baseline mean (SD) | 35.0 (20.1) | 38.2 (20.3) | 38.1 (22.5) | ||
| 18 mo, adjusted means (95% CI) | 51.5 (48.7 to 54.3) | 52.6 (49.7 to 55.4) | 43.8 (40.9 to 46.8) | ||
| No. | 79 | 78 | 75 | ||
| High intensity vs control | 7.6 (3.6 to 11.7) | <.001 | |||
| High intensity vs low intensity | −1.1 (−5.1 to 2.9) | .59 | |||
| Low intensity vs control | 8.7 (4.7 to 12.7) | <.001 | |||
Abbreviation: WOMAC, Western Ontario and McMaster Universities Osteoarthritic Index.
Pairwise treatment group comparisons performed at the .05 significance level for testing 18-month effect.
The model-adjusted outcomes used only participants with complete follow-up data and were adjusted for sex, baseline BMI, and baseline outcome values. Sensitivity analyses were conducted to multiply impute data for participants with missing data under the assumption that data were missing at random (eTable 2 in Supplement 2).
Log-transform data presented because IL-6 data in pg/mL do not meet the assumption of normality. This aligns with the statistical comparisons that were based on the log-transformed data.
Knee extensor mean strength was statistically significantly greater in the high-intensity group (98.5 Newton meter [Nm]) than in the control group (88.5 Nm) at 18 months (adjusted difference, 10.0 Nm; 95% CI, 3.8 to 16.2; P = .002) but was not statistically significantly greater than in the low-intensity group (93.2 Nm; adjusted difference, 5.3 Nm; 95% CI, −0.8 to 11.4; P = .09). The mean hip abductor strength for the high-intensity group was 74.6 Nm vs 69.5 Nm in the control group (adjusted difference, 5.0 Nm; 95% CI, 0.7 to 9.3; P = .02) but was not significantly different from the low-intensity group (adjusted difference, 0.0 Nm; 95% CI, −4.3 to 4.2; P = .99) (Table 3 and eFigure 2 in Supplement 2).
The mean thigh muscle volume for the high-intensity group was 672 cm3 compared with 670 cm3 in the control group (adjusted difference, 2 cm3; 95% CI, −20 to 23; P = .89) and compared with 679 cm3 in the low-intensity group (adjusted difference, −8 cm3; 95% CI, −29 to 13; P = .48). The mean thigh fat volume in the high-intensity group of 712 cm3 compared with 709 cm3 in the control group (adjusted difference, 3 cm3; 95% CI, −37 to 42; P = .89) and compared with the 721 cm3 in the low-intensity group (adjusted difference, −10 cm3; 95% CI, −49 to 30, P = .63) was not statistically significantly different for either comparison at the 18-month follow-up (Table 3 and eFigure 3 in Supplement 2).
The mean log IL-6 levels were the same (0.9) in all 3 groups at 18 months. The adjusted difference between the high-intensity and the control group was 0.0 (95% CI, −0.1 to 0.2; P = .88) and between the high-intensity group vs low-intensity group was 0.0 (95% CI, −0.1 to 0.2; P = .58) (Table 3 and eFigure 3 in Supplement 2).
The mean joint space width at 18 months was not statistically significantly different between the high-intensity group (2.9 mm) and the control group (2.8 mm; adjusted difference, 0.2 mm; 95% CI, −0.0 to 0.4; P = .054) or between the high-intensity group and the low-intensity group (2.8 mm; adjusted difference, 0.1 mm; 95% CI, −0.0 to 0.3; P = .12) (Table 3 and eFigure 3 in Supplement 2).
Adverse Events
There were 87 nonserious adverse events: 53 in the high-intensity, 30 in the low-intensity, and 4 in the control groups. Of those, 29 were related to the study: 20 in the high-intensity, 9 in the low-intensity, none in the control groups. Twenty patients experienced body pain: 12 in the high-intensity, 7 in the low-intensity, and 1 in the control groups; 19 experienced falls: 11 in the high-intensity, 6 in the low-intensity, and 2 in the control groups; and 10 experienced muscle strain: 8 in the high-intensity and 2 in the low-intensity groups, all which were the most frequent adverse events. Three knee replacements occurred, 1 in each group. The 13 serious adverse events (5, high-intensity; 3, low-intensity; 5, control) were determined unrelated to the study by the external safety monitor (eTables 6-8 in Supplement 2).
Post Hoc Outcomes
The mean knee flexor strength at 18 months was statistically significantly greater in both exercise groups than in the control group. The mean high-intensity group measured 51.5 Nm compared with 43.8 Nm in the control group (adjusted difference, 7.6 Nm; 95% CI, 3.6 to 11.7; P < .001). The low-intensity group measured 52.6 Nm, and compared with the control group had an adjusted difference of 8.7 Nm (95% CI, 4.7 to 12.7; P < .001). The mean knee flexor strength was not significantly different between the high-intensity group and the low-intensity group (adjusted difference, −1.1 Nm; 95% CI, −5.1 to 2.9; P = .59) (Table 3; eFigure 2 in Supplement 2).
The proportion of participants using pain medication declined across the 18-month intervention period, with no statistical difference among the groups at the 18-month follow-up: high-intensity, 0.45 (95% CI, 0.35 to 0.58); low-intensity, 0.34 (95% CI, 0.25 to 0.48); and control, 0.55 (95% CI, 0.44 to 0.68; P = .06) (eFigure 4 in Supplement 2). The number and percentage of participants in each group that achieved the OMERACT-OARSI clinical criteria31 of 20% or more improvement from baseline in pain and function at 18 months were 42 of 93 (45%) in the high-intensity; 49 of 88 (56%) in the low-intensity; and 56 of 94 (60%) in the control groups (χ2 P = .12).
Discussion
Among participants with knee osteoarthritis, high-intensity strength training did not significantly reduce WOMAC knee pain or knee joint compressive forces at 18 months compared with low-intensity strength training or with an attention control group.
One potential explanation for why the outcomes in the high-intensity strength training and control groups were not significantly different relates to the improvement in pain in the control group. In this trial, knee osteoarthritis pain improved by 33% in the control group, compared with from 1% to 17% in prior trials.15,32,33,34 In these earlier trials, the control intervention consisted of limited healthful lifestyle educational material. In the current study, the control group attended group educational sessions with interventionists trained in social cognitive strategies to maximize adherence, and interacted with other participants in a social environment. The characteristics of the control intervention may have contributed to a larger control group effect than reported previously.
Alternatively, Englund35 suggested the true effect of exercise interventions for knee osteoarthritis is modest, with improvements in pain and function due primarily to the placebo effect, natural history of the disease, and regression to the mean. The large sample size and long duration of the intervention may also have increased the placebo response for the subjective outcome of pain.36 These, together with the substantial reduction in pain in the control group, may explain why the high-intensity strength training group was not significantly different from the control group.31,36
The study premise was that long-term high-intensity strength training would affect the biomechanical pathway via reduced knee joint compressive forces resulting in reduced knee pain and attenuated osteoarthritis disease progression.15,19 However, significant increases in muscle strength were not associated with improvement in knee joint loads.
The decrease in medial joint space width across groups (mean, 0.2 mm; 4%-5% per year) was consistent with the natural history of osteoarthritis progression.37 These data suggest that high-intensity strength training did not exacerbate radiographic disease progression.
Nonserious adverse events were more prevalent in the high-intensity (n = 53) and low-intensity (n = 30) strength training groups than in the control group (n = 4) but did not appear to affect retention adversely (high-intensity and low-intensity, 86% vs control, 83%). Furthermore, the 95% CI around the pairwise difference in WOMAC pain between the high-intensity group and the low-intensity and control groups included worse scores for the high-intensity group of between 1 and 2 points that are of uncertain clinical importance.23 Hence, clinically important levels of increased pain with high-intensity training cannot be ruled out.
Limitations
This study has several limitations. First, the results may be more generalizable to individuals who are comparable with the study sample, the majority of whom were men, white, obese, and had more than a high school education. Second, the range of eligible frontal plane knee angles was −2° valgus to 10° varus; hence, these results are most generalizable to alignments within this range. Third, musculoskeletal modeling was used to estimate knee joint compressive forces. This method is limited by many simplifying assumptions about joint properties and structures.38
Conclusions
Among participants with knee osteoarthritis, high-intensity strength training compared with low-intensity strength training or an attention control did not significantly reduce WOMAC knee pain or knee joint compressive forces at 18 months. The findings do not support the use of high-intensity strength training over low-intensity strength training or an attention control in adults with knee osteoarthritis.
Study Protocol
eTable 1 Comparison of Baseline Values of Completers and Noncompleters
eTable 2. Pairwise Between-Group Differences At 18-Month Follow-Up For Pre-Specified Primary And Secondary Outcomes, And Post Hoc Outcome From Multiply Imputed Data
eTable 3. Primary Outcome Analyses Mean Values Adjusted For Baseline Frontal Plane Alignment Or Patellofemoral OA
eTable 4. Pre-Specified Secondary Outcomes At 6-month Follow-Up
eTable 5. Unadjusted Changes In Pre-Specified Secondary And Post-Hoc Outcomes At 18-Month Follow-Up
eTable 6. Serious Adverse Events (SAE)
eTable 7. Most Commonly Occurring Adverse Events (AEs) By Group Assignment
eTable 8. Adverse Events Related To The Study By Group
eFigure 1. Unadjusted Mean WOMAC Function, and Unadjusted Mean 6-Minute Walk Distance
eFigure 2. Unadjusted Mean Knee Extensor Strength, Unadjusted Mean Knee Flexor Strength, and Unadjusted Mean Hip Abductor Strength
eFigure 3. Unadjusted Mean Medial Tibiofemoral Joint Space Width, and Unadjusted Mean Thigh Muscle Volume, Unadjusted Mean Thigh Fat Volume, and Unadjusted Mean Log IL-6 Levels
eFigure 4. Percent Pain Medication Use By Group
Data Sharing Statement
References
- 1.Neogi T The epidemiology and impact of pain in osteoarthritis. Osteoarthritis Cartilage. 2013;21(9):1145-1153. [DOI] [PMC free article] [PubMed] [Google Scholar]
- 2.Vos T, Flaxman AD, Naghavi M, et al. Years lived with disability (YLDs) for 1160 sequelae of 289 diseases and injuries 1990-2010: a systematic analysis for the Global Burden of Disease Study 2010. Lancet. 2012;380(9859):2163-2196. [DOI] [PMC free article] [PubMed] [Google Scholar]
- 3.Kolasinski SL, Neogi T, Hochberg MC, et al. 2019 American College of Rheumatology/Arthritis Foundation Guideline for the management of osteoarthritis of the hand, hip, and knee. Arthritis Care Res (Hoboken). 2020;72(2):149-162. [DOI] [PMC free article] [PubMed] [Google Scholar]
- 4.Hall M, Hinman RS, Wrigley TV, Kasza J, Lim B-W, Bennell KL. Knee extensor strength gains mediate symptom improvement in knee osteoarthritis: secondary analysis of a randomised controlled trial. Osteoarthritis Cartilage. 2018;26(4):495-500. [DOI] [PubMed] [Google Scholar]
- 5.Singh NA, Clements KM, Fiatarone MA. A randomized controlled trial of progressive resistance training in depressed elders. J Gerontol A Biol Sci Med Sci. 1997;52(1):M27-M35. [DOI] [PubMed] [Google Scholar]
- 6.Otterness IG, Eskra JD, Bliven ML, Shay AK, Pelletier JP, Milici AJ. Exercise protects against articular cartilage degeneration in the hamster. Arthritis Rheum. 1998;41(11):2068-2076. [DOI] [PubMed] [Google Scholar]
- 7.Van den Hoogen BM, van de Lest CH, van Weeren PR, et al. Loading-induced changes in synovial fluid affect cartilage metabolism. Br J Rheumatol. 1998;37(6):671-676. [DOI] [PubMed] [Google Scholar]
- 8.Ferenczi MA, Bershitsky SY, Koubassova NA, et al. Why muscle is an efficient shock absorber. PLoS One. 2014;9(1):e85739. [DOI] [PMC free article] [PubMed] [Google Scholar]
- 9.Kraemer WJ, Adams K, Cafarelli E, et al. ; American College of Sports Medicine . American College of Sports Medicine position stand: progression models in resistance training for healthy adults. Med Sci Sports Exerc. 2002;34(2):364-380. [DOI] [PubMed] [Google Scholar]
- 10.Ettinger WH Jr, Burns R, Messier SP, et al. A randomized trial comparing aerobic exercise and resistance exercise with a health education program in older adults with knee osteoarthritis: the Fitness Arthritis and Seniors Trial (FAST). JAMA. 1997;277(1):25-31. [PubMed] [Google Scholar]
- 11.Hurley MV, Scott DL. Improvements in quadriceps sensorimotor function and disability of patients with knee osteoarthritis following a clinically practicable exercise regime. Br J Rheumatol. 1998;37(11):1181-1187. [DOI] [PubMed] [Google Scholar]
- 12.King LK, Birmingham TB, Kean CO, Jones IC, Bryant DM, Giffin JR. Resistance training for medial compartment knee osteoarthritis and malalignment. Med Sci Sports Exerc. 2008;40(8):1376-1384. [DOI] [PubMed] [Google Scholar]
- 13.Mikesky AE, Mazzuca SA, Brandt KD, Perkins SM, Damush T, Lane KA. Effects of strength training on the incidence and progression of knee osteoarthritis. Arthritis Rheum. 2006;55(5):690-699. [DOI] [PubMed] [Google Scholar]
- 14.Sharma L, Dunlop DD, Cahue S, Song J, Hayes KW. Quadriceps strength and osteoarthritis progression in malaligned and lax knees. Ann Intern Med. 2003;138(8):613-619. [DOI] [PubMed] [Google Scholar]
- 15.Baker KR, Nelson ME, Felson DT, Layne JE, Sarno R, Roubenoff R. The efficacy of home based progressive strength training in older adults with knee osteoarthritis: a randomized controlled trial. J Rheumatol. 2001;28(7):1655-1665. [PubMed] [Google Scholar]
- 16.Sharma L, Lou C, Cahue S, Dunlop DD. The mechanism of the effect of obesity in knee osteoarthritis: the mediating role of malalignment. Arthritis Rheum. 2000;43(3):568-575. [DOI] [PubMed] [Google Scholar]
- 17.Altman RD, Gold GE. Atlas of individual radiographic features in osteoarthritis, revised. Osteoarthritis Cartilage. 2007;15(suppl A):A1-A56. [DOI] [PubMed] [Google Scholar]
- 18.Nasreddine ZS, Phillips NA, Bédirian V, et al. The Montreal Cognitive Assessment, MoCA: a brief screening tool for mild cognitive impairment. J Am Geriatr Soc. 2005;53(4):695-699. doi: 10.1111/j.1532-5415.2005.53221.x [DOI] [PubMed] [Google Scholar]
- 19.Messier SP, Mihalko SL, Beavers DP, et al. Strength Training for Arthritis Trial (START): design and rationale. BMC Musculoskelet Disord. 2013;14(1):208. doi: 10.1186/1471-2474-14-208 [DOI] [PMC free article] [PubMed] [Google Scholar]
- 20.Bandura A Self-Efficacy: The Exercise of Control. WH Freeman and Co; 1997. [Google Scholar]
- 21.Bellamy N, Buchanan WW, Goldsmith CH, Campbell J, Stitt L. Validation study of WOMAC: a health status instrument for measuring clinically important patient relevant outcomes following to antirheumatic drug therapy in patients with osteoarthritis of the hip or knee. J Rheumatol. 1988;15(12):1833-1840. [PubMed] [Google Scholar]
- 22.Griffin TM, Guilak F. The role of mechanical loading in the onset and progression of osteoarthritis. Exerc Sport Sci Rev. 2005;33(4):195-200. doi: 10.1097/00003677-200510000-00008 [DOI] [PubMed] [Google Scholar]
- 23.Messier SP, Mihalko SL, Legault C, et al. Effects of intensive diet and exercise on knee joint loads, inflammation, and clinical outcomes among overweight and obese adults with knee osteoarthritis: the IDEA randomized clinical trial. JAMA. 2013;310(12):1263-1273. doi: 10.1001/jama.2013.277669 [DOI] [PMC free article] [PubMed] [Google Scholar]
- 24.Griffiths G, Bellamy N, Kean WF, Campbell J, Gerecz-Simon E. A study of the time frame dependency of responses to the WOMAC osteoarthritis index. Inflammopharmacology. 1993;2(1):85–87. doi: 10.1007/BF02663745 [DOI] [Google Scholar]
- 25.Dougados M, Leclaire P, van der Heijde D, Bloch DA, Bellamy N, Altman RD. Response criteria for clinical trials on osteoarthritis of the knee and hip: a report of the Osteoarthritis Research Society International Standing Committee for Clinical Trials response criteria initiative. Osteoarthritis Cartilage. 2000;8(6):395-403. doi: 10.1053/joca.2000.0361 [DOI] [PubMed] [Google Scholar]
- 26.Kapstad H, Hanestad BR, Langeland N, Rustøen T, Stavem K. Cutpoints for mild, moderate and severe pain in patients with osteoarthritis of the hip or knee ready for joint replacement surgery. BMC Musculoskelet Disord. 2008;9:55. doi: 10.1186/1471-2474-9-55 [DOI] [PMC free article] [PubMed] [Google Scholar]
- 27.Siviero P, Limongi F, Gesmundo A, et al. ; EPOSA Research Group . Minimal clinically important decline in physical function over one year: EPOSA study. BMC Musculoskelet Disord. 2019;20(1):227. doi: 10.1186/s12891-019-2593-1 [DOI] [PMC free article] [PubMed] [Google Scholar]
- 28.Naylor JM, Mills K, Buhagiar M, Fortunato R, Wright R. Minimal important improvement thresholds for the six-minute walk test in a knee arthroplasty cohort: triangulation of anchor- and distribution-based methods. BMC Musculoskelet Disord. 2016;17(1):390. doi: 10.1186/s12891-016-1249-7 [DOI] [PMC free article] [PubMed] [Google Scholar]
- 29.Mazzuca SA, Hellio Le Graverand MP, Vignon E, et al. Performance of a non-fluoroscopically assisted substitute for the Lyon schuss knee radiograph: quality and reproducibility of positioning and sensitivity to joint space narrowing in osteoarthritic knees. Osteoarthritis Cartilage. 2008;16(12):1555-1559. doi: 10.1016/j.joca.2008.04.010 [DOI] [PubMed] [Google Scholar]
- 30.The Atherosclerosis Risk in Communities (ARIC) study: design and objectives. The ARIC investigators. Am J Epidemiol. 1989;129(4):687-702. doi: 10.1093/oxfordjournals.aje.a115184 [DOI] [PubMed] [Google Scholar]
- 31.Pham T, van der Heijde D, Altman RD, et al. OMERACT-OARSI initiative: Osteoarthritis Research Society International set of responder criteria for osteoarthritis clinical trials revisited. Osteoarthritis Cartilage. 2004;12(5):389-399. doi: 10.1016/j.joca.2004.02.001 [DOI] [PubMed] [Google Scholar]
- 32.Messier SP, Loeser RF, Miller GD, et al. Exercise and dietary weight loss in overweight and obese older adults with knee osteoarthritis: the Arthritis, Diet, and Activity Promotion Trial. Arthritis Rheum. 2004;50(5):1501-1510. doi: 10.1002/art.20256 [DOI] [PubMed] [Google Scholar]
- 33.Jan MH, Lin JJ, Liau JJ, Lin YF, Lin DH. Investigation of clinical effects of high- and low-resistance training for patients with knee osteoarthritis: a randomized controlled trial. Phys Ther. 2008;88(4):427-436. doi: 10.2522/ptj.20060300 [DOI] [PubMed] [Google Scholar]
- 34.Bliddal H, Leeds AR, Stigsgaard L, Astrup A, Christensen R. Weight loss as treatment for knee osteoarthritis symptoms in obese patients: 1-year results from a randomised controlled trial. Ann Rheum Dis. 2011;70(10):1798-1803. doi: 10.1136/ard.2010.142018 [DOI] [PubMed] [Google Scholar]
- 35.Englund M Bout of the corner men and not the boxers? contextual effects flex their muscles. Ann Rheum Dis. 2018;77(2):159-161. doi: 10.1136/annrheumdis-2017-211664 [DOI] [PubMed] [Google Scholar]
- 36.Tuttle AH, Tohyama S, Ramsay T, et al. Increasing placebo responses over time in U.S. clinical trials of neuropathic pain. Pain. 2015;156(12):2616-2626. doi: 10.1097/j.pain.0000000000000333 [DOI] [PubMed] [Google Scholar]
- 37.Felson DT, Zhang Y, Hannan MT, et al. The incidence and natural history of knee osteoarthritis in the elderly. the Framingham Osteoarthritis Study. Arthritis Rheum. 1995;38(10):1500-1505. doi: 10.1002/art.1780381017 [DOI] [PubMed] [Google Scholar]
- 38.Wilson DR, McWalter EJ, Johnston JD. The measurement of joint mechanics and their role in osteoarthritis genesis and progression. Rheum Dis Clin North Am. 2008;34(3):605-622. doi: 10.1016/j.rdc.2008.05.002 [DOI] [PubMed] [Google Scholar]
Associated Data
This section collects any data citations, data availability statements, or supplementary materials included in this article.
Supplementary Materials
Study Protocol
eTable 1 Comparison of Baseline Values of Completers and Noncompleters
eTable 2. Pairwise Between-Group Differences At 18-Month Follow-Up For Pre-Specified Primary And Secondary Outcomes, And Post Hoc Outcome From Multiply Imputed Data
eTable 3. Primary Outcome Analyses Mean Values Adjusted For Baseline Frontal Plane Alignment Or Patellofemoral OA
eTable 4. Pre-Specified Secondary Outcomes At 6-month Follow-Up
eTable 5. Unadjusted Changes In Pre-Specified Secondary And Post-Hoc Outcomes At 18-Month Follow-Up
eTable 6. Serious Adverse Events (SAE)
eTable 7. Most Commonly Occurring Adverse Events (AEs) By Group Assignment
eTable 8. Adverse Events Related To The Study By Group
eFigure 1. Unadjusted Mean WOMAC Function, and Unadjusted Mean 6-Minute Walk Distance
eFigure 2. Unadjusted Mean Knee Extensor Strength, Unadjusted Mean Knee Flexor Strength, and Unadjusted Mean Hip Abductor Strength
eFigure 3. Unadjusted Mean Medial Tibiofemoral Joint Space Width, and Unadjusted Mean Thigh Muscle Volume, Unadjusted Mean Thigh Fat Volume, and Unadjusted Mean Log IL-6 Levels
eFigure 4. Percent Pain Medication Use By Group
Data Sharing Statement