

Key Points
Question
Is maternal cardiovascular health during pregnancy (characterized by the combination of 5 metrics: body mass index, blood pressure, total cholesterol level, glucose level, and smoking) associated with offspring cardiovascular health during early adolescence (characterized by the combination of 4 metrics: body mass index, blood pressure, total cholesterol level, and glucose level)?
Findings
In this multinational cohort study of 2302 mother-child dyads, poorer maternal cardiovascular health at a mean of 28 weeks’ gestation was significantly associated with higher risks for poorer offspring cardiovascular health at ages 10 to 14 years (adjusted relative risk for association between ≥2 poor [vs all ideal] maternal metrics and ≥2 poor [vs all ideal] offspring metrics, 7.82).
Meaning
Maternal cardiovascular health during pregnancy was significantly associated with offspring cardiovascular health during early adolescence.
Abstract
Importance
Pregnancy may be a key window to optimize cardiovascular health (CVH) for the mother and influence lifelong CVH for her child.
Objective
To examine associations between maternal gestational CVH and offspring CVH.
Design, Setting, and Participants
This cohort study used data from the Hyperglycemia and Adverse Pregnancy Outcome (HAPO) Study (examinations: July 2000-April 2006) and HAPO Follow-Up Study (examinations: February 2013-December 2016). The analyses included 2302 mother-child dyads, comprising 48% of HAPO Follow-Up Study participants, in an ancillary CVH study. Participants were from 9 field centers across the United States, Barbados, United Kingdom, China, Thailand, and Canada.
Exposures
Maternal gestational CVH at a target of 28 weeks’ gestation, based on 5 metrics: body mass index, blood pressure, total cholesterol level, glucose level, and smoking. Each metric was categorized as ideal, intermediate, or poor using pregnancy guidelines. Total CVH was categorized as follows: all ideal metrics, 1 or more intermediate (but 0 poor) metrics, 1 poor metric, or 2 or more poor metrics.
Main Outcomes and Measures
Offspring CVH at ages 10 to 14 years, based on 4 metrics: body mass index, blood pressure, total cholesterol level, and glucose level. Total CVH was categorized as for mothers.
Results
Among 2302 dyads, the mean (SD) ages were 29.6 (2.7) years for pregnant mothers and 11.3 (1.1) years for children. During pregnancy, the mean (SD) maternal CVH score was 8.6 (1.4) out of 10. Among pregnant mothers, the prevalence of all ideal metrics was 32.8% (95% CI, 30.6%-35.1%), 31.7% (95% CI, 29.4%-34.0%) for 1 or more intermediate metrics, 29.5% (95% CI, 27.2%-31.7%) for 1 poor metric, and 6.0% (95% CI, 3.8%-8.3%) for 2 or more poor metrics. Among children of mothers with all ideal metrics, the prevalence of all ideal metrics was 42.2% (95% CI, 38.4%-46.2%), 36.7% (95% CI, 32.9%-40.7%) for 1 or more intermediate metrics, 18.4% (95% CI, 14.6%-22.4%) for 1 poor metric, and 2.6% (95% CI, 0%-6.6%) for 2 or more poor metrics. Among children of mothers with 2 or more poor metrics, the prevalence of all ideal metrics was 30.7% (95% CI, 22.0%-40.4%), 28.3% (95% CI, 19.7%-38.1%) for 1 or more intermediate metrics, 30.7% (95% CI, 22.0%-40.4%) for 1 poor metric, and 10.2% (95% CI, 1.6%-20.0%) for 2 or more poor metrics. The adjusted relative risks associated with 1 or more intermediate, 1 poor, and 2 or more poor (vs all ideal) metrics, respectively, in mothers during pregnancy were 1.17 (95% CI, 0.96-1.42), 1.66 (95% CI, 1.39-1.99), and 2.02 (95% CI, 1.55-2.64) for offspring to have 1 poor (vs all ideal) metrics, and the relative risks were 2.15 (95% CI, 1.23-3.75), 3.32 (95% CI,1.96-5.62), and 7.82 (95% CI, 4.12-14.85) for offspring to have 2 or more poor (vs all ideal) metrics. Additional adjustment for categorical birth factors (eg, preeclampsia) did not fully explain these significant associations (eg, relative risk for association between 2 or more poor metrics among mothers during pregnancy and 2 or more poor metrics among offspring after adjustment for an extended set of birth factors, 6.23 [95% CI, 3.03-12.82]).
Results
Among 2302 dyads, the mean (SD) ages were 29.6 (2.7) years for pregnant mothers and 11.3 (1.1) years for children. During pregnancy, the mean (SD) maternal CVH score was 8.6 (1.4) out of 10. As shown in the Table, 32.8% of pregnant mothers had all ideal metrics, whereas 6.0% had 2 or more poor metrics, and the distribution of CVH categories among offspring varied by maternal CVH category. In adjusted models, poorer maternal CVH categories (vs all ideal maternal metrics) were associated with higher relative risks for offspring to have 1 poor and 2 or more poor metrics (vs all ideal metrics). Additional adjustment for categorical birth factors (eg, preeclampsia) did not fully explain these significant associations (eg, relative risk for association between 2 or more poor metrics among mothers during pregnancy and 2 or more poor metrics among offspring after adjustment for an extended set of birth factors, 6.23 [95% CI, 3.03-12.82]).
| Prevalence of metrics, % (95% CI) | ||||
|---|---|---|---|---|
| All ideal | ≥1 Intermediate | 1 Poor | ≥2 Poor | |
| Pregnant mothers | 32.8 (30.6-35.1) | 31.7 (29.4-34.0) | 29.5 (27.2-31.7) | 6.0 (3.8-8.3) |
| Children of mothers with all ideal metrics | 42.2 (38.4-46.2) | 36.7 (32.9-40.7) | 18.4 (14.6-22.4) | 2.6 (0-6.6) |
| Children of mothers with ≥2 poor metrics | 30.7 (22.0-40.4) | 28.3 (19.7-38.1) | 30.7 (22.0-40.4) | 10.2 (1.6-20.0) |
| Adjusted relative risk (95% CI) | ||||
| Children having 1 poor metric (vs ideal) | 1.17 (0.96-1.42) | 1.66 (1.39-1.99) | 2.02 (1.55-2.64) | |
| Children having ≥2 poor metrics (vs ideal) | 2.15 (1.23-3.75) | 3.32 (1.96-5.62) | 7.82 (4.12-14.85) | |
Conclusions and Relevance
In this multinational cohort, better maternal CVH at 28 weeks’ gestation was significantly associated with better offspring CVH at ages 10 to 14 years.
This international cohort study examines associations between the cardiovascular (CV) health of pregnant women (defined by 5 CV risk factors) and CV health of their offspring at ages 10 to 14 years.
Introduction
Gestation is increasingly recognized as a critical period for the offspring’s life-long health after birth.1 In utero exposure to poor maternal health may lead to a higher-risk trajectory for cardiovascular disease (CVD), for example, via epigenetic modifications to cardiometabolic regulatory genes.1 Singly and in separate studies, risk factor extremes, such as obesity,2 diabetes,3 and hypertensive disorders,4 during pregnancy have been significantly associated with higher long-term CVD risks among offspring. However, combinations of risk factor levels that are nonideal but below clinical diagnostic thresholds are more common and may contribute more to population disease burdens.5
The American Heart Association’s (AHA’s) cardiovascular health (CVH) construct characterizes a spectrum of health levels by combining multiple metrics: body mass index (BMI), blood pressure, total cholesterol level, glucose level, smoking, diet, and physical activity.6 CVH is a global, positive health-oriented (rather than disease-oriented) construct that has proven widely applicable across clinical settings.7 Excluding pregnant women, better CVH has been significantly associated with positive health outcomes, including greater healthy longevity and less CVD, among many others.7 Data regarding CVH during pregnancy are sparse, but application of the CVH construct across a woman’s reproductive life course has been recommended by the AHA and American College of Obstetricians and Gynecologists.8
Gestational CVH—formally characterized by the combination of 5 clinical metrics: BMI, blood pressure, total cholesterol level, glucose level, and smoking—has been significantly associated with risks for adverse pregnancy outcomes,9 but its relevance for longer-term health in offspring remains unknown. Therefore, the primary objective of this analysis was to examine associations of maternal CVH during pregnancy (28 weeks’ gestation) with offspring CVH during early adolescence (ages 10-14 years).
Methods
Study Design and Participants
All study protocols were approved by the institutional review boards of all field centers. Mothers gave written informed consent for themselves and their children, and children assented where required by the local institutional review board.
The Hyperglycemia and Adverse Pregnancy Outcome (HAPO) Study was a cohort study designed to examine associations between glycemia and pregnancy outcomes; the study results led to new, less-restrictive diagnostic criteria for gestational diabetes.10 Study methods have been described.11,12,13,14 Briefly, pregnant women without pregestational diabetes were enrolled at 15 international field centers. Women were examined at a target of 28 weeks’ gestation (range, 24-32), newborns were examined within 72 hours of delivery, and data were collected through pregnancy and 4 to 6 weeks postpartum.
The HAPO Follow-Up Study reexamined 4747 mother-offspring dyads in 10 of the original 15 field centers 10 to 14 years after delivery (in 2013-2016).14 Study eligibility required that women and caregivers had remained blinded to glycemia levels during pregnancy (and thus no treatment had been given based on glycemia), delivery occurred at 37 weeks’ gestation or later, and the newborn had no major malformation. A random approximately 50% subset of HAPO Follow-Up Study dyads distributed across ancestry groups (African, Asian, European, Mexican American) from 9 field centers across the United States, Barbados, United Kingdom, China, Thailand, and Canada were included in an ancillary CVH study9 and thus had data for the present analyses; we excluded 0 mothers and 2 children with type 1 diabetes.
Maternal CVH During Pregnancy
Maternal CVH was characterized using data from the baseline study examination at 28 weeks’ gestation (range, 24-32).11 As in prior studies of nonpregnant adults,15 CVH in pregnancy was based on the combination of 5 “clinical” CVH metrics: BMI, blood pressure, total cholesterol level, glucose level, and smoking (Table 1) because diet and physical activity data were not collected. Height, weight, and blood pressure were each measured twice by trained study personnel using calibrated instruments. BMI was calculated as weight in kilograms divided by height in meters squared. Antihypertensive medication use was abstracted from medical records. Venous blood was drawn fasting and 1 and 2 hours after a 75-g oral glucose load and sent to central lipid and glucose laboratories for analysis. Fasting serum lipid levels were measured enzymatically (Beckman DxC 600), with total and within-run coefficients of variation of 3.0% or less and 2.0% or less, respectively. Fasting, 1-hour, and 2-hour plasma glucose levels were measured with enzymatic methods (Vitros 750); quality-control data have been reported.11,12 Smoking status was collected by questionnaire.
Table 1. Classification of Cardiovascular Health Metrics for Mother and Offspring.
| Source | Ideal metrics (2 points) | Intermediate metrics (1 point) | Poor metrics (0 points) | |
|---|---|---|---|---|
| Body mass indexa | ||||
| Mother during pregnancy | HAPO Study/American Heart Associationb | ≤28.4 | 28.5-32.9 | ≥33 |
| Offspring at follow-up | International Obesity Task Forcec | Normal | Overweight | Obese |
| Blood pressure, mm Hg | ||||
| Mother during pregnancy | American College of Obstetrics and Gynecology | SBP<120 and DBP<80 | SBP 120-139 or DBP 80-89 | SBP≥140 or DBP≥90 |
| Offspring at follow-up | American Academy of Pediatrics Guideline 2017/American Heart Association | |||
| Age 10-12 y | <90th percentile and <120/<80 | ≥90th percentile or SBP 120-129 and <95th percentile and DBP<80 | ≥95th percentile or SBP≥130 or DBP≥80 | |
| Age 13-14 y | <120/<80 | SBP 120-129 and DBP<80 | SBP≥130 or DBP≥80 | |
| Total cholesterol level, mg/dL | ||||
| Mother during pregnancyd | No guidelinesd | <260 | 260-299 | ≥300 |
| Offspring at follow-up | NHLBI Pediatric Guideline 2011/American Heart Association | <170 | 170-199 | ≥200 |
| Blood glucose level, mg/dL | ||||
| Mother during pregnancy | International Association of Diabetes and Pregnancy Study Groupse | All others | Gestational diabetes: fasting ≥92 or 1-h OGTT≥180 or 2-h OGTT≥153 | |
| Offspring at follow-upf | American Heart Association/American Diabetes Association | Fasting <100 | Fasting 100-125 | Fasting ≥126 |
| Smoking status | ||||
| Mother during pregnancy | American Heart Association | No | Yes |
Abbreviations: DBP, diastolic blood pressure; HAPO, Hyperglycemia and Adverse Pregnancy Outcome; NHLBI, National Heart, Lung, and Blood Institute; OGTT, oral glucose tolerance test; SBP, systolic blood pressure.
SI conversion factors: To convert total cholesterol to mmol/L, multiply by 0.0259; triglycerides to mmol/L, multiply by 0.0113; and glucose to mmol/L, multiply by 0.0555.
Calculated as weight in kilograms divided by height in meters squared.
Based on HAPO Study–specific regression of body mass index at study examination on prepregnancy body mass index (in 91.6% of participants with data available), categorized with American Heart Association definitions. See the Methods section for details.
Defined by age- and sex-specific thresholds that correspond to adult overweight and obesity thresholds, using Asian-specific thresholds for Asian children and international thresholds for all others.
No guidelines define risk levels for total cholesterol level or other lipids in pregnancy. Specific thresholds were selected based on total cholesterol level distributions and clinical relevance. In a sensitivity analysis, gestational triglyceride levels were used to define the lipid metric as follows: ideal if less than 220 mg/dL, intermediate if 220 to less than 300 mg/dL, and poor if 300 mg/dL or greater. See the Methods section for details on the main classification for total cholesterol level; eMethods in the Supplement for details on the sensitivity analysis using triglyceride levels; and see eResults and eFigures 1, 2, 3, 4, and 5 in the Supplement for detailed results of this sensitivity analysis.
Criteria for diagnosis of gestational diabetes (poor level); HAPO excluded women with pregestational diabetes mellitus.
Primary analysis used child fasting glucose criteria shown in the table. In a sensitivity analysis, a more comprehensive glycemia categorization was used, based on the combination of 3 indicators: fasting glucose level (classified per the table), hemoglobin A1C level (ideal if <5.7%, intermediate if 5.7%-6.4%, poor if >6.4%) and 2-hour OGTT glucose level (ideal if <140, intermediate if 140-199, and poor if ≥200 mg/dL). Glucose status was considered ideal if all 3 indicators were ideal, intermediate if any indicator was intermediate but none were poor, and poor if any indicator was poor. See the eMethods in the Supplement for details, and see eResults and eFigures 1, 2, 3, 4, and 5 in the Supplement for detailed results of this sensitivity analysis.
Each CVH metric was classified as ideal, intermediate, or poor using pregnancy guidelines10,16,17 as available (Table 1). For BMI, to appropriately account for gestational weight gain, we regressed gestational BMI (at the study examination) on prepregnancy BMI (available in 91.6%, based on self-reported prepregnancy weight) and gestational age (at the study examination) among the entire study cohort, as previously described.18 Gestational BMI thresholds (≤28.4 [ideal], 28.5-32.9 [intermediate], and ≥33 [poor]; Table 1) comparable with World Health Organization/AHA6 categories for nonpregnant adults were thus identified. For blood pressure, we used pregnancy guidelines.16 For total cholesterol level, no pregnancy guidelines exist, although lipid levels increase substantially during pregnancy.19 We defined total cholesterol levels less than 260 mg/dL as ideal, 260 to 299 mg/dL as intermediate, and 300 mg/dL or greater as poor, based on distributions among mothers in the study (yielding proportions ideal, intermediate, and poor similar to those for BMI) and ranges reported in uncomplicated pregnancies.19 For glucose level and smoking, based on guidelines10,17 and available data, poor status was defined for each and all others were considered to have ideal status. Poor glucose was defined as gestational diabetes (International Association of Diabetes in Pregnancy Study Groups/World Health Organization criteria10), and poor smoking status was defined as current smoking (at 24-32 weeks’ gestation).
Total CVH was scored with the same simple, positively framed algorithm that has previously been used to identify individuals who are at very low risk for a wide range of adverse health outcomes across a variety of clinical settings, consistent with the positive, global health-promotion focus of the CVH construct.9,20,21 Each of the 5 metrics was assigned 2 points for ideal, 1 for intermediate, and 0 for poor levels, yielding a total CVH score range of 0 to 10 points. Total CVH was also categorized into 4 mutually exclusive groups (as previously categorized9,15): all ideal metrics, 1 or more intermediate (but 0 poor) metrics, 1 poor metric, or 2 or more poor metrics.
Offspring CVH During Early Adolescence
Offspring CVH was characterized using data from the study examination at ages 10 to 14 years,14 based on the combination of 4 clinical CVH metrics: BMI, blood pressure, total cholesterol level, and glucose level. Measurement methods for child metrics were similar to those for pregnant mothers; details are provided in the eMethods in the Supplement. Each CVH metric was classified as ideal, intermediate, or poor using pediatric guidelines (Table 1).6,22,23,24,25 For BMI, age- and sex-specific International Obesity Task Force thresholds were used (Asian-specific for Asian children; international for others).14,22 For blood pressure,23 total cholesterol level,6,24 and glucose level,6,25 US pediatric guidelines were used. As for mothers, offspring total CVH was scored (based on 4 metrics, yielding a range of 0-8 points) and categorized (into 4 groups, as above).
Covariates
During pregnancy, maternal demographics, parity, and alcohol use were collected via questionnaire, and gestational age was determined by last menstrual period and/or ultrasound.11 Race and ethnicity were self-reported using prespecified categories; these data were collected to describe the study population, given the multinational study design. Perinatal outcomes were ascertained by a combination of maternal and newborn examinations and medical record abstraction using standardized criteria, as previously detailed.9,11,12,13 At follow-up, child demographics and menstrual history for girls were provided by mothers via questionnaire, and Tanner stage was determined by trained study personnel.14
Statistical Analyses
Primary Analysis: Associations of Maternal Gestational CVH With Offspring CVH
We calculated unadjusted prevalence for each offspring CVH score or category by maternal gestational CVH score or category and used the Cochran-Armitage test for trend to assess for ordered differences across gestational CVH categories. We examined covariate-adjusted associations of gestational CVH with offspring CVH, using linear regression to estimate regression coefficients for the offspring CVH score outcome and modified Poisson regression with robust standard errors to estimate relative risks (RRs) for the offspring CVH categorical outcomes. Model 1 covariates included field center and child sex and age at CVH measurement. Model 2 covariates additionally included maternal pregnancy variables of age, gestational age at CVH measurement, parity, height, and alcohol use.
Secondary Analyses
See eMethods in the Supplement for details. First, to determine whether significant maternal-offspring total CVH associations were driven by any single maternal or offspring CVH metric, we repeated analyses using individual gestational CVH metrics as exposures (adjusting for the other metrics) and individual offspring CVH metrics as outcomes. Second, to determine whether significant maternal-offspring CVH associations were fully explained by pregnancy and birth outcomes (or were partly independent, suggesting clinical utility of gestational CVH to provide additional information about offspring risk for poorer CVH by early adolescence), we adjusted for 3 separate sets of perinatal outcomes: (1) “clinical” set: preeclampsia/eclampsia, low birthweight (<2.5 kg), and macrosomia (>4.5 kg); (2) “extended” set: preeclampsia/eclampsia, newborn small and large for gestational age (<10th and >90th percentiles), sum of skinfolds more than the 90th percentile, and cord blood insulin sensitivity index less than the 10th percentile; and (3) “comprehensive” set: extended set plus gestational hypertension and gestational diabetes (with gestational CVH thus characterized by only BMI, total cholesterol level, and smoking status).
Sensitivity Analyses
See eMethods in the Supplement and Table 1 footnotes for details. We conducted 4 separate sensitivity analyses for the primary maternal-offspring CVH associations: (1) additional adjustment was made for child Tanner stage, (2) underweight mothers and children were excluded, (3) the gestational CVH lipid metric was defined using triglyceride (instead of total cholesterol) levels,9 and (4) the offspring CVH glucose metric was defined with a composite of fasting and 2-hour postload glucose levels and hemoglobin A1C level.
All analyses included complete cases; data missingness was assessed for the primary analytic sample of 2302 dyads. Analyses were performed in R version 3.6.2.26 Model assumptions were confirmed, and P values less than .05 based on a 2-tailed test were considered statistically significant.
Results
Participant Characteristics
The primary analytic sample included 2302 mother-offspring dyads; 2170 dyads had complete data for both maternal and offspring CVH scores (eTable 1 in the Supplement). The mean (SD) ages were 29.6 (5.7) years for pregnant mothers and 11.3 (1.1) years for children, and the sample was racially/ethnically and geographically diverse (Table 2). During pregnancy, the mean (SD) maternal CVH score was 8.6 (1.4) out of 10, and 32.8% (95% CI, 30.6%-35.1%) of mothers had all ideal metrics, whereas 6.0% (95% CI, 3.8%-8.3%) had 2 or more poor metrics. At follow-up, the mean (SD) offspring CVH score was 6.8 (1.3) out of 8, and 37.3% (95% CI, 35.0%-39.6%) of children had all ideal metrics, whereas 4.5% (95% CI, 2.3%-6.8%) had 2 or more poor metrics (Table 2 and Figure 1).
Table 2. Participant Characteristics.
| Characteristic | No. (%) | |
|---|---|---|
| Mothers during pregnancy | Offspring at follow-up | |
| No. | 2302 | 2302 |
| Field center location | ||
| United Statesa | 556 (24.2) | |
| Barbadosb | 519 (22.5) | |
| United Kingdomc | 468 (20.3) | |
| Chinad | 426 (18.5) | |
| Thailande | 171 (7.4) | |
| Canadaf | 162 (7.0) | |
| Age at study examination, mean (SD), y | 29.6 (5.7) | 11.3 (1.1) |
| Nulliparous at study examination | 1106 (48.0) | |
| Gestational age at study examination, mean (SD), wk | 27.7 (1.7) | |
| Gestational age at delivery, mean (SD), wk | 39.8 (1.2) | |
| Female sex | 1153 (50.1) | |
| Race/ethnicity | ||
| Asian | 696 (30.2) | |
| Non-Hispanic White | 627 (27.2) | |
| Non-Hispanic Black | 590 (25.6) | |
| Hispanic | 354 (15.4) | |
| Otherg | 35 (1.5) | |
| Body mass index category at study examination | ||
| Ideal | 1468 (63.8) | 1531 (66.5) |
| Intermediate | 523 (22.7) | 468 (20.3) |
| Poor | 311 (13.5) | 302 (13.1) |
| Blood pressure category at study examination | ||
| Ideal | 1999 (86.8) | 1914 (83.4) |
| Intermediate | 280 (12.2) | 180 (7.8) |
| Poor | 23 (1.0) | 200 (8.7) |
| Total cholesterol category at study examination | ||
| Ideal | 1445 (63.7) | 1439 (65.1) |
| Intermediate | 573 (25.3) | 564 (25.5) |
| Poor | 249 (11.0) | 207 (9.4) |
| Glucose category at study examination | ||
| Ideal | 2015 (87.5) | 2054 (92.4) |
| Intermediate | 167 (7.5) | |
| Poor | 287 (12.5) | 2 (0.1) |
| Smoking category at study examination | ||
| Ideal | 2208 (95.9) | |
| Poor | 94 (4.1) | |
| Cardiovascular health score at study examination, mean (SD) | 8.6 (1.4) out of 10 | 6.8 (1.3) out of 8 |
| Cardiovascular health category at study examination | ||
| All ideal metrics | 745 (32.8) | 821 (37.3) |
| ≥1 Intermediate (but 0 poor) metrics | 719 (31.7) | 801 (36.3) |
| 1 Poor metric | 669 (29.5) | 482 (21.9) |
| ≥2 Poor metrics | 137 (6.0) | 100 (4.5) |
Includes centers at Bellflower, California; Chicago, Illinois; and Cleveland, Ohio.
In Bridgetown, Barbados.
In Manchester and Belfast.
In Hong Kong Special Administrative Region of the People’s Republic of China.
In Bangkok.
In Toronto, Ontario.
Other includes Pacific Islander (n = 3), unlisted race/ethnicity group (n = 29), and race/ethnicity not reported (n = 3).
Figure 1. Frequencies of Offspring Cardiovascular Health (CVH) Statuses by Maternal Gestational CVH Status (N = 2302).
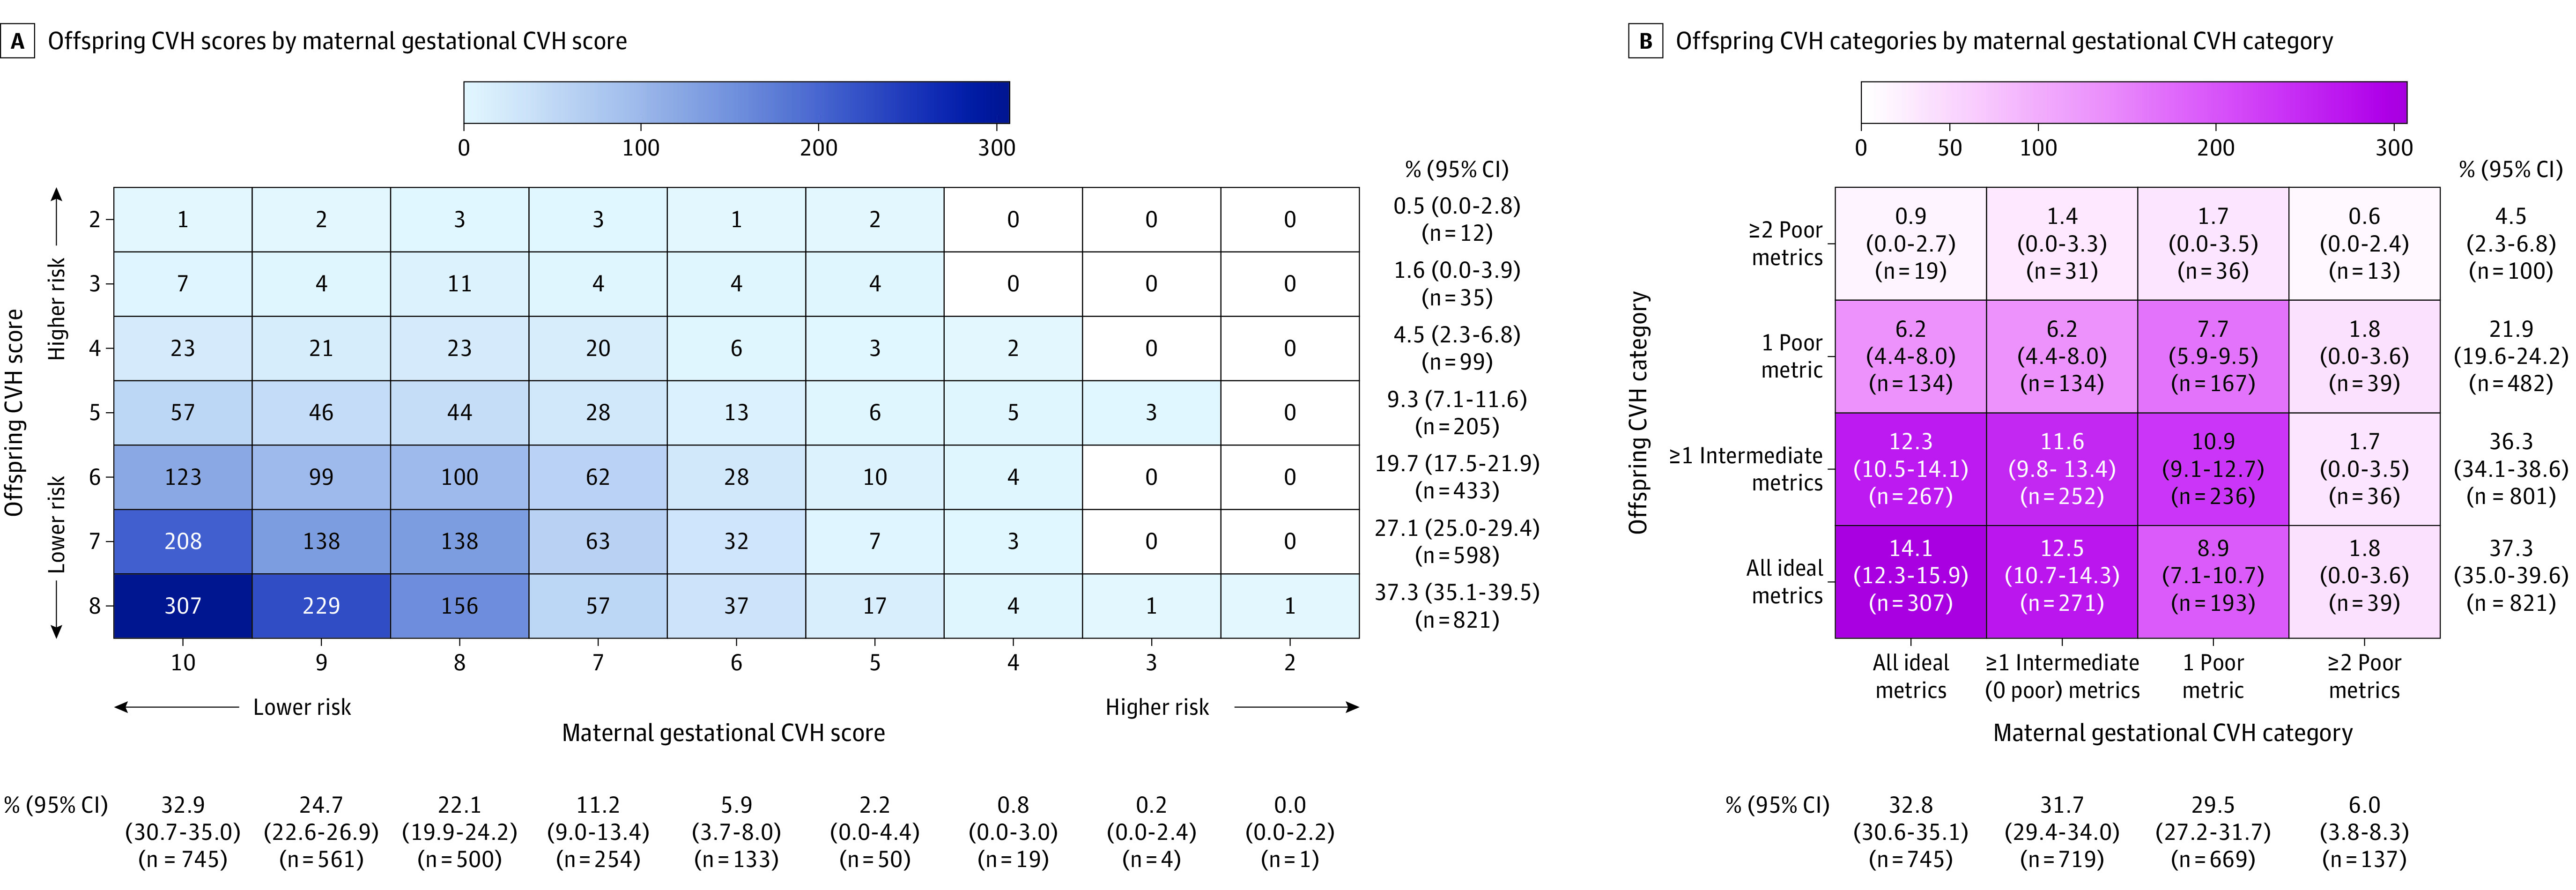
Absolute frequencies of maternal-offspring CVH combinations are indicated by the numerals and shading within the cells, and in panel B, corresponding percentages (with 95% CIs) are also shown within the cells. The frequencies and percentages of maternal and offspring CVH statuses within the total study sample are shown separately below and to the right of the heatmaps. In panel A, CVH scores lower than 2 were not observed for mothers or children and are not shown (n = 2170). In panel B, trend P values for differences in the distribution of offspring CVH categories between maternal gestational CVH categories were as follows: all ideal (vs any nonideal) gestational CVH metrics, <.001; 1 or more intermediate, but 0 poor (vs all ideal), metrics, .10; 1 poor (vs all ideal) metrics, <.001; and 2 or more poor (vs all ideal) metrics, <.001 (n = 2174).
Primary Analysis: Associations of Maternal Gestational CVH With Offspring CVH at Ages 10 to 14 Years
The frequencies of offspring CVH scores and categories by maternal CVH scores and categories are shown in Figure 1. Across worsening gestational CVH categories (Figure 1B), the prevalence of all ideal CVH metrics among offspring declined (from 42.2% [95% CI, 38.4%-46.2%] among offspring exposed to all ideal gestational CVH metrics to 30.7% [95% CI, 22.0%-40.4%] among offspring exposed to ≥2 poor gestational CVH metrics), and the prevalences of 1 poor metric and 2 or more poor metrics increased (from 18.4% [95% CI, 14.6%-22.4%] to 30.7% [95% CI, 22.0%-40.4%] and from 2.6% [95% CI, 0%-6.6%] to 10.2% [95% CI, 1.6%-20.0%], respectively). Differences in the distributions of offspring CVH categories across gestational CVH categories were statistically significant (see Figure 1B legend).
In adjusted models, each 1-point higher (of 10 possible) gestational CVH score was significantly associated with better offspring CVH, including a higher CVH score by 0.19 points (95% CI, 0.15-0.23) (of 8 possible), an RR of 1.15 (95% CI, 1.10-1.21) for having all ideal (vs any nonideal) CVH metrics, and an RR of 0.65 (95% CI, 0.58-0.72) for having 2 or more poor (vs all ideal) metrics at ages 10 to 14 years (Figure 2A and 2B, uppermost panels). There were graded associations of gestational CVH categories with risks for poorer offspring CVH (Figure 2A and 2B, lower panels; eTable 2 in the Supplement). For example, as shown in Figure 2B (estimates for ≥2 poor metrics in lower panels), for offspring exposed to 1 or more intermediate gestational CVH metrics compared with those exposed to all ideal gestational CVH metrics, the adjusted RR for 2 or more poor metrics at ages 10 to 14 years was 2.15 (95% CI, 1.23-3.75; crude frequencies, 4.5% [95% CI, 0.6%-8.7%] vs 2.6% [95% CI, 0.0%-6.6%] among offspring exposed to 1 or more intermediate vs all ideal gestational CVH metrics [Figure 1B]). These RRs were 3.32 (95% CI, 1.96-5.62) and 7.82 (95% CI, 4.12-14.85) for offspring exposed to 1 poor metric and 2 or more poor gestational CVH metrics, respectively (Figure 2B; see also Figure 1B for crude frequencies). Differences in these RRs across gestational CVH categories were statistically significant (P < .001, Figure 2B; eTable 2 in the Supplement).
Figure 2. Adjusted Associations of Maternal Gestational Cardiovascular Health (CVH) With Offspring CVH in Childhood.

Associations of maternal gestational CVH score and categories with offspring CVH score (A) and category (B) in childhood are shown. All estimates were adjusted for field center (each with a high level of demographic homogeneity), child sex and age at follow-up, and variables during the pregnancy examination, including age, height, parity, alcohol use, and gestational age (ie, model 2). The error bars indicate 95% CIs. For the maternal CVH category exposures, the P values shown are global P values from a 3-df omnibus test comparing the log likelihood of the model with the 4-level categorical maternal CVH variable vs that without it for each child outcome. The CVH score has a possible range of 0 to 10 points for pregnant mothers (observed range, 2-10 points) and 0 to 8 points for children (observed range, 2-8 points). The numbers of mother-child dyads in each combination of CVH scores and categories appear in Figure 1. Additional details appear in eTable 2 in the Supplement.
aGlobal P value.
Secondary Analyses: Single CVH Metrics and Perinatal Outcomes
The associations between individual metrics of maternal gestational CVH and offspring CVH are shown in Figure 3 and eTable 3 in the Supplement. In analyses of single maternal CVH metrics (Figure 3A; eTable 3 in the Supplement), each gestational metric, except smoking, was independently and significantly associated with total offspring CVH. In analyses of single offspring CVH metrics (Figure 3B; eTable 3 in the Supplement), gestational CVH scores were significantly associated with each child metric; gestational CVH categories were most consistently significantly associated with child BMI, but confidence intervals overlapped with those for other child metrics. In analyses examining single maternal and offspring metrics (Figure 3C; eTable 3 in the Supplement), each gestational CVH metric, except smoking, was independently and significantly associated with 1 or more offspring CVH metrics. At least 1 gestational CVH metric was independently and significantly associated with each of the 4 offspring CVH metrics; however, no single gestational CVH metric was significantly associated with all 4 offspring CVH metrics. Compared with any single gestational CVH metric, total gestational CVH was significantly associated with a wider range of single CVH metrics in offspring (Figure 3B and 3C; eTable 3 in the Supplement). Additionally, the strongest associations between maternal and offspring CVH were observed for total maternal CVH and total offspring CVH: adjusted RRs were up to 7.82 (95% CI, 4.12-14.85) for 2 or more poor metrics among mothers and 2 or more poor metrics among offspring (crude frequencies of 10.2% [95% CI, 1.6%-20.0%] vs 2.6% [95% CI, 0.0%-6.6%] among offspring exposed to 2 or more poor metrics vs all ideal gestational CVH metrics; Figure 2B, bottom panel; eTable 2 in the Supplement; and Figure 1B) vs up to 2.61 (95% CI, 1.70-4.01) for a single maternal metric (nonideal BMI) and 2 or more poor metrics among offspring (crude frequencies of 7.1% [95% CI, 3.4%-11.0%] vs 3.1% [95% CI, 0.3%-5.9%] among offspring exposed to nonideal vs ideal gestational BMI; Figure 3A; eTable 3 in the Supplement).
Figure 3. Heatmap of Adjusted Associations Between Individual Metrics of Maternal Gestational Cardiovascular Health (CVH) and Offspring CVH.
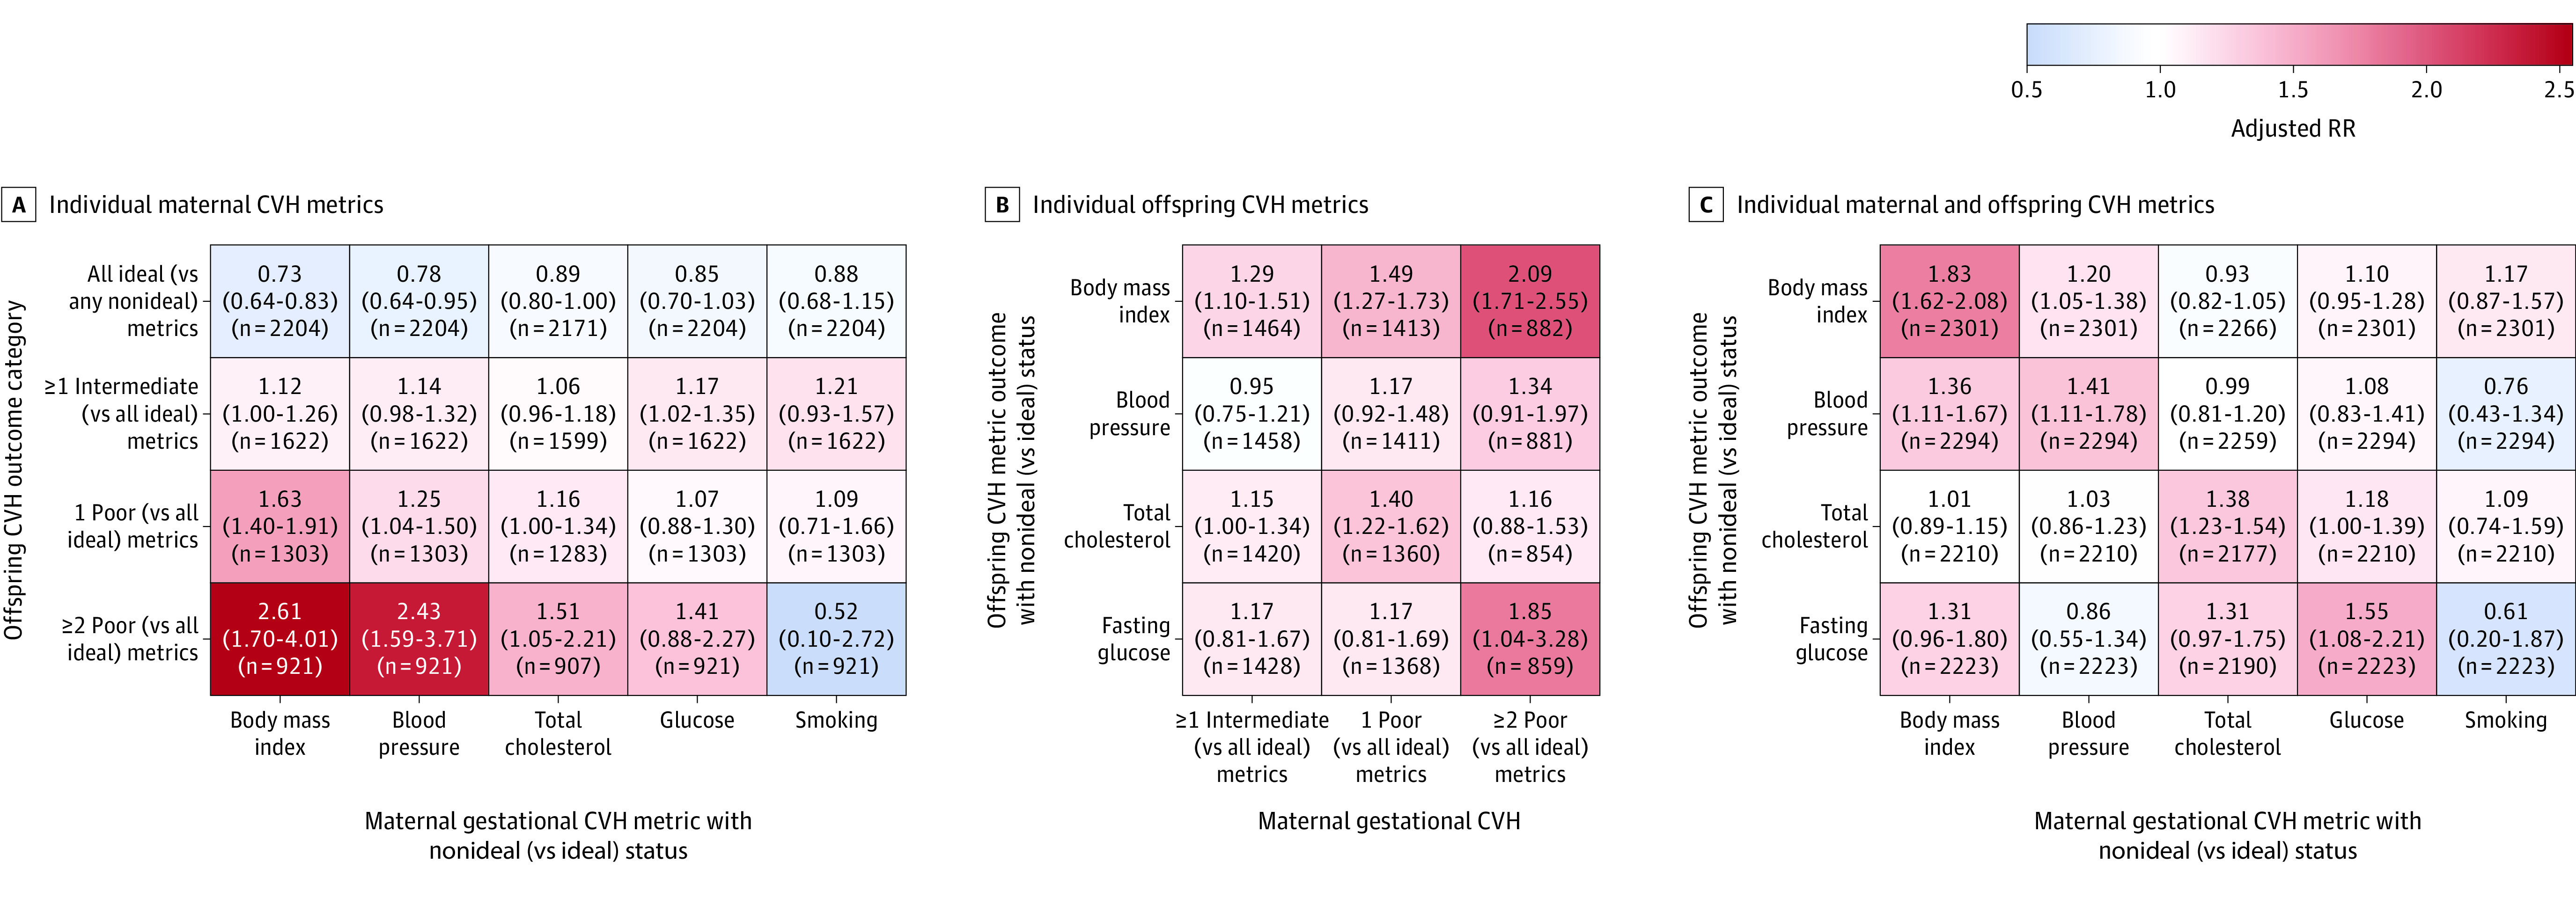
The heatmaps are shaded according to the adjusted relative risks (RRs) for associations between maternal gestational CVH metrics (A and C) or categories (B) and offspring childhood CVH metrics (B and C) or categories (A). Adjusted RR estimates (with 95% CIs) and sample sizes are shown within the cells. All estimates were adjusted for field center (each with a high level of demographic homogeneity); child sex and age at follow-up; maternal variables during the pregnancy examination, including age, height, parity, alcohol use, and gestational age, as well as levels (ideal vs nonideal [intermediate/poor]) of each of the other 4 gestational CVH metrics (except when total gestational CVH is the exposure). Additional details appear in eTable 3 in the Supplement.
In analyses adjusting for categorical pregnancy and birth outcomes, significant gestational CVH–offspring CVH associations were attenuated but persisted (eTable 2 in the Supplement, right columns). For example, the RR for the association between 2 or more poor metrics among mothers and 2 or more poor metrics among offspring was 7.82 (95% CI, 4.12-14.85) in the primary analysis, 6.49 (95% CI, 3.31-12.75) after adjustment for commonly available birth factors (clinical model), and 6.23 (95% CI, 3.03-12.82) after adjustment for an extended set of birth factors (extended model). When gestational CVH was defined only by maternal BMI, total cholesterol level, and smoking status, and adjustment was made for the most comprehensive set of birth factors (including hypertensive disorders of pregnancy and gestational diabetes), this RR was 4.92 (95% CI, 1.41-17.18; crude frequencies of 8.6% [95% CI, 0%-27.9%] vs 2.6% [95% CI, 0%-6.4%] for 2 or more poor vs all ideal gestational metrics).
Sensitivity Analyses
Gestational CVH–offspring CVH associations were robust to all sensitivity analyses, including (1) adjustment for child Tanner stage, (2) exclusion of underweight mothers and children, (3) definition of the gestational CVH lipid metric using triglyceride (instead of total cholesterol) levels, and (4) definition of the offspring CVH glucose metric with a composite of fasting and 2-hour postload glucose levels and hemoglobin A1C level (eFigures 1, 2, 3, 4, and 5 in the Supplement). See eResults in the Supplement for details.
Discussion
The primary finding of this study was that better maternal CVH at 24 to 32 weeks’ gestation was significantly associated with better offspring CVH at ages 10 to 14 years. To our knowledge, this study is the first to examine the relevance of maternal gestational CVH for offspring CVH.
Single, adverse risk factors during pregnancy (defined here as poor levels of individual CVH metrics), including obesity,27 hypertension,28 diabetes,14 dyslipidemia,29 and smoking,30 have been significantly associated with later offspring cardiovascular risk factors in prior studies. However, single risk factors such as these are less common than suboptimal total CVH; in the United States, more than 90% of pregnant women have suboptimal CVH levels,20 whereas even obesity (which is common, with a 24.3% prepregnancy obesity rate31) is far less common than suboptimal CVH. Moreover, in the current study, no single risk factor drove the significant associations with offspring CVH, underscoring the relevance of gestational CVH as a composite indicator of fetal cardiometabolic exposures.
Given these findings, gestational CVH may merit further study as a potential prenatal target for prevention of poor CVH by adolescence in offspring. Because CVH is broadly applicable for adults and youths outside of pregnancy,7,32 clinical use of CVH during pregnancy as well could provide a consistent and relatively simple means of monitoring and messaging global health across the life course. Biologically, it is plausible that gestational CVH could directly affect long-term offspring CVH through, for example, epigenetic modifications1,27,33 or disrupted organ development1,28 in the fetus. However, gestational CVH is likely also a marker of both genetic susceptibility and family lifestyle habits that may be passed from mother to child. Additional research is needed to determine whether improvement in maternal CVH during pregnancy affects long-term CVH in the offspring.
Postnatally, knowledge of maternal gestational CVH level may have clinical utility to identify newborns at higher risk for poor CVH by early adolescence, even beyond other measures available at birth. In a previous analysis of HAPO data, gestational CVH was significantly associated with risks for adverse pregnancy outcomes,9 including some (preeclampsia,34 high and low birthweight35) known to be significantly associated with later cardiometabolic health among offspring. However, in the current analysis, the significant associations between gestational CVH and offspring CVH were not fully explained by perinatal outcomes. Because clinical methods to comprehensively characterize newborn CVH are currently lacking (AHA defines no CVH metrics for ages <2 years6), maternal gestational CVH may provide an alternative means to target postnatal preventive strategies to high-risk newborns. The ability to identify such newborns may be useful regardless of the relative contributions of in utero effects, shared genetics, and shared lifestyle to the maternal-offspring CVH associations, but mechanistic knowledge will be needed to optimize intervention strategies.36
Strengths of this study include geographic and racial/ethnic diversity of participants, high-quality CVH measurements, and the multiple secondary and sensitivity analyses.
Limitations
This study has several limitations. First, the cohort did not include mothers with pregestational diabetes, mothers with severe gestational diabetes (based on prior, more restrictive diagnostic criteria), or offspring who were born preterm; these exclusions of more extreme cardiometabolic risk phenotypes may have biased associations toward the null, and studies including these potentially higher-risk groups are needed.
Second, CVH was characterized at a single point during pregnancy: at 28 weeks’ gestation. Further study is needed to determine whether implications of maternal CVH for offspring vary across gestation and thus whether interventions may be most effective, for example, earlier in pregnancy.
Third, although the study used available pregnancy-specific clinical guidelines to inform the gestational CVH metric definitions in this analysis, the cut points are somewhat arbitrary, particularly for total cholesterol (for which guidelines do not exist); research is needed to better define CVH across pregnancy.
Fourth, gestational diet and physical activity data were unavailable. Although CVH based on 5 metrics has precedent9,15 and may be more clinically applicable, gestational diet and exercise have also been significantly associated with offspring health,37 and studies incorporating all 7 metrics are needed.
Fifth, this analysis lacked data on prepregnancy maternal CVH, mother-offspring genotype correlations, family lifestyle, and mother and offspring health during the 10 to 14 years between delivery and follow-up. Investigations of mechanisms of intergenerational CVH transfer would benefit from more data outside of pregnancy.
Conclusions
In this multinational cohort, better maternal CVH at 28 weeks’ gestation was significantly associated with better offspring CVH at ages 10 to 14 years.
eMethods
eResults
eTable 1. Missing Data Among 2,302 Mother-Child Dyads in the Ancillary Study (Primary Analytic Sample)
eTable 2. Adjusted Associations of Maternal Gestational (Mean 28 Weeks’ Gestation) Cardiovascular Health with Offspring Cardiovascular Health in Childhood
eTable 3. Adjusted Associations between Individual Metrics of Maternal Gestational Cardiovascular Health and Offspring Childhood Cardiovascular Health
eFigure 1. Sensitivity Analyses of Associations of Maternal Gestational Cardiovascular Health with Offspring Cardiovascular Health Score in Childhood
eFigure 2. Sensitivity Analyses of Associations of Maternal Gestational Cardiovascular Health with Offspring All Ideal (versus Any Non-Ideal) Cardiovascular Health Metrics in Childhood
eFigure 3. Sensitivity Analyses of Associations of Maternal Gestational Cardiovascular Health with Offspring 1 or More Intermediate (versus All Ideal) Cardiovascular Health Metrics in Childhood
eFigure 4. Sensitivity Analyses of Associations of Maternal Gestational Cardiovascular Health with Offspring 1 Poor (versus All Ideal) Cardiovascular Health Metric in Childhood
eFigure 5. Sensitivity Analyses of Associations of Maternal Gestational Cardiovascular Health with Offspring 2 or More Poor (versus All Ideal) Cardiovascular Health Metrics in Childhood
eReferences
eAppendix. HAPO Follow-Up Study Cooperative Research Group Members
References
- 1.Palinski W Effect of maternal cardiovascular conditions and risk factors on offspring cardiovascular disease. Circulation. 2014;129(20):2066-2077. doi: 10.1161/CIRCULATIONAHA.113.001805 [DOI] [PMC free article] [PubMed] [Google Scholar]
- 2.Reynolds RM, Allan KM, Raja EA, et al. . Maternal obesity during pregnancy and premature mortality from cardiovascular event in adult offspring: follow-up of 1 323 275 person years. BMJ. 2013;347:f4539. doi: 10.1136/bmj.f4539 [DOI] [PMC free article] [PubMed] [Google Scholar]
- 3.Yu Y, Arah OA, Liew Z, et al. . Maternal diabetes during pregnancy and early onset of cardiovascular disease in offspring: population based cohort study with 40 years of follow-up. BMJ. 2019;367:l6398. doi: 10.1136/bmj.l6398 [DOI] [PMC free article] [PubMed] [Google Scholar]
- 4.Hammad IA, Meeks H, Fraser A, et al. . Risks of cause-specific mortality in offspring of pregnancies complicated by hypertensive disease of pregnancy. Am J Obstet Gynecol. 2020;222(1):75.e1-75.e9. doi: 10.1016/j.ajog.2019.07.024 [DOI] [PubMed] [Google Scholar]
- 5.Rose G Strategy of prevention: lessons from cardiovascular disease. Br Med J (Clin Res Ed). 1981;282(6279):1847-1851. doi: 10.1136/bmj.282.6279.1847 [DOI] [PMC free article] [PubMed] [Google Scholar]
- 6.Lloyd-Jones DM, Hong Y, Labarthe D, et al. ; American Heart Association Strategic Planning Task Force and Statistics Committee . Defining and setting national goals for cardiovascular health promotion and disease reduction: the American Heart Association’s strategic Impact Goal through 2020 and beyond. Circulation. 2010;121(4):586-613. doi: 10.1161/CIRCULATIONAHA.109.192703 [DOI] [PubMed] [Google Scholar]
- 7.Virani SS, Alonso A, Benjamin EJ, et al. ; American Heart Association Council on Epidemiology and Prevention Statistics Committee and Stroke Statistics Subcommittee . Heart disease and stroke statistics-2020 update: a report from the American Heart Association. Circulation. 2020;141(9):e139-e596. doi: 10.1161/CIR.0000000000000757 [DOI] [PubMed] [Google Scholar]
- 8.Brown HL, Warner JJ, Gianos E, et al. ; American Heart Association and the American College of Obstetricians and Gynecologists . Promoting risk identification and reduction of cardiovascular disease in women through collaboration with obstetricians and gynecologists: a presidential advisory from the American Heart Association and the American College of Obstetricians and Gynecologists. Circulation. 2018;137(24):e843-e852. doi: 10.1161/CIR.0000000000000582 [DOI] [PubMed] [Google Scholar]
- 9.Perak AM, Lancki N, Kuang A, et al. ; Hyperglycemia and Adverse Pregnancy Outcome (HAPO) Study Cooperative Research Group . Associations of gestational cardiovascular health with pregnancy outcomes: the Hyperglycemia and Adverse Pregnancy Outcome study. Am J Obstet Gynecol. 2020;S0002-9378(20)30828-0. doi: 10.1161/circ.141.suppl_1.33 [DOI] [PMC free article] [PubMed] [Google Scholar]
- 10.Metzger BE, Gabbe SG, Persson B, et al. ; International Association of Diabetes and Pregnancy Study Groups Consensus Panel . International association of diabetes and pregnancy study groups recommendations on the diagnosis and classification of hyperglycemia in pregnancy. Diabetes Care. 2010;33(3):676-682. doi: 10.2337/dc09-1848 [DOI] [PMC free article] [PubMed] [Google Scholar]
- 11.HAPO Study Cooperative Research Group The Hyperglycemia and Adverse Pregnancy Outcome (HAPO) Study. Int J Gynaecol Obstet. 2002;78(1):69-77. doi: 10.1016/S0020-7292(02)00092-9 [DOI] [PubMed] [Google Scholar]
- 12.Nesbitt GS, Smye M, Sheridan B, Lappin TR, Trimble ER; HAPO Study Cooperative Research Group . Integration of local and central laboratory functions in a worldwide multicentre study: experience from the Hyperglycemia and Adverse Pregnancy Outcome (HAPO) Study. Clin Trials. 2006;3(4):397-407. doi: 10.1177/1740774506070695 [DOI] [PubMed] [Google Scholar]
- 13.Metzger BE, Lowe LP, Dyer AR, et al. ; HAPO Study Cooperative Research Group . Hyperglycemia and adverse pregnancy outcomes. N Engl J Med. 2008;358(19):1991-2002. doi: 10.1056/NEJMoa0707943 [DOI] [PubMed] [Google Scholar]
- 14.Lowe WL Jr, Scholtens DM, Lowe LP, et al. ; HAPO Follow-up Study Cooperative Research Group . Association of gestational diabetes with maternal disorders of glucose metabolism and childhood adiposity. JAMA. 2018;320(10):1005-1016. doi: 10.1001/jama.2018.11628 [DOI] [PMC free article] [PubMed] [Google Scholar]
- 15.Allen NB, Zhao L, Liu L, et al. . Favorable cardiovascular health, compression of morbidity, and healthcare costs: forty-year follow-up of the CHA Study (Chicago Heart Association Detection Project in Industry). Circulation. 2017;135(18):1693-1701. doi: 10.1161/CIRCULATIONAHA.116.026252 [DOI] [PMC free article] [PubMed] [Google Scholar]
- 16.ACOG Practice Bulletin No. 202: gestational hypertension and preeclampsia. Obstet Gynecol. 2019;133(1):1. doi: 10.1097/AOG.0000000000003018 [DOI] [PubMed] [Google Scholar]
- 17.Committee Opinion No. 721 summary: smoking cessation during pregnancy. Obstet Gynecol. 2017;130(4):1. doi: 10.1097/AOG.0000000000002348 [DOI] [PubMed] [Google Scholar]
- 18.HAPO Study Cooperative Research Group Hyperglycaemia and Adverse Pregnancy Outcome (HAPO) Study: associations with maternal body mass index. BJOG. 2010;117(5):575-584. doi: 10.1111/j.1471-0528.2009.02486.x [DOI] [PubMed] [Google Scholar]
- 19.Abbassi-Ghanavati M, Greer LG, Cunningham FG. Pregnancy and laboratory studies: a reference table for clinicians. Obstet Gynecol. 2009;114(6):1326-1331. doi: 10.1097/AOG.0b013e3181c2bde8 [DOI] [PubMed] [Google Scholar]
- 20.Perak AM, Ning H, Khan SS, Van Horn LV, Grobman WA, Lloyd-Jones DM. Cardiovascular health among pregnant women, aged 20 to 44 years, in the United States. J Am Heart Assoc. 2020;9(4):e015123. doi: 10.1161/JAHA.119.015123 [DOI] [PMC free article] [PubMed] [Google Scholar]
- 21.van Sloten TT, Tafflet M, Périer MC, et al. . Association of change in cardiovascular risk factors with incident cardiovascular events. JAMA. 2018;320(17):1793-1804. doi: 10.1001/jama.2018.16975 [DOI] [PMC free article] [PubMed] [Google Scholar]
- 22.Cole TJ, Lobstein T. Extended international (IOTF) body mass index cut-offs for thinness, overweight and obesity. Pediatr Obes. 2012;7(4):284-294. doi: 10.1111/j.2047-6310.2012.00064.x [DOI] [PubMed] [Google Scholar]
- 23.Flynn JT, Kaelber DC, Baker-Smith CM, et al. ; Subcommittee on Screening and Management of High Blood Pressure in Children . Clinical practice guideline for screening and management of high blood pressure in children and adolescents. Pediatrics. 2017;140(3):e20171904. doi: 10.1542/peds.2017-1904 [DOI] [PubMed] [Google Scholar]
- 24.National Heart, Lung, and Blood Institute Expert panel on integrated guidelines for cardiovascular health and risk reduction in children and adolescents: full report. Published October 2012. Accessed August 21, 2020. https://www.nhlbi.nih.gov/health-pro/guidelines/current/cardiovascular-health-pediatric-guidelines
- 25.American Diabetes Association 2. Classification and diagnosis of diabetes: standards of medical care in diabetes-2020. Diabetes Care. 2020;43(suppl 1):S14-S31. doi: 10.2337/dc20-S002 [DOI] [PubMed] [Google Scholar]
- 26.R Core Team R: A language and environment for statistical computing. R Project for Statistical Computing. Accessed April 8, 2020. https://www.R-project.org/
- 27.Godfrey KM, Reynolds RM, Prescott SL, et al. . Influence of maternal obesity on the long-term health of offspring. Lancet Diabetes Endocrinol. 2017;5(1):53-64. doi: 10.1016/S2213-8587(16)30107-3 [DOI] [PMC free article] [PubMed] [Google Scholar]
- 28.Paauw ND, van Rijn BB, Lely AT, Joles JA. Pregnancy as a critical window for blood pressure regulation in mother and child: programming and reprogramming. Acta Physiol (Oxf). 2017;219(1):241-259. doi: 10.1111/apha.12702 [DOI] [PubMed] [Google Scholar]
- 29.Daraki V, Georgiou V, Papavasiliou S, et al. . Metabolic profile in early pregnancy is associated with offspring adiposity at 4 years of age: the Rhea pregnancy cohort Crete, Greece. PLoS One. 2015;10(5):e0126327. doi: 10.1371/journal.pone.0126327 [DOI] [PMC free article] [PubMed] [Google Scholar]
- 30.Oken E, Levitan EB, Gillman MW. Maternal smoking during pregnancy and child overweight: systematic review and meta-analysis. Int J Obes (Lond). 2008;32(2):201-210. doi: 10.1038/sj.ijo.0803760 [DOI] [PMC free article] [PubMed] [Google Scholar]
- 31.Singh GK, DiBari JN. Marked disparities in pre-pregnancy obesity and overweight prevalence among us women by race/ethnicity, nativity/immigrant status, and sociodemographic characteristics, 2012-2014. J Obes. 2019;2019:2419263. doi: 10.1155/2019/2419263 [DOI] [PMC free article] [PubMed] [Google Scholar]
- 32.Laitinen TT, Pahkala K, Magnussen CG, et al. . Ideal cardiovascular health in childhood and cardiometabolic outcomes in adulthood: the Cardiovascular Risk in Young Finns Study. Circulation. 2012;125(16):1971-1978. doi: 10.1161/CIRCULATIONAHA.111.073585 [DOI] [PubMed] [Google Scholar]
- 33.de Nigris F, Cacciatore F, Mancini FP, et al. . Epigenetic hallmarks of fetal early atherosclerotic lesions in humans. JAMA Cardiol. 2018;3(12):1184-1191. doi: 10.1001/jamacardio.2018.3546 [DOI] [PMC free article] [PubMed] [Google Scholar]
- 34.Andraweera PH, Lassi ZS. Cardiovascular risk factors in offspring of preeclamptic pregnancies: systematic review and meta-analysis. J Pediatr. 2019;208:104-113.e6. doi: 10.1016/j.jpeds.2018.12.008 [DOI] [PubMed] [Google Scholar]
- 35.Knop MR, Geng TT, Gorny AW, et al. . Birth weight and risk of type 2 diabetes mellitus, cardiovascular disease, and hypertension in adults: a meta-analysis of 7 646 267 participants from 135 studies. J Am Heart Assoc. 2018;7(23):e008870. doi: 10.1161/JAHA.118.008870 [DOI] [PMC free article] [PubMed] [Google Scholar]
- 36.Daniels SR, Pratt CA, Hollister EB, et al. . Promoting cardiovascular health in early childhood and transitions in childhood through adolescence: a workshop report. J Pediatr. 2019;209:240-251.e1. doi: 10.1016/j.jpeds.2019.01.042 [DOI] [PubMed] [Google Scholar]
- 37.van Elten TM, Karsten MDA, van Poppel MNM, et al. . Diet and physical activity in pregnancy and offspring’s cardiovascular health: a systematic review. J Dev Orig Health Dis. 2019;10(3):286-298. doi: 10.1017/S204017441800082X [DOI] [PubMed] [Google Scholar]
Associated Data
This section collects any data citations, data availability statements, or supplementary materials included in this article.
Supplementary Materials
eMethods
eResults
eTable 1. Missing Data Among 2,302 Mother-Child Dyads in the Ancillary Study (Primary Analytic Sample)
eTable 2. Adjusted Associations of Maternal Gestational (Mean 28 Weeks’ Gestation) Cardiovascular Health with Offspring Cardiovascular Health in Childhood
eTable 3. Adjusted Associations between Individual Metrics of Maternal Gestational Cardiovascular Health and Offspring Childhood Cardiovascular Health
eFigure 1. Sensitivity Analyses of Associations of Maternal Gestational Cardiovascular Health with Offspring Cardiovascular Health Score in Childhood
eFigure 2. Sensitivity Analyses of Associations of Maternal Gestational Cardiovascular Health with Offspring All Ideal (versus Any Non-Ideal) Cardiovascular Health Metrics in Childhood
eFigure 3. Sensitivity Analyses of Associations of Maternal Gestational Cardiovascular Health with Offspring 1 or More Intermediate (versus All Ideal) Cardiovascular Health Metrics in Childhood
eFigure 4. Sensitivity Analyses of Associations of Maternal Gestational Cardiovascular Health with Offspring 1 Poor (versus All Ideal) Cardiovascular Health Metric in Childhood
eFigure 5. Sensitivity Analyses of Associations of Maternal Gestational Cardiovascular Health with Offspring 2 or More Poor (versus All Ideal) Cardiovascular Health Metrics in Childhood
eReferences
eAppendix. HAPO Follow-Up Study Cooperative Research Group Members