

Abstract
The aim of the study is to analyze viruses using parameters obtained from distributions of nucleotide sequences in the viral RNA. Seeking for the input data homogeneity, we analyze single-stranded RNA viruses only. Two approaches are used to obtain the nucleotide sequences; In the first one, chunks of equal length (four nucleotides) are considered. In the second approach, the whole RNA genome is divided into parts by adenine or the most frequent nucleotide as a “space”. Rank–frequency distributions are studied in both cases. The defined nucleotide sequences are signs comparable to a certain extent to syllables or words as seen from the nature of their rank–frequency distributions. Within the first approach, the Pólya and the negative hypergeometric distribution yield the best fit. For the distributions obtained within the second approach, we have calculated a set of parameters, including entropy, mean sequence length, and its dispersion. The calculated parameters became the basis for the classification of viruses. We observed that proximity of viruses on planes spanned on various pairs of parameters corresponds to related species. In certain cases, such a proximity is observed for unrelated species as well calling thus for the expansion of the set of parameters used in the classification. We also observed that the fifth most frequent nucleotide sequences obtained within the second approach are of different nature in case of human coronaviruses (different nucleotides for MERS, SARS-CoV, and SARS-CoV-2 versus identical nucleotides for four other coronaviruses). We expect that our findings will be useful as a supplementary tool in the classification of diseases caused by RNA viruses with respect to severity and contagiousness.
Keywords: RNA virus, Coronavirus, Nucleotide sequence, Rank–frequency distribution
Introduction
Studies of genomes based on linguistic approaches date a few decades back (Brendel et al. 1986; Pevzner et al. 1989; Searls 1992; Botstein and Cherry 1997; Gimona 2006; Faltýnek et al. 2019; Ji 2020). An interplay with methods of statistical physics as well as theory of complex systems brought new insights into biology (Dehmer et al. 2009; Qian 2013). Studies range from attempted n-gram-based classification of genomes (Tomović et al. 2006; Huang and Yu 2016) to algorithms for optimal segmentation of RNAs in secondary structure predictions (Licon et al. 2010) and analysis of substitution rates of coding genes during evolution (Lin et al. 2019), just to mention a few. Various types of sequences in genomes are related to multiple genetic codes (Trifonov et al. 2012) and can be studied both using quantitative linguistic point of view (Ferrer-i-Cancho et al. 2013; Ferrer-i-Cancho et al. 2014) and from a wider perspective, within more abstract approaches (Neuman and Nave 2008; Barbieri 2012). Recently, neural networks and deep learning algorithms emerged as new tools to analyze nucleotide sequences (Fang et al. 2019; Singh et al. 2019; Melkus et al. 2020; Ren et al. 2020) offering wider prospects for studies of genomes. Viruses, balancing on the fuzzy border between non-alive and alive, hence remaining on the verge of life (Villarreal 2004; Kolb 2007; Carsetti 2020), are within the most interesting subjects of studies.
The aim of the present Letter is to draw attention to simple treatments of nucleotide sequences in viral RNAs by means of new parameters, which can be immediately extracted from genome data. We expect that such parameters can be potentially used as an auxiliary tool in the classification of viruses (cf., in particular, Wang 2013). The idea of this study is linked to the recent COVID-19 outbreak, and the analysis started from comparing human coronaviruses (Su et al. 2016; Wu et al. 2020) and some other viruses. To achieve relative homogeneity of the material, we restrict our sample to single-stranded RNA viruses only. Both positive- and negative-sense RNAs are considered. For future reference, we also include two retroviruses, HIV-1 and HIV-2.
The paper is organized as follows. Summary of data and description of methods are given in “Data and Methods” section. Results are presented in “Results” section. Finally, brief discussion is given in “Discussion” section.
Data and Methods
The viral genomes are taken from the databases of the National Center for Biotechnology Information (NCBI, https://www.ncbi.nlm.nih.gov); the complete list is given in Table 1. Note that coronaviruses have rather long RNA genomes of ca. 30 kilobases (kba), which might bias the values of calculated parameters. To study the effect of RNA sizes, we also include some very short genomes, namely, Hepatitis D virus with 1682 ba (Saldanha et al. 1990) and Phage MS2 virus with 3569 ba (de Smit and van Duin 1993), as well as two longest known RNA viruses, Ball python nidovirus with 33452 ba (Gorbalenya et al. 2006) and Planidovirus with 41178 ba (Saberi et al. 2018). Still, the sizes of RNA viruses are much more homogeneous (the difference is up to 25 times) than those of DNA ones, which may vary by about four orders of magnitude (Campillo-Balderas et al. 2015).
Table 1.
Viruses analyzed in the work
| No. | Short name | Full name | Typea | Size (bases) | NCBI sourceb |
|---|---|---|---|---|---|
| 1 | A/H1N1 | Influenza A virus (A/swine/La Habana/ 130/2010(H1N1)) | (−) | 13371 | HE584753.1 … HE584760.1 |
| 2 | Ball python nidovirus | Ball python nidovirus 1 | (+) | 33452 | 674660326 |
| 3 | Dengue | Dengue virus 2 | (+) | 10723 | 158976983 |
| 4 | Ebola | Zaire ebolavirus | (−) | 18962 | MK672824.1 |
| 5 | Feline-CoV | Feline infectious peritonitis virus | (+) | 29355 | 315192962 |
| 6 | HCoV-229E | Human coronavirus 229E | (+) | 27317 | 12175745 |
| 7 | HCoV-HKU1 | Human coronavirus HKU1 | (+) | 29926 | 85667876 |
| 8 | HCoV-NL63 | Human coronavirus NL63 | (+) | 27553 | 49169782 |
| 9 | HCoV-OC43 | Human coronavirus OC43 | (+) | 30741 | 1578871709 |
| 10 | Hepatitis A | Hepatovirus A | (+) | 7478 | NC_001489.1 |
| 11 | Hepatitis C | Hepatitis C virus genotype 1 | (+) | 9646 | 22129792 |
| 12 | Hepatitis D | Hepatitis delta virus | (−) | 1682 | 13277517 |
| 13 | Hepatitis E | Hepatitis E virus | (+) | 7176 | NC_001434.1 |
| 14 | HIV-1 | Human immunodeficiency virus 1 | (retro) | 9181 | 9629357 |
| 15 | HIV-2 | Human immunodeficiency virus 2 | (retro) | 10359 | 9628880 |
| 16 | HRV-A | Human rhinovirus A1 | (+) | 7137 | 1464306962 |
| 17 | HRV-B | Human rhinovirus B3 | (+) | 7208 | 1464306975 |
| 18 | HRV-C | Human rhinovirus NAT001 | (+) | 6944 | 1464310212 |
| 19 | Marburg | Lake Victoria marburgvirus - Ravn | (−) | 19114 | DQ447649.1 |
| 20 | Measles | Measles virus strain Edmonston | (−) | 15894 | AF266290.1 |
| 21 | MERS | Middle East respiratory syndrome coronavirus | (+) | 30119 | 667489388 |
| 22 | Norovirus | Norovirus Hu/GI.1/ CHA6A003_20091104/ | (+) | 7600 | KF039737.1 |
| 2009/USA | |||||
| 23 | Phage MS2 | Enterobacteria phage MS2 | (+) | 3569 | 176120924 |
| 24 | Planidovirus | Planarian secretory cell nidovirus | (+) | 41178 | 1571803928 |
| 25 | Polio | Poliovirus (Enterovirus C) | (+) | 7440 | NC_002058.3 |
| 26 | Rabies | Rabies virus strain SRV9 | (−) | 11928 | AF499686.2 |
| 27 | SARS | Severe acute respiratory syndrome coronavirus | (+) | 29751 | 30271926 |
| 28 | SARS-CoV-2 | Severe acute respiratory syndrome coronavirus 2 | (+) | 29903 | NC_045512 |
| 29 | Yellow fever | Yellow fever virus | (+) | 10862 | NC_002031.1 g-max |
| 30 | Zika | Zika virus | (+) | 10794 | 226377833 g-max |
a Negative-sense RNA (−), positive-sense RNA (+) or retro
b All addresses should be prefixed by https://www.ncbi.nlm.nih.gov/nuccore/
We use two approaches to define nucleotide sequences. The first one is based on cutting an RNA genome into chunks of equal length of n nucleotides. The second approach is rooted in linguistics, so that the most frequent nucleotide is treated as a “space” dividing a RNA into “words” of different lengths (Rovenchak 2018). Note also distantly related units applied in the analysis of the human DNA, so called motifs (Liang 2014).
To demonstrate the first approach, with equal-length chunks, let us consider the Ebolavirus genome, starting with the following nucleotide sequence:
| 1 |
Choosing the chunk length n = 4, we obtain:
| 2 |
Eventually, for RNA length not being multiples of four, the last chunk can have one to three nucleotides. Obviously, the number of all possible 4-nucleotide combinations is 44 = 256. Note that longer chunks would yield much higher variety of combinations with frequencies being distributed very smoothly. On the other hand, we would like to avoid studies of shorter chunks, like three-nucleotide sequences corresponding to codons. So, the length n = 4 seems optimal for our analysis.
In the second approach, the same Ebolavirus sequence (1) can be split using the most frequent nucleotide – adenine – as a “space” into the following:
| 3 |
The “X” stands for a zero-length element inserted between two consecutive “A”s.
We have also applied peculiar treatment of the Influenza A virus (H1N1) by adding spaces between each of eight segments of its RNA in the first and second approaches.
In both approaches, we calculate the frequencies of obtained nucleotide chunks within a given genome split in the respective manner and compile the rank–frequency distributions. The latter are obtained in a standard manner as follows: the most frequent item has rank 1, the second most frequent one has rank 2 and so on. Items with equal frequencies are given consecutive ranks in a random order, which is not relevant.
Results
The rank–frequency distributions obtained using the first approach – with 4-nucleotide chunks – were analyzed using a special software, AltmannFitter 2.1 (Altmann 2000). We found that two discrete distributions describe the obtained data with the highest precision, so called 1-displaced negative hypergeometric distribution (Grzybek 2007; Wilson 2013):
| 4 |
and Pólya distribution (Wimmer and Altmann 1999; Johnson et al. 2005):
| 5 |
Absolute frequencies are obtained by multiplying pr by the sample size N. In most cases, the discrepancy coefficient C = χ2/N is smaller than 0.02, which is considered a good fit (Mačutek 2008). Typical rank–frequency distributions and respective fits are shown in Fig. 1. Complete data are summarized in Table 2 and visualized in Fig. 2.
Fig. 1.

Typical rank–frequency distributions of four-nucleotide chunks and respective fits. The left panel shows the data for MERS and the fit with the hypergometric distribution, which is one of the best (C = 0.0011). The right panel demonstrated the worst fit obtained for the Hepatitis D virus data fit with the Pólya distribution (C = 0.0342)
Table 2.
Fitting parameters for the distributions of four-nucleotide chunks
| Virus | Entropy | Size | Negative hypergeometric distribution | Pólya distribution | ||||||
|---|---|---|---|---|---|---|---|---|---|---|
| S4 | (chunks) | K | M | n | C | s | p | n | C | |
| A/H1N1 | 5.3515 | 3345 | 2.4536 | 0.7918 | 258 | 0.0057 | 0.4156 | 0.3209 | 259 | 0.0060 |
| Ball python nidov. | 5.3385 | 8363 | 2.1873 | 0.7087 | 256 | 0.0043 | 0.4711 | 0.3227 | 256 | 0.0050 |
| Dengue | 5.3219 | 2681 | 2.3958 | 0.7561 | 256 | 0.0051 | 0.4270 | 0.3144 | 256 | 0.0055 |
| Ebola | 5.4002 | 4741 | 2.3911 | 0.8336 | 256 | 0.0008 | 0.4154 | 0.3462 | 256 | 0.0010 |
| Feline-CoV | 5.3357 | 7339 | 2.7359 | 0.8759 | 257 | 0.0011 | 0.3647 | 0.3186 | 257 | 0.0011 |
| HCoV-229E | 5.2899 | 6830 | 2.6172 | 0.7907 | 256 | 0.0014 | 0.3772 | 0.3007 | 257 | 0.0013 |
| HCoV-HKU1 | 5.1491 | 7482 | 2.7836 | 0.7153 | 260 | 0.0057 | 0.3707 | 0.2506 | 261 | 0.0070 |
| HCoV-NL63 | 5.1738 | 6889 | 2.7545 | 0.7344 | 256 | 0.0035 | 0.3754 | 0.2644 | 255 | 0.0042 |
| HCoV-OC43 | 5.2854 | 7686 | 2.6510 | 0.7918 | 258 | 0.0027 | 0.3879 | 0.2975 | 257 | 0.0031 |
| Hepatitis A | 5.1923 | 1870 | 2.7578 | 0.8180 | 239 | 0.0079 | 0.3546 | 0.2877 | 243 | 0.0075 |
| Hepatitis C | 5.3871 | 2412 | 2.4158 | 0.8378 | 254 | 0.0029 | 0.4173 | 0.3454 | 254 | 0.0030 |
| Hepatitis D | 4.9309 | 421 | 2.1249 | 0.6739 | 178 | 0.0333 | 0.4566 | 0.3217 | 178 | 0.0342 |
| Hepatitis E | 5.3405 | 1794 | 2.3837 | 0.7811 | 254 | 0.0070 | 0.4297 | 0.3251 | 254 | 0.0077 |
| HIV-1 | 5.2425 | 2296 | 2.5090 | 0.7853 | 239 | 0.0060 | 0.4090 | 0.3099 | 239 | 0.0066 |
| HIV-2 | 5.3114 | 2590 | 2.5607 | 0.8015 | 256 | 0.0030 | 0.3892 | 0.3112 | 256 | 0.0029 |
| HRV-A | 5.2618 | 1785 | 2.7530 | 0.8492 | 248 | 0.0081 | 0.3418 | 0.2981 | 254 | 0.0077 |
| HRV-B | 5.2793 | 1802 | 2.6419 | 0.8706 | 238 | 0.0043 | 0.3774 | 0.3262 | 239 | 0.0042 |
| HRV-C | 5.3165 | 1736 | 2.5766 | 0.8688 | 243 | 0.0033 | 0.3890 | 0.3353 | 243 | 0.0033 |
| Marburg | 5.3418 | 4779 | 2.5061 | 0.8225 | 252 | 0.0020 | 0.4025 | 0.3267 | 253 | 0.0021 |
| Measles | 5.4293 | 3974 | 2.3932 | 0.8767 | 256 | 0.0022 | 0.4186 | 0.3655 | 256 | 0.0022 |
| MERS | 5.4040 | 7530 | 2.4687 | 0.8665 | 256 | 0.0011 | 0.4020 | 0.3498 | 257 | 0.0013 |
| Norovirus | 5.4015 | 1900 | 2.3835 | 0.8461 | 253 | 0.0046 | 0.4244 | 0.3536 | 254 | 0.0045 |
| Phage-MS2 | 5.3680 | 893 | 2.3100 | 0.8084 | 249 | 0.0107 | 0.4436 | 0.3496 | 249 | 0.0114 |
| Planidovirus | 5.0360 | 10295 | 3.0466 | 0.7017 | 261 | 0.0183 | 0.2449 | 0.1863 | 315 | 0.0161 |
| Polio | 5.3837 | 1860 | 2.4300 | 0.8423 | 254 | 0.0044 | 0.4172 | 0.3452 | 254 | 0.0047 |
| Rabies | 5.3802 | 2982 | 2.4359 | 0.8425 | 252 | 0.0027 | 0.4148 | 0.3443 | 253 | 0.0028 |
| SARS | 5.3825 | 7438 | 2.6599 | 0.9058 | 256 | 0.0020 | 0.3716 | 0.3395 | 257 | 0.0019 |
| SARS-CoV-2 | 5.3330 | 7476 | 2.8260 | 0.9014 | 258 | 0.0022 | 0.3546 | 0.3168 | 258 | 0.0021 |
| Yellow fever | 5.3430 | 2716 | 2.6168 | 0.8421 | 258 | 0.0050 | 0.3962 | 0.3206 | 257 | 0.0059 |
| Zika | 5.3377 | 2699 | 2.2919 | 0.7300 | 257 | 0.0081 | 0.4142 | 0.3181 | 258 | 0.0053 |
Note: Entropies S4 are calculated for the distributions of four-nucleotide chunks using (6)
Fig. 2.

Location of viruses on the K − M plane (negative hypergeometric fit, left panel) and s − p plane (Pólya fit, right panel)
Note that the abovementioned goodness-of-fit condition comes from quantitative linguistic domain, where it is an “empirical rule of thumb” (Antić et al. 2019), and might not be directly applicable in the studies of genomes. However, it is used for various language levels, including letters and words (Antić et al. 2019; Mačutek 2008), and the observed distribution of four-nucleotide chunks are very similar to those of letters or syllables (cf, Wilson 2013; Rovenchak et al. 2018).
The first immediate observation from Fig. 2 is that the length of genomes has no special influence on the fitting parameters. Indeed, both the shortest Hepatitis D genome and two longest – Ball python nidovirus and Planidovirus – genomes have close values of M or s parameters. On the other hand, for genomes of similar lengths (coronaviruses) a clear separation is seen with respect to M and p parameters. It is even more pronounced in the former case corresponding to the negative hypergeometric distribution: lower values for HCoV viruses (229E, HKU1, NL63, and OC43) and higher ones for MERS, SARS, and SARS-CoV-2.
Rank–frequency distributions were also compiled for nucleotide “words” obtained using the second approach and used to calculate certain parameters, like entropy, mean length (first central moment), length dispersion (second central moment) and some others. A typical rank–frequency distribution is shown in Fig. 3. Comparing it to Fig. 1 we can easily see qualitatively different behavior, in particular, significantly longer plateaus at high ranks / low frequencies, which makes such distributions close to those of words in human languages. The differences between the distribution shapes of nucleotide “words” and n-grams are pronounced especially well in samples of rather short sizes, like several kba or a few dozen kba, and thus properties of “word-like” sequences might give new data for studies of such material, including mitochondrial DNA and viral RNA.
Fig. 3.

Typical rank–frequency distribution of nucleotide “words” (the data for the Marburg virus are shown). The left panel shows the plot in the log–log scale while in the right panel linear scales over axes are used
Previous studies (Rovenchak 2018) showed that entropy and mean lengths of such “word-like” nucleotide sequences in the mitochondrial DNA can be used to distinguish species and genera of mammals. It appears, however, that even better results are achieved with the “entropy – length dispersion” pair of variables, cf. Fig. 4.
Fig. 4.

Grouping of mammal species on the m2 − S plane. Red-shaded area corresponds to Felidae, the blue one denotes Ursidae, and the green-one corresponds to Hominidae. Calculations are made using mitochondrial DNAs with adenine as a “space”
The parameters are defined as follows. Entropy is given by
| 6 |
where the upper summation limit corresponds to the total number of different “words” in the list and relative frequencies pr are
| 7 |
and fr are absolute frequencies at rank r. Mean length and length dispersion are
| 8 |
where the summations run over all the “words” of the analyzed genome. Lengths xi of a particular word are counted as the number of nucleotides except for “X” having length zero.
One should note that from similarity of species one can expect proximity of points but not vice versa: it would be too bold to expect species distinguishability from only two parameters.
This second approach can be divided into two sub-branches: (a) adenine, which is the most frequent nucleotide in most species studied in the present work, is used as a “space”; (b) the most frequent nucleotide is used as a “space”. The latter is mostly relevant for RNAs, where low frequencies of adenine yield too long “words” thus significantly distorting the expected dependencies. The respective results are shown in Figs. 5–7. All the data are summarized in Table 3.
Fig. 5.

Location of viruses on the m2 − S plane. Calculations are made using RNAs with adenine as a “space”, hence entropy is denoted SA
Fig. 7.
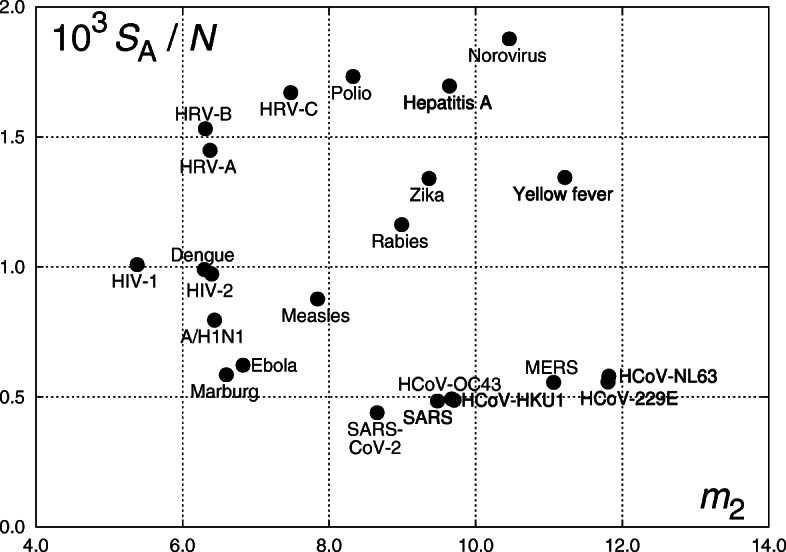
Location of viruses on the m2 − S/N plane. Calculations are made using RNAs with adenine as a “space”, hence entropy is denoted SA. The vertical axis thus represents the entropy divided by the number of nucleotide sequences separated by adenine in the respective genome
Table 3.
Parameters for the distributions of nucleotide sequences separated by a specific nucleotide
| Virus | Entropy S | Size (“words”) | Size (bases) | Mean length m1 | Length dispersion m2 |
|---|---|---|---|---|---|
| A considered a “space” even if not being the most frequent: | |||||
| A/H1N1 | 3.5446 | 4456 | 13371 | 2.0025 | 6.4378 |
| Ball python nidov. | 3.6911 | 11118 | 33452 | 2.0089 | 5.6785 |
| Dengue | 3.5204 | 3554 | 10723 | 2.0174 | 6.2980 |
| Ebola | 3.7703 | 6056 | 18962 | 2.1313 | 6.8261 |
| Feline-CoV | 4.0381 | 8572 | 29355 | 2.4246 | 8.8222 |
| HCoV-229E | 4.1411 | 7421 | 27317 | 2.6812 | 11.8059 |
| HCoV-HKU1 | 4.0653 | 8332 | 29926 | 2.5918 | 9.7058 |
| HCoV-NL63 | 4.2082 | 7254 | 27553 | 2.7985 | 11.8171 |
| HCoV-OC43 | 4.1871 | 8503 | 30741 | 2.6154 | 9.6729 |
| Hepatitis A | 3.7125 | 2189 | 7478 | 2.4166 | 9.6428 |
| Hepatitis C | 4.7418 | 1890 | 9646 | 4.0349 | 23.7224 |
| Hepatitis D | 3.7600 | 340 | 1682 | 3.9500 | 30.1122 |
| Hepatitis E | 4.9569 | 1231 | 7176 | 4.8302 | 30.5829 |
| HIV-1 | 3.3022 | 3273 | 9181 | 1.8054 | 5.3819 |
| HIV-2 | 3.4121 | 3507 | 10359 | 1.9541 | 6.3979 |
| HRV-A | 3.4610 | 2389 | 7137 | 1.9879 | 6.3770 |
| HRV-B | 3.5822 | 2339 | 7208 | 2.0821 | 6.3131 |
| HRV-C | 3.6362 | 2177 | 6944 | 2.1902 | 7.4778 |
| Marburg | 3.6623 | 6256 | 19114 | 2.0555 | 6.5991 |
| Measles | 4.0685 | 4639 | 15894 | 2.4264 | 7.8423 |
| MERS | 4.3936 | 7901 | 30119 | 2.8122 | 11.0646 |
| Norovirus | 3.9312 | 2094 | 7600 | 2.6299 | 10.4595 |
| Phage MS2 | 4.1385 | 836 | 3569 | 3.2703 | 15.0130 |
| Planidovirus | 3.0356 | 16361 | 41178 | 1.5169 | 3.6413 |
| Polio | 3.8237 | 2207 | 7440 | 2.3715 | 8.3277 |
| Rabies | 3.9758 | 3419 | 11928 | 2.4890 | 8.9910 |
| SARS | 4.1112 | 8482 | 29751 | 2.5077 | 9.4794 |
| SARS-CoV-2 | 3.9369 | 8955 | 29903 | 2.3394 | 8.6559 |
| Yellow fever | 3.9853 | 2964 | 10862 | 2.6650 | 11.2174 |
| Zika | 4.0105 | 2992 | 10794 | 2.6080 | 9.3647 |
| C is the most frequent: | |||||
| Hepatitis C | 3.8192 | 2894 | 9646 | 2.3334 | 8.7827 |
| Hepatitis D | 3.1128 | 505 | 1682 | 2.3327 | 13.0101 |
| Hepatitis E | 3.4866 | 2305 | 7176 | 2.1137 | 8.2778 |
| Phage MS2 | 4.0693 | 934 | 3569 | 2.8223 | 9.9534 |
| G is the most frequent: | |||||
| Yellow fever | 3.8711 | 3088 | 10862 | 2.5178 | 10.0036 |
| Zika | 3.8499 | 3140 | 10794 | 2.4379 | 9.3213 |
| T is the most frequent: | |||||
| Feline-CoV | 3.7072 | 9588 | 29355 | 2.0617 | 6.4845 |
| HCoV-229E | 3.4910 | 9446 | 27317 | 1.8920 | 5.9998 |
| HCoV-HKU1 | 3.0233 | 12002 | 29926 | 1.4935 | 3.7750 |
| HCoV-NL63 | 3.0976 | 10806 | 27553 | 1.5499 | 4.0621 |
| HCoV-OC43 | 3.4081 | 10931 | 30741 | 1.8124 | 5.5669 |
| MERS | 3.7682 | 9800 | 30119 | 2.0735 | 6.4379 |
| SARS | 3.8944 | 9144 | 29751 | 2.2537 | 7.9013 |
| SARS-CoV-2 | 3.7307 | 9595 | 29903 | 2.1166 | 7.3059 |
In Fig. 7, we can observe in particular that α-coronaviruses, HCoV-229E and HCoV-NL63, have very close values of the parameters (the respective point nearly overlap). A similar situation is with β-corovaniruses HCoV-OC43 and HCoV-HKU1. Two other β-corovaniruses, SARS and SARS-CoV-2, are located close to HCoV-OC43 and HCoV-HKU1, while MERS occupies an intermediate position. The latter virus also significantly differs in the entropy value, see Fig. 5. On the other hand, calculations with the most frequent nucleotide used as a space (T for the analyzed coronaviruses) do not exhibit such a grouping, see Fig. 6.
Fig. 6.

Location of viruses on the m2 − S plane. Calculations are made using RNAs with the most frequent nucleotide as a “space”, hence entropy is denoted Sm.f.
Similarly to the case of fixed-length chunks (four-nucleotide sequences analyzed above), one can expect close points for similar species but should not deduce that close points mean related species. Figures 4–6 demonstrate only one pair of parameters obtainable from rank-frequency distributions of nucleotide “words”, while Table 3 contains additional data. Further analysis can be done by processing the complete raw dataset used for calculations, which is freely available at 10.5281/zenodo.4045875.
When looking in detail into the rank–frequency distributions corresponding to coronaviruses we have discovered the following pattern: the first rank is always occupied by “X” followed by three single-nucleotide “words” with ranks 2–4, while the fifth ranks are occupied by a two-nucleotide sequence with either the same (4-same) or different (4-diff) nucleotides, see Table 4. Curiously, different nucleotides correspond to coronaviruses causing much more severe diseases. This observation is yet to be extended onto a wider material, but the preliminary data for the analyzed human viruses are as follows:
4-same: Dengue, HCoV-229E, HCoV-HKU1, HCoV-NL63, HCoV-OC43, HIV-1, HIV-2, HRV-A, HRV-B, HRV-C, Polio;
4-diff: A/H1N1, Ebola, Hepatitis A, Hepatitis C, Hepatitis E, Marburg, Measles, MERS, Norovirus, Rabies, SARS, SARS-CoV-2.
Three other viruses, Hepatitis D, Yellow fever, and Zika, do not follow either pattern having a two-nucleotide sequence with as low ranks as 3 or 4.
Table 4.
Top-ranked nucleotide sequences in the genomes of the human coronaviruses
| MERS | SARS | SARS-CoV-2 | HCoV-229E | HCoV-HKU1 | HCoV-NL63 | HCoV-OC43 | ||||||||
|---|---|---|---|---|---|---|---|---|---|---|---|---|---|---|
| r | “word” | fr | “word” | fr | “word” | fr | “word” | fr | “word” | fr | “word” | fr | “word” | fr |
| 1 | X | 3098 | X | 2845 | X | 3215 | X | 3380 | X | 4694 | X | 4272 | X | 3895 |
| 2 | G | 876 | G | 795 | G | 858 | G | 1033 | A | 1183 | G | 1149 | G | 1105 |
| 3 | A | 701 | C | 568 | A | 623 | A | 615 | G | 1151 | A | 814 | A | 963 |
| 4 | C | 668 | A | 567 | C | 542 | C | 458 | C | 581 | C | 521 | C | 468 |
| 5 | GC | 256 | GC | 316 | GC | 255 | GG | 288 | AA | 399 | GG | 387 | AA | 324 |
| 6 | GG | 234 | GA | 217 | GG | 245 | GC | 284 | GA | 339 | AA | 318 | GA | 322 |
| 7 | GA | 223 | GG | 202 | AA | 218 | AA | 211 | GG | 338 | GA | 296 | GG | 293 |
| 8 | AA | 214 | AC | 196 | AC | 214 | GA | 210 | AC | 271 | GC | 232 | GC | 269 |
| 9 | AC | 194 | AA | 167 | GA | 208 | AC | 156 | AG | 227 | AG | 194 | AC | 190 |
| 10 | AG | 134 | CA | 154 | AG | 138 | AG | 128 | GC | 223 | AC | 190 | AG | 171 |
| 11 | CC | 131 | AG | 102 | CA | 127 | CA | 105 | AAA | 117 | CA | 107 | CA | 96 |
| 12 | CA | 126 | CC | 81 | CC | 79 | CC | 56 | CA | 113 | CC | 69 | CC | 86 |
| 13 | CG | 80 | CG | 74 | AAA | 64 | GAC | 52 | CC | 104 | CG | 58 | AAA | 76 |
The abovementioned feature can be viewed with respect to (dis)similarity in the frequency structure of viral RNA and RNA or DNA of infected species. For instance, the fifth most frequent sequence of human mtDNA split by the most frequent C nucleotide is TA. Interestingly, it coincides with a sequence composed of nucleotides paring with G and C – and the GC sequence is the fifth most frequent in, e.g., MERS, SARS, SARS-CoV-2, see Table 4.
Discussion
We have presented several possible approaches to simple parametrization of RNA viruses based on the analysis of nucleotide sequences in viral genomes. They are based on discrete distributions (negative hypergeometric and Pólya) for equal-length (4-nucleotide) chunks and on the pair “entropy – length dispersion” for distributions of sequences separated by adenine or another most frequent nucleotide. Close values of parameters calculated from rank-frequency distributions of various nucleotide sequences are characteristic for related viruses, which is connected to similar structures of viruses and thus might reflect similarities in their functional properties. In some cases, however, close values are also obtained for unrelated viruses. This is not surprising as representing viruses on a plane means a two-parametric projection of points that are certainly described by more than two variables. We consider our study as preliminary steps in discovering such variables.
The structure of rank–frequency distributions of sequences of both types suggest an analogy with two text levels. Namely, equal-chunk sequences approach to letters or syllables while nucleotide “words” obtained using certain nucleotide as a separator are similar to ordinary words. Here, we should stress that these data correspond to rather short molecules, viral RNA and previously studied mtRNA (Rovenchak 2018), so the correlations might differ when dealing with larger nucleotide strings (cf. Gimona 2006; Ferrer-i-Cancho et al. 2013; Faltýnek 2019). Such an interpretation corresponds to the biosemiotic analogy between natural language texts and strings of biopolymers.
Observations regarding peculiarities of rank–frequency distributions, with the fifth most frequent sequence containing two either the same or different nucleotides (4-same vs 4-diff), support the fact that 4-diff cases correspond to viruses causing potentially more severe diseases when dealing with seven human coronaviruses. This tendency is generally preserved if the analyzed set is expanded by other viruses studied in this work. Some precautions concern, in particular, the two HIV types, which fall into the 4-same category while certainly being extremely dangerous. However, HIV are not strictly RNA viruses but retroviruses, so we suggest that the reported peculiarities might be specific for RNA viruses only. “False-positive” alerts (cf. Norovirus in the 4-diff category) are not problematic, but the rate of “false-negative” results (severe diseases in the 4-same category) is yet to be identified. Expansion of the analyzed material in future studies would help to clarify the relevance of this observation. To establish relations between peculiarities of the rank–frequency distributions in virus genomes and disease severity, a formalization of the latter is required. Initially we planned using the case fatality rate (CFR) indicator (Reich et al. 2012; Kim et al. 2020) but where not able to find a study with data for different viruses based on a unified approach, similar, e.g., to (GBD 2017).
The main expected outcome of our reported analysis is a call for collaboration to expand the dataset and consistently classify diseases caused by RNA viruses, in particular with respect to severity and contagiousness. If some simple patterns could be established in the nucleotide distributions, this might help alerting healthcare systems, which seems to become a very topical issue from this year on.
Acknowledgements
We are grateful to the anonymous Reviewer for a careful examination of our work and for useful comments and suggestions.
Declarations
Ethics approval and consent to participate
This article does not contain any studies with human participants or animals performed by any of the authors.
Conflict of Interests
The authors, Mykola Husev and Andrij Rovenchak, declare that they have no conflict of interest.
Footnotes
Publisher’s Note
Springer Nature remains neutral with regard to jurisdictional claims in published maps and institutional affiliations.
Contributor Information
Mykola Husev, Email: mykola.husiev@lnu.edu.ua, Email: mhusev@gmail.com.
Andrij Rovenchak, Email: andrij.rovenchak@lnu.edu.ua, Email: andrij.rovenchak@gmail.com.
References
- Altmann G. Altmann Fitter 2.1. RAM-Verlag: Lüdenscheid; 2000. [Google Scholar]
- Antić, G., Stadlober, E., Grzybek, P., & Kelih, E. (2019). Word length and frequency distributions in different text genres. In Spiliopoulou, M., Kruse, R., Borgelt, C., Nürnberger, A., & Gaul, W. (Eds.) From data and information analysis to knowledge engineering: proceedings of the 29th annual conference of the Gesellschaft für Klassifikation e.V., University of Magdeburg, March 9–11, 2005 (pp. 310–317). Berlin–Heidelberg: Springer.
- Barbieri M. Code biology – A new science of life. Biosemiotics. 2012;5(3):411–437. doi: 10.1007/s12304-012-9147-3. [DOI] [Google Scholar]
- Botstein D, Cherry JM. Molecular linguistics: Extracting information from gene and protein sequences. Proceedings of the National Academy of Sciences. 1997;94(11):5506–5507. doi: 10.1073/pnas.94.11.5506. [DOI] [PMC free article] [PubMed] [Google Scholar]
- Brendel V, Beckmann JS, Trifonov EN. Linguistics of nucleotide sequences: Morphology and comparison of vocabularies. Journal of Biomolecular Structure and Dynamics. 1986;4(1):11–21. doi: 10.1080/07391102.1986.10507643. [DOI] [PubMed] [Google Scholar]
- Campillo-Balderas JA, Lazcano A, Becerra A. Viral genome size distribution does not correlate with the antiquity of the host lineages. Frontiers in Ecology and Evolution. 2015;3:143. doi: 10.3389/fevo.2015.00143. [DOI] [Google Scholar]
- Carsetti, A. (2020). On the verge of life: Looking for a new scientific paradigm. In Metabiology. non-standard models, general semantics and natural evolution (pp. 1–25). Cham: Springer.
- de Smit MH, van Duin J. Translational initiation at the coat-protein gene of phage MS2: native upstream RNA relieves inhibition by local secondary structure. Molecular Microbiology. 1993;9(5):1079–1088. doi: 10.1111/j.1365-2958.1993.tb01237.x. [DOI] [PubMed] [Google Scholar]
- Dehmer M, Emmert-Streib F, Eds. Analysis of complex networks: From biology to linguistics. Wiley: Weinheim; 2009. [Google Scholar]
- Faltýnek D, Matlach V, Lacková L’. Bases are not letters: On the analogy between the genetic code and natural language by sequence analysis. Biosemiotics. 2019;12(2):289–304. doi: 10.1007/s12304-019-09353-z. [DOI] [Google Scholar]
- Fang C, Moriwaki Y, Li C, Shimizu K. MoRFPred_en: Sequence-based prediction of MoRFs using an ensemble learning strategy. Journal of Bioinformatics and Computational Biology. 2019;17(6):1940015. doi: 10.1142/S0219720019400158. [DOI] [PubMed] [Google Scholar]
- Ferrer-i-Cancho R, Forns N, Hernández-Fernández A, Bel-Enguix G, Baixeries J. The challenges of statistical patterns of language: The case of Menzerath’s law in genomes. Statistical Applications in Genetics and Molecular Biology. 2013;18(3):11–17. [Google Scholar]
- Ferrer-i-Cancho R, Hernández-Fernández A, Baixeries J, Dębowski Ł,, Mačutek J. When is Menzerath–Altmann law mathematically trivial? A new approach. Complexity. 2014;13(6):633–644. doi: 10.1515/sagmb-2013-0034. [DOI] [PubMed] [Google Scholar]
- GBD Causes of death collaborators (Gregory A. Roth others.) (2018). Global, regional, and national age-sex-specific mortality for 282 causes of death in 195 countries and territories, 1980–2017: a systematic analysis for the global burden of disease study 2017. Lancet. 2017;392:1736–1788. doi: 10.1016/S0140-6736(18)32203-7. [DOI] [PMC free article] [PubMed] [Google Scholar]
- Gimona M. Protein linguistics — a grammar for modular protein assembly? Nature Reviews Molecular Cell Biology. 2006;7(1):68–73. doi: 10.1038/nrm1785. [DOI] [PubMed] [Google Scholar]
- Gorbalenya AE, Enjuanes L, Ziebuhr J, Snijder EJ. Nidovirales: Evolving the largest RNA virus genome. Virus Research. 2006;117(1):17–37. doi: 10.1016/j.virusres.2006.01.017. [DOI] [PMC free article] [PubMed] [Google Scholar]
- Grzybek P. On the systematic and system-based study of grapheme frequencies: A reanalysis of German letter frequencies. Glottometrics. 2007;15:82–91. [Google Scholar]
- Huang H-H, Yu C. Clustering DNA sequences using the out-of-place measure with reduced n-grams. Journal of Theoretical Biology. 2016;406:61–72. doi: 10.1016/j.jtbi.2016.06.029. [DOI] [PubMed] [Google Scholar]
- Ji, S. (2020). The molecular linguistics of DNA: Letters, words, sentences, texts, and their meanings. In Burgin, M., & Dodig-Crnkovic, G (Eds.) Theoretical information studies: Information in the World (pp. 187–231). Singapore: World Scientific.
- Johnson NL, Kemp AW, Kotz S. Univariate Discrete Distributions. 3rd edn. Hoboken New Jersey: John Wiley & Sons, Inc.; 2005. [Google Scholar]
- Kim D-H, Choe YJ, Jeong J-Y. Understanding and interpretation of case fatality rate of coronavirus disease 2019. Journal of Korean Medical Science. 2020;35(12):e137. doi: 10.3346/jkms.2020.35.e137. [DOI] [PMC free article] [PubMed] [Google Scholar]
- Kolb VM. On the applicability of the Aristotelian principles to the definition of life. International Journal of Astrobiology. 2007;6(1):51–57. doi: 10.1017/S1473550407003564. [DOI] [Google Scholar]
- Liang, Y. (2014). Analysis of DNA motifs in the human genome. PhD dissertation, The City University of New York; CUNY Academic Works. https://academicworks.cuny.edu/gc_etds/63. Accessed 17 November 2020.
- Licon, A., Taufer, M., Leung, M.-Y., & Johnson, K.L. (2010). A dynamic programming algorithm for finding the optimal segmentation of an RNA sequence in secondary structure predictions. In 2nd Int. Conf. Bioinform. Comput. Biol. (pp. 165–170). [PMC free article] [PubMed]
- Lin J-J, Bhattacharjee MJ, Yu C-P, Tseng YY, Li W-H. Many human RNA viruses show extraordinarily stringent selective constraints on protein evolution. Proceedings of the National Academy of Sciences. 2019;116(38):19009–19018. doi: 10.1073/pnas.1907626116. [DOI] [PMC free article] [PubMed] [Google Scholar]
- Mačutek J. A generalization of the geometric distribution and its application in quantitative linguistics. Romanian Reports in Physics. 2008;60(3):501–509. [Google Scholar]
- Melkus G, Rucevskis P, Celms E, Čerāns K, Freivalds K, Kikusts P, Lace L, Opmanis M, Rituma D, Viksna J. Network motif-based analysis of regulatory patterns in paralogous gene pairs. Journal of Bioinformatics and Computational Biology. 2020;18(3):2040008. doi: 10.1142/S0219720020400089. [DOI] [PubMed] [Google Scholar]
- Neuman Y, Nave O. On the semio-mathematical nature of codes. Biosemiotics. 2008;1(1):99–111. doi: 10.1007/s12304-008-9004-6. [DOI] [Google Scholar]
- Pevzner PA, Borodovsky MYu, Mironov AA. Linguistics of nucleotide sequences I: The significance of deviations from mean statistical characteristics and prediction of the frequencies of occurrence of words. Journal of Biomolecular Structure and Dynamics. 1989;6(5):1013–1026. doi: 10.1080/07391102.1989.10506528. [DOI] [PubMed] [Google Scholar]
- Qian H. Stochastic physics, complex systems and biology. Quantitative Biology. 2013;1(1):50–53. doi: 10.1007/s40484-013-0002-6. [DOI] [Google Scholar]
- Reich NG, Lessler J, Cummings DAT, Brookmeyer R. Estimating absolute and relative case fatality ratios from infectious disease surveillance data. Biometrics. 2012;68(2):598–606. doi: 10.1111/j.1541-0420.2011.01709.x. [DOI] [PMC free article] [PubMed] [Google Scholar]
- Ren J, Song K, Deng C, Ahlgren NA, Fuhrman JA, Li Y, Xie X, Poplin R, Sun F. Identifying viruses from metagenomic data using deep learning. Quantitative Biology. 2020;8(1):64–77. doi: 10.1007/s40484-019-0187-4. [DOI] [PMC free article] [PubMed] [Google Scholar]
- Rovenchak A. Telling apart Felidae and Ursidae from the distribution of nucleotides in mitochondrial DNA. Modern Physics Letters B. 2018;32(5):1850057. doi: 10.1142/S0217984918500574. [DOI] [Google Scholar]
- Rovenchak A, Riley C, Sherman T. The diary of Boima Kiakpomgbo from Mando Town (Liberia): A quantitative study of a Vai text. Journal of Quantitative Linguistics. 2018;25(3):271–287. doi: 10.1080/09296174.2017.1373510. [DOI] [Google Scholar]
- Saberi A, Gulyaeva AA, Brubacher JL, Newmark PA, Gorbalenya AE. A planarian nidovirus expands the limits of RNA genome size. PLOS Pathogens. 2018;14(11):e1007314. doi: 10.1371/journal.ppat.1007314. [DOI] [PMC free article] [PubMed] [Google Scholar]
- Saldanha JA, Thomas HC, Monjardino JP. Cloning and sequencing of RNA of hepatitis delta virus isolated from human serum. Journal of General Virology. 1990;71(7):1603–1606. doi: 10.1099/0022-1317-71-7-1603. [DOI] [PubMed] [Google Scholar]
- Searls DB. The linguistics of DNA. American Scientist. 1992;80(6):579–591. [Google Scholar]
- Singh S, Yang Y, Póczos B, Ma J. Predicting enhancer-promoter interaction from genomic sequence with deep neural networks. Quantitative Biology. 2019;7(2):122–137. doi: 10.1007/s40484-019-0154-0. [DOI] [PMC free article] [PubMed] [Google Scholar]
- Su S, Wong G, Shi W, Liu J, Lai ACK, Zhou J, Liu W, Bi Y, Gao GF. Epidemiology, Genetic Recombination, and Pathogenesis of Coronaviruses. Trends in Microbiology. 2016;24(6):490–502. doi: 10.1016/j.tim.2016.03.003. [DOI] [PMC free article] [PubMed] [Google Scholar]
- Tomović A, Janičić P, Kešelj V. n-Gram-based classification and unsupervised hierarchical clustering of genome sequences. Computer Methods and Programs in Biomedicine. 2006;81(2):137–153. doi: 10.1016/j.cmpb.2005.11.007. [DOI] [PubMed] [Google Scholar]
- Trifonov EN, Volkovich Z, Frenkel ZM. Multiple levels of meaning in DNA sequences, and one more. Annals of the New York Academy of Sciences. 2012;1267(1):35–38. doi: 10.1111/j.1749-6632.2012.06589.x. [DOI] [PubMed] [Google Scholar]
- Villarreal LP. Are viruses alive? Scientific American. 2004;291(6):100–105. doi: 10.1038/scientificamerican1204-100. [DOI] [PubMed] [Google Scholar]
- Wang J-D. Comparing virus classification using genomic materials according to different taxonomic levels. Journal of Bioinformatics and Computational Biology. 2013;11(6):1343003. doi: 10.1142/S0219720013430038. [DOI] [PubMed] [Google Scholar]
- Wilson A. Probability distributions of grapheme frequencies in Irish and Manx. Journal of Quantitative Linguistics. 2013;20(3):169–177. doi: 10.1080/09296174.2013.799919. [DOI] [Google Scholar]
- Wimmer G, Altmann G. Thesaurus of univariate discrete probability distributions. 1st edn. Stamm: Essen; 1999. [Google Scholar]
- Wu F, Zhao S, Yu B, Chen Y-M, Wang W, Song Z-G, Hu Y, Tao Z-W, Tian J-H, Pei Y-Y, et al. A new coronavirus associated with human respiratory disease in China. Nature. 2020;579:265–269. doi: 10.1038/s41586-020-2008-3. [DOI] [PMC free article] [PubMed] [Google Scholar]