

Summary
Effector regulatory T (eTreg) cells are essential for immune tolerance and depend upon T cell receptor (TCR) signals for generation. The immunometabolic signaling mechanisms that promote the differentiation and maintenance of eTreg cells remain unclear. Here, we show that isoprenoid-dependent posttranslational lipid modifications dictate eTreg-cell accumulation and function by intersecting with TCR-induced intracellular signaling. We find that isoprenoids are essential for activated Treg-cell suppressive activity, and Treg cell-specific deletion of the respective farnesylation- and geranylgeranylation-promoting enzymes Fntb or Pggt1b leads to the development of fatal autoimmunity, associated with reduced eTreg-cell accumulation. Mechanistically, Fntb promotes eTreg-cell maintenance by regulating mTORC1 activity and ICOS expression. In contrast, Pggt1b acts as a rheostat of TCR-dependent transcriptional programming and Rac-mediated signaling for establishment of eTreg-cell differentiation and immune tolerance. Therefore, our results identify bidirectional metabolic signaling, specifically between immunoreceptor signaling and metabolism-mediated posttranslational lipid modifications, for the differentiation and maintenance of eTreg cells.
Graphical Abstract
eTOC blurb
Su et al. show that mevalonate metabolism-driven protein geranylgeranylation and farnesylation orchestrate the respective differentiation and maintenance of effector Treg cells, by serving as rheostats for immunological receptor, mTORC1, and Rac signaling. These data establish a crucial role for metabolism-dependent posttranslational lipid modifications in Treg cell-mediated immune suppression.
Introduction
Foxp3-expressing regulatory T (Treg) cells are crucial for establishing self-tolerance, which depends on the conversion of central Treg (cTreg) cells into effector Treg (eTreg) cells during homeostasis and inflammation (Li and Rudensky, 2016; Savage et al., 2020). eTreg cells display superior suppressive activity than cTreg cells and promote tolerance in non-lymphoid tissues (Smigiel et al., 2014; Whibley et al., 2019). eTreg-cell development and function are programmed by T cell receptor (TCR), co-stimulation and IL-2 signals (Li and Rudensky, 2016). While transcriptional regulators mediate eTreg-cell generation (Cretney et al., 2011; Oh et al., 2017; Vasanthakumar et al., 2017; Vasanthakumar et al., 2015), the metabolic and signaling mechanisms that promote the differentiation and maintenance of eTreg cells remain poorly defined.
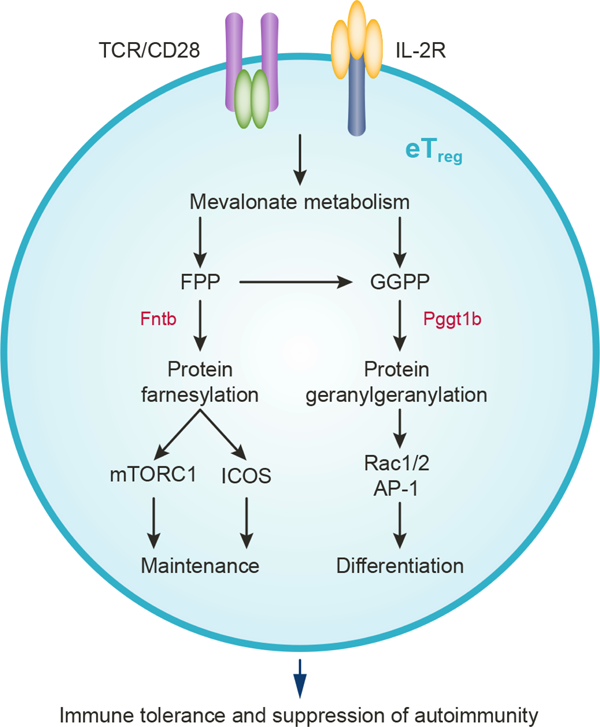
Metabolism dictates Treg-cell function and differentiation and is programmed by selective kinase signaling (Galgani et al., 2016; Newton et al., 2016), including PI3K (Huynh et al., 2015; Shrestha et al., 2015) and mTORC1 (Zeng et al., 2013). Emerging studies also show that intracellular metabolites can influence signaling events. For instance, chromatin and DNA modifying enzymes use metabolic intermediates as substrates and cofactors, which can affect Foxp3 expression (Galgani et al., 2016; Newton et al., 2016). Whether intracellular metabolites interplay with cellular signaling to control Treg-cell differentiation or function is underexplored. In response to TCR and IL-2 signals, mTORC1 induces mevalonate metabolism (Zeng et al., 2013), which shapes Treg-cell functional fitness (Lacher et al., 2017; Zeng et al., 2013). Aside from cholesterol, the mevalonate pathway generates the isoprenoids farnesyl pyrophosphate (FPP) and geranylgeranyl pyrophosphate (GGPP) (Wang and Casey, 2016), which mediate posttranslational lipid modifications that are driven by the farnesyltransferase (catalytic subunit encoded by Fntb) and geranylgeranyltransferase type 1 (catalytic subunit encoded by Pggt1b), respectively. The functions of these metabolism-dependent posttranslational lipid modifications, and whether Fntb and Pggt1b play shared or discrete roles in Treg cells, remain unknown.
Here we show that mevalonate metabolism-dependent posttranslational lipid modifications serve as metabolic rheostats for the temporal fate decisions of eTreg cells. Isoprenoids are crucial for establishing activated Treg-cell suppressive activity, and Treg cell-specific deletion of Fntb or Pggt1b triggers development of a fatal autoimmune disease associated with impaired eTreg-cell accumulation. Mechanistically, Fntb promotes mTORC1 activity and inducible costimulator (ICOS) expression that is crucial for eTreg-cell maintenance, while Pggt1b orchestrates TCR and downstream Rac signaling to promote eTreg-cell differentiation. Thus, our study unveils discrete roles for metabolism-dependent posttranslational lipid modifications and their interplay with immune signaling for balancing the generation and maintenance of eTreg cells to enforce self-tolerance.
Results
Isoprenoids are critical for Treg-cell activation and suppressive function
Metabolism directs Treg-cell function (Galgani et al., 2016; Newton et al., 2016), but the specific metabolic programs that support eTreg cells are unclear. As metabolic pathways upregulated during Treg-cell activation may influence eTreg-cell programming, we performed gene set enrichment analysis (GSEA) of public datasets: 1) activated Treg cells from Foxp3DTR mice (DTR, diphtheria toxin receptor) with acute treatment of diphtheria toxin (DT) to induce partial Treg-cell depletion, followed by their activation in vivo (Arvey et al., 2014); and 2) Treg cells activated with anti-CD3/28 antibodies for 4 h (Wakamatsu et al., 2013). GSEA showed that hallmark pathways involved in cell proliferation (G2M checkpoint and mitotic spindle) and mTORC1 signaling were enriched upon Treg-cell activation in vivo and in vitro [false discovery rate (FDR) < 0.001; Figure 1A]. The cholesterol homeostasis hallmark pathway was the only metabolic program strongly enriched in activated compared with resting Treg cells (Figure 1A), with upregulated expression of multiple genes involved in mediating cholesterol biosynthesis and isoprenoid-dependent posttranslational lipid modifications (Mullen et al., 2016; Wang and Casey, 2016) (Figure 1B and C and Figure S1A). Specifically, Hmgcr (3-hydroxy-3-methylglutaryl-CoA reductase), Hmgcs1 (3-hydroxy-3-methylglutaryl-CoA synthase 1), Ggps1 (geranylgeranyl diphosphate synthase 1; promotes GGPP synthesis), Fnta (common subunit of the prenyl transferases), and Pggt1b, but not Fntb, showed increased expression upon 4 h of TCR stimulation (Figure 1B and C). Except for Fntb, these genes were also upregulated by TCR in naïve and CD44hiCD62Llo effector/memory CD4+ T cells, with less pronounced upregulation of Hmgcr and Hmgcs1 than in Treg cells (Figure S1B). Thus, TCR activation induces gene expression changes in the mevalonate pathway and isoprenoid-dependent protein prenylation.
Figure 1. Mevalonate-derived isoprenoid synthesis is essential for suppressive activity of activated Treg cells.
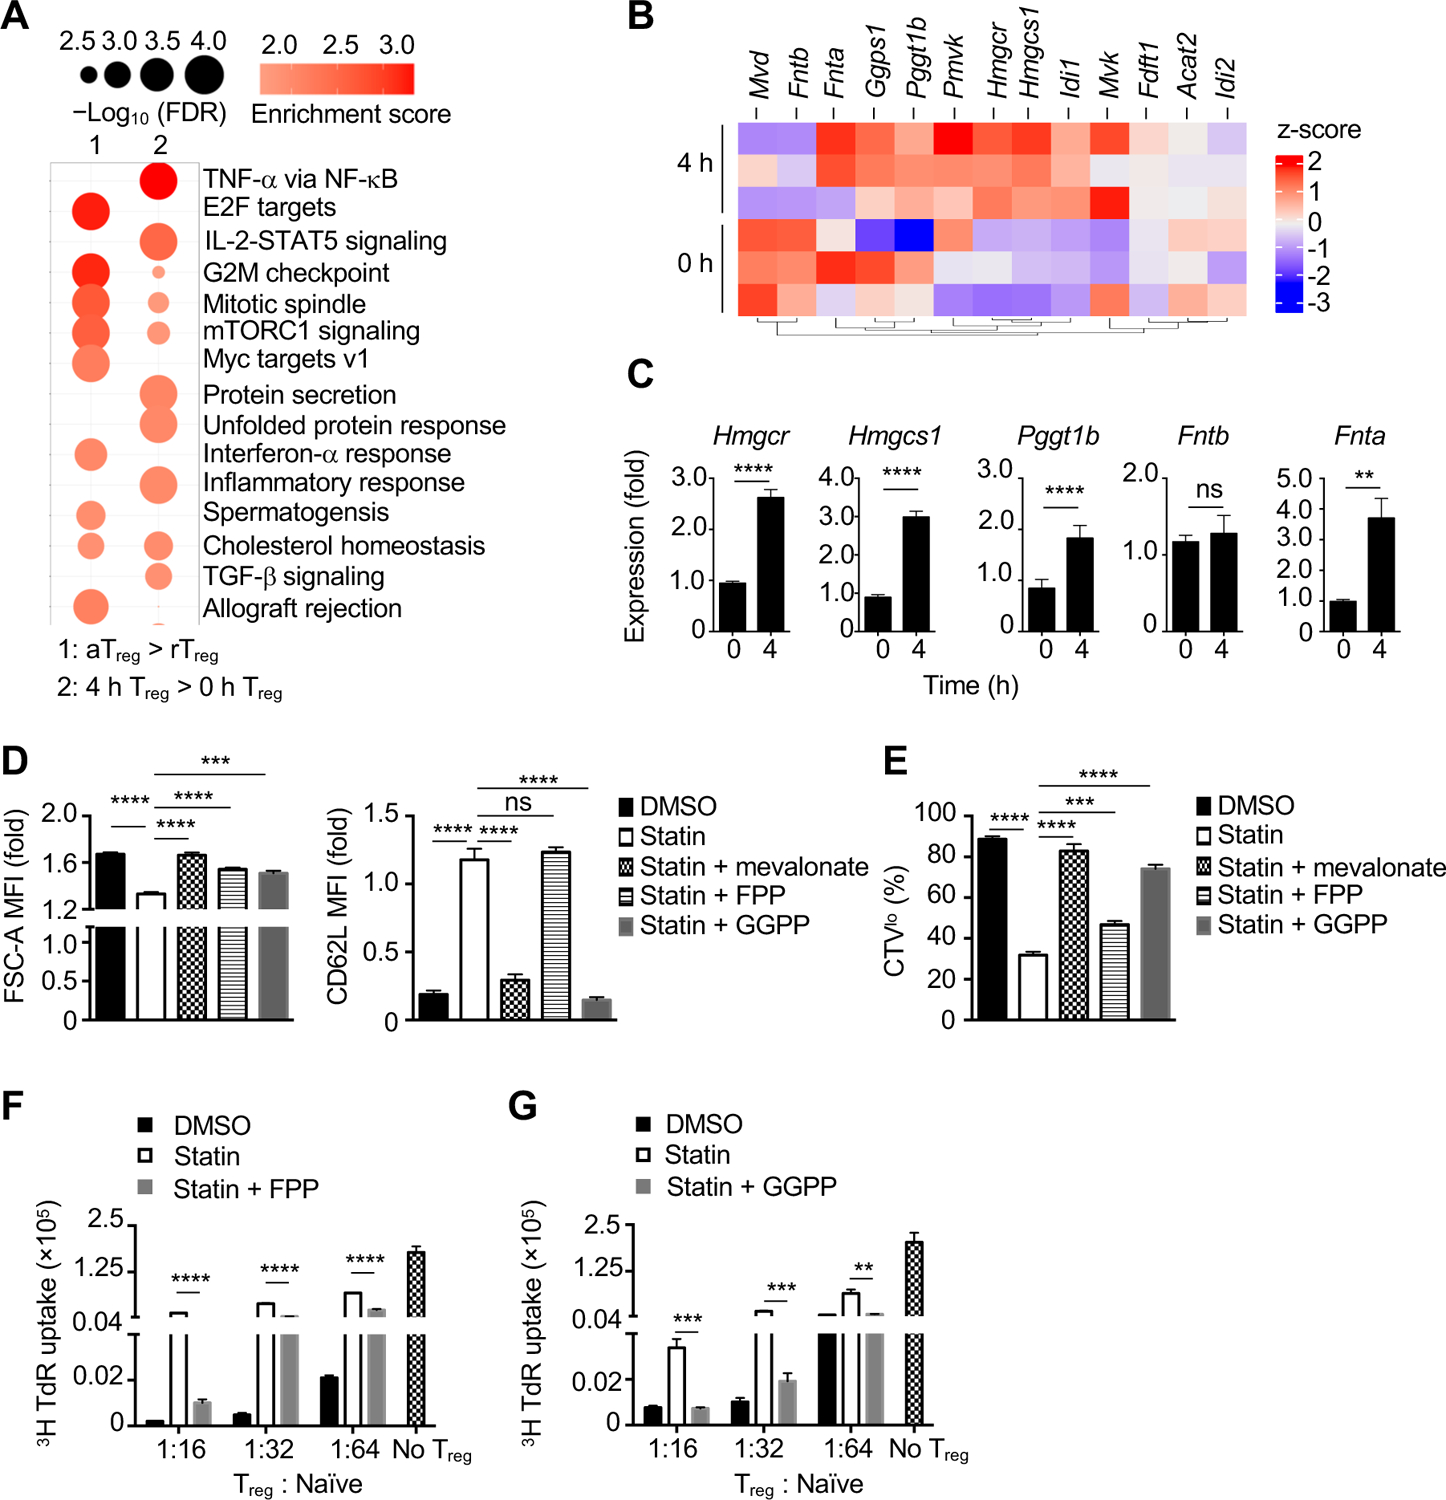
(A) Gene set enrichment analysis (GSEA) of the transcriptome of in vivo activated Treg (aTreg) compared to resting Treg (rTreg) cells (left) (Arvey et al., 2014), or Treg cells stimulated with anti-CD3/28 for 0 or 4 h in vitro (right) (Wakamatsu et al., 2013). (B and C) Heat map (B) and real-time PCR analysis (C) of mevalonate pathway-related genes in Treg cells activated for 0 or 4 h. (D and E) Quantification of cell size (FSC-A) (D), CD62L expression (D) and cell proliferation [Celltrace Violet (CTVlo)] (E) in aTreg cells stimulated with anti-CD3/28 plus IL-2 for 3 days in the presence of DMSO or 2 μM simvastatin (statin) and supplied with indicated metabolites. MFI, mean fluorescence intensity. (F and G) aTreg cells were generated as in (D and E) in the presence of 2 μM statin and supplied with 20 μM FPP or 5 μM GGPP, followed by co-culture with naïve CD4+ T cells and assessment of aTreg-cell suppressive activity.
Data are representative of two (F, G), or compiled from two (Fnta in C, D and E), four (Hmgcr, Hmgcs1, Pggt1b, Fntb in C) independent experiments, with at 4–6 (C) or 6 (D, E) biological replicates or 3 technical replicates (F, G) per group. *p < 0.05, **p < 0.01, ***p < 0.001, ****p < 0.0001, ns, not significant; two-tailed unpaired Student’s t-test (C) or one-way ANOVA (D–G). Data are mean ± s.e.m. Fold change of 0 h (C) or IL-2 treatment (D). See also Figure S1.
We next activated Treg cells with TCR in the presence of the Hmgcr inhibitor simvastatin to establish the function of mevalonate intermediates, especially isoprenoids. Simvastatin treatment decreased cell size (FSC-A), increased CD62L expression, and reduced proliferation (indicated by the dilution of Celltrace Violet, CTV) (Figure 1D and E); as expected, mevalonate addition completely restored Treg-cell activation in the presence of simvastatin (Figure 1D and E). Notably, simvastatin-treated Treg cells showed defects in protein prenylation, as indicated by the presence of unprenylated HDJ2 (a farnesylation target) and unprenylated Rap1A (a geranylgeranylation target); prenylation of HDJ2 was rectified by addition of mevalonate or FPP, while Rap1A prenylation was restored by mevalonate or GGPP (Figure S1C). Addition of FPP also rescued the effects of simvastatin treatment on cell size and proliferation, but not CD62L expression, whereas GGPP largely rectified all these parameters (Figure 1D and E). Also, FPP or GGPP partially restored the suppressive function of simvastatin-treated Treg cells (Figure 1F and G), whereas cholesterol supplementation had no effect (Figure S1D). Furthermore, Treg-cell suppressive activity was dampened by DGBP, an inhibitor of Ggps1 (Figure S1A), and this defect was reversed upon addition of GGPP (Figure S1E). Together, these results demonstrate that isoprenoids are essential for Treg-cell activation and suppressive function.
Fntb and Pggt1b in Treg cells are indispensable for immune homeostasis
As isoprenoids mediate protein prenylation (Figure S1A) and the expression of Fnta and Pggt1b was increased upon Treg-cell activation (Figure 1B and C), we next tested if isoprenoids establish Treg-cell function via posttranslational lipid modifications. We generated mice with Treg cell-specific deletion of Fntb or Pggt1b by breeding mice with floxed Fntb (Fntbfl/fl) or Pggt1b (Pggt1bfl/fl) alleles (Du et al., 2020; Khan et al., 2011; Liu et al., 2010) with those expressing Foxp3-driven Cre recombinase (Foxp3Cre) (Rubtsov et al., 2008). Fntb or Pggt1b expression was lost in Treg cells, but not conventional T cells, from Foxp3CreFntbfl/fl or Foxp3CrePggt1bfl/fl mice, respectively (Figure S2A and B). These mice also had reduced prenylation of specific substrates of Fntb (HDJ2) and Pggt1b (Rap1A) in Treg cells, but not conventional CD4+ T cells (Figure S2C and D), validating inhibition of protein farnesylation and geranylgeranylation by deletions of Fntb and Pggt1b, respectively. Further, Fntb- and Pggt1b-deficient Treg cells had impaired suppressive function in vitro (Figure S2E and F), revealing important roles for Fntb and Pggt1b for Treg-cell suppressive activity.
Consistent with the effects on Treg-cell suppressive function, we found that Fntb and Pggt1b were crucial for enforcing Treg cell-mediated self-tolerance in vivo, as Foxp3CreFntbfl/fl and Foxp3CrePggt1bfl/fl mice developed a Scurfy-like autoimmune disease, characterized by runted body size (Figure 2A), systemic inflammation (see below) and rapid death (Figure 2B). An earlier lethality was observed in Foxp3CrePggt1bfl/fl (median survival of 23 days) as compared with Foxp3CreFntbfl/fl mice (median survival of 42 days) (Figure 2B). These mutant mice had increased size and cellularity of the spleen and peripheral lymph nodes (pLN) (Figure 2C). Excessive inflammatory infiltrates were observed in multiple tissues (Figure 2D), including CD4+ and CD8+ T cells, arginase 1- or Iba1-expressing macrophages, and mucosal Mcpt1+ mast cells (Chapman et al., 2018) (Figure S2G–I). Of note, 22-day-old Foxp3CrePggt1bfl/fl mice had pronounced inflammation in all organs examined, while Foxp3CreFntbfl/fl mice showed inflammation only in the liver, lung, and skin (Figure 2D). Thus, ablation of either Fntb or Pggt1b in Treg cells leads to the development of a fatal and early-onset autoimmune disease.
Figure 2. Fntb and Pggt1b in Treg cells are indispensable for immune homeostasis.
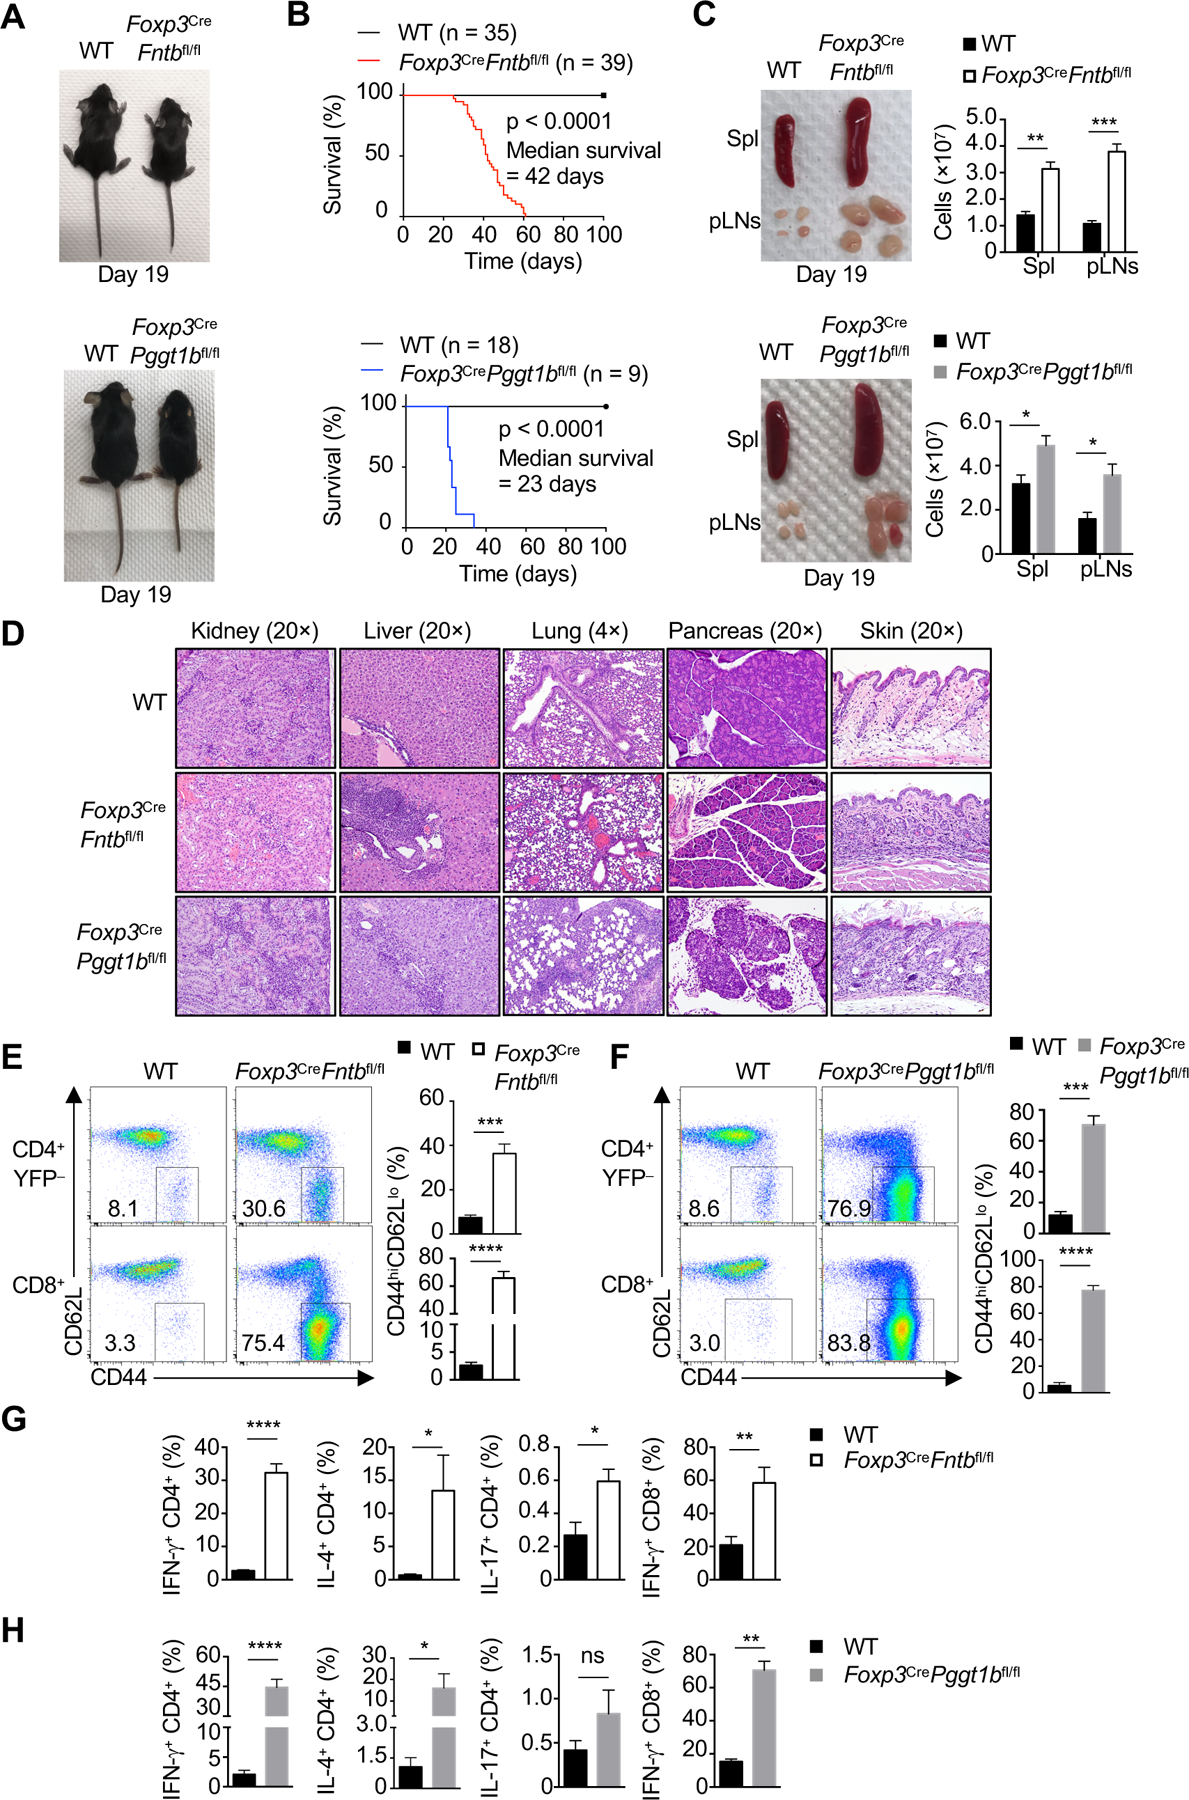
(A) Representative images of 19-day-old Foxp3CreFntbfl/fl mice or Foxp3CrePggt1bfl/fl mice. (B) Survival of Foxp3CreFntbfl/fl or Foxp3CrePggt1bfl/fl mice. (C) Representative images and quantification of cell numbers of enlarged spleen (Spl) and peripheral lymph nodes (pLN) of mutant mice. (D) Representative H&E staining from indicated mice at 3 weeks. (E and F) Flow cytometry analysis of CD44hiCD62Llo CD4+Foxp3-YFP− or CD8+ T cells. Right, frequency of splenic CD44hiCD62Llo CD4+Foxp3-YFP− or CD8+ T cells. (G and H) Frequencies of splenic IFN-γ+, IL-4+, or IL-17+ CD4+ T cells and IFN-γ+ CD8+ T cells.
Data are representative of seven (A, C, E, G) or one (D), or compiled from three (C, lower right; H) or two (F, G) independent experiments, with 3–4 (C, E–H) mice per group. *p < 0.05, **p < 0.01, ***p < 0.001, ****p < 0.0001, ns, not significant; two-tailed unpaired Student’s t-test (C, E– H). Data are mean ± s.e.m. Numbers indicate percentage of cells in gates. See also Figure S2.
Analysis of immune homeostasis revealed increased percentages of effector/memory CD4+ and CD8+ T cells in the spleen of 3-week-old Foxp3CreFntbfl/fl (Figure 2E) and Foxp3CrePggt1bfl/fl mice (Figure 2F). These mutant mice also had elevated percentages of splenic CD4+ T cells producing IFN-γ and IL-4, and CD8+ T cells expressing IFN-γ (Figure 2G and H), while IL-17-producing CD4+ T cells were significantly increased in Foxp3CreFntbfl/fl mice only (Figure 2G and H). However, activation and cytokine production by T cells were not elevated in 7-day-old neonatal Foxp3CreFntbfl/fl mice (Figure S2J and K), whereas Foxp3CrePggt1bfl/fl mice had markedly enhanced T-cell activation (Figure S2L), IFN-γ production from CD4+ and CD8+ T cells (Figure S2M), and increased IL-17- and IL-4-producing CD4+ T cells (Figure S2M). These differences in early immune cell activation are consistent with the more rapid lethality of Foxp3CrePggt1bfl/fl compared with Foxp3CreFntbfl/fl mice (Figure 2B), as well as the stronger defect in the suppressive activity of Pggt1b-deficient Treg cells as compared to those lacking Fntb (Figure S2E and F). Collectively, these results show that Fntb and Pggt1b in Treg cells control immune homeostasis, with a more important role of Pggt1b for establishing immune tolerance in the neonatal stage.
Fntb and Pggt1b are essential for eTreg-cell accumulation
Reduced Treg-cell number can provoke autoimmunity (Savage et al., 2020). Accordingly, the percentage and number of Treg cells were decreased in Foxp3CreFntbfl/fl (Figure S3A) and Foxp3CrePggt1bfl/fl mice (Figure S3B) at 3-weeks of age. To circumvent the possible secondary effects due to the inflammatory environment, we generated mixed bone marrow chimeras (see Methods) as a cell-intrinsic system, wherein the presence of WT Treg cells (CD45.1+) prevents the development of inflammation (Zeng et al., 2013). The frequency and number of Treg cells lacking Fntb (Figure 3A) or Pggt1b (Figure 3B) were reduced in the chimeras, indicating the cell-autonomous roles of these molecules. In contrast, Foxp3 expression on a per cell basis was not altered in Fntb- or Pggt1b-deficient Treg cells from these chimeras (Figure 3C and D) or Foxp3CreFntbfl/fl (Figure S3C) and Foxp3CrePggt1bfl/fl mice (Figure S3D). Fntb- and Pggt1b-deficient Treg cells had cell-intrinsic reduction of survival [as indicated by 7AAD or fixable live-dead viability (FVD) dye] under homeostasis (Figure S3E and F) and after activation in vitro (Figure S3G and H), indicating that Fntb and Pggt1b are not required for the stability of Foxp3 expression but contribute to cell survival.
Figure 3. Crucial roles of Fntb and Pggt1b in eTreg-cell accumulation.
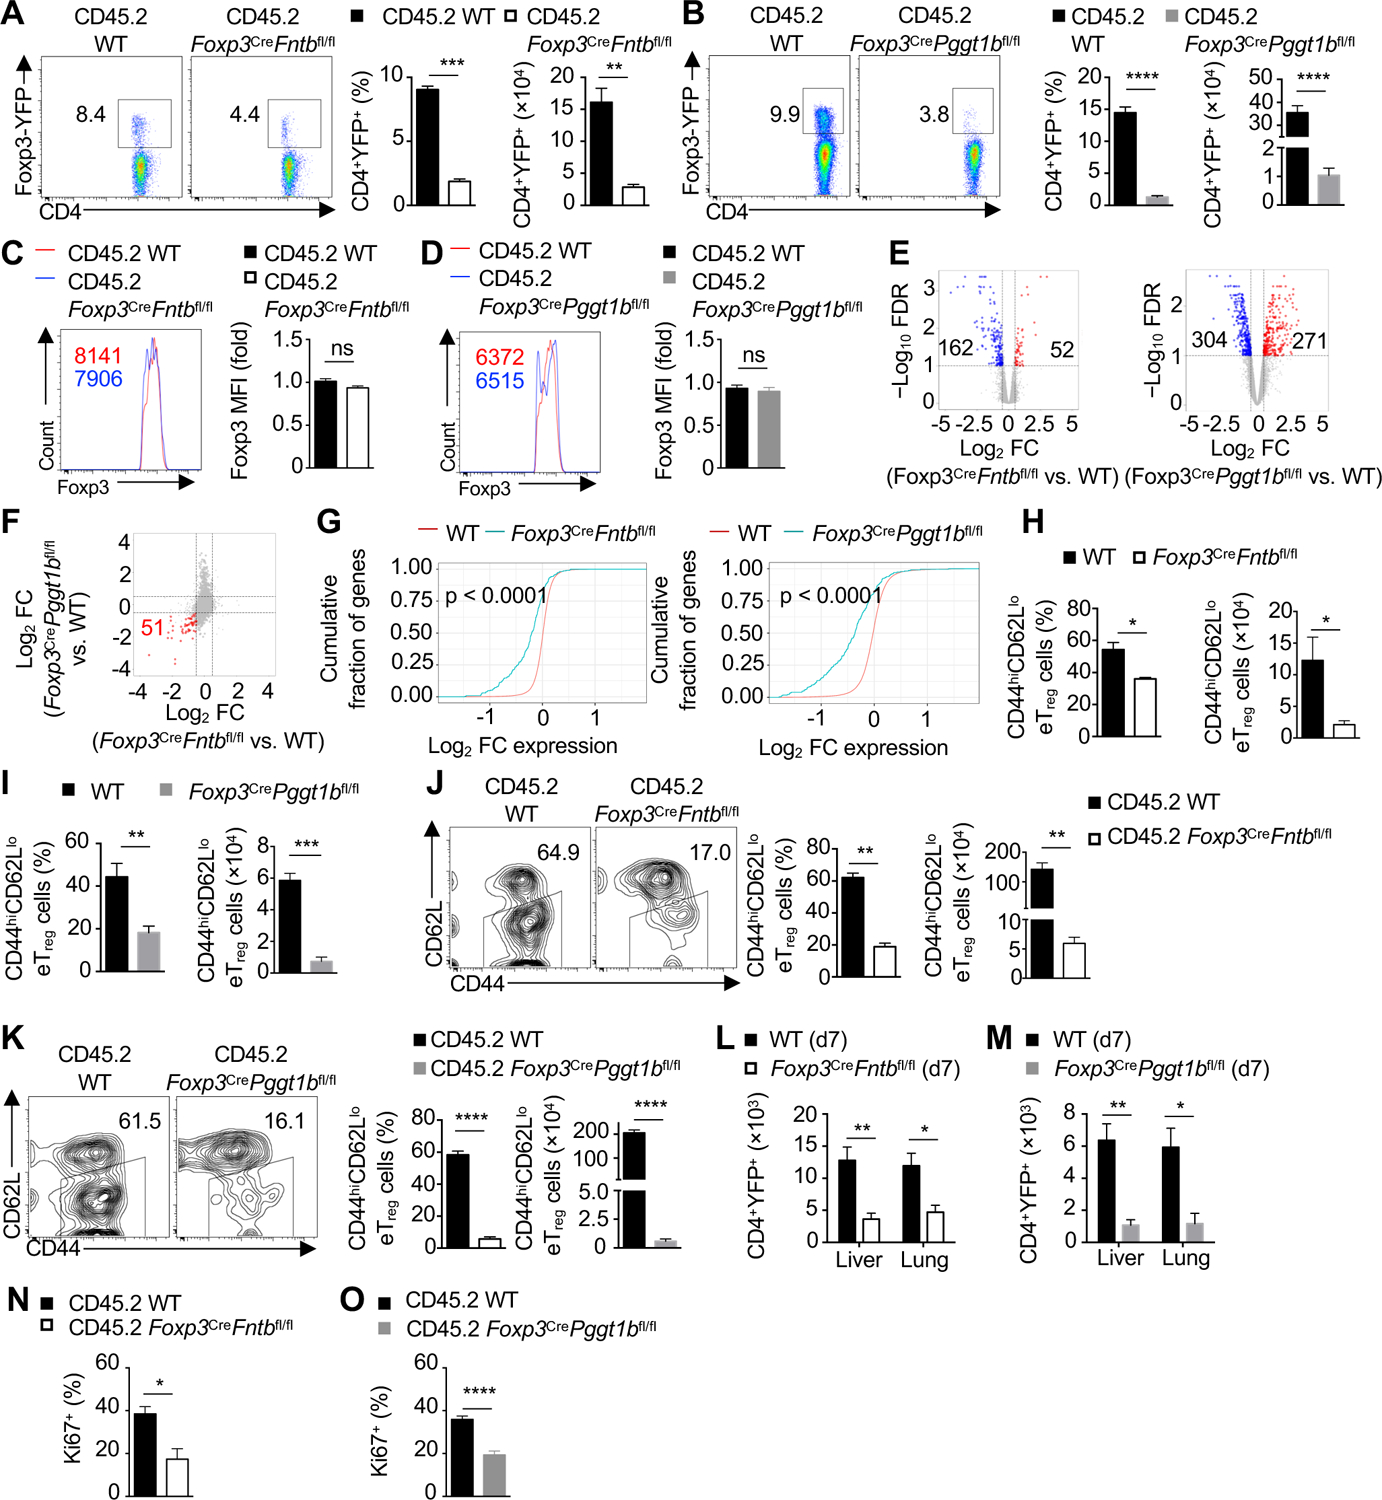
(A and B) Flow cytometry analysis of splenic CD45.2+CD4+Foxp3-YFP+ Treg cells in WT and Foxp3CreFntbfl/fl (A) or Foxp3CrePggt1bfl/fl (B) mixed bone marrow chimeras. Quantification of the frequency and number of Treg cells. (C and D) Flow cytometry analysis and quantification of Foxp3 mean fluorescence intensity (MFI) in splenic Treg cells from indicated mixed bone marrow chimeras. (E) Transcriptomic analysis and volcano plots of Fntb-deficient vs. WT or Pggt1b-deficient vs. WT Foxp3-YFP+ Treg cells from mixed bone marrow chimeras. FDR, false discovery rate; FC, fold-change. (F) FC/FC plot of Pggt1b-deficient vs. WT Treg cells compared with Fntb-deficient vs. WT Treg cells as analyzed in (E). Number of shared downregulated genes is marked in red. (G) Cumulative distribution function plot of eTreg-cell signature genes in Fntb-(left) or Pggtb1-deficient (right) Treg cells as compared with WT Treg cells. (H and I) Quantification of frequency (left) and number (right) of splenic CD44hiCD62Llo eTreg cells. (J and K) Flow cytometry analysis and quantification of splenic CD44hiCD62Llo eTreg cells in indicated mixed bone marrow chimeras. (L and M) Quantification of CD4+YFP+ Treg-cell number in the liver and lung from indicated neonatal mice at day 7 (d7). (N and O) Quantification of splenic Ki67+ Treg cell frequency from indicated mixed bone marrow chimeras.
Data are representative of four (J) or three (K), or compiled from two (A–D, I, N, O) or three (H) independent experiments, with 4–6 (A, C), 4–5 (B, D), 3–4 (H), 3 (I), 5 (L), 2 (J), 4 (K), 5 (M, O) or 6 (N) mice per group. *p < 0.05, **p < 0.01, ***p < 0.001, ****p < 0.0001, ns, not significant; two-tailed unpaired Student’s t-test (A–D, H–O). Data are mean ± s.e.m. Numbers indicate percentage of cells in gates. See also Figure S3.
To explore Fntb- or Pggt1b-dependent functional programs, we performed transcriptome analysis of CD45.2+ Treg cells isolated from mixed bone marrow chimeras. Differential expression (DE) analysis revealed 52 upregulated and 162 downregulated genes in Treg cells lacking Fntb, and 271 upregulated and 304 downregulated genes in those deficient in Pggt1b-(Figure 3E). Fold-change/fold-change (FC/FC) plot analysis showed that 51 genes were downregulated in both Fntb- and Pggt1b-deficient Treg cells (Figure 3F), including 40 eTreg cell-associated genes (Levine et al., 2014). In fact, out of 448 eTreg signature genes (Levine et al., 2014) (see Methods), 123 and 189 were significantly downregulated in Fntb- or Pggt1b-deficient Treg cells, respectively (Figure 3G), suggesting that Fntb and Pggt1b orchestrate the transcriptional program of eTreg cells.
Consistent with reduced eTreg-cell signatures, there were decreased frequency and number of CD44hiCD62Llo eTreg cells in 3-week-old Foxp3CreFntbfl/fl (Figure 3H) and Foxp3CrePggt1bfl/fl (Figure 3I) mice, as well as reduced number, but increased frequency, of cTreg cells (Figure S3I and J), associated with reduced survival of both cTreg and eTreg cells (Figure S3K and L). However, there was a more pronounced decrease in the number of eTreg than cTreg cells (Figure S3M and N). Analysis of Treg-cell subsets in mixed bone marrow chimeras revealed cell-autonomous defects in eTreg-cell accumulation (Figure 3J and K). We also generated Foxp3Cre/wtFntbfl/fl or Foxp3Cre/wtPggt1bfl/fl mice (called ‘mosaic’ mice), where Foxp3Cre is expressed in 50% of Treg cells due to random inactivation of the X-chromosome that bears the Foxp3 gene; analysis of these mice also revealed a reduction of eTreg cells (Figure S3O and P). Hmgcr deficiency similarly reduced eTreg-cell accumulation in Foxp3CreHmgcrfl/fl mice (Figure S3Q) and mixed bone marrow chimeras (Figure S3R), associated with altered immune homeostasis and fatal autoimmunity observed in Foxp3CreHmgcrfl/fl mice (Lacher et al., 2017). Non-lymphoid tissues, such as the liver and lung, are enriched for eTreg cells (Whibley et al., 2019), and neonatal Foxp3CreFntbfl/fl and Foxp3CrePggt1bfl/fl mice had reduced numbers of Treg cells in these organs (Figure 3L and M). Further, Fntb- or Pggt1b-deficient cTreg and eTreg cells isolated from mixed bone marrow chimeras had lower expression of ICOS and CTLA4 (Figure S3S and T). In contrast, CD25 expression was increased on Fntb-deficient cTreg and eTreg cells (Figure S3S) and not altered on Pggt1b-deficient cTreg but trending increased on Pggt1b-deficient eTreg cells (Figure S3T). eTreg cells are also more proliferative in vivo (Smigiel et al., 2014) and Fntb- and Pggt1b-deficient Treg cells displayed reduced proliferation as indicated by Ki67 staining (Figure 3N and O). Thus, Fntb and Pggt1b are essential for eTreg cell-accumulation in vivo.
Fntb and Pggt1b regulate distinct aspects of eTreg-cell homeostasis
While both Fntb and Pggt1b were essential for eTreg-cell accumulation, there were pronounced differences in the inflammatory status of neonatal Foxp3CreFntbfl/fl and Foxp3CrePggt1bfl/fl mice (Figure S2J–M). Also, Foxp3CreFntbfl/fl mice had reduction of eTreg cells beginning at 2 weeks, but not on day 7, after birth (Figure 4A), whereas eTreg-cell accumulation in Foxp3CrePggt1bfl/fl mice was impaired at all time points examined (Figure 4B). To determine if Fntb and Pggt1b differentially promote cTreg-cell activation and differentiation into eTreg cells, we purified CD44loCD62Lhi cTreg cells and stimulated them with anti-CD3/28 and IL-2 to promote their activation and differentiation into CD44hiCD62Llo eTreg-like cells (Luo et al., 2016). We found that eTreg-like cell generation among CTVlo cells (Figure 4C) or expression of activation or suppressive molecules (Figure S4A) was largely unaltered in the absence of Fntb. In contrast, eTreg-like cell generation was reduced in Pggt1b-deficient cells (Figure 4D), associated with impaired expression of activation or suppressive molecules (Figure S4B). Similar effects were observed when cTreg cells from inflammation-free ‘mosaic’ mice were used (Figure S4C and D). Simvastatin-treated cTreg cells also had reduced eTreg-like cell generation that was rescued by GGPP but not FPP, demonstrating an essential role for GGPP in promoting eTreg-cell differentiation (Figure 4E). Thus, Fntb is dispensable for cTreg-cell activation and differentiation into eTreg cells but may contribute to eTreg-cell maintenance, whereas Pggt1b promotes eTreg-cell differentiation during cTreg-cell activation.
Figure 4. Fntb and Pggt1b orchestrate discrete transcriptional programming of eTreg cells.
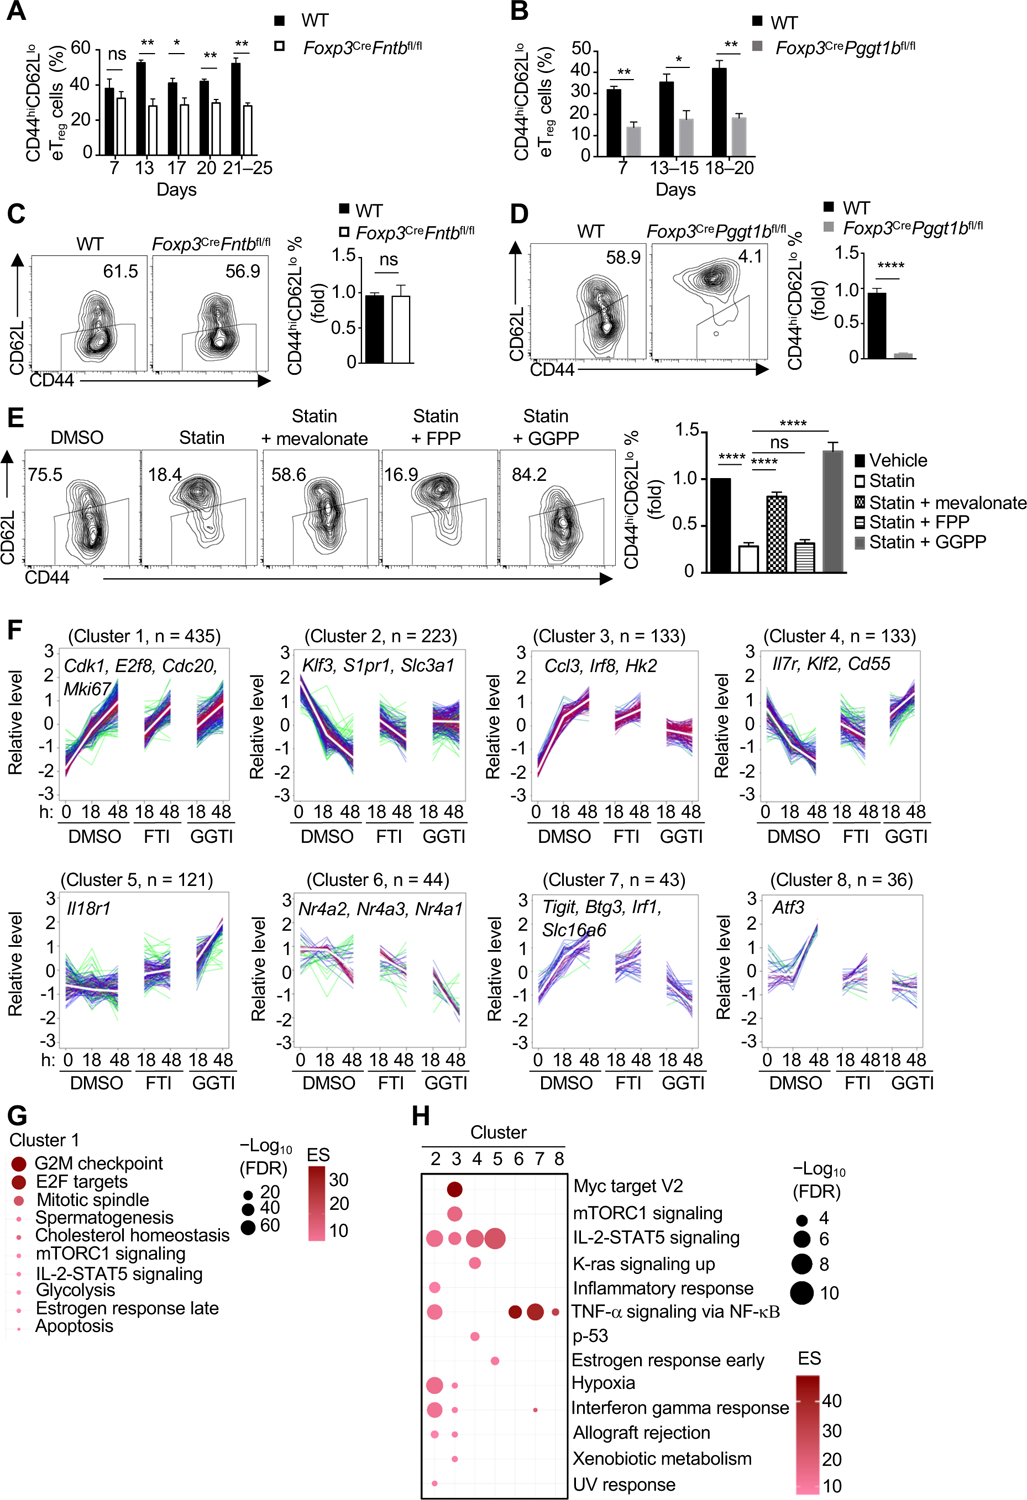
(A and B) Quantification of CD44hiCD62Llo eTreg-cell percentage in peripheral lymph nodes at the indicated ages. (C and D) Flow cytometry and quantification of eTreg-like cells generated from cTreg cells isolated from the indicated mice. (E) cTreg cells were activated with anti-CD3/28 plus IL-2 for 3 days in the presence of DMSO or simvastatin (statin) with or without mevalonate, FPP or GGPP. Flow cytometry analysis and quantification of eTreg-like cell generation. (F) Weighted gene correlation network analysis (WGCNA) of cTreg cells activated with anti-CD3/28 plus IL-2 for the indicated times in the presence of DMSO, FTI, or GGTI. The number of genes in each cluster, and representative gene names, are indicated. (G and H) Functional enrichment of hallmark pathways in cluster 1 (G) or clusters 2–8 (H) from WGCNA.
Data are compiled from three (A for day 7 and days 21–25, B for day 7 and days 13–15, D), two (A for day 17, B for days 18–20, E), one (A for day 13 and day 20) or five (C) independent experiments, with at least 3–5 (A), 3–6 (B), 5 (C), 4 (D) or 6 (E) biological replicates per group. *p < 0.05, **p < 0.01, ****p < 0.0001, ns, not significant; two-tailed unpaired Student’s t-test (A–D) or one-way ANOVA (E). Data are mean ± s.e.m. Controls were normalized to 1 for each comparison (black bars) (C–E). See also Figure S4.
The above FC/FC plot analysis revealed that 406 (253 upregulated and 153 downregulated) genes were altered selectively in Pggt1b-deficient Treg cells as compared with Fntb-deficient Treg cells (Figure S4E), suggesting possible mechanistic differences for Fntb and Pggt1b in eTreg-cell accumulation. To test the contributions and mechanisms of Fntb and Pggt1b activities in eTreg-cell accumulation and to circumvent the effects of steady-state eTreg-cell defects in the absence of Fntb or Pggt1b, we stimulated cTreg cells with anti-CD3/28 and IL-2 in the presence of vehicle, FTI or GGTI, to acutely inhibit Fntb or Pggt1b, respectively (Wang and Casey, 2016). FTI showed the expected selective inhibition of the farnesyltransferase, while GGTI selectively impaired the function of the geranylgeranyltransferase type 1 (Figure S4F). FTI and GGTI treatments also recapitulated the respective lack of and inhibitory effects on eTreg-like cell generation described above for mutant cells (Figure S4G and H), validating this system.
To unbiasedly identify gene modules regulated by Fntb and Pggt1b activities, we performed transcriptome profiling of cTreg cells stimulated with TCR in the presence of vehicle, FTI or GGTI, followed by weighted gene correlation network analysis (WGCNA) (Tan et al., 2017). First, we identified four clusters that were upregulated upon activation in the vehicle-treated control cells (clusters 1, 3, 7, and 8): genes in cluster 1 were induced relatively independently of farnesyltransferase and geranylgeranyltransferase type 1 activity, while those in clusters 3, 7, and 8 were not fully upregulated upon FTI treatment and were markedly downregulated in GGTI-treated cells across time (Figure 4F). Second, clusters 2 and 4 contained gene profiles that were downregulated upon activation in vehicle control cells, with inhibition of Pggt1b, and to a lesser extent, Fntb, preventing activation-induced repression of these gene signatures (Figure 4F). In fact, cluster 4 had genes that were increased in expression at 48 h by GGTI treatment. Finally, clusters 5 and 6 were relatively unchanged across activation in vehicle controls. Treatment with FTI and GGTI increased expression of genes in cluster 5, whereas reduction of gene signatures in the presence of these inhibitors were observed in cluster 6 (Figure 4F). Thus, Fntb and Pggt1b activities regulate largely distinct transcriptional programs upon TCR stimulation, with a more pronounced effect induced by Pggt1b inhibition.
Functional enrichment analysis revealed that cluster 1, which was modestly altered by FTI or GGTI treatment, was enriched with genes in cell-cycle regulation, certain anabolic pathways and apoptosis (Figure 4F and G), and we validated that FTI and GGTI treatments reduced cell proliferation and survival during activation (Figure S4I and J). Clusters 2, 4, and 5 were upregulated upon GGTI treatment as compared with either DMSO or FTI treatment at 48 h, and were enriched for IL-2-STAT5 signaling or pathways associated with inflammation or hypoxia (Figure 4F and H). In contrast, in clusters 3, 6, and 7, where gene expression was downregulated in GGTI-treated cells, had altered pathways related to eTreg-cell differentiation, including mTORC1 and NF-κB signaling (Chapman et al., 2018; Oh et al., 2017; Sun et al., 2018; Vasanthakumar et al., 2017) (Figure 4F and H). Cluster 8 represented a small subset of genes enriched in NF-κB signaling, including Atf3 (Figure 4F and H). Thus, WGCNA and functional enrichment reveal that Fntb and Pggt1b activities mediate selective gene expression programs underlying the function and activation of Treg cells.
Fntb maintains eTreg-cell subsets via mTORC1 and ICOS signaling
To explore the mechanism of Fntb-dependent eTreg-cell maintenance, we performed GSEA of the transcriptome of TCR-activated cTreg cells treated with FTI, which showed decreased gene signatures associated with mTORC1 activation (Figure 5A). Next, we assessed the phosphorylation of two mTORC1-dependent targets, ribosomal protein S6 (p-S6) and 4EBP1 (p-4EBP1) by flow cytometry. p-S6 and p-4EBP1 levels were reduced in FTI-treated cTreg cells after TCR stimulation (Figure 5B), which was further verified by immunoblot analysis of p-S6 and p-4EBP1, with a greater reduction of mTORC1 at 48 h (Figure 5C). Similar reduction of p-S6 was obtained using Fntb-deficient cTreg cells isolated from 2-week-old Foxp3CreFntbfl/fl mice (Figure 5D) or inflammation-free Cd4CreFntbfl/fl mice (Figure 5E). In contrast, deletion of Pggt1b or its inhibition by GGTI had no effect on mTORC1 signaling under the same activation conditions (Figure S5A and B). Thus, Fntb, but not Pggt1b, is essential for mTORC1 activation and downstream metabolic events in TCR-stimulated cTreg cells.
Figure 5. Fntb promotes the maintenance of eTreg cells by mTORC1 and ICOS signaling.
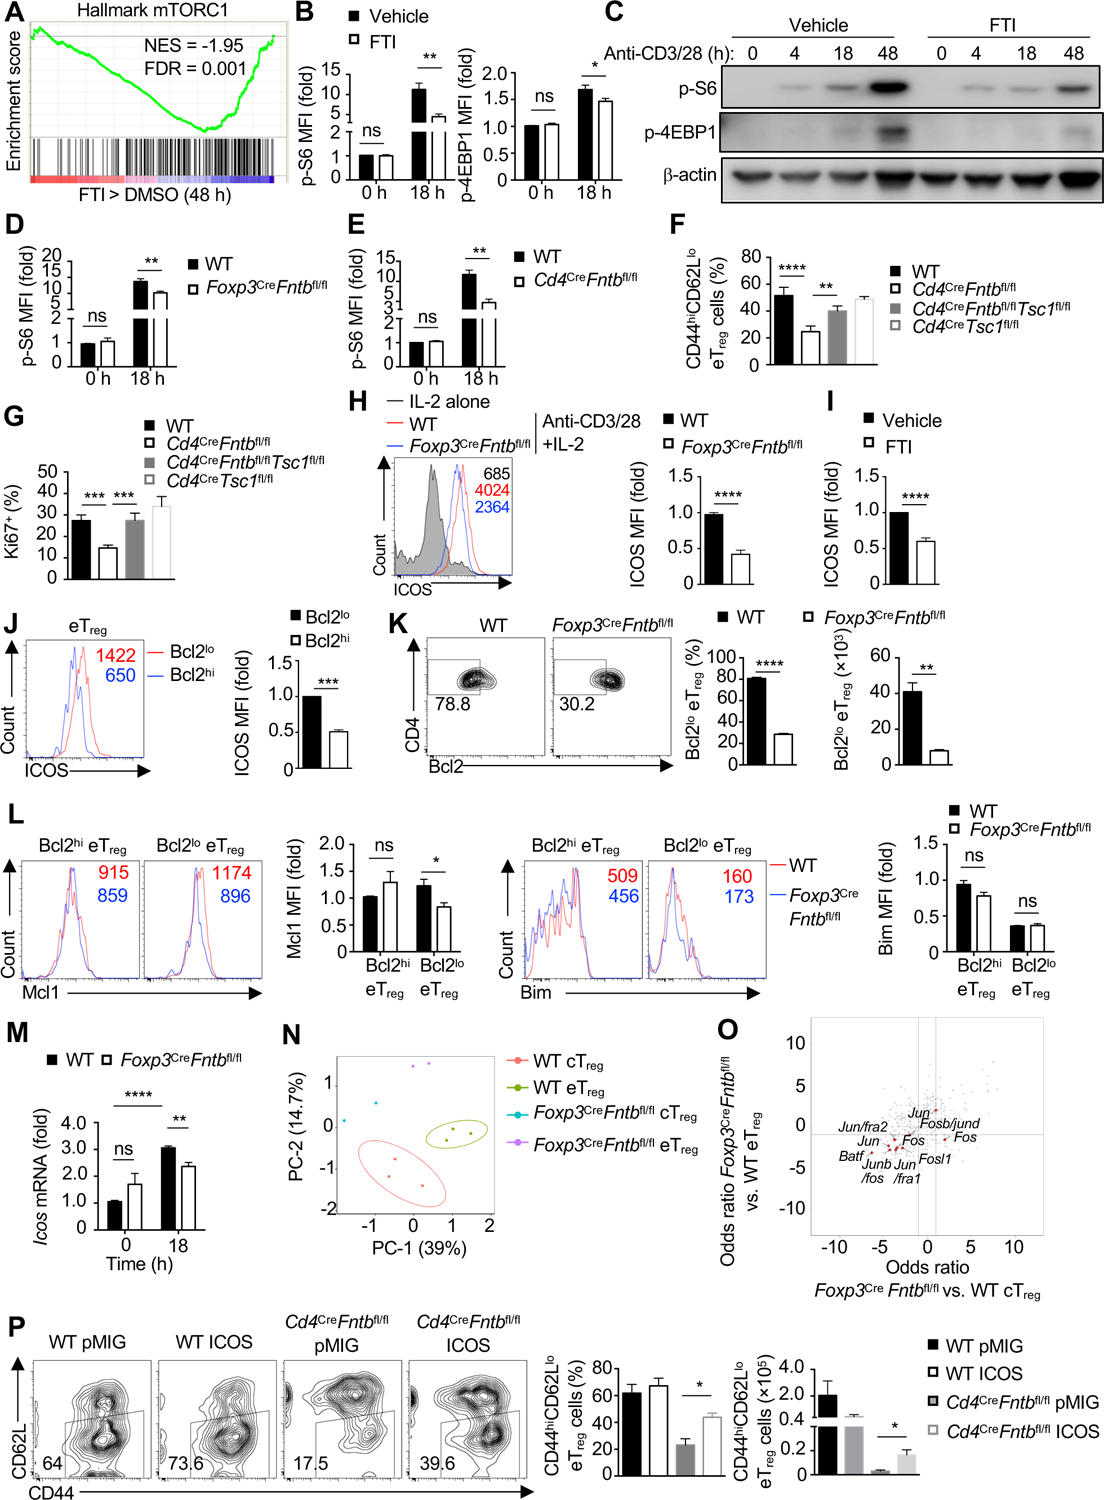
(A) Gene set enrichment analysis (GSEA) of the hallmark mTORC1 pathway in cTreg cells stimulated with anti-CD3/28 plus IL-2 in the presence of vehicle or FTI for 48 h. (B) Quantification of the relative mean fluorescence intensity (MFI) of phosphorylated S6 (p-S6) and p-4EBP1 by flow cytometry analysis in WT cTreg cells stimulated with anti-CD3/28 plus IL-2 in the presence of FTI for 0 or 18 h. (C) Immunoblot analysis of p-S6 and p-4EBP1 in cTreg cells stimulated as in (B) for the indicated times. (D) Quantification of relative MFI of p-S6 in cTreg cells from WT or Foxp3CreFntbfl/fl mice stimulated as in (B). (E) Quantification of relative MFI of p-S6 in cTreg cells from WT and Cd4CreFntbfl/fl mice stimulated as in (B). (F and G) Quantification of percentage of splenic CD44hiCD62Llo eTreg cells (F) or Ki67+ Treg cells percentage in WT, Cd4CreFntbfl/fl, Cd4CreFntbfl/flTsc1fl/fl or Cd4CreTsc1fl/fl mice. (H) Flow cytometry analysis and quantification of ICOS expression on cTreg cells isolated from indicated mice after IL-2 or anti-CD3/28 plus IL-2 stimulation for 3 days. (I) Quantification of ICOS expression on WT cTreg cells stimulated as in (H) in the presence of vehicle or FTI. (J) Flow cytometry analysis and quantification of ICOS expression on WT Bcl2lo and Bcl2hi eTreg-cell subsets from spleen. (K) Flow cytometry analysis (left) and quantification of frequency (middle) and number (right) of splenic Bcl2lo eTreg cells in indicated mice. (L) Flow cytometry analysis and quantification of Mcl1 (left) or Bim (right) expression (based on mean fluorescence intensity, MFI) in splenic Bcl2hi and Bcl2lo eTreg cells from indicated mice. (M) Icos expression in cTreg cells from indicated mice after stimulation as in (B). (N) Principal component analysis plot of nucleosome-free reads of cTreg and eTreg cells from WT or Foxp3CreFntbfl/fl mixed bone marrow chimeras. (O) Odds ratio/odds ratio plot of the predicted enriched motifs in Foxp3CreFntbfl/fl vs. WT eTreg cells compared with Foxp3CreFntbfl/fl vs. WT cTreg from mixed bone marrow chimeras. (P) Flow cytometry and quantification of splenic eTreg cell percentage and number in retrogenic mice [WT or Cd4CreFntbfl/fl bone marrow cells were transduced with pMIG-GFP empty vector (pMIG) or pMIG-GFP-ICOS (ICOS) retroviral vector; see Methods].
Data are representative of two (C) or four (J, K), or compiled from two (B for p-4EBP1, L for Bim, M), three (B for p-S6, D, E, L for Mcl1, P), four (F, G, J, K), five (H) or six (I) independent experiments, with 9 (B for p-S6), 7 (L for Mcl1), 6 (B for p-4EBP1, I, L for Bim, P for WT pMIG and WT ICOS), 3 (E, M, P for Cd4CreFntbfl/fl pMIG), 4 (F, G, J, K, P for Cd4CreFntbfl/fl ICOS) or 5 (D, H) biological replicates per group. *p < 0.05, **p < 0.01, ***p < 0.001, ****p < 0.0001, ns, not significant; two-tailed unpaired Student’s t-test (B, D, E, H–K, L–P) or one-way ANOVA (F, G). Data are mean ± s.e.m. Numbers indicate percentage of cells in gates. Numbers in histograms indicate MFI. Controls were normalized to 1 for each comparison (usually in black bars). See also Figure S5.
To test the contribution of reduced mTORC1 signaling to impaired Fntb-deficient eTreg-cell accumulation, we bred Cd4CreFntbfl/fl mice with Tsc1fl/fl mice that have hyper-activation of mTORC1 signaling (Yang et al., 2011). Co-deletion of Tsc1 largely restored the frequency of eTreg cells (Figure 5F) and completely restored Treg-cell proliferation ex vivo (Figure 5G) and in vitro (Figure S5C) as compared with Cd4CreFntbfl/fl mice. However, co-deletion of Tsc1 did not rescue cellular survival (Figure S5D). We then considered other signaling pathways that may promote Treg-cell survival in vivo. Fntb-deficient or FTI-treated cTreg cells had impaired activation-induced ICOS expression (Figure 5H and I and Figure S5E), and co-deletion of Tsc1 did not appreciably increase ICOS expression on these cells (Figure S5F). Among eTreg cells, ICOS expression was increased on Bcl2lo eTreg cells than Bcl2hi eTreg cells (Figure 5J), consistent with the role of ICOS for maintaining Bcl2lo Treg cells in vivo (Smigiel et al., 2014). Accordingly, there was a reduction of the percentage and number of Bcl2lo eTreg cells in Foxp3CreFntbfl/fl mice (Figure 5K). In the Bcl2lo eTreg-cell subset, Mcl1 expression was reduced and Bim expression was largely unchanged on a per cell basis (Figure 5L). Thus, Fntb regulates the expression of Mcl1 in the Bcl2lo eTreg-cell subset, which likely contributes to their maintenance. To explore the mechanisms by which ICOS expression is regulated, we analyzed Icos expression, which was reduced in Fntb-deficient cTreg cells after TCR stimulation (Figure 5M). Icos is a target of IRF4 (Cretney et al., 2011; Zheng et al., 2009), but IRF4 expression was not reduced in Fntb-deficient cTreg cells after TCR stimulation (Figure S5G). Therefore, we performed transposase-accessible chromatin using sequencing (ATAC-Seq) assay (Buenrostro et al., 2013) with cTreg or eTreg cells isolated from WT or Foxp3CreFntbfl/fl mixed bone marrow chimeras to identify mechanisms of Icos regulation. Unsupervised clustering using principal component analysis (PCA) or sample distance plot analysis showed that WT cTreg and eTreg cells showed distinct chromatin accessibility profiles (Figure 5N and Figure S5H), indicative of extensive remodeling of the chromatin state between these Treg-cell subsets. Further, Fntb-deficient eTreg cells had considerably altered chromatin profiles as compared to WT eTreg cells, whereas WT and Fntb-deficient cTreg cells had more modest differences (Figure 5N and Figure S5H). Transcription factor motif searches in differentially accessible regions of ATAC-Seq (Karmaus et al., 2019; Wei et al., 2019) showed that Fntb-deficient cTreg and eTreg cells had markedly reduced accessibility in regions corresponding to SP family members (SP1–SP4), as well as selective AP-1 family members, including Batf and Jun (Figure 5O and Figure S5I). These results reveal the importance of Fntb in mediating the chromatin state of eTreg cells, including a role in regulating Jun activity that likely contributes to ICOS expression (Koizumi et al., 2018).
To establish the functional relevance of ICOS, we generated retrogenic mice using bone marrow cells from WT or Cd4CreFntbfl/fl mice transduced with empty control (pMIG) or ICOS-expressing vector. ICOS overexpression restored ICOS expression on Fntb-deficient Treg cells (Figure S5J) and partially rescued eTreg-cell frequency and number (Figure 5P). Collectively, these data suggest that mTORC1 and ICOS act as two largely separate pathways to mediate Fntb-dependent eTreg-cell maintenance, where mTORC1 signaling sustains cellular proliferation and ICOS promotes survival of Bcl2lo eTreg cells.
Pggt1b acts as a rheostat for TCR signaling
We performed ATAC-Seq analysis (Buenrostro et al., 2013) of cTreg or eTreg cells from WT or Foxp3CrePggt1bfl/fl mixed bone marrow chimeras for mechanistic insights. Unbiased clustering analyses showed that the chromatin accessibility profiles of Pggt1b-deficient cTreg cells were only modestly different as compared to WT cTreg cells, whereas Pggt1b-deficient eTreg cells were distinct and did not resemble either WT cTreg or eTreg cells (Figure 6A and B). Thus, Pggt1b is important for chromatin remodeling in eTreg cells and, to a lesser extent, cTreg cells. Transcription factor motif searches showed that Pggt1b-deficient eTreg cells had markedly reduced accessibility in regions corresponding to Jun and Fos (AP-1 family) binding sites (Figure 6C and D and Figure S6A), which were enriched in WT eTreg cells than cTreg cells (Figure S6B). NFAT and NF-κB binding sites were also downregulated, albeit to a lesser extent than AP-1 factors (Figure S6A), raising the possibility of reduced TCR signaling in these cells. Odds ratio/odds ratio plot analysis of transcription factor binding motifs of Fntb- and Pggt1b-deficient cTreg or eTreg cells showed that the predicted transcriptional regulators were largely discrete between them, with the exception of Batf or Jun family members that are important eTreg-cell regulators (Figure S6C) (Koizumi et al., 2018; Vasanthakumar et al., 2015). As AP-1 activity is associated with TCR signal strength (Koizumi et al., 2018), we examined TCR signal strength using the surrogates CD5 and Nur77-GFP. GGTI treatment suppressed the upregulation of CD5 and Nur77-GFP upon TCR activation of cTreg cells (Figure 6E), suggesting that Pggt1b tunes TCR signals.
Figure 6. Pggt1b shapes chromatin accessibility and AP-1 transcriptional programming.
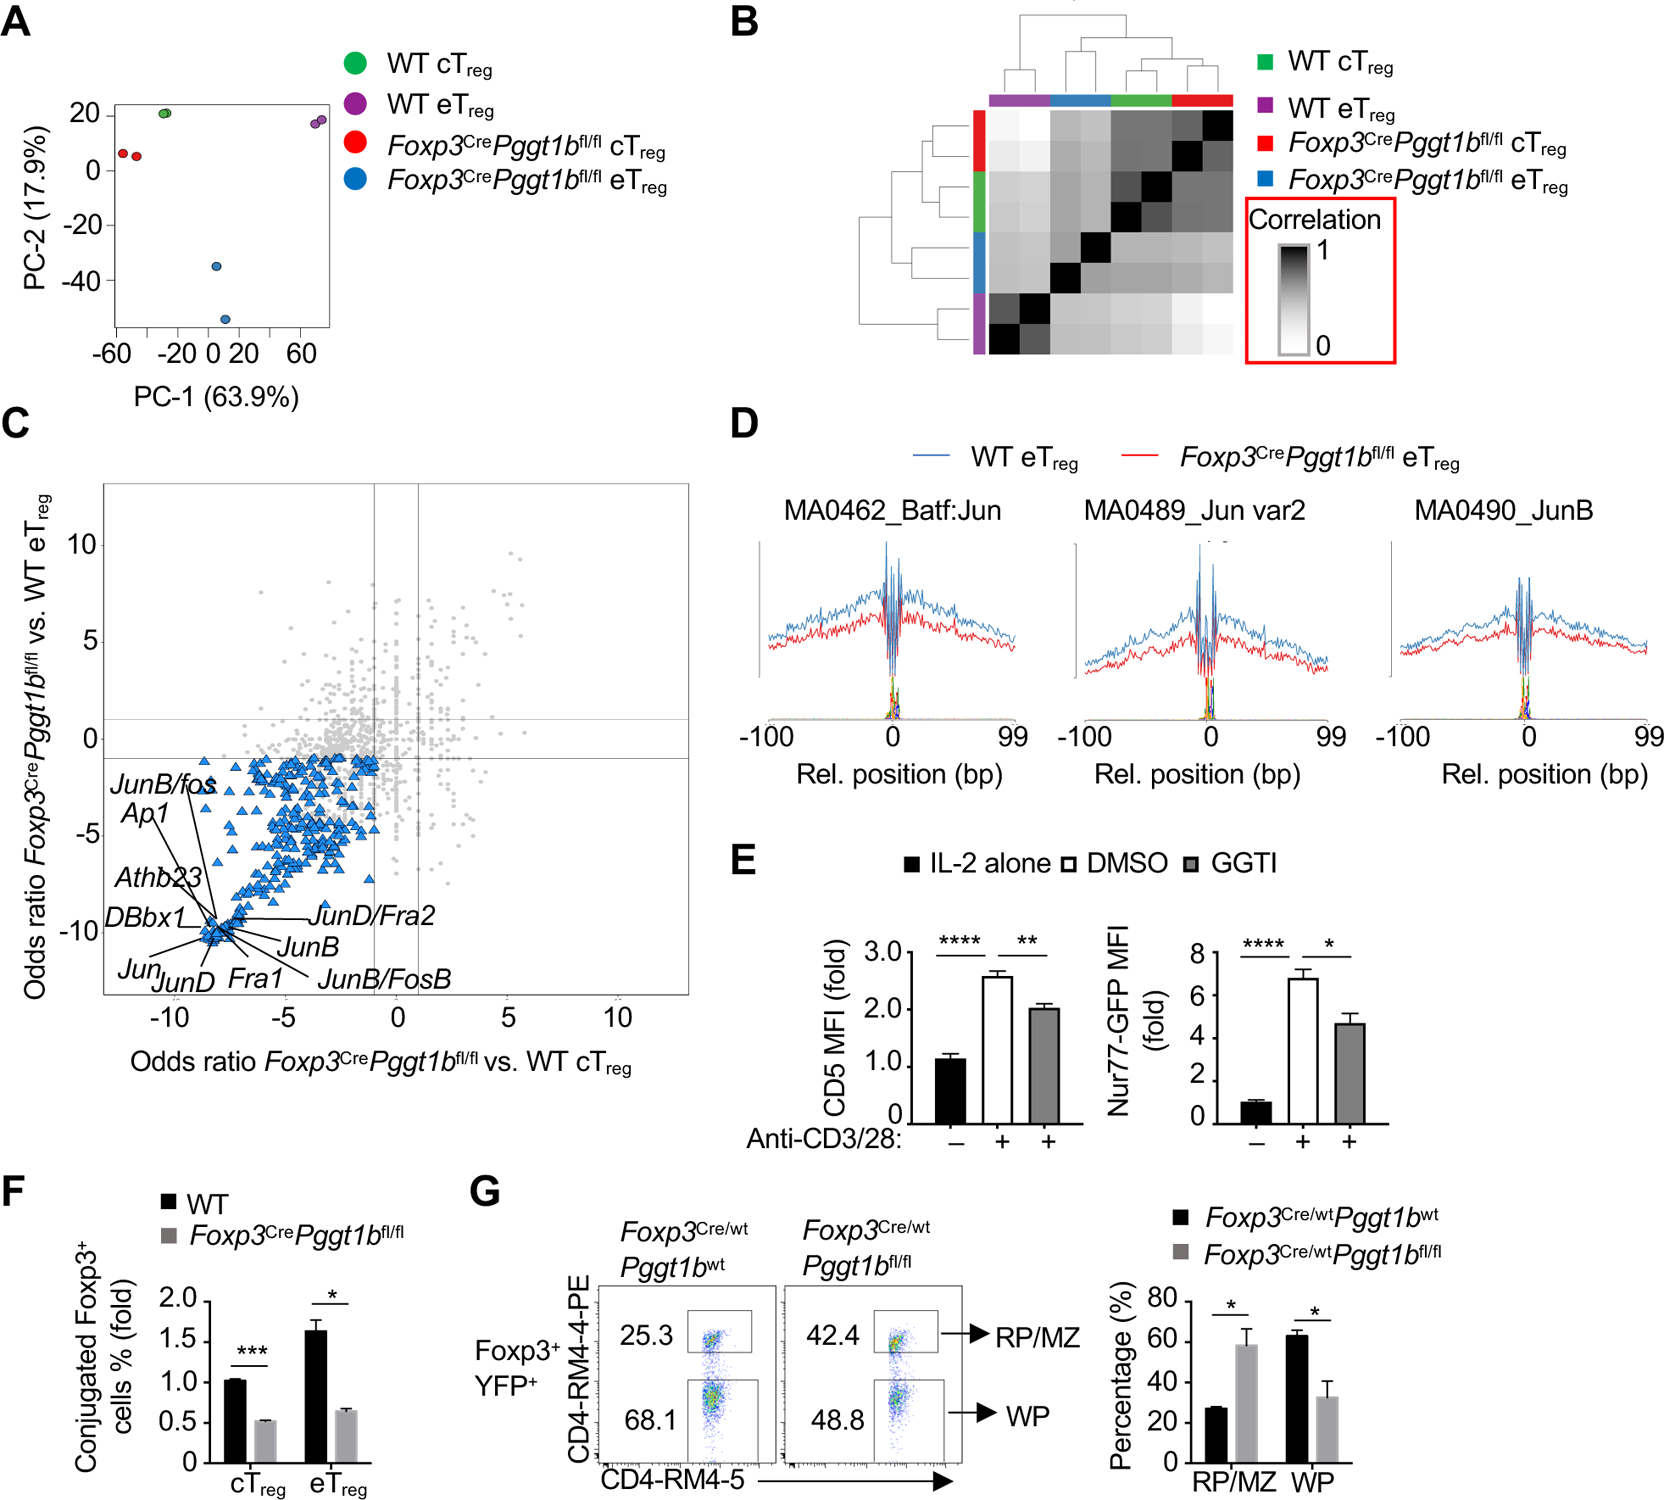
(A) Principal component analysis plot of nucleosome-free reads of cTreg and eTreg cells from WT or Foxp3CrePggt1bfl/fl mixed bone marrow chimeras. (B) Similarity matrix plot of indicated cell populations as in (A). (C) Odds ratio/odds ratio plot of the predicted enriched motifs in Foxp3CrePggt1bfl/fl vs. WT eTreg cells compared with Foxp3CrePggt1bfl/fl vs. WT cTreg as in (A). (D) Binding profiles of Jun family transcription factors in WT or Foxp3CrePggt1bfl/fl eTreg cells as in (A). (E) Quantification of CD5 or Nur77-GFP expression in Foxp3-RFP+ cTreg cells activated by anti-CD3/28 plus IL-2 (or IL-2 alone, black bars) in the presence or absence of GGTI for 24 h. (F) Quantification of conjugate formation of Foxp3-YFP+ cTreg or eTreg cells from WT or Foxp3CrePggt1bfl/fl mice co-cultured with Celltrace Violet-labeled DCs in the presence of IL-2 for 10 h. (G) Flow cytometry analysis and quantification of the frequency of Foxp3+YFP+ Treg cells from WT or Foxp3Cre/wtPggt1bfl/fl ‘mosaic’ mice found in the red pulp/marginal zone(RP/MZ; CD4-RM4–5+CD4-RM4–4-PE+) or white pulp (WP; CD4-RM4–5+CD4-RM4–4-PE−).
Data are representative of two (E), or compiled from two (F, G) independent experiments, with three (E, G) or at least two (F) biological replicates per group. *p < 0.05, **p < 0.01, ***p < 0.001, ****p < 0.0001; two-tailed unpaired Student’s t-test (F, G) or one-way ANOVA (E). Data are mean ± s.e.m. Numbers indicate percentage of cells in gates. Controls were normalized to 1 for each comparison (black bars). See also Figure S6.
To receive TCR signals in vivo, Treg cells interact with antigen-presenting dendritic cells (DCs) in the T-cell zone (Li and Rudensky, 2016). Accordingly, Pggt1b-deficient Treg cells had reduced adhesion to DCs, with a more pronounced defect observed in eTreg cells (Figure 6F). To examine if Pggt1b promotes Treg-cell localization to the T-cell zone, injected WT or Foxp3Cre/wtPggt1bfl/fl ‘mosaic’ mice with anti-CD4-PE (Shi et al., 2018;Smigiel et al., 2014). Pggt1b-deficient Foxp3+YFP+ Treg cells were preferentially accumulated in the splenic red pulp/marginal zone (RP/MZ) and reduced in the white pulp (WP; corresponding to the T-cell zone) compared to WT Foxp3+YFP+ cells (Figure 6G). Thus, Pggt1b is critical for promoting Treg-cell adhesion to DCs that is permissive for TCR signals and for driving their accumulation in the T-cell zone.
Rac signaling is essential for eTreg-cell accumulation and immune tolerance
To identify possible molecular targets of Pggt1b, we used ingenuity pathway analysis, which predicted that several canonical pathways were downregulated in Pggt1b-deficient Treg cells including Rac signaling (Figure S7A). To establish the physiological function of Rac signaling in Treg cells, we generated Foxp3CreRac1fl/flRac2−/− mice, which developed enlarged secondary lymphoid tissues by day 14 after birth (Figure 7A), associated with an increase of effector/memory CD4+ and CD8+ T cells in the spleen and pLN (Figure 7B). eTreg cells were reduced in the absence of Rac1/2 (Figure 7C), which was verified to be cell-intrinsic using Foxp3Cre/wtRac1fl/flRac2−/− ‘mosaic’ mice (Figure 7D). Also, Rac1/2-deficientc Treg cells had reduced capacity to differentiate into eTreg-like cells after in vitro TCR stimulation (Figure S7B), associated with lower CD44 but higher CD62L expression (Figure S7C). Rac1/2-deficient cTreg and eTreg cells also had reduced adhesion to DCs (Figure 7E). To establish a direct link between Pggt1b and dysfunctional Rac signaling, we expressed a constitutively active form of Rac1 (Rac1 G12V) in WT cTreg, followed by TCR stimulation in the presence of different doses of GGTI and analysis of eTreg-like cell differentiation. Expression of Rac1 G12V partially restored the frequency of eTreg-like cells at different doses of GGTI treatment (Figure 7F). These results indicate that Rac signaling contributes to TCR-dependent activation and eTreg-cell differentiation downstream of Pggt1b.
Figure 7. Rac is essential for eTreg-cell differentiation and immune homeostasis.
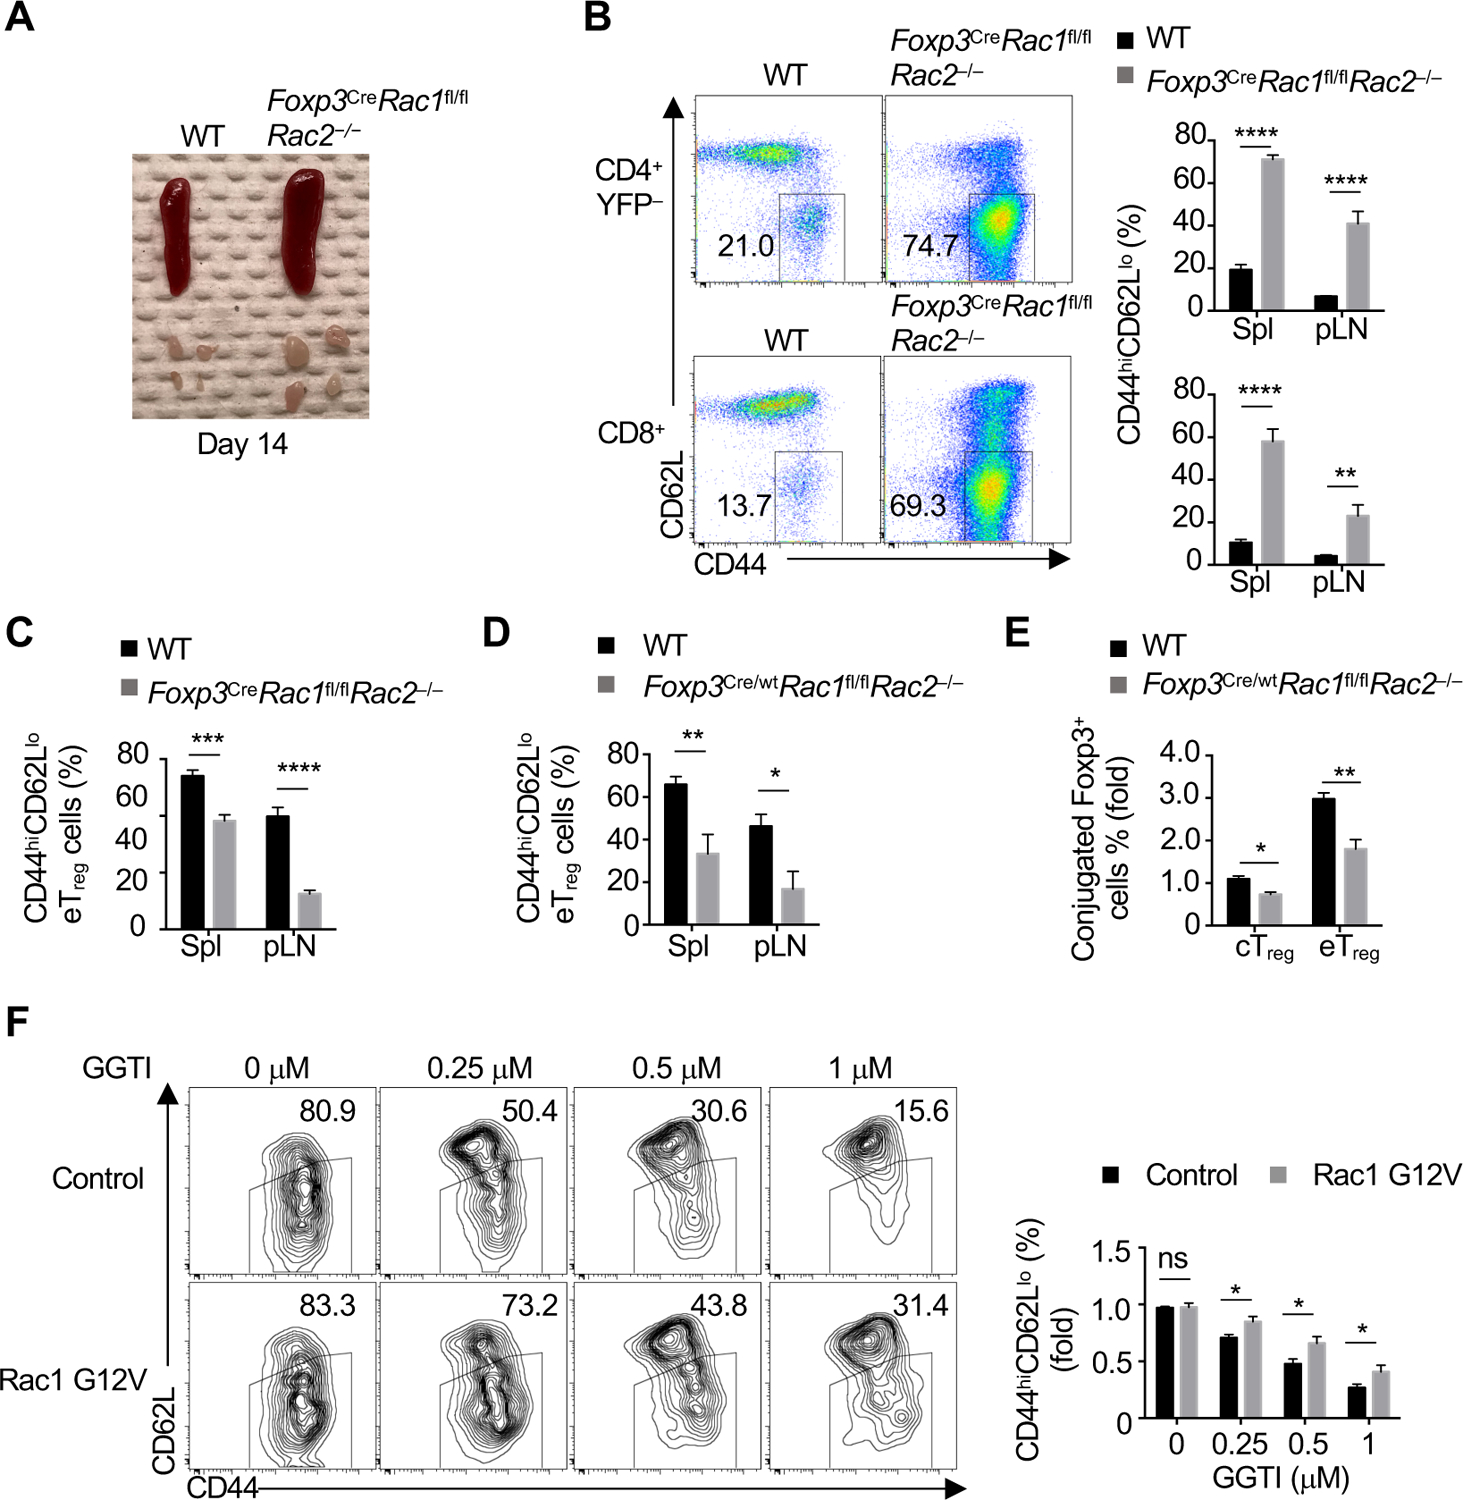
(A) Representative images of enlarged spleen and peripheral lymph nodes (pLN) in WT and Foxp3CreRac1fl/flRac2−/− mice. (B) Flow cytometry analysis (spleen) and quantification of the frequency of CD44hiCD62Llo CD4+Foxp3-YFP− or CD8+ T cells in the spleen (Spl) and pLN of indicated mice. (C) Quantification of the frequency of CD4+Foxp3-YFP+ eTreg cells in the Spleen and pLN of WT and Foxp3CreRac1fl/flRac2−/− mice. (D) Quantification of eTreg cell frequency in indicated organs of WT and Foxp3Cre/wtRac1fl/flRac2 −/− ‘mosaic’ mice. (E) Quantification of conjugate formation of Foxp3-YFP+ cTreg or eTreg cells from indicated ‘mosaic’ mice co-cultured with Celltrace Violet (CTV)-labeled DCs after co-culture in the presence of IL-2 for 10 h. (F) WT cTreg cells activated by anti-CD3/28 for 18 h were transduced with retrovirus expressing empty vector control or Rac1 G12V vector. After resting, CTV-labeled transduced cells pretreated with the indicated doses of GGTI for 2 h were activated with anti-CD3/28 plus IL-2 for 3 days. Flow cytometry analysis and quantification of eTreg-like cell generation.
Data are representative of three (A), or compiled from three (B and C), two (D-E) or three (F) independent experiments, with 7–8 (B, C), 3–5 (D, E) or 10–11 (F) biological replicates per group. *p < 0.05, **p < 0.01, ***p < 0.001, ****p < 0.0001; ns, not significant; two-tailed unpaired Student’s t-test (B–F). Data are mean ± s.e.m. Numbers indicate percentage of cells in gates. Controls were normalized to 1 for each comparison (black bars). See also Figure S7.
Discussion
eTreg-cell programming enforces immune tolerance under steady state and in pathological conditions. Emerging studies highlight metabolic programs in Treg-cell function (Galgani et al., 2016; Newton et al., 2016), but how metabolic pathways regulate their differentiation and persistence, especially at the level of intracellular signaling, is underexplored. Here we established bidirectional metabolic signaling between immunoreceptor signaling and metabolism-dependent posttranslational lipid modifications in eTreg-cell differentiation and maintenance. Specifically, isoprenoids derived from the mevalonate metabolic pathway establish activated Treg-cell suppressive activity, and isoprenoid-dependent protein farnesylation and geranylgeranylation in Treg cells are required for immune tolerance. Further, we identified specific promoting effects of Fntb on mTORC1 activity and ICOS expression for eTreg-cell maintenance, and Pggt1b for mediating TCR activation and Rac signaling for eTreg-cell differentiation. Thus, our studies identify a critical link between cellular metabolism and protein posttranslational lipid modifications necessary for the differentiation and maintenance of eTreg cells.
Treg cells acquire different metabolic programs associated with their activation states (Chapman et al., 2018; Sun et al., 2018; Wei et al., 2016), but how these programs regulate Treg-cell subset differentiation and function is poorly understood. We found that Treg cells undergoing TCR activation upregulate several genes in the mevalonate pathway to generate FPP and GGPP and promote activated Treg-cell suppressive activity. Downstream of the mevalonate–isoprenoid pathway, Fntb and Pggt1b orchestrate eTreg-cell accumulation and absence of Fntb or Pggt1b in Treg cells leads to the development of fatal autoimmunity, consistent with the notion that Hmcgr deficiency also reduces eTreg-cell accumulation in vivo and suppressive function associated with development of autoimmunity (Lacher et al., 2017; Zeng et al., 2013). Notably, mevalonate metabolism may also influence eTreg-cell accumulation via cholesterol biosynthesis essential for T-cell proliferation (Kidani et al., 2013) or by mitochondrial ubiquinone synthesis (Mullen et al., 2016). While isoprenoids are biochemically similar lipid molecules (Berndt et al., 2011), we found that Fntb and Pggt1b serve discrete cellular functions, with Fntb maintaining the eTreg-cell homeostasis by sustaining mTORC1-dependent proliferation as well as expression of ICOS, whose signaling regulates the survival of ICOS-expressing Bcl2lo eTreg cells (Smigiel et al., 2014). In contrast, ablation of Pggt1b selectively abolishes eTreg-cell induction (Smigiel et al., 2014). These findings are consistent with our observations that expression of Pggt1b, but not Fntb, is upregulated during initial Treg-cell activation. Thus, we have uncovered discrete roles for Fntb and Pggt1b in eTreg-cell maintenance and differentiation, highlighting posttranslational lipid modifications as crucial, temporal regulators for eTreg-cell accumulation and function.
Upon TCR stimulation, mTORC1 promotes anabolic metabolism to allow for quiescence exit and programming of effector-like T-cell subsets (Tan et al., 2017; Yang et al., 2013), including eTreg cells (Chapman et al., 2018; Sun et al., 2018). More recently, studies indicated that metabolic pathways regulate mTORC1 signaling. For instance, autophagy is selectively active in eTreg cells and restrains mTORC1 activity to enforce their lineage stability and survival (Wei et al., 2016). These results suggest that eTreg-cell fitness is mediated by the interplay between mTORC1 and anabolic metabolism. We identified Fntb, but not Pggt1b, as an upstream regulator of mTORC1 activity in Treg cells. Of note, Fntb deficiency partially reduces mTORC1 activity at later time points but is insufficient to block eTreg-cell differentiation, unlike ablation of mTOR activity (Chapman et al., 2018). Thus, our data suggest that Fntb may be more important for sustaining mTORC1 activation. In this regard, mTORC1 activity induces expression of mevalonate-pathway enzymes (Zeng et al., 2013), suggesting a bidirectional signaling network, whereby mTORC1 induces FPP generation to mediate protein farnesylation, which in turn sustains mTORC1 activity in eTreg cells.
Several transcription factors have been shown to promote eTreg-cell programming (Cretney et al., 2011; Oh et al., 2017; Vasanthakumar et al., 2017; Vasanthakumar et al., 2015). Also, mitochondrial metabolism regulates transcription via epigenetic pathways (Weinberg et al., 2019), but additional mechanisms by which metabolism influences signaling or transcriptional activity, especially for eTreg-cell commitment, are underexplored. We found that Pggt1b is essential for regulating TCR signal strength and AP-1 activity, which drives eTreg-cell accumulation (Koizumi et al., 2018). Also, Rac signaling is crucial for TCR-dependent eTreg-cell differentiation and immune tolerance in vivo. The mechanism by which Pggt1b affects Rac function remains unclear, but may involve regulation of its expression (Akula et al., 2019). Also, other protein geranylgeranylation targets, such as Cdc42 (Du et al., 2020), may contribute to Treg-cell programming. Together, our observations indicate that metabolism-related posttranslational modifications are rheostats for the maintenance and differentiation of eTreg cells.
In summary, we identified a role for metabolism-driven posttranscriptional lipid modifications in selectively shaping downstream pathways to balance key immunological signaling networks for eTreg-cell maintenance and differentiation. The identification of discrete posttranslational modifications as critical and distinct regulators of Treg-cell function highlights therapeutic possibilities for targeting these pathways in diseases. We also provide mechanisms for the temporal regulation of TCR signaling and mTORC1 and Rac activities that dictate eTreg-cell accumulation. From this prospective, the observations that Fntb and Pggt1b regulate distinct signaling pathways and cellular functions may provide opportunities to selectively modulate Treg-cell activity in autoimmune, cancer, and infectious diseases.
Limitations of study
While our study provides strong evidence for Pggt1b and Fntb as temporal regulators of eTreg-cell homeostasis, Treg-cell survival is defective in the absence of these molecules, the mechanistic basis of which remains unknown. We have established that Pggt1b and Fntb mediate murine Treg-cell suppressive function and immune tolerance in vivo. However, whether these effects extend to human Treg cells remains to be explored. Further, our data reveal the inhibitory effects of simvastatin or Hmgcr deletion on Treg-cell activation and suppressive activity. While cholesterol appears to be dispensable for these processes, whether other mevalonate-derived metabolites contribute to Treg-cell regulation is unknown.
STAR*METHODS
RESOURCE AVAILABILITY
Lead contact
Further information and requests for resources and reagents should be directed to and will be fulfilled by the Lead Contact, Hongbo Chi (hongbo.chi@stjude.org).
Materials availability
Plasmids and mouse lines generated in this study are available on request from the Lead Contact, Hongbo Chi (hongbo.chi@stjude.org) and submission of appropriate Materials Transfer Agreements.
Data and code availability
The accession number for the microarray data of CD4+YFP+ WT and Fntb- or Pggt1b-deficient Treg cells from mixed bone marrow chimeras reported in this paper is GSE158863. The accession number for the microarray data of CD4+YFP+ cTreg cells treated with FTI or GGTI and stimulated with anti-CD3/28 plus IL-2 for different times in this paper is GSE158863. The accession number for the ATAC-Seq data of CD4+YFP+ WT and Fntb- or Pggt1b-deficient cTreg and eTreg cells from mixed bone marrow chimeras reported in this paper is GSE158863.
EXPERIMENTAL MODEL AND SUBJECT DETAILS
Mice
Rag1−/−, CD45.1+, Cd4Cre, Tsc1fl/fl, Rac1fl/fl, Rac2−/−, Foxp3-RFP, Nur77-GFP and C57BL/6 mice were purchased from the Jackson Laboratory. Fntbfl/fl and Pggt1bfl/fl mice were kind gifts from M. Bergo (Khan et al., 2011; Liu et al., 2010). Foxp3Cre mice were from A. Rudensky (Rubtsov et al., 2008). All genetic models were on the C57BL/6 background. Both male and female mice were used for analysis and quantification. Foxp3CreFntbfl/fl and Foxp3CrePggt1bfl/fl mice were used at various ages as indicated in figure legends, with age- and gender-matched Foxp3CreFntbwt or Foxp3CreFntbfl/wt and Foxp3CrePggt1bwt or Foxp3CrePggt1bfl/wt mice as controls (indicated as WT in figure legends). All mice were kept in a specific pathogen-free facility in the Animal Resource Center at St. Jude Children’s Research Hospital. Mice were housed up to 5 mice per cage in a temperature- (25–25 °C) and humidity-controlled colony room maintained on a 12 h light/dark cycle (06:00–18:00 light on). Standard chow (Purina LabDiet® Autoclavable Rodent Breeder Diet #5013) and water were provided ad libitum. The health status of mice was monitored by trained husbandry staff or researchers at least once daily. Animal protocols were approved by the Institutional Animal Care and Use Committee of St. Jude Children’s Research Hospital.
METHOD DETAILS
Mixed bone marrow chimera generation
Bone marrow cells isolated from tibia and femur were used to generate mixed bone marrow chimeras, by transferring 2×10⁶ T cell-depleted CD45.2+ bone marrow cells from Foxp3CreFntbfl/fl or Foxp3CrePggt1bfl/fl mice (or their sex-matched littermate controls) and CD45.1+ WT bone marrow cells at ratio of 1:1 into sub-lethally irradiated (5 Gy) Rag1−/− mice. Mice were analyzed at 7–8 weeks after reconstitution.
Retrogenic mouse generation
To generate retrogenic mice, bone marrow cells from the femur and tibia of WT or inflammation-free Cd4CreFntbfl/fl mice were enriched for lineage-negative (Lin−) cells using the Lineage Cell Depletion kit (Miltenyi Biotec). The cells were cultured in Dulbecco’s modified essential medium (DMEM) supplemented with 20% fetal bovine serum (FBS), recombinant human IL-6 (50 ng/ml), murine IL-2 (20 ng/ml), and murine stem cell factor (SCF, 50 ng/ml) for 2 days. Retroviruses were produced by transfecting Plat-E cells with the pMIG or pMIG-ICOS-OE (Sino Biological) retroviral vectors. Retrovirus (MOI: 10–20) was preloaded onto retronectin-coated plate by centrifugation at 1,000× g for 2 h at 4 °C. Bone marrow cells pre-activated with IL-3, IL-6 and SCF for 48 h were centrifuged onto the plates preloaded with retrovirus at 2,500 rpm for 2 h at room temperature and incubated for another 24 h at 37 °C. Transduced bone marrow cells were harvested and injected into sub-lethally irradiated (5 Gy) Rag1−/− mice for reconstitution. Bleeding and analysis were performed at 8 weeks after reconstitution.
Flow cytometry
For analysis of surface markers, cells were stained in PBS containing 2% (wt/vol) bovine serum albumin (BSA), with anti-CD4 (RM4–5), anti-CD4 (RM4–4), anti-CD5 (53–7.3), anti-CD8α (53–6.7), anti-TCRβ (H57–597), anti-CD44 (1M7), anti-CD62L (MEL-14), anti-CD69 (H1.22F3), anti-CD45.1 (A20), anti-CD45.2 (104), anti-CD25 (PC61.5), anti-ICOS (7E.17G9), anti-CTLA4 (UC10–4F10–11), anti-CD73 (TY/11.8), anti-CXCR3 (CXCR3–173), and anti-KLRG1 (2F1/KLRG1) (Tonbo Biosciences or eBioscience). Intracellular Foxp3 (FJK-16s), Ki67 (SolA15), IFN-γ (XMG1.2), IL-4 (11B11), IL-17 (17B7), Mcl1 (LVUBKM; all from eBioscience), Bcl2 (BCL/10C4, Biolegend), Bim (C34C5), p-S6 (D57.2.2E), and p-4EBP1 (236B4; all from Cell Signaling Technology) were analyzed by flow cytometry according to the manufacturer’s instructions. For intracellular cytokine staining, splenocytes containing T cells were stimulated for 4 h with PMA and ionomycin in the presence of monensin before intracellular staining according to the manufacturer’s instructions (eBioscience). For phospho-flow staining, the cells were stained with FVD and fixed by phospho-flow buffers (BD Biosciences) before performing intracellular staining. To monitor cell division and cell death, lymphocytes were labeled with CTV (2.5 μM; Life Technologies) and FVD per the manufacturer’s instructions. Flow cytometry data were acquired on LSR Fortessa or LSRII (BD Biosciences) and analyzed using FlowJo software (Tree Star).
Pathology and immunohistochemistry
All tissues were fixed in formalin, embedded in paraffin, sectioned at 4 μm, mounted on positively charged glass slides (Superfrost Plus; Thermo Fisher Scientific), and dried at 60 °C for 20 min before dewaxing and staining with hematoxylin and eosin (H&E) using standard methods. For immunohistochemical staining, the primary antibodies included the following: for T cells, anti-CD4 (1:40 dilution, Cat # 14–9766; Thermo Fisher) and anti-CD8 (1:40 dilution, Cat # 14–0808-82; Thermo Fisher); for macrophages, anti-Iba1 (1:300 dilution, Cat # CP290A; Biocare Medical) and anti-arginase 1 (1:40 dilution, Cat # sc-20150; Biocare Medical); and anti-Mcpt1 monoclonal antibody for interepithelial mucosal mast cells (1:30 dilution, Cat # 14–55303-82, eBioscience). For detection of CD4 and Mcpt1, sections underwent antigen retrieval at 100 °C for 20 min in Epitope Retrieval solution 2 (ER2) on a Bond Max immunostainer (Leica Biosystems). Then biotinylated secondary rabbit anti-rat antibody diluted 1:400 (BA-4001; Vector Laboratories) was applied for 10 min, followed by Bond polymer refine detection kit with 3,3’-diaminobenzidine (DAB) as chromogenic substrate and a hematoxylin counterstain (DS9800; Leica Biosystems). For detection of CD8, Iba1 and arginase 1, tissue sections underwent antigen retrieval in a prediluted Cell Conditioning Solution (CC1) (Ventana Medical Systems) for 32 min. For anti-CD8, a biotinylated secondary rabbit anti-goat antibody (1:400 dilution; BA-5000; Vector Laboratories) was applied for 10 min, while for anti-Iba1 and anti-arginase 1, the OmniMap anti-rabbit HRP kit (Ventana Medical Systems) was used for detection. ChromoMap DAB was the chromogen for CD8, CD4, Iba1, and Mcpt1, whereas the Discovery Purple chromogen was used for arginase 1 (both from Ventana Medical Systems). All sections were examined by a pathologist blinded to the experimental group assignments (author P.V.).
Cell purification and culture
For isolation of DCs, spleens were digested with collagenase D (Worthington), followed by enrichment with CD11c microbeads (Miltenyi Biotec) and sorting for TCRβ−B220−CD49b− CD11c+ DCs. Unless otherwise noted, lymphocytes were isolated from spleen and pLN (including inguinal, auxiliary and cervical lymph nodes), and naïve CD4+ T cells (CD4+ Foxp3-YFP− CD44loCD62Lhi), Treg cells (CD4+Foxp3-YFP+ or CD4+CD25+) or cTreg cells (CD4+Foxp3-YFP+CD44loCD62Lhi or CD4+CD25+CD44loCD62Lhi) from Foxp3Cre or C57BL/6 mice were sorted on a MoFlow (Beckman-Coulter) or Reflection (i-Cyt). Sorted Treg cells were cultured in plates coated with anti-CD3 (145–2C11, 10 μg/ml) and anti-CD28 (37.51; 10 μg/ml; both from Bio X Cell) antibodies for indicated times in complete Click’s medium [Click’s medium supplemented with β-mercaptoethanol, 10% (vol/vol) FBS, 1% (vol/vol) penicillin-streptomycin] and IL-2 (200 U/ml). All cell culture experiments were performed at 37 °C with 5% CO2. In some experiments, GGTI-2147 (5 μM) (345885, Calbiochem), FTI-277 (10 μM) (2407, Tocris), DGBP (25 μM). cTreg cells were pretreated with inhibitors for 1 h and then stimulated with 10 μg/ml anti-CD3/28 antibodies plus 200 U/ml IL-2 in the presence of inhibitors. Retrovirus containing GFP control or GFP-Rac1 G12V vector was produced in Plat-E cells as described above. For Rac1 G12V overexpression, cTreg cells isolated from C57BL/6 mice were activated with 10 μg/ml anti-CD3/28 antibodies plus 200 U/ml IL-2 for 18 h, followed by spin-transduction (MOI: 10–20) at 900× g for 3 h at 25 °C in the presence of 10 μg/ml polybrene (Shi et al., 2018). The cells were cultured in complete Click’s medium with 200 U/ml IL-2 for overnight at 37 °C. The cells were labeled with 2.5 μM CTV for 15 min, pretreated with GGTI for 1 h, and stimulated with 10 μg/ml anti-CD3/28 antibodies plus 200 U/ml IL-2 in the presence of GGTI for 3 days. Cells were harvested for flow cytometry analysis at different time points as indicated in figure legends. Treg-cell suppressive assays were performed by co-culture of WT Treg cells activated for 3 days with anti-CD3/28 antibodies plus IL-2 in the presence of simvastatin (2 μM) (567021, EMD Millipore) without or with mevalonate (500 μM; M4667, Sigma), FPP (20 μM; F6892, Sigma) or GGPP (5 μM; G6025, Sigma), or using purified Treg cells from WT and Foxp3CreFntbfl/fl or Foxp3CrePggt1bfl/fl mice and naïve CD4+ T cells from WT mice as previously described (Zeng et al., 2013).
In vitro conjugation assay
Lymphocytes isolated from the spleen and pLN (including inguinal, auxiliary and cervical lymph nodes) and CD11c+ DCs from the spleen of C57BL/6 mice were sorted as mentioned above. DCs were labeled with CTV. cTreg cells (CD4+Foxp3-YFP+CD44loCD62Lhi) or eTreg cells (CD4+Foxp3-YFP+CD44hiCD62Llo) (1×10⁴) from Foxp3Cre mice were cultured together with 6×10⁴ DCs in a 96-well round-bottomed plate in complete Click’s medium in the presence of 500 U/ml IL-2 as described previously (Levine et al., 2014). Following 10 h of co-culture at 37 °C, cell conjugates (CTV+YFP+) were resuspended and analyzed by flow cytometry.
In vivo T-cell labeling
Anti-CD4-PE (clone RM4–4; 2 μg) was administrated to mice by i.v. injection, and then mice were sacrificed after 5 min of labeling (Luo et al., 2016; Shi et al., 2018). Splenocytes were analyzed by flow cytometry after surface staining with anti-CD4 (clone RM4–5) antibody. Cells restricted to the RP/MZ were identified based on co-labeling of anti-CD4-RM4–4-PE (PE+) and anti-CD4-RM4–5, while cells in the WP were identified by single labeling with anti-CD4-RM4–5 (PE−) by flow cytometry.
ATAC-Seq library preparation
CD45.2+ cTreg cells and CD45.2+CD4+YFP+CD62LloCD44hi eTreg cells were sorted from mixed bone marrow chimeras (described above). ATAC-Seq samples were prepared as previously described (Karmaus et al., 2019; Wei et al., 2019). Briefly, cells were lysed in 50 μl lysis buffer (10 mM Tris-HCl, pH 7.4, 10 mM NaCl, 3 mM MgCl2, 0.1% IGEPAL CA-630) on ice for 10 min followed by centrifugation (500× g, 10 min, 4 °C). The supernatant was carefully discarded by pipette and the pelleted nuclei were resuspended in 50 μl transposase reaction mix (25 μl 2× TD buffer, 22.5 μl nuclease-free water, and 2.5 μl Transposase enzyme) and then incubated for 30 min at 37 °C. DNA from the Transposase reaction was cleaned up using the Qiagen MinElute kit. The barcoding reaction was amplified for 5 cycles according to manufacturer’s instructions (Illumina) using the NEBNext HiFi kit and verified barcoding primers. Five μl of the barcoding reaction was used to determine the ideal remaining cycle number using KAPA SYBRFast (Kapa Biosystems) reagents and real-time PCR (Applied Biosystems 7900HT). The remaining 45 μl of sample was amplified in the same reaction mix using the optimal cycle number.
ATAC-Seq analysis
ATAC-Seq data were analyzed as described (Karmaus et al., 2019; Wei et al., 2019). In brief, 2×100-bp paired-end reads from samples were trimmed for Nextera adaptor by trimmomatic version 0.36 (parameters ILLUMINACLIP:adaptor.fa:2:30:10 LEADING:10 TRAILING:10 SLIDINGWINDOW:4:18 MINLEN:25) and then aligned to the mouse genome mm9 (downloaded from gencode release M1 (https://www.gencodegenes.org/mouse/releases.html)) by BWA (version 0.7.16a, default parameters) (Li and Durbin, 2009). Duplicated reads were labeled with Picard (version 2.9.4), and only non-duplicated paired reads were analyzed further as determined by samtools (parameter ‘-q 1 -F 1804’ version 1.9) (Li et al., 2009). With the adjustment of Tn5 shift (reads were offset were offset by +4 bp for the sense strand and −5 bp for the antisense strand), the reads were separated into nucleosome-free, mono-, di- and trinucleosomes by fragment size. A file of bigwig was generated by using the central fragment of 80-bp and then scaled to 30×106 nucleosome-free reads. Several peaks, including nucleosome-free, mono-, di- and tri-nucleosomes, were observed on IGV (version 2.4.13) (Robinson et al., 2011). Samples from each group had about 20×106 nucleosome-free reads on average. MACS2 was used for peak calling on each sample (with default parameters and with ‘–extsize 200– nomodel’) (Zhang et al., 2008). To ensure reproducibility, nucleosome-free regions of each genotype were re-finalized. Peaks from each replicate were kept if they were present in at least 50% of the replicates, followed by merging of all the peaks if they overlapped by 100-bp. Nucleosome-free reads from each of samples were calculated by the bedtools (version 2.25.0) (Quinlan and Hall, 2010). To find the differentially accessible regions, raw nucleosome-free reads counts were normalized by counts per million (CPM) method implemented in DEseq2 (version 1.24.0). FDR-corrected p-value < 0.05 and fold change (log2 ratio) > 0.5 were used as cutoffs for more-accessible or less-accessible regions in Foxp3CrePggt1bfl/fl samples. The differentially accessible regions in ATAC-Seq data were annotated as the nearest genes using Homer annoatePeaks.pl (version 4.9.1). For motif analysis, the regions with CPM greater than first quartile of all CPM and least variable according to their median absolute deviation (MAD) score and FDR p-value > 0.5 were used as control regions. FIMO from MEME suite (version 4.11.3, ‘–thresh 1e-4–motif-pseudo 0.0001’) was selected for scanning motif (TRANSFAC database, only included vertebrata and not 3D structure-based) matched to the nucleosome-free regions (Bailey et al., 2009). The significantly enriched motifs were determined by comparing differentially accessible regions to the control regions using two tailed Fisher’s exact test. Footprinting of transcription-factor binding sites was performed using methods and regulatory genome tools box (RGT) as described (Gusmao et al., 2016; Karmaus et al., 2019; Li et al., 2019; Wei et al., 2019).
RNA and immunoblot analysis
Real-time PCR analysis was performed with primers and probe sets from Applied Biosystems or using Power SYBR Green master mix from Life Technologies as described (Zeng et al., 2013). The ABI probes were Pggt1b (Mm01266356_m1), Icos (Mm00497600_m1) and Actb (Mm00607939_s1). The primers for SYBR Green real-time PCR master mix were Fntb (forward: 5’-AACCGCTGTATAGTCTGAGACC-3’, reverse: 5’-TCTCCCTCTGCAAAATGAGCC-3’), Hmgcr (forward: 5’-AGCTTGCCCGAATTGTATGTG-3’, reverse: 5’-TCTGTTGTGAACCATGTGACTTC-3’), Hmgcs1 (forward: 5’-AACTGGTGCAGAAATCTCTAGC-3’, reverse: 5’-GGTTGAATAGCTCAGAACTAGCC-3’), Fnta (forward: 5’-CCCTATGGACGACGGGTTTC-3’, reverse: 5’-TGATCTGGACCACTGGGTTAG-3’) and Actb (forward: 5’-GACAGGATGCAGAAGGAGATTACTG-3’, reverse: 5’-GCTGATCCACATCTGCTGGAA-3’). Immunoblots were performed as described (Yang et al., 2011) using the following antibodies: p-S6 (2F9), p-4EBP1 (236B4; both from Cell Signaling Technology), Rap1A (C-17; Santa Cruz Biotechnology), HDJ2 (KA2A5.6; Neomarkers), β-actin (AC-15; Sigma), and β-tubulin (Cell Signaling Technology).
Gene-expression profiling and bioinformatic analysis
RNA samples purified from CD45.2+ Treg cells from Foxp3CreFntbfl/wt (n = 4) or Foxp3CreFntbfl/fl (n = 4) mixed bone marrow chimeras were analyzed with the GeneChip Mouse Gene 2.0 ST array. RNA samples purified from CD45.2+ Treg cells from Foxp3CrePggt1bfl/wt (n = 5) or Foxp3CrePggt1bfl/fl (n = 4) mixed bone marrow chimeras were analyzed with Clariom S mouse array. For other experiments, cTreg cells were activated with anti-CD3/28 antibodies (10 μg/ml) + IL-2 (200 U/ml) for 18 or 48 h in the presence of DMSO control, GGTI-2147 (5 μM) or FTI-277 (10 μM). RNA samples from these cells were analyzed with Clariom S mouse array. Differentially expressed transcripts [|log2 (FC)| > 0.5 and FDR < 0.05] were identified using linear model implemented in R package limma v.3.34.9, and the Benjamini-Hochberg method was used to estimate the FDR as described (Zeng et al., 2013). For analysis of cTreg cells activated in the presence of FTI or GGTI, WGCNA (Zhang and Horvath, 2005) was performed using WGCNA R package v. 1.66. We defined co-expression clusters using differentially expressed genes [log2 (FC) > 0.5 and FDR < 0.05 in at one of the conditions]. Pearson correlation matrix was calculated using the 12 samples treated with DMSO, FTI or GGTI at 0 h or 48 h, followed by an adjacency matrix calculation, with correlation matrix raised to a power of 9 using scale-free topology criterion (Zhang and Horvath, 2005). Co-expression clusters were defined by hybrid, dynamic tree-cutting method, with minimum height for merging module set at 0.2. A consensus trend for each co-expression cluster was defined based on the first principal component (eigengene) and cluster membership was defined as Pearson correlation between individual genes and the consensus trend of the co-expression cluster. Genes were assigned to most correlated co-expression cluster with cutoff of r > 0.7. Each co-expression cluster was annotated using either hallmark pathways downloaded from MsigDB by right-tailed Fisher’s exact test. Functional enrichment analysis was performed using right-tailed Fisher’s exact test, using differentially expressed genes at the log2 (FC) > 0.5 and FDR < 0.05 cut-offs. Microarray data have been deposited into the GEO database and accession code is available upon request.
For the above transcriptome analysis or for public datasets (Arvey et al., 2014; Wakamatsu et al., 2013), gene set enrichment analysis of hallmark pathways or public datasets or literature curated pathways [TCR and eTreg (Levine et al., 2014)] was performed as described (Zeng et al., 2013). The manual curation of mevalonate and cholesterol pathway genes was based on the literature (Berndt et al., 2011; Mullen et al., 2016; Wang and Casey, 2016) and included the following genes: Acat1, Fnta, Fntb, Fdft1, Fdps, Ggps1, Hmgcr, Hmgcs1, Idi1, Idi2, Mvd, Mvk, Pmvk, and Pggt1b.
QUANTIFICATION AND STATISTICAL ANALYSIS
Prism 6 software (GraphPad) was used to analyze data by two-tailed unpaired Student’s t-test as indicated in figure legends. When multiple groups were compared, one-way ANOVA with the Tukey’s test was performed as indicated in figure legends. p < 0.05 was considered significant, with specific p-values indicated in figures and figure legends. No method was used to test for normal distribution of data. Data are presented as mean ± s.e.m.
Supplementary Material
KEY RESOURCES TABLE
| REAGENT or RESOURCE | SOURCE | IDENTIFIER |
|---|---|---|
| Antibodies | ||
| Anti-CD4 (RM4–5) | Thermo Fisher Scientific | Cat# 48–0042-80; RRID:AB_1272231 |
| Anti-CD4 (RM4–4, in vivo labeling) | BioLegend | Cat# 116006; RRID:AB_313691 |
| Anti-CD8α (53–6.7) | BioLegend | Cat# 100742; RRID:AB_2563056 |
| Anti-TCRβ (H57–597) | Thermo Fisher Scientific | Cat# 47–5961-82; RRID:AB_1272173 |
| Anti-CD44 (1M7) | BioLegend | Cat# 103047; RRID:AB_2562451 |
| Anti-CD62L (MEL-14) | Tonbo Biosciences | Cat# 60–0621; RRID:AB_469632 |
| Anti-CD69 (H1.2F3) | Thermo Fisher Scientific | Cat# 48–0691-82; RRID:AB_10719430 |
| Anti-PD-1 (J43) | Thermo Fisher Scientific | Cat# 17–9985-80; RRID:AB_11149860 |
| Anti-CD45.1 (A20) | BioLegend | Cat# 110736; RRID:AB_2562564 |
| Anti-CD45.2 (104) | Thermo Fisher Scientific | Cat# 48–0454-80; RRID:AB_11039533 |
| Anti-CD25 (PC61.5) | Thermo Fisher Scientific | Cat# 17–0251-82; RRID:AB_469366 |
| Anti-Foxp3 (FJK-16s) | Thermo Fisher Scientific | Cat# 12–5773-80; RRID:AB_465935 |
| Anti-Ki67 (SolA15) | Thermo Fisher Scientific | Cat# 25–5698-80; RRID:AB_11217689 |
| Anti-Bim (C34C5) | Cell Signaling Technology | Cat# 2933; RRID:AB_1030947 |
| Anti-GFP-Alexa Fluor 488 (FM264G) | BioLegend | Cat# 338008; RRID:AB_2563288 |
| Anti-IFN-γ (XMG1.2) | Thermo Fisher Scientific | Cat# 17–7311-81; RRID:AB_469503 |
| Anti-IL-4 (11B11) | Thermo Fisher Scientific | Cat# 12–7041-71; RRID:AB_466154 |
| Anti-IL-17 (eBio17B7) | Thermo Fisher Scientific | Cat# 45–7177-80; RRID:AB_925754 |
| Anti-CD3 (145–2C11) | Bio-X-Cell | Cat# BE0001; RRID:AB_2714218 |
| Anti-CD28 (37.51) | Bio-X-Cell | Cat# BE0015–1; RRID:AB_1107624 |
| Anti-β-actin (C4)-HRP | Santa Cruz Biotechnology | Cat# sc-47778 HRP; AB_2714189 |
| Anti-β-tubulin | Cell Signaling Technology | Cat# 2146, RRID:AB_2210545 |
| Anti-phospho-S6 (S235/236) (D57.2.2E) | Cell Signaling Technology | Cat# 4858; RRID:AB_916156 |
| Anti-phospho-4EBP1 (Thr37/46) (236B4) |
Cell Signaling Technology | Cat# 2855; RRID: AB_560835 |
| Anti-phospho-4EBP1 (Thr37/46) (236B4) -Alexa Fluor 647 conjugate |
Cell Signaling Technology | Cat# 5123 RRID: AB_2097838 |
| Anti-phospho-S6 (S235/236) (D57.2.2E)-Pacific Blue™ conjugate | Cell Signaling Technology | Cat# 8520, RRID:AB_2797646 |
| Anti-Mcl1 (LVUBKM) | Thermo Fisher Scientific | Cat# 12–9047-42, RRID:AB_2762598 |
| Anti-Bcl2 (BCL/10C4) | BioLegend | Cat# 633510, RRID:AB_2274702 |
| Anti-ICOS (7E.17G9) | Thermo Fisher Scientific | Cat# 12–9942-82, RRID:AB_466274 |
| Anti-CTLA4 (UC10–4B9) | BioLegend | Cat# 106312, RRID:AB_2563063 |
| Anti-KLRG1 (2F1) | BioLegend | Cat# 138419, RRID:AB_2563357 |
| Anti-CXCR3 (CXCR3–173) | BioLegend | Cat# 126531, RRID:AB_2563160 |
| Anti-CD73 (TY/11.8) | BioLegend | Cat# 127212, RRID:AB_11219190 |
| Anti-CD5 (53–7.3) | Thermo Fisher Scientific | Cat# 12–0051-81, RRID:AB_465522 |
| Anti-Bim (C34C5) | Cell Signaling Technology | Cat# 12186, RRID:AB_2797842 |
| Anti-Rap1A (C-17) | Santa Cruz Biotechnology | Cat# sc-1482, RRID:AB_2177124 |
| Anti-HDJ2 (KA2A5.6) | Lab Vision | Cat# MS-225-P0, RRID:AB_61951 |
| Anti-Rabbit IgG HRP conjugate | Promega | Cat# W4011, RRID:AB_430833 |
| Anti-Mouse IgG HRP conjugate | Promega | Cat# W4021, RRID:AB_430834 |
| Anti-Goat IgG HRP conjugate (sc-2345) | Santa Cruz Biotechnology | Cat# sc-2354, RRID:AB_628490 |
| Chemicals, Peptides, and Recombinant Proteins | ||
| 7-Aminoactinoymycin D (7AAD) | Sigma-Aldrich | Cat# A9400 |
| Simvastatin | Selleck Chemicals | Cat# S1792 |
| FTI-277 | Tocris | Cat# 2407 |
| GGTI-2147 | Sigma-Aldrich | Cat# 191102–87-1 |
| (+)-Mevalonolactone (dehydrated mevalonate) | Sigma-Aldrich | Cat# M4667–5G |
| Farnesyl pyrophosphate ammonium salt (FPP) | Sigma-Aldrich | Cat# 13058–04-3 |
| Geranylgeranyl pyrophosphate ammonium salt (GGPP) | Sigma-Aldrich | Cat# G6025 |
| Fixable Viability Dye eFluor™ 780 | Thermo Fisher Scientific | Cat# 65–0865-18 |
| Recombinant human IL-2 (in vitro stimulation) | R&D Systems | Cat# 202-IL |
| Phobol 12-myristate 13-acetate (PMA) | Sigma-Aldrich | Cat# P8139 |
| Ionomycin | Sigma-Aldrich | Cat# I0634 |
| Golgi-STOP | BD Biosciences | Cat# 554724 |
| Recombinant human IL-6 | National Cancer Institute | Cat# NSC720836 |
| Recombinant murine IL-3 | Thermo Fisher Scientific | Cat# PMC0034 |
| Recombinant murine stem-cell factor (SCF) | Thermo Fisher Scientific | Cat# PMC2115 |
| ABI probe: Pggt1b | Thermo Fisher Scientific | Mm01266356_m1 |
| ABI probe: Icos | Thermo Fisher Scientific | Mm00497600_m1 |
| ABI probe: Actb | Thermo Fisher Scientific | Mm00607939_s1 |
| Commercial Reagents | ||
| Foxp3 transcription factor staining buffer set | Thermo Fisher Scientific | Cat# 00–5523-00 |
| Cytofix/Cytoperm™ Fixation/Permeabilization Solution Kit | BD Biosciences | Cat# 554714 |
| CD4 (3LT4) Microbeads, mouse | Miltenyi Biotec | Cat# 130–117-043 |
| Lineage cell depletion kit | Miltenyi Biotec | Cat# 130–090-858 |
| Transfection reagent | Mirus | Cat# MIR2706 |
| 10× Perm/Wash Buffer | BD Biosciences | Cat# 554723 |
| Clariom S mouse array | Thermo Fisher Scientific | Cat# 902930 |
| BD Phosflow™ Fix Buffer I | BD Biosciences | Cat# 557870 |
| Phosflow™ Perm Buffer III | BD Biosciences | Cat# 558050 |
| CellTrace™ Violet Cell Proliferation Kit | Thermo Fisher Scientific | Ca# C34557 |
| Deposited Data | ||
| Fntb- or Pggt1b-deficient Treg-cell microarray data from mixed bone marrow chimeras | GEO (http://www.ncbi.nlm.nih.gov/geo/) | GSE158863 |
| In vitro cTreg-cell microarray data from DMSO, FTI, or GGTI treatments | GEO (http://www.ncbi.nlm.nih.gov/geo/) | GSE158863 |
| ATAC-Seq data | GEO (http://www.ncbi.nlm.nih.gov/geo/) | GSE158863 |
| Experimental Models: Cell Lines | ||
| Plat-E | Dr. Yun-Cai Liu, La Jolla Institute of Immunology | N/A |
| Experimental Models: Organisms/Strains | ||
| Mouse: C57BL/6J | The Jackson Laboratory | Cat# 000664; RRID:IMSR_JAX:000664 |
| Mouse: Fntbfl/fl | M. Bergo (Liu et al., 2010) | N/A |
| Mouse: Pggt1bfl/fl | M. Bergo (Khan et al., 2011) | N/A |
| Mouse: Hmgcrfl/fl | A. Waisman | N/A |
| Mouse: CD45.1+: B6.SJL-Ptprca Pep3b/BoyJ | The Jackson Laboratory | Cat# 002014; RRID:IMSR_JAX:002014 |
| Mouse: Cd4 Cre: Tg(Cd4-cre)1Cwi/BfluJ | The Jackson Laboratory | Cat# 017336; RRID:IMSR_JAX:017336 |
| Mouse: Rag1−/−: Rag1tm1Mom/J | The Jackson Laboratory | Cat# 002216; RRID:IMSR_JAX:002216 |
| Mouse: Foxp3YFP-Cre | A. Rudensky (Rubtsov et al., 2008) | N/A |
| Mouse: Rac1fl/fl | The Jackson Laboratory | Cat# JAX:005550, RRID:IMSR_JAX:005550 |
| Mouse: Rac2−/− | The Jackson Laboratory | Cat# JAX:004197, RRID:IMSR_JAX:004197 |
| Mouse: Tsc1−/− | The Jackson Laboratory | Cat# JAX:005680, RRID:IMSR_JAX:005680 |
| Mouse: C57BL/6-Tg(Nr4a1-EGFP/cre)820Khog/J (also known as Nur77-GFP) | The Jackson Laboratory | Cat# JAX:016617, RRID:IMSR_JAX:016617 |
| Mouse: C57BL/6-Foxp3tm1Flv/J (also known as Foxp3-RFP) | The Jackson Laboratory | Cat# JAX: 008374 RRID:IMSR JAX: 008374 |
| Oligonucleotides | ||
| Fntb-F: 5’-AACCGCTGTATAGTCTGAGACC-3’ | This paper | N/A |
| Fntb-R: 5’-TCTCCCTCTGCAAAATGAGCC-3’ | This paper | N/A |
| Hmgcr-F: 5’-AGCTTGCCCGAATTGTATGTG-3’ | (Zeng et al., 2013) | N/A |
| Hmgcr-R: 5’-TCTGTTGTGAACCATGTGACTTC-3’ | (Zeng et al., 2013) | N/A |
| Hmgcs1-F: 5’-AACTGGTGCAGAAATCTCTAGC-3’ | (Zeng et al., 2013) | N/A |
| Hmgcs1-R: 5’-GGTTGAATAGCTCAGAACTAGCC-3’ | (Zeng et al., 2013) | N/A |
| Fnta-F: 5’- CCCTATGGACGACGGGTTTC-3’ | This paper | N/A |
| Fnta-R:5’- TGATCTGGACCACTGGGTTAG-3’ | This paper | N/A |
| Actb-F: 5’-GACAGGATGCAGAAGGAGATTACTG-3’ | This paper | N/A |
| Actb-R: 5’-GCTGATCCACATCTGCTGGAA-3’ | This paper | N/A |
| Recombinant DNA | ||
| pCAG4-Eco | Addgene | Addgene plasmid # 12260 |
| pMX-GFP-Rac-G12V | (Shi et al., 2018) | Addgene Cat# 14567 |
| ICOS cDNA ORF Clone | Sino Biological | MG50466-M |
| Software and Algorithms | ||
| FlowJo v9.3 | FlowJo | https://www.flowjo.com/ |
| GraphPad Prism v6.0 | GraphPad | https://www.graphpad.com/scientific-software/prism/ |
| Other | ||
| LSR Fortessa flow cytometer | BD Biosciences | N/A |
| MoFlow cell sorter | Beckman-Coulter | N/A |
| Reflection cell sorter | iCyt | N/A |
| ODYSSEY Fc Analyzer | LI-COR | N/A |
| Gene set enrichment analysis (GSEA) software suite | (Subramanian et al., 2005) | http://www.broadinstitute.org/gsea/msigdb/ |
Highlights.
Protein farnesylation and geranylgeranylation are critical for Treg-cell function
Posttranslational lipid modifications exert temporal effects on eTreg-cell programs
Fntb promotes eTreg-cell maintenance via mTORC1 and ICOS
Pggt1b tunes TCR and Rac signals for eTreg-cell differentiation
Acknowledgements
The authors acknowledge M. Bergo for Fntbfl/fl and Pggt1bfl/fl mice (Khan et al., 2011; Liu et al., 2010), A. Rudensky for Foxp3Cre mice (Rubtsov et al., 2008), D. Wiemer for the DGBP inhibitor, Y. Wang for editing of the manuscript, M. Hendren for animal colony management, St. Jude Immunology flow cytometry core facility for cell sorting, the Hartwell Center for microarray analysis, and Joshua Stokes of St. Jude Biomedical Communications for artwork. This work was supported by NIH grants NIH AI1055887, AI131703, AI140761, AI150241, AI150514, and CA221290 (to H.C.). The content is solely the responsibility of the authors and does not necessarily represent the official views of the National Institutes of Health.
Footnotes
Publisher's Disclaimer: This is a PDF file of an unedited manuscript that has been accepted for publication. As a service to our customers we are providing this early version of the manuscript. The manuscript will undergo copyediting, typesetting, and review of the resulting proof before it is published in its final form. Please note that during the production process errors may be discovered which could affect the content, and all legal disclaimers that apply to the journal pertain.
Declaration of interests
H. Chi is a consultant for Kumquat Biosciences, Inc.
References
- Akula MK, Ibrahim MX, Ivarsson EG, Khan OM, Kumar IT, Erlandsson M, Karlsson C, Xu X, Brisslert M, Brakebusch C, et al. (2019). Protein prenylation restrains innate immunity by inhibiting Rac1 effector interactions. Nat Commun 10, 3975. [DOI] [PMC free article] [PubMed] [Google Scholar]
- Arvey A, van der Veeken J, Samstein RM, Feng Y, Stamatoyannopoulos JA, and Rudensky AY (2014). Inflammation-induced repression of chromatin bound by the transcription factor Foxp3 in regulatory T cells. Nat Immunol 15, 580–587. [DOI] [PMC free article] [PubMed] [Google Scholar]
- Bailey TL, Boden M, Buske FA, Frith M, Grant CE, Clementi L, Ren J, Li WW, and Noble WS (2009). MEME SUITE: tools for motif discovery and searching. Nucleic Acids Res 37, W202–208. [DOI] [PMC free article] [PubMed] [Google Scholar]
- Berndt N, Hamilton AD, and Sebti SM (2011). Targeting protein prenylation for cancer therapy. Nat Rev Cancer 11, 775–791. [DOI] [PMC free article] [PubMed] [Google Scholar]
- Buenrostro JD, Giresi PG, Zaba LC, Chang HY, and Greenleaf WJ (2013). Transposition of native chromatin for fast and sensitive epigenomic profiling of open chromatin, DNA-binding proteins and nucleosome position. Nat Methods 10, 1213–1218. [DOI] [PMC free article] [PubMed] [Google Scholar]
- Chapman NM, Zeng H, Nguyen TM, Wang Y, Vogel P, Dhungana Y, Liu X, Neale G, Locasale JW, and Chi H (2018). mTOR coordinates transcriptional programs and mitochondrial metabolism of activated Treg subsets to protect tissue homeostasis. Nat Commun 9, 2095. [DOI] [PMC free article] [PubMed] [Google Scholar]
- Cretney E, Xin A, Shi W, Minnich M, Masson F, Miasari M, Belz GT, Smyth GK, Busslinger M, Nutt SL, and Kallies A (2011). The transcription factors Blimp-1 and IRF4 jointly control the differentiation and function of effector regulatory T cells. Nat Immunol 12, 304–311. [DOI] [PubMed] [Google Scholar]
- Du X, Zeng H, Liu S, Guy C, Dhungana Y, Neale G, Bergo MO, and Chi H (2020). Mevalonate metabolism-dependent protein geranylgeranylation regulates thymocyte egress. J Exp Med 217, e20190969. [DOI] [PMC free article] [PubMed] [Google Scholar]
- Galgani M, De Rosa V, La Cava A, and Matarese G (2016). Role of Metabolism in the Immunobiology of Regulatory T Cells. J Immunol 197, 2567–2575. [DOI] [PMC free article] [PubMed] [Google Scholar]
- Gusmao EG, Allhoff M, Zenke M, and Costa IG (2016). Analysis of computational footprinting methods for DNase sequencing experiments. Nat Methods 13, 303–309. [DOI] [PubMed] [Google Scholar]
- Huynh A, DuPage M, Priyadharshini B, Sage PT, Quiros J, Borges CM, Townamchai N, Gerriets VA, Rathmell JC, Sharpe AH, et al. (2015). Control of PI(3) kinase in Treg cells maintains homeostasis and lineage stability. Nat Immunol 16, 188–196. [DOI] [PMC free article] [PubMed] [Google Scholar]
- Karmaus PWF, Chen X, Lim SA, Herrada AA, Nguyen TM, Xu B, Dhungana Y, Rankin S, Chen W, Rosencrance C, et al. (2019). Metabolic heterogeneity underlies reciprocal fates of TH17 cell stemness and plasticity. Nature 565, 101–105. [DOI] [PMC free article] [PubMed] [Google Scholar]
- Khan OM, Ibrahim MX, Jonsson IM, Karlsson C, Liu M, Sjogren AK, Olofsson FJ, Brisslert M, Andersson S, Ohlsson C, et al. (2011). Geranylgeranyltransferase type I (GGTase-I) deficiency hyperactivates macrophages and induces erosive arthritis in mice. J Clin Invest 121, 628–639. [DOI] [PMC free article] [PubMed] [Google Scholar]
- Kidani Y, Elsaesser H, Hock MB, Vergnes L, Williams KJ, Argus JP, Marbois BN, Komisopoulou E, Wilson EB, Osborne TF, et al. (2013). Sterol regulatory element-binding proteins are essential for the metabolic programming of effector T cells and adaptive immunity. Nat Immunol 14, 489–499. [DOI] [PMC free article] [PubMed] [Google Scholar]
- Koizumi SI, Sasaki D, Hsieh TH, Taira N, Arakaki N, Yamasaki S, Wang K, Sarkar S, Shirahata H, Miyagi M, and Ishikawa H (2018). JunB regulates homeostasis and suppressive functions of effector regulatory T cells. Nat Commun 9, 5344. [DOI] [PMC free article] [PubMed] [Google Scholar]
- Lacher SM, Bruttger J, Kalt B, Berthelet J, Rajalingam K, Wortge S, and Waisman A (2017). HMG-CoA reductase promotes protein prenylation and therefore is indispensible for T-cell survival. Cell Death Dis 8, e2824. [DOI] [PMC free article] [PubMed] [Google Scholar]
- Levine AG, Arvey A, Jin W, and Rudensky AY (2014). Continuous requirement for the TCR in regulatory T cell function. Nat Immunol 15, 1070–1078. [DOI] [PMC free article] [PubMed] [Google Scholar]
- Li H, and Durbin R (2009). Fast and accurate short read alignment with Burrows-Wheeler transform. Bioinformatics 25, 1754–1760. [DOI] [PMC free article] [PubMed] [Google Scholar]
- Li H, Handsaker B, Wysoker A, Fennell T, Ruan J, Homer N, Marth G, Abecasis G, Durbin R, and Genome Project Data Processing, S. (2009). The Sequence Alignment/Map format and SAMtools. Bioinformatics 25, 2078–2079. [DOI] [PMC free article] [PubMed] [Google Scholar]
- Li MO, and Rudensky AY (2016). T cell receptor signalling in the control of regulatory T cell differentiation and function. Nat Rev Immunol 16, 220–233. [DOI] [PMC free article] [PubMed] [Google Scholar]
- Li Z, Schulz MH, Look T, Begemann M, Zenke M, and Costa IG (2019). Identification of transcription factor binding sites using ATAC-seq. Genome Biol 20, 45. [DOI] [PMC free article] [PubMed] [Google Scholar]
- Liu M, Sjogren AK, Karlsson C, Ibrahim MX, Andersson KM, Olofsson FJ, Wahlstrom AM, Dalin M, Yu H, Chen Z, et al. (2010). Targeting the protein prenyltransferases efficiently reduces tumor development in mice with K-RAS-induced lung cancer. Proc Natl Acad Sci U S A 107, 6471–6476. [DOI] [PMC free article] [PubMed] [Google Scholar]
- Luo CT, Liao W, Dadi S, Toure A, and Li MO (2016). Graded Foxo1 activity in Treg cells differentiates tumour immunity from spontaneous autoimmunity. Nature 529, 532–536. [DOI] [PMC free article] [PubMed] [Google Scholar]
- Mullen PJ, Yu R, Longo J, Archer MC, and Penn LZ (2016). The interplay between cell signalling and the mevalonate pathway in cancer. Nat Rev Cancer 16, 718–731. [DOI] [PubMed] [Google Scholar]
- Newton R, Priyadharshini B, and Turka LA (2016). Immunometabolism of regulatory T cells. Nat Immunol 17, 618–625. [DOI] [PMC free article] [PubMed] [Google Scholar]
- Oh H, Grinberg-Bleyer Y, Liao W, Maloney D, Wang P, Wu Z, Wang J, Bhatt DM, Heise N, Schmid RM, et al. (2017). An NF-kappaB Transcription-Factor-Dependent Lineage-Specific Transcriptional Program Promotes Regulatory T Cell Identity and Function. Immunity 47, 450–465 e455. [DOI] [PMC free article] [PubMed] [Google Scholar]
- Quinlan AR, and Hall IM (2010). BEDTools: a flexible suite of utilities for comparing genomic features. Bioinformatics 26, 841–842. [DOI] [PMC free article] [PubMed] [Google Scholar]
- Robinson JT, Thorvaldsdottir H, Winckler W, Guttman M, Lander ES, Getz G, and Mesirov JP (2011). Integrative genomics viewer. Nat Biotechnol 29, 24–26. [DOI] [PMC free article] [PubMed] [Google Scholar]
- Rubtsov YP, Rasmussen JP, Chi EY, Fontenot J, Castelli L, Ye X, Treuting P, Siewe L, Roers A, Henderson WR Jr., et al. (2008). Regulatory T cell-derived interleukin-10 limits inflammation at environmental interfaces. Immunity 28, 546–558. [DOI] [PubMed] [Google Scholar]
- Savage PA, Klawon DEJ, and Miller CH (2020). Regulatory T Cell Development. Annu Rev Immunol 38, 421–453. [DOI] [PubMed] [Google Scholar]
- Shi H, Liu C, Tan H, Li Y, Nguyen TM, Dhungana Y, Guy C, Vogel P, Neale G, Rankin S, et al. (2018). Hippo Kinases Mst1 and Mst2 Sense and Amplify IL-2R-STAT5 Signaling in Regulatory T Cells to Establish Stable Regulatory Activity. Immunity 49, 899–914 e896. [DOI] [PMC free article] [PubMed] [Google Scholar]
- Shrestha S, Yang K, Guy C, Vogel P, Neale G, and Chi H (2015). Treg cells require the phosphatase PTEN to restrain TH1 and TFH cell responses. Nat Immunol 16, 178–187. [DOI] [PMC free article] [PubMed] [Google Scholar]
- Smigiel KS, Richards E, Srivastava S, Thomas KR, Dudda JC, Klonowski KD, and Campbell DJ (2014). CCR7 provides localized access to IL-2 and defines homeostatically distinct regulatory T cell subsets. J Exp Med 211, 121–136. [DOI] [PMC free article] [PubMed] [Google Scholar]
- Sun IH, Oh MH, Zhao L, Patel CH, Arwood ML, Xu W, Tam AJ, Blosser RL, Wen J, and Powell JD (2018). mTOR Complex 1 Signaling Regulates the Generation and Function of Central and Effector Foxp3(+) Regulatory T Cells. J Immunol 201, 481–492. [DOI] [PMC free article] [PubMed] [Google Scholar]
- Tan H, Yang K, Li Y, Shaw TI, Wang Y, Blanco DB, Wang X, Cho JH, Wang H, Rankin S, et al. (2017). Integrative Proteomics and Phosphoproteomics Profiling Reveals Dynamic Signaling Networks and Bioenergetics Pathways Underlying T Cell Activation. Immunity 46, 488–503. [DOI] [PMC free article] [PubMed] [Google Scholar]
- Vasanthakumar A, Liao Y, Teh P, Pascutti MF, Oja AE, Garnham AL, Gloury R, Tempany JC, Sidwell T, Cuadrado E, et al. (2017). The TNF Receptor Superfamily-NF-kappaB Axis Is Critical to Maintain Effector Regulatory T Cells in Lymphoid and Non-lymphoid Tissues. Cell Rep 20, 2906–2920. [DOI] [PubMed] [Google Scholar]
- Vasanthakumar A, Moro K, Xin A, Liao Y, Gloury R, Kawamoto S, Fagarasan S, Mielke LA, Afshar-Sterle S, Masters SL, et al. (2015). The transcriptional regulators IRF4, BATF and IL-33 orchestrate development and maintenance of adipose tissue-resident regulatory T cells. Nat Immunol 16, 276–285. [DOI] [PubMed] [Google Scholar]
- Wakamatsu E, Mathis D, and Benoist C (2013). Convergent and divergent effects of costimulatory molecules in conventional and regulatory CD4+ T cells. Proc Natl Acad Sci U S A 110, 1023–1028. [DOI] [PMC free article] [PubMed] [Google Scholar]
- Wang M, and Casey PJ (2016). Protein prenylation: unique fats make their mark on biology. Nat Rev Mol Cell Biol 17, 110–122. [DOI] [PubMed] [Google Scholar]
- Wei J, Long L, Yang K, Guy C, Shrestha S, Chen Z, Wu C, Vogel P, Neale G, Green DR, and Chi H (2016). Autophagy enforces functional integrity of regulatory T cells by coupling environmental cues and metabolic homeostasis. Nat Immunol 17, 277–285. [DOI] [PMC free article] [PubMed] [Google Scholar]
- Wei J, Long L, Zheng W, Dhungana Y, Lim SA, Guy C, Wang Y, Wang YD, Qian C, Xu B, et al. (2019). Targeting REGNASE-1 programs long-lived effector T cells for cancer therapy. Nature 576, 471–476. [DOI] [PMC free article] [PubMed] [Google Scholar]
- Weinberg SE, Singer BD, Steinert EM, Martinez CA, Mehta MM, Martinez-Reyes I, Gao P, Helmin KA, Abdala-Valencia H, Sena LA, et al. (2019). Mitochondrial complex III is essential for suppressive function of regulatory T cells. Nature 565, 495–499. [DOI] [PMC free article] [PubMed] [Google Scholar]
- Whibley N, Tucci A, and Powrie F (2019). Regulatory T cell adaptation in the intestine and skin. Nat Immunol 20, 386–396. [DOI] [PubMed] [Google Scholar]
- Yang K, Neale G, Green DR, He W, and Chi H (2011). The tumor suppressor Tsc1 enforces quiescence of naive T cells to promote immune homeostasis and function. Nat Immunol 12, 888–897. [DOI] [PMC free article] [PubMed] [Google Scholar]
- Yang K, Shrestha S, Zeng H, Karmaus PW, Neale G, Vogel P, Guertin DA, Lamb RF, and Chi H (2013). T cell exit from quiescence and differentiation into Th2 cells depend on Raptor-mTORC1-mediated metabolic reprogramming. Immunity 39, 1043–1056. [DOI] [PMC free article] [PubMed] [Google Scholar]
- Zeng H, Yang K, Cloer C, Neale G, Vogel P, and Chi H (2013). mTORC1 couples immune signals and metabolic programming to establish T(reg)-cell function. Nature 499, 485–490. [DOI] [PMC free article] [PubMed] [Google Scholar]
- Zhang B, and Horvath S (2005). A general framework for weighted gene co-expression network analysis. Stat Appl Genet Mol Biol 4, Article17. [DOI] [PubMed] [Google Scholar]
- Zhang Y, Liu T, Meyer CA, Eeckhoute J, Johnson DS, Bernstein BE, Nusbaum C, Myers RM, Brown M, Li W, and Liu XS (2008). Model-based analysis of ChIP-Seq (MACS). Genome Biol 9, R137. [DOI] [PMC free article] [PubMed] [Google Scholar]
- Zheng Y, Chaudhry A, Kas A, deRoos P, Kim JM, Chu TT, Corcoran L, Treuting P, Klein U, and Rudensky AY (2009). Regulatory T-cell suppressor program co-opts transcription factor IRF4 to control T(H)2 responses. Nature 458, 351–356. [DOI] [PMC free article] [PubMed] [Google Scholar]
Associated Data
This section collects any data citations, data availability statements, or supplementary materials included in this article.
Supplementary Materials
Data Availability Statement
The accession number for the microarray data of CD4+YFP+ WT and Fntb- or Pggt1b-deficient Treg cells from mixed bone marrow chimeras reported in this paper is GSE158863. The accession number for the microarray data of CD4+YFP+ cTreg cells treated with FTI or GGTI and stimulated with anti-CD3/28 plus IL-2 for different times in this paper is GSE158863. The accession number for the ATAC-Seq data of CD4+YFP+ WT and Fntb- or Pggt1b-deficient cTreg and eTreg cells from mixed bone marrow chimeras reported in this paper is GSE158863.