

Abstract
Importance:
The U.S. criminal justice system has witnessed dramatic increases in its mentally ill population during the past 50 years. Decreasing numbers of psychiatric beds is one proposed cause and more psychiatric beds may be one solution.
Objective:
This study examines the relationships between large changes in the local psychiatric bed capacity, local jail inmate populations and the psychiatric burden at local general hospitals.
Methods:
The study uses a kernel method to identify abrupt changes in psychiatric bed capacity from American Hospital Association Survey and the Medicare Provider of Services data. Data were aggregated to the hospital referral region (HRR)-year level and matched to the National Inpatient Sample of hospital discharges 1988–2015 and the Annual Survey of Jails 1985–2014. Subsequent analysis by event study examines the effect of abrupt bed changes on jail inmate numbers.
Results:
Decreases in local psychiatric bed capacity were associated with an average increase of 256.2 jail inmates 95% CI [3.3, 509.1]. Increases in psychiatric bed capacity were associated with a decrease of 199.3 [−457.4, 58.8] inmates. There was limited evidence for spillovers to general hospitals immediately following decreases in psychiatric beds.
Conclusions:
Decreases in local psychiatric bed capacity appear to be associated with subsequent increases in local jail populations. There was no clear evidence that treatment shifts from psychiatric units to local general hospitals. These findings support concerns that a consequence of reducing psychiatric inpatient bed capacity is an increase in the jail population due to more psychiatrically ill inmates, aggravating the challenge of psychiatric treatment delivery within the U.S. criminal justice system.
Introduction
Between 1955 and 2000, the number of state hospital psychiatric beds declined from 339 to 22 per 100,000 population. The fraction of mentally ill inmates in the criminal justice system rose from 16% of inmates in 1976 to 44% of jail inmates in 2011–2012.1,2 Numerous journalistic accounts have advanced the idea that deinstitutionalization and reduction in the number of psychiatric inpatient beds has contributed to the current mental health crisis in the U.S. criminal justice system.3–6 Expansion of psychiatric inpatient services has been proposed as a solution.7–9 Despite decades of research into the relationship between of psychiatric bed numbers and inmate populations, the literature about this relationship has remained conflicted, and with palpable costs in personal suffering and powerful consequences for public expenditure priorities.10–14 There are now approximately 1 million people currently in jail or prison with personal histories of mental illness or substance use disorders, and concern about public psychiatric services has only increased with the recent opioid crisis.15,16
The relationship between psychiatric beds and jail inmate numbers has been explored primarily using historical data from the 1950s to present.10–12 A common assumption across studies has been that other factors have remained fairly constant over time periods when the number of psychiatric beds has changed. This assumption is not reasonable. For example, decreasing public support for welfare and public mental health services may temporally coincide with increasing enthusiasm for more punitive criminal justice policies.17 Thus, while a historical correlation between rising inmate numbers and falling psychiatric bed numbers exists, this correlation does not necessarily imply that a potential policy that exogenously increases the number of psychiatric beds would decrease inmate numbers.
This study addresses some of the analytical difficulties faced by previous historical studies. In order to better understand a potential causal relationship between psychiatric bed supply and inmate numbers, this study examines a significantly shorter time spans, looks at jails, rather than prison inmate numbers. Local jails currently house 5% of the total incarcerated population, however, on within a short time window, they can be more informative than aggregate prison populations because jail turnover rates are higher.18 It asks whether the number of jail inmates increases following a sudden reduction in the number of local psychiatric beds, and, conversely, whether the number of jail inmates decreases following a sudden increase to the number of local psychiatric beds. Instead of relying on psychiatric bed numbers at a state or national level, this study exploits large, idiosyncratic jumps in the number of psychiatric beds observed at a local level. This local-level analysis, provides several advantages. First, there are more local regions than states and of smaller geographic region, thus enabling a closer tie to be drawn between where beds are lost and where new inmates appear. Second, in contrast to previous studies reliant on before versus after comparisons, this study uses localities that do not experience an abrupt change in beds in a given year as a control group to insulate the findings from global time trends. Third, in contrast to studies of deinstitutionalization, which encompass decades-long trends, this study identifies discrete annual jumps, thus permitting a closer examination within a known time window surrounding an event. Pre- and post- trend analyses further guard against erroneous inference of reverse causation or local level trends that may coincide with both psychiatric bed supply and inmate population changes.
Method
Data
Psychiatric bed data at the provider level were available for providers of services to the Centers for Medicare and Medicaid Services within the Provider of Services (POS) dataset 1991–2015. Of note, POS is limited to Medicare providers and thus may exclude state psychiatric hospitals and for-profit providers. Additional provider-level data from the American Hospital Association (AHA) Annual Survey from 1980–2014 was used to supplement data on the number of psychiatric beds, and the availability of psychiatric services. All provider-level data was aggregated to the hospital referral region (HRR)-level. HRRs represent regional healthcare markets for tertiary care, defined and maintained by the Dartmouth Atlas.
Because psychiatric bed numbers were reconstructed by the sources above, admissions data provided an addition check on bed data validity. The National Inpatient Sample from the Healthcare Cost and Utilization Project (NIS) managed by the Department of Health and Human Services. It is a database of hospital discharge data available for years 1988–2015. The data represent a national sample of inpatients reported at an admission or visit level. These were then aggregated to the HRR-level and matched to hospitals by ZIP code and county.
Finally, jail data were used, from the Annual Survey of Jails or Census of Jail Inmates for the years 1986–2014. These jail data intermittently reflected the individual, jail or jurisdiction level based on data collection year. All levels of data were aggregated to the HRR-level for analysis.
Outcome Variables
The primary outcome of interest was the number of jail inmates by HRR-level by year. Additional outcomes include the number of jail inmates standardized to the number of observations recorded by that year, and the standardized number of psychiatric admissions seen by general hospitals within the HRR that have no recorded psychiatric beds (psychiatric admissions at general medical hospitals). These additional outcomes are provided to facilitate the interpretation of outcome magnitudes as well as testing an additional hypothesis into a potential spillover location for affected psychiatric patients.
Statistical Analysis
Idiosyncratic jumps in the number of psychiatric beds were identified. For each HRR time series present in the POS data, kernel smoothing was performed. This method performs a weighted moving average of the series. An Epanechinikov kernel (weights) was selected to minimize mean square error.19 The shortest possible bandwidth of 2 was selected because longer bandwidths had the tendency to misattribute jumps to subsequent years to the year in which they occurred. Because the timing of the jumps was so central to this analysis, this shortest bandwidth was accepted with acknowledgement that inclusion of these points would tend to bias second stage estimates toward zero.
The difference of kernel estimates from both above and below was taken, and a T-statistic computed. A significant discontinuity was tagged if the associated p-value was less than 0.01. Because POS data begins in 1991, generating a large number of spurious discontinuities in this year, discontinuities identified in the year 1991 were untagged and ignored for subsequent analyses. Additional explanation of methods for identifying discontinuities may be found in the supplement.
To check that tagged discontinuities represented true and significant changes to local bed supply, verification of that bed supply changes meaningfully correlated with admissions changes was performed using hospital discharge data. International Classification of Diseases version 9 (ICD-9) psychosis (including mood disorders) and non-psychotic mental illness were included, as well as, ICD-9 procedure codes for primary psychiatric evaluation. These multiple outcomes were aggregated into a standardized index for psychiatric admissions for that HRR.20 Due to sampling in NIS, a reference general medical volume was constructed to control for hospital survey volume. This reference considered ICD-9 cardiac diagnoses, chronic obstructive pulmonary disease, and pneumonia (see supplement).
Regression models were linear fixed-effect models, chosen over mixed effects to limit the study only to within-HRR sources of variation. An event study was conducted to examine the timing of bed changes relative to jail outcomes.21 Jail outcomes were regressed on a series of lagged dependent variables ranging from five years prior to the abrupt change in the number of psychiatric beds to five years after the change controlling for log HRR population, year and HRR-level fixed effects. Hospital discharge outcomes were regressed against lagged dependent variables ranging from five years prior to the abrupt change in the number of psychiatric beds to five years after the change, controlling for log HRR population, year, HRR-level fixed effects and survey index volume for the control diagnoses. All standard errors were clustered at the level of the HRR. All analyses were performed using STATA 15.1.
Results
Data from 173 HRRs were matched to corresponding jail data resulting in a total of 2,772 observations over the period 1985–2014. Across all HRRs, the mean number of jail inmates was 1964. For admissions data, a total of 301 HRRs were observed over the period 1988–2015, accounting for 3,597 observations across all HRRs. Psychosis and other mental illness admission volumes across all observed hospitals averaged 2,621 and 3,595 admissions per HRR-year observed, and were comparable in volume to control diagnosis volume, with psychiatric evaluations less commonly tagged and accounting for only on average 1,766 observations by HRR annually. The average HRR-year reported 249 psychiatric beds, or 25 beds per 100,000 population. Table 1 summarizes variable means and standard deviation (SD) for variables used in the analysis to facilitate the interpretation of standardized value effect sizes.
Table 1.
A description of variable means and standard deviations illustrating sampling variation, provided for the interpretation of standardized effect sizes.
| Variable | Mean | St Dev | N |
|---|---|---|---|
| Year | 2000.5 | 8.63 | 9,188 |
| Psychiatric Inpatient Beds | 241.96 | 340.7 | 7,308 |
| Jail Inmate Population | 1995. | 2842. | 2,772 |
| All Inpatient Beds | 1986. | 2779. | 7,308 |
| Outpatient Psychiatry | 83.96 | 213.2 | 8,889 |
| Population | 988662 | 1412301 | 8,550 |
| Total Admissions | 51121 | 241425 | 3,607 |
| Psychosis Admissions | 2621 | 10549 | 3,597 |
| Other Mental Disorders Admissions | 3595 | 15572 | 3,597 |
| Psychiatric Evaluation Admissions | 616 | 1766 | 3,597 |
| Heart Disease Admissions | 4925 | 18569 | 3,599 |
| Pneumonia Admissions | 2381 | 10878 | 3,599 |
| COPD Admissions | 4433 | 19472 | 3,599 |
| Psychiatric Diagnosis Index | 0.00 | 0.93 | 3,597 |
| Control Diagnosis Index | 0.00 | 0.99 | 3,599 |
| Discontinuities (Bed Additions) | 0.028 | 0.162 | 7,308 |
| Discontinuities (Bed Reductions) | 0.027 | 0.166 | 7,308 |
Numbers aggregated to the HRR-year level. In total 301 HRRs were observed over the period 1988–2015. Psychiatric Diagnosis Index and Control Diagnosis Index reflect standardization of inpatient admission volume to mean of zero and standard deviation of one.
In total, 206 abrupt increases in psychiatric bed capacity were marked and 196 abrupt decreases in psychiatric bed capacity were marked across the observed sample of 301 HRRs in the period 1985–2015. Overall, Figure 1 demonstrates that the technique employed consistently identifies jumps upwards or downwards in psychiatric bed supply that appear both idiosyncratic and lasting, as required for causal inference. Figure 1A presents a histogram describing the number of marked discontinuities found by year, demonstrating that changes to the psychiatric bed supply are distributed over the entire study period. Figure 1B demonstrates first stage results indicating that, on average, a tagged psychiatric bed decrease was associated with the abrupt, and persistent, loss of approximately 90 beds and a tagged psychiatric bed increase was associated with a gain of approximately 80 beds. Supplemental figure S2 shows no simultaneous jumps in medical inpatient bed supply, population, and psychiatric outpatient services.
Figure 1.
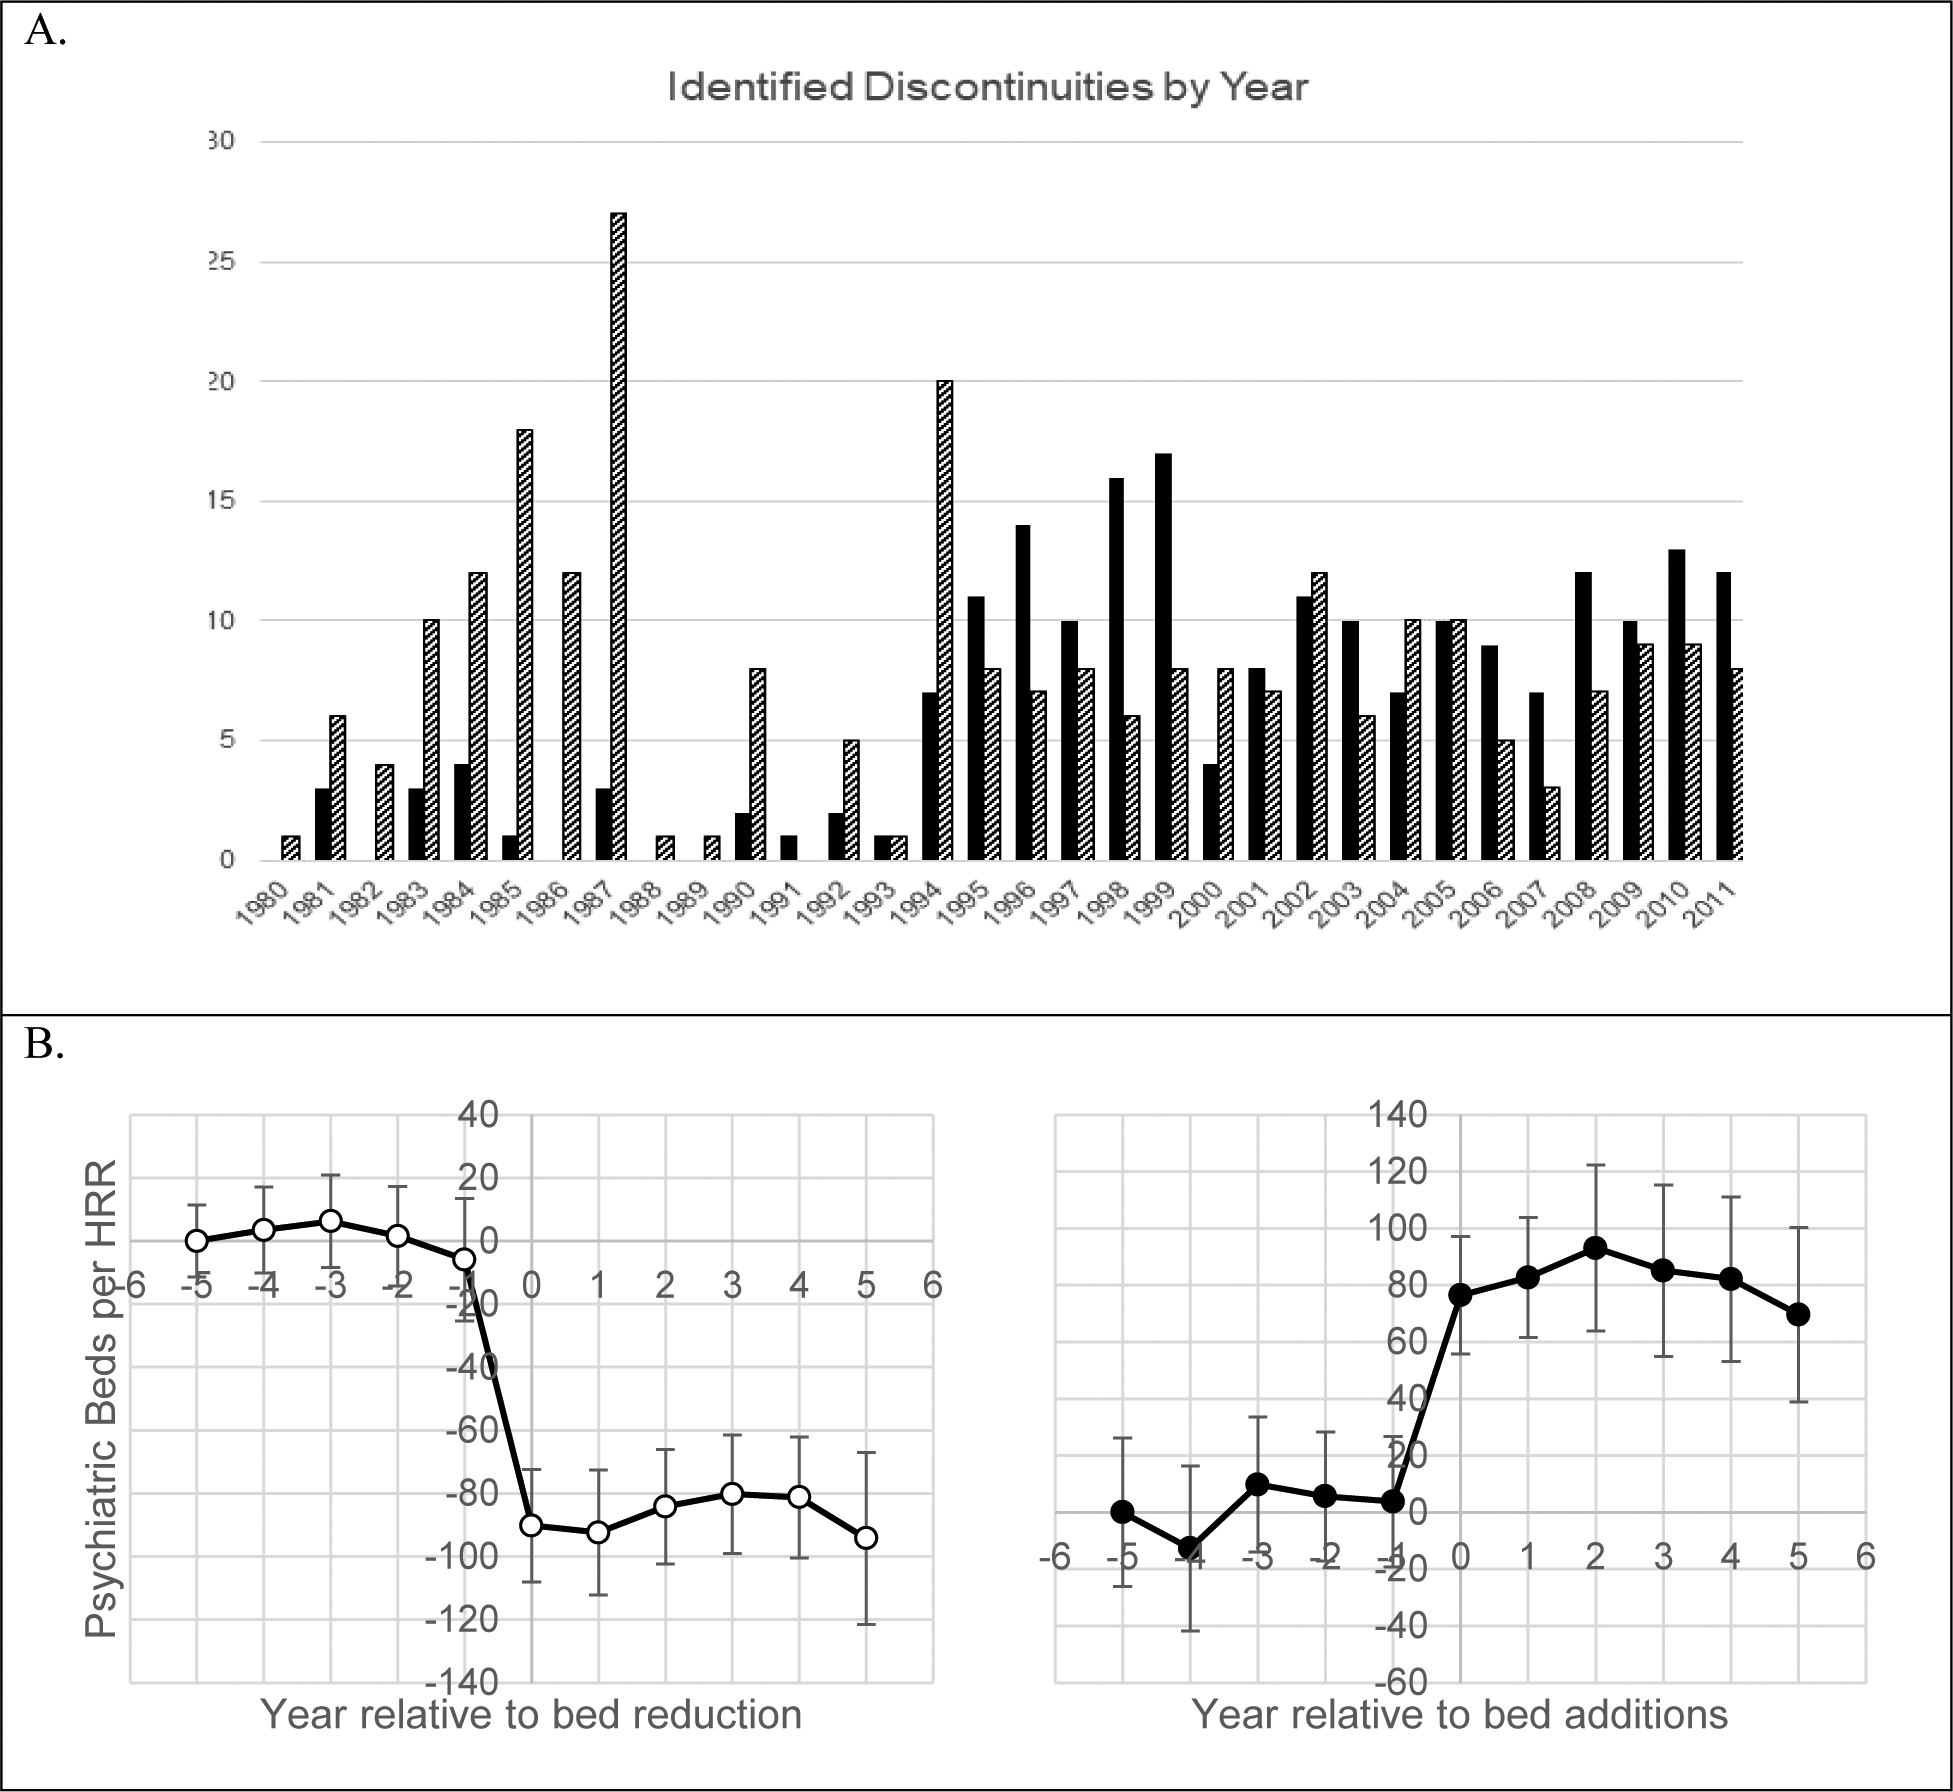
HRR-level bed discontinuity identification and summary of average discontinuity size.
Above (A.) Histogram of Identified Discontinuities Found in Medicare Provider of Services Data 1991–2014 and the American Hospital Association Survey 1980–2014. Dark bars indicate the number of HRRs with tagged psychiatric bed reductions. Striped bars indicate the number of HRRs with tagged psychiatric bed additions.
Below (B.) Number of psychiatric beds by HRR versus years from identified discontinuities. Left: Discontinuous bed reductions. Right: Discontinuous bed additions. The zero point in both graphs is the year of the identified discontinuity. The plotted line is the average number of psychiatric beds within each HRR. The x-axis points −5, −4, −3, −2, −1, 0, 1, 2, 3, 4 correspond to the average number of beds observed in years 5, 4, 3, 2, 1 years before the change, in the year of the change and 1, 2, 3, 4 years afterwards. The x-axis point 5 is the aggregated effect observed across all years subsequent to 4 years after the change. Standard errors given by error bars. Change at time zero significant at the 95% confidence level.
Figure 2 elaborates on the short-run effects of changing psychiatric bed supply. These event study results should be interpreted primarily for impacts on timing as the presence of lagged dependent variables biases estimates downwards.
Figure 2.
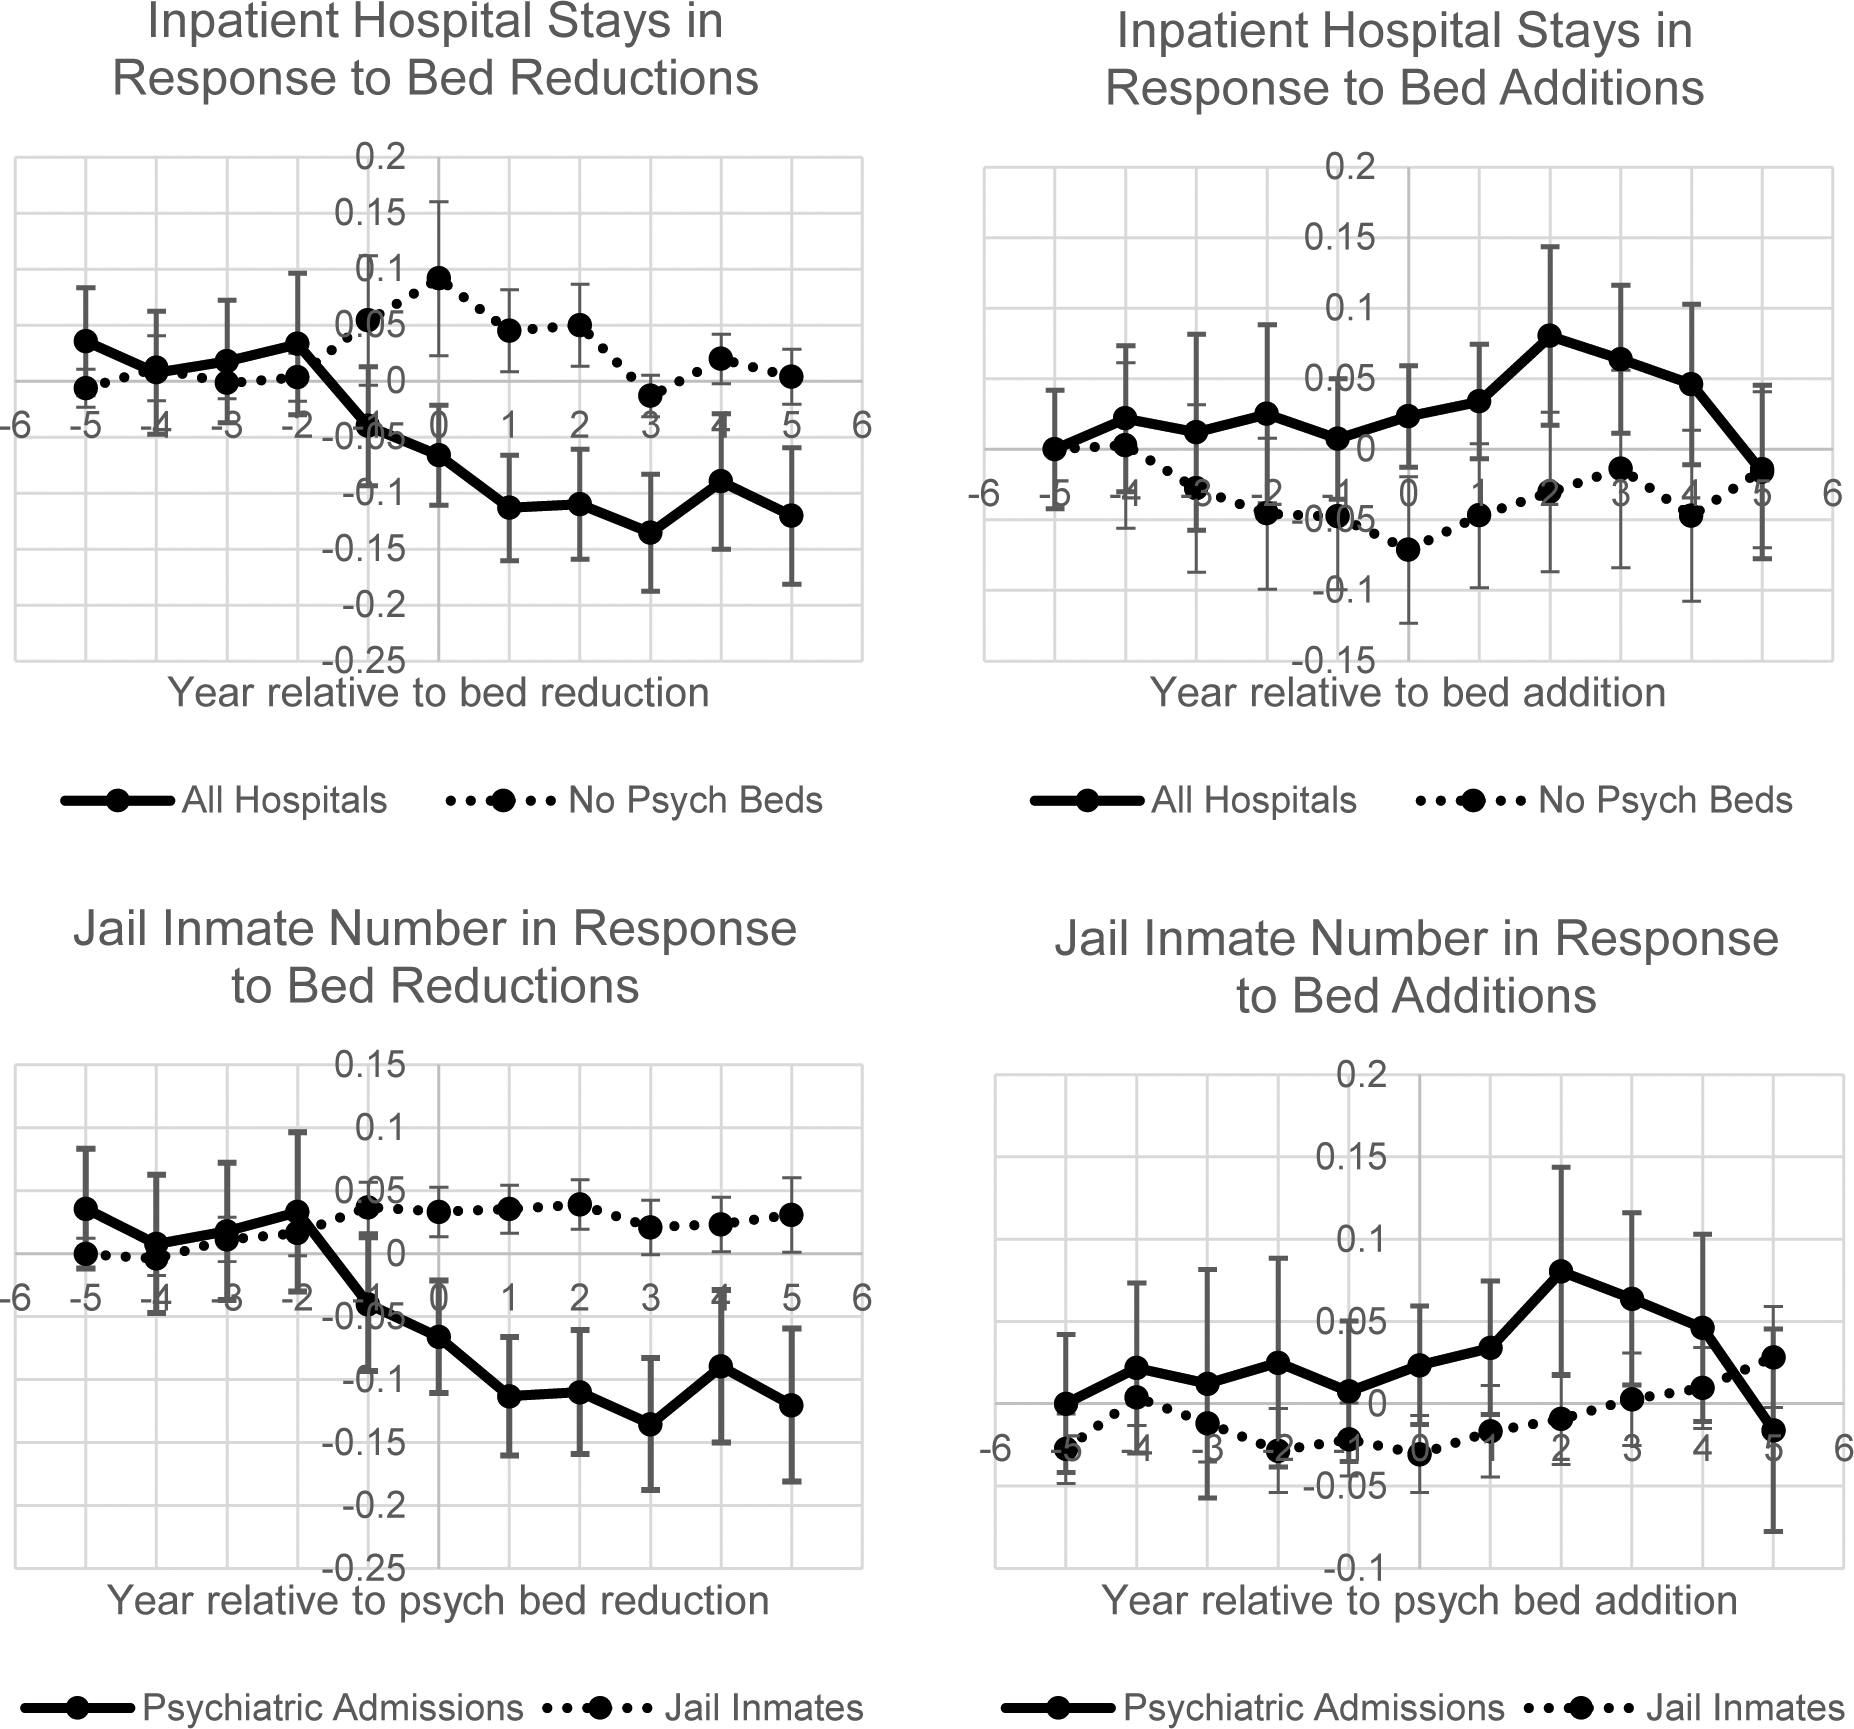
Changes in psychiatric inpatient admissions to general hospitals and jail inmate population observed around the timing of abrupt changes to the local psychiatric bed supply.
The plotted lines represent average admissions volumes for psychiatric diagnoses within an HRR relative to the year of identified discontinuity (x-axis zero). Left: bed reductions. Right: bed additions. In both panels the solid line represents the standardized index for psychiatric admissions within the HRR. In both panels above, the dotted line represents the standardized number of psychiatric admissions to hospitals with no reported psychiatric beds. In the panels below, the dotted line represents the standardized number of jail inmates. The x-axis points −5, −4, −3, −2, −1, 0, 1, 2, 3, 4 correspond to the average number of beds observed in years 5, 4, 3, 2, 1 years before the change, in the year of the change and 1, 2, 3, 4 years afterwards. The x-axis point 5 is the aggregated effect observed across all years subsequent to 4 years after the change. Standard errors given by error bars. All 95% confidence intervals contain zero.
The solid line illustrates that total psychiatric admission volumes move in concert with bed changes. The solid line on left shows that beginning one year prior to the year of the reported reduction in bed numbers, the relative admissions volume for psychiatric inpatient disorder declines markedly, resulting in a −0.12 95% CI [−0.22, −0.03] SD reduction in psychiatric admissions at year one. The solid line on the right panel demonstrates an increase of +0.05 [−0.04, 0.13] SD in the number of psychiatric admissions measured at year one following a tagged bed addition.
The dotted line in the upper half of Figure 2 shows a short-run peak in general hospital spillovers in response to decreasing psychiatric beds. The number of psychiatric admissions at general hospitals without psychiatric beds peaks at year 0, representing a +0.09 [−0.04, 0.23] SD increase in admission volume before returning to baseline. A reciprocal decline in general hospital psychiatric admissions is not seen for increases in psychiatric bed supply.
In the lower half of Figure 2, dotted line shows a standardized index for jail inmate numbers that coincidentally increases with decreasing admissions volume. In the years following the observed bed reduction, the number of jail inmates increase by +0.04 [0.00, 0.08] SD at two years. When psychiatric hospital bed numbers increase, the trend is much noisier, with no reciprocal decreases in jail inmate numbers.
Table 2 summarizes the long-run effect of changes to the bed supply. Notably, reductions to the psychiatric bed supply appear significantly correlated with increases in jail inmates of 256.2 [3.3, 509.1]. Conversely, large increases in psychiatric bed supply were associated with a decrease of −199.3 [−457.4, 58.8] inmates, which was not statistically significant. There are no long-run effects observed of changes to the psychiatric bed supply on psychiatric admissions at general medical hospitals.
Table 2.
Aggregated effects of identified discontinuities in psychiatric bed numbers for psychiatric admissions to general hospitals and jail inmate populations in U.S. localities.
| HRR Psych Bed | Psych Admits (Standard Dev) | Psych Admits at Non-Psych Hospitals (Std Dev) | |||||||
|---|---|---|---|---|---|---|---|---|---|
| N = 3,030 | N = 3,249 | N = 3,249 | |||||||
| Bed Reduction | −90.2 | [−121.9, −58.5] | ** | −0.079 | [−0.138, −0.020] | ** | 0.160 | [−0.020, 0.340] | |
| Control Index | −42.7 | [−113.7, 28.3] | 0.953 | [0.751, 1.155] | ** | 0.892 | [−0.342, 2.126] | ||
| Log(HRR Population) | −143.4 | [−253.7, −33.2] | ** | 0.422 | [0.034, 0.809] | ** | −0.069 | [−0.752, 0.613] | |
| Bed Addition | 46.5 | [11.4, 81.7] | ** | −0.034 | [−0.116, 0.047] | 0.336 | [−0.133, 0.804] | ||
| Control Index | −44.4 | [−124.0, 35.2] | 0.954 | [0.755, 1.154] | ** | 0.880 | [−0.318, 2.079] | ||
| Log(HRR Population) | −142.4 | [−250.5, −34.4] | ** | 0.425 | [0.034, 0.815] | −0.042 | [−0.738, 0.653] | ||
| Inmate (Standard Dev) | Inmate Number | ||||||||
| N = 2,955 | N = 2,955 | ||||||||
| Bed Reduction | 0.054 | [−0.008, 0.117] | * | 256.2 | [3.3, 509.1] | ** | |||
| Control Index | 0.099 | [−0.029, 0.227] | 40.6 | [−297.0, 378.2] | |||||
| Log(HRR Population) | 0.282 | [−0.032, 0.596] | * | 2495.7 | [942.8, 4048.6] | ** | |||
| Bed Addition | −0.024 | [−0.097, 0.048] | −199.3 | [−457.4, 58.8] | |||||
| Control Index | 0.099 | [−0.026, 0.225] | 45.5 | [−293.9, 385.0] | |||||
| Log(HRR Population) | 0.276 | [−0.038, 0.590] | * | 2457 | [917.4, 3996.7] | ** | |||
The table above shows the results of ten regressions summarizing the difference-in-difference effects for 178 HRRs experiencing psychiatric bed additions or reductions from 1988–2011. The outcomes of the regressions are given by the headers with quadrant numbers (1) representing the number of psychiatric beds, (2) the effect psychiatric admissions observed from hospital discharge data given in standard deviations, (3) the effect for inmate number given in standard deviations and (4) the raw effect on inmate number. Mean coefficient effects are given along with 95% confidence intervals given in square brackets.
indicates Wald statistic significant at level p<0.05,
indicates Wald statistic significant at level p<0.1. All regressions include year and HRR-fixed effects. All standard errors clustered at the HRR level.
To obtain a back-of-the-envelope estimate of costs based on these findings consider the study findings report that, on average, a psychiatric bed reduction of size 90 beds results in an additional 256.2 jail inmates per year, or 2.84 per bed per year. The average daily cost of incarceration was $99 per day or $36,300 per year in 2017, and the average jail length of stay was 40 days.22,23 Of inmates in jail, 30% are convicted, and the average prison sentence is 25 months.24,25 Cumulatively, the spillover cost examined here is $75,700.
By contrast, the cost of care in at psychiatric hospitals are considerably more expensive than prison stays, $864 per day.26 Imagining that said psychiatric bed is occupied for every day of the year, then psychiatric care costs are $315,000, or a ratio of expenditures of 4.16 relative to spillover size.
Discussion
The study finds both abrupt increases and decreases in local psychiatric bed supply were significantly associated with reciprocal long-run changes in the number of jail inmates. In the case of a local decrease in psychiatric beds, the number of jail inmates increases rapidly and that increase is maintained. In the case of a local decrease in psychiatric beds, no reciprocal short-run changes were noted in the number of jail inmates, suggesting that the observed long-run changes could be driven by more gradual trends.
Overall, there was minimal evidence that general hospital inpatient psychiatric admissions respond to changes in local psychiatric bed supply. Although abrupt decreases in local psychiatric bed supply were associated with immediate increases in psychiatric admissions to general hospitals, there was no significant evidence of either a long-run effect or a substantial short-run effect resulting from increases in psychiatric beds. These findings suggest that the psychiatric spillovers impact the criminal justice system more than general hospitals.
Increases in rates of psychiatric emergency room boarding have been reported in recent years, raising concerns that the rising psychiatric burden on general hospitals has led to inappropriate or costlier care in the setting of general hospitals over psychiatric facilities.26–28 Though increasing psychiatric bed supply has been proposed to alleviate general hospital psychiatric burden, these findings and previous literature challenge this proposal: two studies—the first, studying a single large psychiatric hospital closure, and the second, studying increases in beds during the Medicaid Emergency Psychiatric Demonstration—both found no effect of psychiatric bed supply on psychiatric caseloads at local general hospitals.29,30 The long-run findings presented here are consistent with these previous studies: general hospitals inpatient loads do not appear to change as a result of changes in the number of psychiatric beds. The short-run increases found for general hospitals following decreases to psychiatric bed numbers may suggest why the relationship between psychiatric beds numbers and general hospital admissions appears weak. As patients gain experience with emergency room boarding or other delays in care, they may become reluctant to seek hospital care. Providers might also adapt by requiring a higher severity of mental illness for admission and discharge a larger number of patients from the emergency room. If true, these behavioral adaptations suggest that general hospitals exert selection over their inpatient psychiatric caseload such that the incidence of spillovers is likely to accrue elsewhere, such as the jails.
Within the long and mixed literature on deinstitutionalization and the criminal justice system, it is useful to consider two separate waves: 1950–1980 and 1980 to present.10–12,14,31 A study by Raphael and Stoll comparing the demographics of psychiatric ward residents and prison inmates illustrates that few spillovers from psychiatric wards into prisons likely occurred from 1950–1980.11 By comparison, from 1980 onwards, psychiatric ward and prison population demographics began to overlap; this is also when the number of mentally ill inmates begins to rise dramatically.1,2,11 This study, which uses jail data from 1986–2014, demonstrates increases in jail inmate numbers following decreases in local psychiatric bed numbers. While jails are not prisons, given the flow of inmates from jails to prisons, these findings are broadly consistent with other study findings, and further suggest that the marginal effect of additional psychiatric beds to prevent jail or prison spillovers may vary inversely with existing bed capacity. Additionally, the findings specifically suggest that adding psychiatric beds is associated with a long-run decrease in the local number of jail inmates. The effect of adding psychiatric beds on jail populations has rarely been examined in previous studies due to the limitations of state- or national- level analyses where examples of increases in aggregate psychiatric beds supply were rare. Thus, this study provides new suggestive evidence, not only that decreases in inpatient psychiatric capacity contribute to increases in jail inmate numbers, but that increases in psychiatric bed numbers may have the potential to decrease the mental health burden on jails, particularly in areas with low psychiatric capacity.
Limitations
This study has several limitations. First, there is no census for psychiatric beds over the period of the study. As a result, the supply changes observed here are large in size and likely represent the concurrent opening or closing of multiple psychiatric units. Second, due to oversampling of medical facilities rather than psychiatric facilities in the hospital discharge data, it is difficult to obtain an accurate count of psychiatric admission volume at specialized psychiatric facilities. Thus, any shift in volume toward non-hospital psychiatric facilities is not well captured. Similarly, because the data used here reflect general hospital inpatient admissions only, spillovers to general hospitals in the form of emergency department visits are also not well captured. Third, the particular local conditions that caused hospitals to open and close their psychiatric units is unknown. A figure is provided in the supplement which demonstrates continuity in the number of medical beds, HRR population, and the availability of outpatient psychiatric care across the threshold of observed changes in the psychiatric bed supply, however, it is still possible that factors causing some abrupt changes in demand for inpatient psychiatric care could have driven these changes and might also affect our outcomes of interest. Fourth, this study examines only two possible sites for psychiatric spillovers: general hospitals and jails. Homelessness, excess mortality, and other possible repercussions from lack of access to psychiatric care were not easily quantifiable in this data and may be topics for future research.32
Conclusions
The findings of this study highlight psychiatric care as an element of public health policy, and one with potentially wide-ranging implications for criminal justice and social justice. For many reasons, it is better for psychiatric treatment to be provided in a psychiatric hospital rather than a jail, however, there is a financial cost. The treatment effect from this study implies that $4.16 must be spent in inpatient psychiatric care for every $1 of prevented criminal justice expenditures. Because inpatient care is costly, a large amount of current psychiatric service research appropriately focuses on less costly community care, housing, and other social service systems. However, these findings suggest that acute inpatient psychiatric care continues to be a factor in preventing avoidable spillovers into the criminal justice system and underscore the need for adequate psychiatric treatment capacity.
Supplementary Material
Bibliography
- 1.Lamb HR, Weinberger LE. Persons with severe mental illness in jails and prisons: a review. Psychiatr Serv Wash DC. 1998;49(4):483–492. doi: 10.1176/ps.49.4.483 [DOI] [PubMed] [Google Scholar]
- 2.Bureau of Justice Statistics. Indicators of Mental Health Problems Reported by Prisoners and Jail Inmates, 2011–12. U.S. Department of Justice; 2017:1–17. Accessed August 30, 2017 https://www.bjs.gov/content/pub/pdf/imhprpji1112.pdf [Google Scholar]
- 3.Ford M America’s Largest Mental Hospital Is a Jail. The Atlantic. Published online June 8, 2015. Accessed August 30, 2017 https://www.theatlantic.com/politics/archive/2015/06/americas-largest-mental-hospital-is-a-jail/395012/
- 4.Gold J A Dearth Of Psychiatric Hospital Beds For California Patients In Crisis. NPR.org. Published April 14, 2016. Accessed August 30, 2017 http://www.npr.org/sections/health-shots/2016/04/14/474210027/a-dearth-of-psychiatric-hospital-beds-for-california-patients-in-crisis
- 5.Raphelson S How The Loss Of U.S. Psychiatric Hospitals Led To A Mental Health Crisis. NPR.org. Published November 30, 2017. Accessed February 28, 2019 https://www.npr.org/2017/11/30/567477160/how-the-loss-of-u-s-psychiatric-hospitals-led-to-a-mental-health-crisis
- 6.Powers R No One Cares about Crazy People: The Chaos and Heartbreak of Mental Health in America. First edition Hachette Books; 2017. [Google Scholar]
- 7.Davis GE, Lowell WE, Davis GL. Determining the number of state psychiatric hospital beds by measuring quality of care with artificial neural networks. Am J Med Qual Off J Am Coll Med Qual. 1998;13(1):13–24. doi: 10.1177/106286069801300103 [DOI] [PubMed] [Google Scholar]
- 8.Torrey EF. Jails and prisons--America’s new mental hospitals. Am J Public Health. 1995;85(12):1611–1613. [DOI] [PMC free article] [PubMed] [Google Scholar]
- 9.La EM, Lich KH, Wells R, et al. Increasing Access to State Psychiatric Hospital Beds: Exploring Supply-Side Solutions. Psychiatr Serv Wash DC. 2016;67(5):523–528. doi: 10.1176/appi.ps.201400570 [DOI] [PubMed] [Google Scholar]
- 10.Yoon J, Luck J. Intersystem return on investment in public mental health: Positive externality of public mental health expenditure for the jail system in the U.S. Soc Sci Med 1982. 2016;170:133–142. doi: 10.1016/j.socscimed.2016.10.015 [DOI] [PubMed] [Google Scholar]
- 11.Raphael S, Stoll MA. Assessing the Contribution of the Deinstitutionalization of the Mentally Ill to Growth in the U.S. Incarceration Rate. J Leg Stud. 2013;42(1):187–222. doi: 10.1086/667773 [DOI] [Google Scholar]
- 12.Mundt AP, Chow WS, Arduino M, et al. Psychiatric hospital beds and prison populations in South America since 1990: does the Penrose hypothesis apply? JAMA Psychiatry. 2015;72(2):112–118. doi: 10.1001/jamapsychiatry.2014.2433 [DOI] [PubMed] [Google Scholar]
- 13.Tsai AC, Venkataramani AS. A More Robust Test of the Penrose Hypothesis. JAMA Psychiatry. 2015;72(7):735–736. doi: 10.1001/jamapsychiatry.2015.0212 [DOI] [PMC free article] [PubMed] [Google Scholar]
- 14.Penrose LS. Mental Disease and Crime: Outline of a Comparative Study of European Statistics. Br J Med Psychol. 1939;18(1):1–15. doi: 10.1111/j.2044-8341.1939.tb00704.x [DOI] [Google Scholar]
- 15.Kaeble D, Cowhig M. Correctional Populations in the United States, 2016. U.S. Department of Justice; 2016:14. [Google Scholar]
- 16.Durbin RJ. Medicaid Coverage for Addiction Recovery Expansion Act.; 2017.
- 17.Borinstein AB. Public Attitudes Toward Persons With Mental Illness. Health Aff (Millwood). 1992;11(3):186–196. doi: 10.1377/hlthaff.11.3.186 [DOI] [PubMed] [Google Scholar]
- 18.Carson EA. Prisoners in 2018. U.S. Department of Justice; 2020:1–38. Accessed May 13, 2020 https://www.bjs.gov/content/pub/pdf/p18.pdf [Google Scholar]
- 19.Epanechnikov VA. Non-Parametric Estimation of a Multivariate Probability Density. Theory Probab Its Appl. 1969;14(1):153–158. doi: 10.1137/1114019 [DOI] [Google Scholar]
- 20.Kling JR, Liebman JB, Katz LF. Experimental analysis of neighborhood effects. Econometrica. 2007;75(1):83–119. doi: 10.1111/j.1468-0262.2007.00733.x [DOI] [Google Scholar]
- 21.Ball R, Brown P. An Empirical Evaluation of Accounting Income Numbers. J Account Res. 1968;6(2):159. doi: 10.2307/2490232 [DOI] [Google Scholar]
- 22.Minton TD, Ginder S. Census of Jails: Population Changes, 1999–2013. Published online 2015:22.
- 23.Annual Determination of Average Cost of Incarceration. Federal Register. Published April 30, 2018. Accessed February 28, 2019 https://www.federalregister.gov/documents/2018/04/30/2018-09062/annual-determination-of-average-cost-of-incarceration
- 24.Average Prison Sentence In Months. Published June 25, 2015. Accessed February 28, 2019 https://www.justice.gov/atr/average-prison-sentence-months
- 25.Prison Policy Initiative. 70% of people in local jails are not convicted of any crime. Accessed February 28, 2019 https://www.prisonpolicy.org/graphs/pie2017_jail_detail.html
- 26.Maryland Department of Health and Mental Hygiene. Maryland HealthChoice Program Section 1115 Waiver Amendment. Published online June 30, 2016. Accessed February 7, 2017 https://mmcp.health.maryland.gov/Documents/Maryland%201115%20HealthChoice%20Waiver%20Renewal%20Application%20Submission%20Final.pdf
- 27.Alakeson V, Pande N, Ludwig M. A Plan To Reduce Emergency Room ‘Boarding’ Of Psychiatric Patients. Health Aff (Millwood). 2010;29(9):1637–1642. doi: 10.1377/hlthaff.2009.0336 [DOI] [PubMed] [Google Scholar]
- 28.Appelbaum PS. “Boarding” Psychiatric Patients in Emergency Rooms: One Court Says “No More”. Psychiatr Serv. 2015;66(7):668–670. doi: 10.1176/appi.ps.660707 [DOI] [PubMed] [Google Scholar]
- 29.Mathematica Policy Research. Medicaid Emergency Psychiatric Services Demonstration Evaluation: Final Report. Centers for Medicare and Medicaid Services; 2016:1–146. Accessed November 6, 2017 https://innovation.cms.gov/Files/reports/mepd-finalrpt.pdf [Google Scholar]
- 30.Shumway M, Alvidrez J, Leary M, et al. Impact of capacity reductions in acute public-sector inpatient psychiatric services. Psychiatr Serv Wash DC. 2012;63(2):135–141. doi: 10.1176/appi.ps.201000145 [DOI] [PubMed] [Google Scholar]
- 31.Kim D-Y. Psychiatric Deinstitutionalization and Prison Population Growth: A Critical Literature Review and Its Implications. Crim Justice Policy Rev. 2016;27(1):3–21. doi: 10.1177/0887403414547043 [DOI] [Google Scholar]
- 32.Lamb HR, Talbott JA. The Homeless Mentally III: The Perspective of the American Psychiatric Association. JAMA. 1986;256(4):498–501. doi: 10.1001/jama.1986.03380040072032 [DOI] [PubMed] [Google Scholar]
Associated Data
This section collects any data citations, data availability statements, or supplementary materials included in this article.