

Abstract
Disturbance of the thyroid hormone homeostasis has been associated with adverse health effects such as goiters and impaired mental development in humans and thyroid tumors in rats. In vitro and in silico methods for predicting the effects of small molecules on thyroid hormone homeostasis are currently being explored as alternatives to animal experiments, but are still in an early stage of development. The aim of this work was the development of a battery of in silico models for a set of targets involved in molecular initiating events of thyroid hormone homeostasis: deiodinases 1, 2, and 3, thyroid peroxidase (TPO), thyroid hormone receptor (TR), sodium/iodide symporter, thyrotropin-releasing hormone receptor, and thyroid-stimulating hormone receptor. The training data sets were compiled from the ToxCast database and related scientific literature. Classical statistical approaches as well as several machine learning methods (including random forest, support vector machine, and neural networks) were explored in combination with three data balancing techniques. The models were trained on molecular descriptors and fingerprints and evaluated on holdout data. Furthermore, multi-task neural networks combining several end points were investigated as a possible way to improve the performance of models for which the experimental data available for model training are limited. Classifiers for TPO and TR performed particularly well, with F1 scores of 0.83 and 0.81 on the holdout data set, respectively. Models for the other studied targets yielded F1 scores of up to 0.77. An in-depth analysis of the reliability of predictions was performed for the most relevant models. All data sets used in this work for model development and validation are available in the Supporting Information.
Introduction
Thyroid hormones regulate physiological processes such as basal metabolism and the growth and development of the pituitary gland, heart, liver, bone, and brain.1 Disturbances of the thyroid hormone homeostasis have been linked to goiters, hypothyroidism, and impaired mental development in humans2−5 and thyroid tumor formation in rats.6−9 Thyroid hormone homeostasis is maintained by a complex system involving thyroid hormone synthesis, distribution via the bloodstream, metabolism, elimination, and a negative feedback loop between the hypothalamic–pituitary–thyroid (HPT) axis. In brief, the hypothalamus secretes the thyrotropin-releasing hormone (TRH), which binds to the thyrotropin-releasing hormone receptor (TRHR) in the anterior pituitary, triggering the production and secretion of the thyroid stimulating hormone (TSH).10 TSH binds to the TSH receptor (TSHR) of the thyroid gland, initiating thyroid hormone synthesis.11 As an initial step of the thyroid hormone synthesis, the sodium iodide symporter (NIS), an intrinsic membrane transporter located at the basolateral membrane of thyrocytes, mediates the active transport of iodide into the thyroid gland.12 Thyroid peroxidase (TPO), a heme containing peroxidase located at the apical membrane of the thyrocytes, catalyzes the iodination as well as the coupling of tyrosine residues to thyroglobulin to form tetraiodothyronine (T4) and, to a lesser extent, the more active form triiodothyronine (T3). Deiodinases (DIO), a group of selenocysteine-containing enzymes, regulate thyroid hormone signaling through the deiodination of thyroid hormones, resulting in the formation of thyroid hormone metabolites with differing activity. DIO1 not only plays an important role in systemic T3 production in the thyroid but also in recycling iodide from thyroid hormone metabolites in excreting organs like the liver and kidney. DIO2 and DIO3 regulate local thyroid hormone signaling in peripheral tissue through activation (DIO2) and inactivation (DIO3) of thyroid hormones. DIO2-expressing tissues include the pituitary gland, skeletal muscle, bone, brown adipose tissue, and the thyroid, while DIO3 is mainly present in placental tissue and the developing embryo as well as in neurons in the brain.13 The transcription of thyroid hormone-regulated genes is initiated through the binding of thyroid hormones (T3 in particular) to thyroid hormone receptors (TR). Upon hormone binding, the TR–thyroid hormone complex translocates into the nucleus and interacts with response elements on the DNA, leading to the transcription of thyroid hormone-regulated genes.14
Chemicals have been reported to disturb the HPT axis through a variety of mechanisms. In the context of regulations (EU) no. 528/2012 and (EC) no. 1107/2009, the European Food Safety Authority published a guideline for the identification of endocrine disrupting compounds. This guideline defines scientific criteria for the determination of endocrine-disrupting properties of chemicals,15 leading to an increased need for methods to detect endocrine-mediated effects.
The Organization for Economic Co-operation and Development (OECD) proposes a tiered approach for the evaluation of potential endocrine disruptors using all existing toxicological data. Level 1 of this tiered approach involves physical and chemical property analysis, read-across, quantitative structure–activity relationship (QSAR) analysis, and further in silico methods. Level 2 involves in vitro assays for individual end points, and Levels 3–5 involve in vivo assays providing different layers of information.16 In vitro models are available for many key events related to the HPT axis,17 but none of these have been validated and accepted by the OECD yet. In silico and in vitro methods can guide product development and avoid higher-tier regulatory testing, hence reducing the need for in vivo studies in accordance with the 3R principle.18 Further, in vitro and in silico models can be used to build and confirm adverse outcome pathways (AOPs); multiple HPT-axis-related AOPs are already available at https://aopwiki.org/.19 AOPs can serve as guidance for integrated testing and assessment strategies and enable the integration of in vivo and in vitro data.
A variety of in vitro methods for the evaluation of end points involved in thyroid hormone homeostasis have been reported in the scientific literature. Moreover, the Endocrine Disruptor Screening Program of the United States Environmental Protection Agency (U.S. EPA) has started high-throughput in vitro assays for key events in the regulation of thyroid hormone homeostasis and has fed their testing results into the Toxicity Forecaster (ToxCast) database.20 Many of these high-throughput assays show high rates of positive outcomes. These are in part related to nonspecific effects such as cytotoxicity, protein synthesis inhibition, nonspecific enzyme inhibition, and others. For this reason, any compounds reported as active by these assays are generally subjected to testing in orthogonal assays.
In vitro data have been utilized to develop in silico models. For example, Rosenberg et al.21 have developed QSAR models for predicting the interaction of substances with the TPO based on data obtained within ToxCast phase 1 and phase 2 (consisting of primarily pesticides and chemicals of research and regulatory interest) as well as E1K (such as chemicals of interest to the EPA’s Endocrine Disruption Screening Program). Rosenberg et al. first built a model on the 1126 chemicals in the ToxCast phase 1 and 2 data sets and tested it on the ToxCast E1K data set (containing 771 compounds that are not included in the ToxCast phase 1 and 2 data sets), on which it obtained a balanced accuracy of 85%. In addition, the authors generated a classifier on the combined data set. This classifier obtained an averaged balanced accuracy of 83% during a five-time two-fold stratified cross-validation. Several QSAR models for predicting the binding affinity of small molecules to the TR have also been reported.22−24
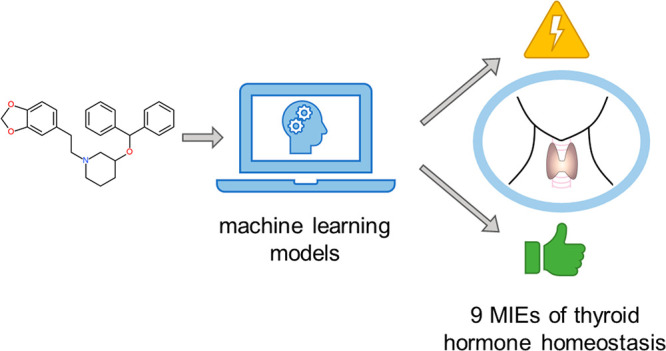
The aim of this study was the development of a battery of machine learning models for the prediction of interactions of small molecules with proteins involved in molecular initiating events (MIEs) of thyroid hormone homeostasis, including the three DIOs (DIO1, DIO2, and DIO3), TPO, TR, NIS, TRHR, and TSHR. In addition to logistic regression (LR), random forest (RF), gradient boosting (XGB), support vector machine (SVM), and neural networks (NN) were explored as well as strategies for the generation of multi-task models.
The in silico approaches presented in this work could provide guidance in the assessment of the safety profiles of small molecules during early development phases. The models could also prove useful in mode of action prediction for endocrine disruptors.
Materials and Methods
Data Sets
For DIO1, TPO, TR, NIS, TRHR, and TSHR, data sets with measured binary assay outcomes (“active”, “inactive”) were obtained from the ToxCast database25 (Figure 1; Table 1). All these data sets have in common that they include at least 50 active compounds after data processing (see below for details on the data processing procedure). Binary activity labels were assigned according to the “hitc” value (“active” if the “hitc” value is one and “inactive” if it is zero; Table 2). The hitc value is calculated by fitting a curve to concentration–response data and determining whether the minimum activity threshold, defined individually for each assay, was reached.26
Figure 1.
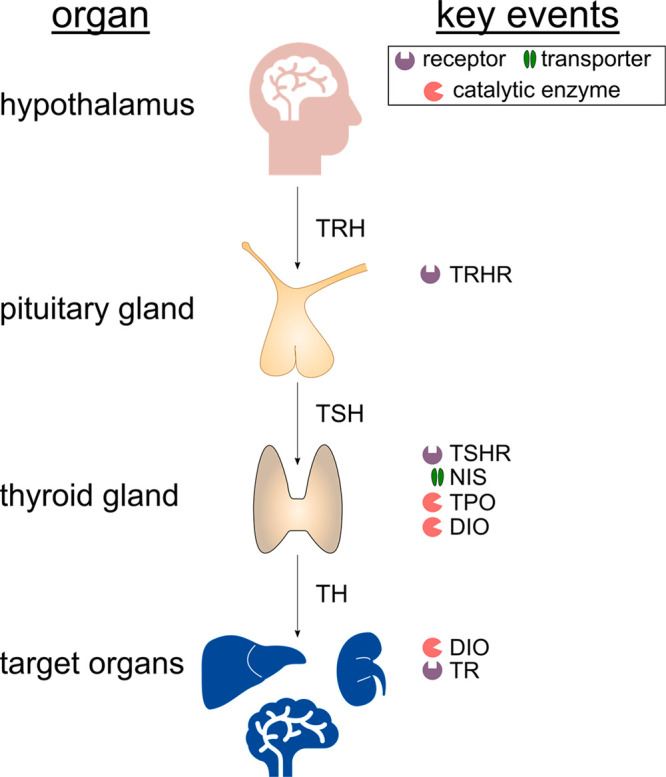
Overview of the protein families involved in MIEs of thyroid hormone homeostasis that are investigated in this work.
Table 1. Overview of the Modeled Assays and the ToxCast Compound Libraries the Assays Were Tested on.
| end point | assay model | assay description | ToxCast compound library tested on the assay | source of the assay data used in this work |
|---|---|---|---|---|
| deiodinase activity | recombinant DIO enzyme | measurement of DIO inhibition using an iodide release assay with recombinant DIO enzyme and quantification via Sandell–Kolthoff reaction | ToxCast phase 1_v2, phase 2, and e1k database | DIO1: NHEERL_MED_hDIO1_dna + Olker et al., 2019 |
| DIO2 + 3: Olker et al., 2019 | ||||
| thyroid peroxidase activity | rat thyroid microsomes | quantification of TPO inhibition via the oxidation of Amplex UltraRed in the AUR-TPO assay | ToxCast phase 1_v2, phase 2, and e1k database | NCCT_TPO_AUR_dna + Friedman et al., 2016 |
| thyroid hormone receptor modulation | GH3.TRE-LUC (rat pituitary tumor cell line transfected with the TR regulated luciferase reporter and TH response elements) | antagonistic modulation of TR binding measured via thyroid hormone-dependent luciferase expression | Tox21 compound library | TOX21_TR_LUC_GH3_Antagonista |
| NIS-mediated iodide uptake | hNIS-HEK293T-EPA (hNIS transfected HEK293T-EPA cells) | quantification of NIS inhibition via radioactive iodide uptake | ToxCast phase 1_v2 and phase 2 database | NIS_RAIU_inhibitiona |
| TRH receptor modulation | TRHR-HEK293 cells (TRHR transfected HEK-293 cells) | agonistic and antagonistic activation of the TRHR measured via quantification of intracellular Ca2+ concentration using a fluorescent dye | Tox21 compound library | TOX21_TRHR_HEK293_Antagonista |
| TSH receptor modulation | HEK293-TSHR (TSHR transfected HEK-293 cells) | agonistic and antagonistic modulation of the G-protein coupled TSHR was measured through quantification of cAMP production as a marker for TSHR activation. cAMP production was quantified with Förster resonance energy using a competitive immunoassay to differentiate between naive and labeled cAMP | Tox21 compound library | TOX21_TSHR_Agonist_ratioa |
| TOX21_TSHR_Antagonist_ratioa |
Data taken from the ToxCast database; the identifier indicates the assay name.
Table 2. Overview of the Data Sets Used for In Silico Model Development.
| number
of |
||||
|---|---|---|---|---|
| target abbreviation | assay name | active compounds | inactive compounds | ratio |
| DIO1 | NHEERL_MED_hDIO1_dn | 109 | 1610 | 1:15 |
| DIO2 | DIO2 inhibition | 178 | 1551 | 1:9 |
| DIO3 | DIO3 inhibition | 183 | 1545 | 1:8 |
| TPO | NCCT_TPO_AUR_dn | 256 | 796 | 1:3 |
| TR | TOX21_TR_LUC_GH3_Antagonist | 1251 | 5091 | 1:4 |
| NIS | NIS_RAIU_inhibition | 55 | 747 | 1:14 |
| TRHR | TOX21_TRHR_HEK293_Antagonist | 70 | 6548 | 1:94 |
| TSHRAnt | TOX21_TSHR_Antagonist_ratio | 116 | 6591 | 1:57 |
| TSHRAg | TOX21_TSHR_Agonist_ratio | 202 | 6587 | 1:33 |
For DIO1, TPO, and NIS, the ToxCast database only includes compounds that were tested in a multiconcentration assay (after they had previously been tested active in a single-concentration assay). Therefore, information on inactive compounds (these are the compounds that were tested negative in the single-concentration assay) was collected from the scientific literature (note that these works originate from the same lab as large parts of the ToxCast database). More specifically, data on 1678 compounds inactive on DIO1 were collected from Olker et al.,27 data on 746 compounds inactive on TPO were collected from Friedman et al.,28 and data on 663 compounds inactive on NIS were collected from Wang et al.29
For DIO2 and DIO3, all data used in this work were extracted from Olker et al. The data are derived with a colorimetric single-concentration assay measuring the release of iodide from the hormone substrate (at 200 μM concentration). Compounds inhibiting either deiodinase by at least 50% were then tested at multiple concentrations in the same assay setup. For the purpose of this study, binary activity labels were assigned according to the following rules: Any compounds with inhibition rates in the multiconcentration assay of 20% or higher were labeled as “active”; all other compounds, including those showing <50% inhibition in the single-concentration assay, were labeled as “inactive”.
The compounds tested in the assays for the three DIOs, TPO, TR, NIS, TRHR, and TSHR are part of the Tox21 (Toxicology in the 21st Century program) and ToxCast (EPA’s Toxicity Forecaster) projects. The Tox21 program is a collaboration between United States government agencies to develop high-throughput assays for the determination of adverse effects of small molecules on human health. The Tox21 library contains over 9000 substances, covering commercial chemicals, pesticides, food additives, and medical compounds. The ToxCast project is run by the U.S. EPA and has screened around 4500 substances in more than 700 high-throughput assays so far. The substances screened in the ToxCast project include not only a high number of pesticides but also food additives, pharmaceutical compounds, and cosmetics.30 The ToxCast compound library has been built incrementally, by adding new subsets of compounds in each phase. For the assays considered in this work, different subsets of the ToxCast data sets or the complete Tox21 compounds library were tested in each assay (Table 1; see also the “Compound library” column in the Supporting Information Excel file).
The ToxCast database provides information (flags; see Table S1 for details) that can help in the identification of potentially false-positive and false-negative assay outcomes. For the seven data sets collected from the ToxCast database, data points tagged with any flag that indicate a potential quality issue were filtered out.
The results of confirmatory assays for TR and TSHR are also included in the ToxCast database and were used for refining the corresponding data sets with the following procedure: For the compounds tested in the confirmatory assay of TR (“TOX21_TR_LUC_GH3_Antagonist_Followup”),31 the activity labels of the initial data set were corrected with the confirmatory assay information. For the TSHR end point, any compounds tested positive in an assay setup that lacks the TSHR reporter (“TOX21_TSHR_wt_ratio”) were removed from the data (as positive results in this assay indicate that a compound’s activity is not caused by a specific interaction with the TSHR; Figure 2; Table 3).
Figure 2.
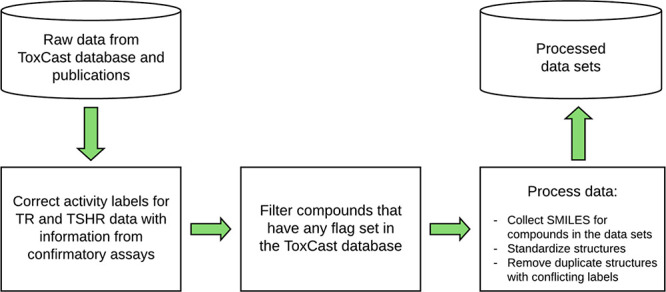
Data processing workflow from the raw data to the final processed data sets used for modeling.
Table 3. Number of Compounds for Each Class at Different Steps in the Data Processing Workflow.
| number of compounds |
||||||
|---|---|---|---|---|---|---|
| raw
data |
after
filtering of compounds with any ToxCast flag |
processed
data sets used for model development |
||||
| end point | active | inactive | active | inactive | active | inactive |
| DIO1 | 136 | 1683 | 119 | 1683 | 109 | 1610 |
| DIO2 | 194 | 1625 | –a | –a | 178 | 1551 |
| DIO3 | 194 | 1625 | –a | –a | 183 | 1545 |
| TPO | 489 | 830 | 264 | 810 | 256 | 796 |
| TR | 2376 | 5929 | 1354 | 5574 | 1251 | 5091 |
| NIS | 282 | 756 | 55 | 756 | 55 | 747 |
| TRHR | 317 | 7554 | 81 | 7161 | 70 | 6548 |
| TSHRAnt | 336 | 7535 | 116 | 7206 | 116 | 6591 |
| TSHRAg | 489 | 7382 | 222 | 7192 | 202 | 6587 |
Data not in the ToxCast database - no flag filtering step.
A “global thyroid toxicity” data set was generated by merging the nine data sets (see section Structure Preparation for details). This data set as well as the data source of each data point and the assay setup on which each compound was tested are provided as Supporting Information (“Complete data set” Excel sheet). Two complementary Excel sheets in the Supporting Information file report the data points filtered out due to a ToxCast flag (“Flag filtered compounds” Excel sheet) and the raw and standardized SMILES with the standardization steps applied on each compound (“Raw and standardized SMILES” Excel sheet).
The DrugBank,32 containing a total of 11,355 approved, experimental, or withdrawn drugs, served as a reference data set to represent the drug-like chemical space. The EU CosIng database,33 containing 1089 compounds, was utilized for the representation of the chemical space of cosmetic substances. Herbicides, insecticides, and fungicides were represented by all 522 compounds in the ChEMBL database34 that have a mechanism of action classification assigned according to the Fungicide Resistance Action Committee (FRAC), Herbicide Resistance Action Committee (HRAC), or Insecticide Resistance Action Committee (IRAC) systems.
Data Sets Filtered for Cytotoxicity and Nonspecificity
In an attempt to further increase the quality of the data sets utilized for model development, any compound for which there was any data available suggesting that its measured activity could be related to cytotoxicity, the inhibition of cell growth or multiplication, or nonspecific protein inhibition was removed from the data sets. For the end points, for which these types of interference have been specifically studied and published (i.e., TPO, TR and NIS), the information was collected from the related publications (Table 4). For DIO1, TRHR, TSHRAnt, and TSHRAg, the Z-score from the ToxCast database, based on the AC50 of the assay of interest and of a cytotoxicity assay, was used for determining cytotoxicity. For DIO2 and DIO3, no information on the cytotoxicity of the compounds tested in these assays was identified. In the case of TPO, the selectivity value calculated by Friedman et al.28 served as the criterion for identifying cytotoxic compounds and nonspecific inhibitors. Any compounds with a selectivity value below 1.0 were discarded. In the case of TR, cytotoxicity data were collected from the viability assay provided as part of the ToxCast database (assay “TOX21_TR_LUC_GH3_Antagonist_viability”). For NIS, the outcome of a cytotoxicity filter was obtained from the work of Wang et al.29 In the case of DIO1, TRHR, and two TSHR end points, compounds with a Z-score from the ToxCast database lower than 3.0 were removed. With this information, data sets containing only compounds that did not show any interference were compiled for DIO1, TPO, TR, NIS, TRHR, TSHRAnt, and TSHRAg. This data set is also provided as Supporting Information (“Filtered data set” Excel sheet). In the Supporting Information, filtered out compounds in this data set are tagged with the label “filtered out data point”, and the data source for the filtering is indicated as well.
Table 4. Overview of the Criteria Employed for Filtering Compounds for Cytotoxicity and of Resulting Data Set Compositions.
| number
of compounds after filtering cytotoxicity |
||||
|---|---|---|---|---|
| end point | data source | cytotoxicity filter | active | inactive |
| DIO1 | ToxCast database | Z-score > 3 | 17 | 1610 |
| DIO2 | No data | – | – | – |
| DIO3 | No data | – | – | – |
| TPO | Friedman et al.28 | selectivity value > 1 | 188 | 796 |
| TR | ToxCast database | TOX21_TR_LUC_GH3_Antagonist_viability hitc value = 1 | 422 | 5072 |
| NIS | Wang et al.29 | Hit2 value = 0 | 31 | 747 |
| TRHR | ToxCast database | Z-score > 3 | 5 | 6552 |
| TSHRAnt | ToxCast database | Z-score > 3 | 1 | 6593 |
| TSHRAg | ToxCast database | Z-score > 3 | 41 | 6590 |
Software and Hardware Setup
All calculations were performed on Linux workstations running Red Hat Enterprise 7.8 and equipped with Intel Xeon Gold 6136 processors (3.00 GHz) and 64 GB of main memory.
KNIME35 was used for the preparation of the structures (with the ChemAxon Standardizer36 and RDKit Canon SMILES37 nodes) and descriptor calculation (RDKit Count-Based Fingerprint and RDKit Descriptor calculation nodes). The principal component analysis (PCA) as well as model training and evaluation were performed in Python with the packages scikit-learn38 and Keras.39
Structure Preparation
The molecules tested in one or several of the nine assays (including those assays not included in the ToxCast database) originate from one or more chemical libraries compiled within the ToxCast program (phases 1, 2, and 3). The SMILES strings for these compounds were obtained from the ToxCast database, where available. In the absence of such information, the NCI/CADD Chemical Identifier Resolver40 was queried with the CAS number instead. Ultimately, for compounds without a match, the “RDKit from IUPAC” node of RDKitin KNIME was used to try to derive a structure from the chemical name.
All structures in the modeling data sets were processed and standardized with the ChemAxon Standardizer node in KNIME. More specifically, the tool was used for removing solvents, stripping salts, detecting and annotating aromaticity, removing stereochemical information, neutralizing charges, mesomerizing structures, and removing small fragments. Canonical SMILES were derived from the standardized molecules with RDKit (with default parameters) and used for deduplication. Duplicate compounds with conflicting activity labels for an assay were removed. The global thyroid toxicity data set, generated by merging the nine end-point-specific data sets based on the previously generated canonical SMILES, consists of 8001 substances.
Descriptor Calculation
Count-based Morgan fingerprints with a radius of 2 bonds and a length of 2048 bits were calculated with the “RDKit Count-Based Fingerprint” node of RDKit in KNIME. In addition, all 119 one-dimensional (1D) and two-dimensional (2D) physicochemical property descriptors implemented in the “RDKit Descriptor Calculation” node were computed, which describe, among other properties, the number of particular types of atoms, the numbers of bonds and rings in a molecule, as well as polarity and solubility. Prior to model building, the 1D and 2D descriptors were subjected to Z-score normalization using the “Normalizer” node in KNIME. Descriptors for which no variance was observed for the global thyroid data set were removed.
Chemical Space Analysis
Dimensionality reduction was performed on the global thyroid data set with the PCA implementation of scikit-learn, based on a subset of 23 physically meaningful and interpretable molecular descriptors generated with RDKit (Table S2).
Machine Learning Methods
Five machine learning approaches for classification were explored: LR, RF, XGB, SVM, and NN. LR classification models employ a mathematical function that is a linear combination of one or more independent variables. RF is an ensemble learning method that utilizes a multitude of decision trees for making predictions. The XGB algorithm makes decisions based on an ensemble of decision trees, too, with the special feature that each new tree is designed to correct the mistakes made by the previous one. SVMs project the features into a hyperplane that maximizes the distance to each class point in space and which then acts as the decision boundary. Multilayer perceptron NN are formed by nodes, or so-called “neurons”, located in different interconnected layers. Information is transferred back and forth between layers to update the functions in the neurons, with the objective of minimizing the error between the correct class and the prediction.
The NN models were generated with Keras, and all other types of models were implemented with scikit-learn in Python. The optimization of hyperparameters (Table 5) was performed during a grid search within a 10-fold cross-validation framework. The F1 score was used as the optimization criterion.
Table 5. Overview of Hyperparameters Applied for Each Method.
| method | hyperparametersa | valuesb |
|---|---|---|
| logistic regression | C | 0.7, 0.8, 1 |
| random forest | number of estimators | 500, 1000 |
| min_samples_leaf | 1, 2 | |
| gradient boosting | estimators | 500, 1000 |
| support vector machine | C | 0.01, 1, 10 |
| gamma | scale, auto | |
| neural network | number of layers | 3 |
| neurons | (4000, 1000, 1), (1000, 500, 1) | |
| dropout rate | 0, 0.3 | |
| learning rate | 0.001, 0.0001 |
Hyperparameters for which the default values were preserved are not reported.
A grid search was conducted to identify the optimum value for parameters for which more than one value is reported in this table; otherwise, the value was fixed.
Generation and Evaluation of Single-Task Models
To address data imbalance (excess of inactive compounds in this case), weight balancing, undersampling, and oversampling techniques were explored.
For the weight balancing approach, balanced weights for the active and inactive classes were calculated with scikit-learn and employed in combination with the ML methods: RF, LR, SVM, and NN. For XGB, balanced weights were not used, as the method itself is designed to deal with class imbalance by successively constructing training sets with misclassified examples.
An inner 10-fold cross-validation (CV) was applied for hyperparameter selection, and an outer 10-fold CV was applied for performance assessment.
For the undersampling approach, the following workflow was developed, which generates an ensemble of models built on different training sets (Figure 3):
-
(1)
Preparation of the data sets: The data were divided into a training set (80%) and a test set (20%). To evade class imbalance, the number of inactive compounds (majority class) in the training set was reduced by random selection, while all active compounds were retained. For data sets with an active-to-inactive ratio of <1:10, the ratio was changed to 2:3. For data sets with an active-to-inactive ratio ≥1:10, the ratio was changed to 1:2 (Table 6).
-
(2)
Hyperparameter optimization: Hyperparameter optimization was performed on the resampled data sets within a 10-fold CV framework. The 10 models obtained from the CV were grouped based on the selected hyperparameter values to calculate the mean F1 score for each hyperparameter set. The best model of the group with the highest mean value was selected and subsequently evaluated on the test set.
-
(3)
Generation of the final ensemble of models: By repeating this workflow 100 times, an ensemble of 100 models, trained on different balanced data sets, was obtained for each method. In order to determine the best overall hyperparameters for the end point classification problem and ensure model robustness, the 100 models were grouped according to their hyperparameter values, and the best ensemble of models was chosen as the predictive model. The selection of the best ensemble is based on a score calculated as the mean F1 score plus the number of models in the ensemble.
Figure 3.
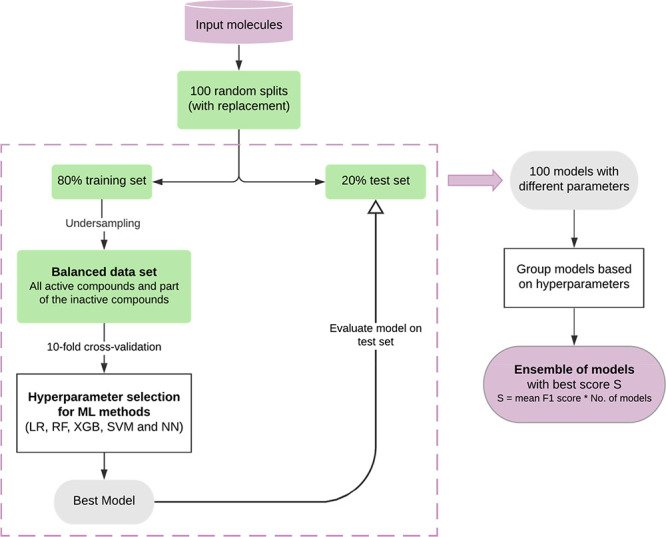
Workflow for generating and testing models based on training sets balanced by undersampling. The hyperparameters of the ML models are optimized during a grid search within a 10-fold CV framework. The performance of the resulting best model is evaluated on the test set. The result of the workflow is an ensemble of models with optimized hyperparameters for each method.
Table 6. Composition of the Training Sets after Undersampling.
| number
of |
|||
|---|---|---|---|
| end point | active compounds | inactive compounds | ratio of active and inactive compounds |
| DIO1 | 87 | 147 | 1:2 |
| DIO2 | 142 | 213 | 2:3 |
| DIO3 | 146 | 219 | 2:3 |
| TPO | 205 | 307 | 2:3 |
| TR | 1001 | 1501 | 2:3 |
| NIS | 44 | 88 | 1:2 |
| TRHR | 56 | 112 | 1:2 |
| TSHRAnt | 93 | 186 | 1:2 |
| TSHRAg | 162 | 324 | 1:2 |
For the oversampling approach, the SMOTENC41 method was employed. Molecular fingerprints were defined as categorical features, and the “sampling strategy” parameter, which defines the resulting ratio between the minority and majority class, was set to 0.7. The RF, LR, XGB, SVM, and NN models were trained on these oversampled data sets, with an inner 10-fold CV for hyperparameter selection and an outer 10-fold CV for performance estimation.
Generation and Evaluation of Multi-task Models
A multi-task model was generated based on the global thyroid toxicity data set. Additional three multi-task models were generated from subsets of the global data set that include only a subset of end points. All models were derived with multilayer perceptron NNs with a shared architecture for all tasks. Only the output layer is independent for each learned task. Missing values in the training set (related to the fact that not all compounds have been tested in all assays) were not considered during model training and evaluation by masking (i.e., ignoring) them during the loss and performance calculation. Class imbalance was addressed by balancing the class weights for the loss calculation based on the active-to-inactive ratio in the training set. A workflow similar to the one used for the single-task models (but skipping the undersampling step) was employed to derive an ensemble of models (Figure 3). A grid search for hyperparameter optimization was carried out within a 10-fold CV framework (Table 7), and four combinations of assay end points were evaluated. The combinations covered two to nine end points, starting with TPO and TR, and incrementally adding (i) the three DIOs, (ii) NIS and TRHR, and (iii) both TSHR end points. In the case of the multi-task models, the performance was evaluated and optimized on the mean F1 score among all end points included in the model.
Table 7. Overview of Combinations of Hyperparameters Explored.
| number of layers | parameter | valuesa |
|---|---|---|
| 4 | neurons | (8000, 4000, 1000, X), (4000, 2000, 500, X) |
| dropout rate | 0, 0.3 | |
| regularizer rate | 0.000001 | |
| learning rate | 0.0001 | |
| 5 | neurons | (9000, 4000, 1000, 100, X), (5000, 2000, 1000, 100, X) |
| regularizer rate | 0, 0.0000001 | |
| learning rate | 0.0001 |
“X” in the number of neurons denotes the number of end points employed for each multi-task model (i.e., number of neurons in the output layer).
Metrics for Model Performance Evaluation
Six different metrics were employed for the evaluation of model performance:
-
(1)
Precision: measures the proportion of true positive predictions out of all positive predictions (eq 2).
-
(2)
Recall: measures the proportion of correctly identified positive samples (eq 3).
-
(3)
F1 score: is the harmonic mean of precision and recall (eq 4). It is robust against data imbalance.
-
(4)
Matthews correlation coefficient (MCC): considers all four classes of predictions (true positive, true negative, false positive, and false negative predictions; eq 5). MCC values range from −1 to +1, with a value of +1 indicating perfect prediction. The metric is robust against data imbalance.
-
(5)
Balanced accuracy: quantifies the average recall obtained for each class and, therefore, is robust against data imbalance (eq 6).
-
(6)
Area under the receiver operating curve (AUC): is a measure of the ability of a model to distinguish between positive and negative samples. The AUC is calculated as the bidimensional area under the receiver operating curve (eq 7).
| 2 |
| 3 |
| 4 |
| 5 |
| 6 |
| 7 |
where FN is false negatives, FP is false positives, TN is true negatives, TP is true positives, FPR is false positive rate, and TPR is true positive rate.
Results and Discussion
In this study, five machine learning methods (RF, LR, XGB, SVM, and NN) were employed with the aim to develop predictive classifiers for nine end points involved in thyroid hormone homeostasis: DIO1, DIO2, DIO3, TPO, TR, NIS, TRHR, TSHRAnt, and TSHRAg. Because of a lack of active compounds across all training sets (the active class represents only 1 to 32% of the training data), a weight balancing approach, an undersampling method, and an oversampling strategy were explored. In addition, the use of multi-task models was investigated as a possible avenue to obtain better performing and more widely applicable in silico models.
Chemical Space
The chemical space represented by the training data defines the applicability domain of a model. An in-depth analysis of the composition and properties of the ToxCast and Tox21 data sets was conducted by Richard et al.30 In their work, Richard et al. describe how the chemicals included in the ToxCast data sets were selected (e.g., compounds with available in vivo toxicity results, donated by pharmaceutical companies, or known endocrine disruptors) and how this selection yielded a high chemical structure diversity and a broad chemical property coverage.
In order to determine the relevance of the data employed in this study, we compared the chemical space covered by our global thyroid toxicity data set (containing measured data on the nine modeled thyroid end points for 8001 compounds) as well as the end-point-specific data sets to the chemical space covered by pesticides (all compounds in ChEMBL that are linked with the HRAC, IRAC or FRAC systems), cosmetic substances (from the EU CosIng database), and drugs (from DrugBank). We found that the global thyroid toxicity data set covers pesticides (coverage 78%) better than cosmetic substances (39%) and drugs (25%). Analysis of the end-point-specific data sets shows that at least 47% of all agrochemicals are represented by training set compounds with a Tanimoto coefficient (based on Morgan2 fingerprints) of 0.6 or higher (Table 8). For cosmetics and drugs, this percentage is only 17% and 6%, respectively. Only in the case of TR, TRHR, and both TSHR end points, the coverage of cosmetics and drugs is higher (58% and 33%; at a similarity threshold of 0.6). The higher coverage is related to the fact that the size of the training sets for these end points is much larger and that the compounds tested in these assays include the Tox21 compound library, which has a higher percentage of cosmetics and drugs.
Table 8. Percentage of Compounds in the Reference Data Sets Covered by a Compound in the End-Point-Specific Data Sets at the Given Tanimoto Similarity Thresholds.
| end
point |
||||||||||
|---|---|---|---|---|---|---|---|---|---|---|
| Tanimoto similarity | DIO1 | DIO2 | DIO3 | TPO | TR | NIS | TRHR | TSHRAnt | TSHRAg | |
| % coverage pesticides | 1.0. | 57 | 57 | 57 | 47 | 56 | 35 | 65 | 65 | 70 |
| ≥0.8 | 58 | 58 | 58 | 48 | 57 | 36 | 66 | 65 | 71 | |
| ≥0.6 | 67 | 68 | 68 | 58 | 68 | 47 | 76 | 76 | 79 | |
| ≥0.4 | 84 | 84 | 84 | 78 | 85 | 68 | 87 | 89 | 90 | |
| ≥0.2 | 99 | 99 | 99 | 98 | 99 | 98 | 99 | 99 | 99 | |
| % coverage cosmetics | 1.0 | 16 | 16 | 16 | 9 | 37 | 7 | 39 | 40 | 39 |
| ≥0.8 | 20 | 20 | 20 | 11 | 41 | 9 | 43 | 44 | 43 | |
| ≥0.6 | 34 | 34 | 34 | 19 | 58 | 17 | 59 | 60 | 59 | |
| ≥0.4 | 69 | 70 | 70 | 52 | 98 | 49 | 86 | 86 | 86 | |
| ≥0.2 | 95 | 95 | 95 | 92 | 98 | 92 | 98 | 98 | 98 | |
| % coverage drugs | 1.0 | 5 | 5 | 5 | 3 | 22 | 2 | 20 | 20 | 20 |
| ≥0.8 | 5 | 5 | 5 | 3 | 24 | 3 | 22 | 22 | 22 | |
| ≥0.6 | 10 | 10 | 10 | 7 | 37 | 6 | 33 | 34 | 33 | |
| ≥0.4 | 28 | 29 | 29 | 22 | 62 | 20 | 60 | 60 | 60 | |
| ≥0.2 | 95 | 95 | 95 | 93 | 98 | 91 | 98 | 98 | 98 | |
PCA scatter plots derived from the global thyroid toxicity data set using physically meaningful and interpretable molecular descriptors (Figure 4) show a strong overlap of the areas most densely populated by the active and inactive compounds of any of the target-specific subsets. A small number of outliers is observed for any of the data sets. These are mostly macrocyclic molecules or large compounds with a high number of rings. For most end points, the active compounds tend to have high values in the second component of the PCA (y-axis), which are primarily a result of high numbers of aromatic rings.
Figure 4.

PCA based on a selection of interpretable molecular descriptors generated with the RDKit for the end-point-specific data sets. Active compounds are colored in red and inactive compounds in purple. The shift of the active compounds toward higher values on the y-axis is mainly due to a high number of aromatic rings.
Molecular diversity within the end-point-specific data sets was analyzed with plots of the pairwise similarities (based on atom-pair fingerprints)42 among (a) all pairs of active compounds, (b) all pairs of inactive compounds, and (c) all pairs consisting of one active and one inactive compound. The distribution of similarities among these three sets of compounds is comparable and shows a tailing toward small similarities (examples for DIO1 and TPO are shown in Figure 5 and are representative of all targets; the figures for all other investigated targets are provided in Figure S1). This analysis confirms the high molecular diversity of the compounds included in the data sets, as it was also concluded by Richard et al.30 Note that the distribution of pairwise similarities among the active compounds is comparable to the distribution of pairwise similarities between the active and inactive compounds.
Figure 5.
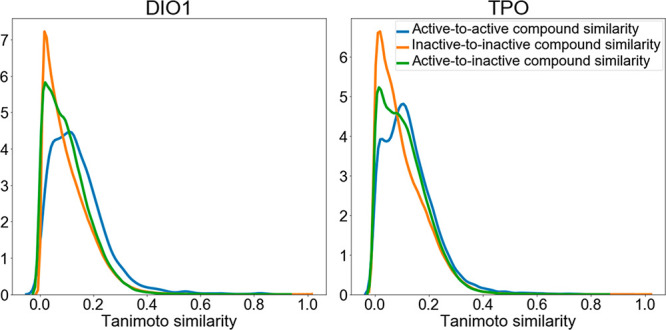
Examples of the distribution of pairwise Tanimoto similarities based on atom-pair fingerprints for three types of compound pairs: (a) active-to-active, (b) inactive-to-inactive, and (c) active-to-inactive. The distributions for all other end-point-specific data sets are provided in Figure S1.
To further analyze the chemical diversity of the data sets, we calculated the number of distinct Murcko scaffolds in each end-point-specific data set and in the global thyroid toxicity data set. Additionally, also the number of compounds without a Murcko scaffold (i.e., without a ring system) and the number of compounds with a unique scaffold (defined as the sum of compounds with a unique Murcko scaffold and compounds without Murcko scaffold) were calculated (Table 9). From this analysis, it can be seen that there is a high number of distinct scaffolds in the data sets (between 330 distinct Murcko scaffolds for NIS and 2327 for the global data set) and that around half of the compounds have a unique scaffold (between 45% for the global data set and 61% for the NIS data set).
Table 9. Number of Distinct Murcko Scaffolds and Compounds without a Ring System.
| end point | number of distinct Murcko scaffolds | number of compounds without ring systems | percentage of unique scaffoldsa |
|---|---|---|---|
| DIO1 | 554 | 455 | 53% |
| DIO2 | 557 | 456 | 52% |
| DIO3 | 557 | 456 | 52% |
| TPO | 418 | 231 | 55% |
| TR | 1877 | 1608 | 48% |
| NIS | 330 | 202 | 61% |
| TRHR | 1810 | 1712 | 47% |
| TSHRAnt | 1834 | 1733 | 47% |
| TSHRAg | 1876 | 1728 | 47% |
| global data set | 2327 | 1871 | 45% |
Unique scaffolds are defined as the sum of compounds with unique Murcko scaffold and compounds without Murcko scaffold.
The relationship between specific chemical groups and active compounds for the different assays was analyzed by searching the list “SMARTS Patterns for Functional Group Classification”43 distributed by Open Babel,44 which contains 309 SMARTS patterns, in the respective inactive and active compounds of each data set. The number of hits per class was analyzed, and a ratio, defined as the number of hits in active compounds divided by the number of hits in inactive compounds, was calculated. Only functional groups with ratios >1.7 were considered. The total number of hits was also taken into account, and only functional groups found in at least six compounds were regarded. Following these criteria, only for the TPO and TR end points, a relationship between some functional groups and active compounds could be established. Compared to inactive compounds, a high proportion of active compounds for TPO have at least one primary aromatic amine, phenol, sulfenic derivative, enol, thiourea, vinylogous acid, and phosphoric acid derivative (Table 10). Among the compounds active on TR organometallic compounds, diarylthioethers and enamine groups are over-represented.
Table 10. Number of Hits of Functional Groups in the Inactive and Active Compounds of the Data Sets.
| SMARTS
hits for the functional groups (inactive:active compounds)a |
||||||||||
|---|---|---|---|---|---|---|---|---|---|---|
| end point | primary aromatic amine | organometallic compounds | phenol | sulfenic derivative | diarylthioether | enol | enamine | thiourea | vinylogous acid | phosphoric acid derivative |
| TPO | 20:40 | – | 48:95 | 6:15 | – | 1:6 | – | 1:8 | 10:20 | 13:27 |
| TR | – | 7:27 | – | – | 9:49 | – | 7:20 | – | – | – |
Only values with ratios (active/inactive compounds) >1.7 and with at least 6 hits in the active compounds are shown.
Single-Task Classification Models
For each of the nine thyroid-related end points, the data obtained from the ToxCast database and relevant publications were employed for training and evaluation of single-task classification models (see Methods for details). The models were developed based on molecular fingerprints and physicochemical descriptors. All possible combinations of the five ML algorithms and three data balancing techniques were explored.
The performance of the models based on any of the five ML algorithms was in general very similar. For example, the maximum difference in the F1 scores observed among ML algorithms in combination with the oversampling approach was no higher than 0.10 (maximum difference observed for the NIS end point, with F1 scores of 0.70 and 0.60 for the LR and RF models, respectively).
The impact of the data balancing approach on model performance was also, in general, small. The largest differences in the mean F1 scores for different balancing approaches among the ML models for the same end point were between 0.02 (for TR) and 0.19 (for TRHR) (see Figure 6 for a comparison of the F1 scores obtained by the RF models; the figures for all other models are provided in Figure S2). However, a tendency for ML models to perform best when trained on oversampled data was observed. The maximum difference in F1 scores between a ML method trained on oversampled data and one trained on undersampled or imbalanced data (using weight balancing) was −0.23 (for the TRHR model with SVM in combination with undersampling). Only in one case, which is the RF model for NIS, the model based on undersampled data performed favorably to the model based on oversampled data (F1 score 0.66 vs 0.60). The biggest differences related to data sampling were observed for the TRHR and the two TSHR end points, for which the undersampling approach yielded up to 0.24 lower mean F1 scores than the other two sampling approaches. The reason for this is likely the extreme imbalance of the training sets for these three end points, with only 1–3% of active compounds. Undersampling in these cases leads to a substantial loss of information on inactive compounds, which is otherwise preserved. However, the gain in performance related to oversampling comes at the cost of an increased standard deviation across models trained on different splits of the data.
Figure 6.
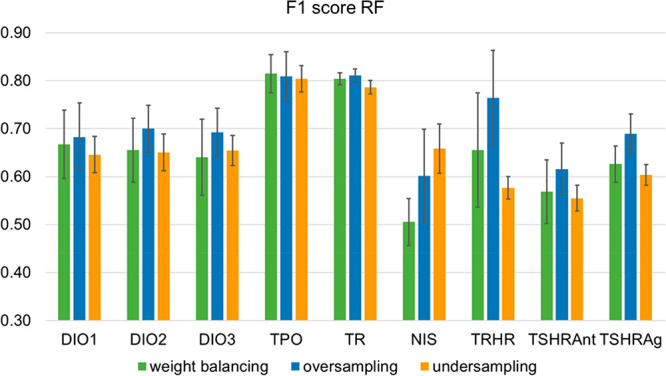
Comparison of the mean F1 score obtained with the RF method in combination with the different data sampling techniques (weight balancing, oversampling, and undersampling) for the nine thyroid end points.
Because of the overall favorable performance of models trained on oversampled data, further discussion focuses on these models. Unless stated otherwise, all results refer to mean values obtained by 10-fold cross-validation. Although the main text only discusses the F1 score results, MCC values, balanced accuracies, and AUC values are also provided in Table 11.
Table 11. Mean and Standard Deviation of the Performance of Different Methods for All Modeled End Points.
| end point | method | F1 score | MCC | balanced accuracy | AUC |
|---|---|---|---|---|---|
| DIO1 | RF | 0.68 (± 0.07) | 0.41 (± 0.15) | 0.64 (± 0.06) | 0.87 (± 0.04) |
| LR | 0.68 (± 0.06) | 0.37 (± 0.12) | 0.67 (± 0.07) | 0.83 (± 0.08) | |
| XGB | 0.70 (± 0.08) | 0.45 (± 0.15) | 0.66 (± 0.07) | 0.84 (± 0.05) | |
| SVM | 0.71 (± 0.07) | 0.44 (± 0.15) | 0.68 (± 0.06) | 0.86 (± 0.04) | |
| NN | 0.70 (± 0.05) | 0.43 (± 0.10) | 0.67 (± 0.06) | 0.86 (± 0.08) | |
| DIO2 | RF | 0.70 (± 0.05) | 0.43 (± 0.11) | 0.66 (± 0.04) | 0.85 (± 0.06) |
| LR | 0.67 (± 0.05) | 0.35 (± 0.10) | 0.67 (± 0.05) | 0.81 (± 0.05) | |
| XGB | 0.70 (± 0.06) | 0.41 (± 0.11) | 0.67 (± 0.05) | 0.81 (± 0.06) | |
| SVM | 0.71 (± 0.04) | 0.43 (± 0.09) | 0.68 (± 0.04) | 0.84 (± 0.04) | |
| NN | 0.69 (± 0.05) | 0.39 (± 0.10) | 0.67 (± 0.04) | 0.82 (± 0.05) | |
| DIO3 | RF | 0.69 (± 0.05) | 0.41 (± 0.10) | 0.66 (± 0.05) | 0.85 (± 0.04) |
| LR | 0.70 (± 0.05) | 0.39 (± 0.09) | 0.69 (± 0.04) | 0.82 (± 0.05) | |
| XGB | 0.69 (± 0.05) | 0.40 (± 0.11) | 0.67 (± 0.05) | 0.82 (± 0.06) | |
| SVM | 0.68 (± 0.04) | 0.38 (± 0.08) | 0.66 (± 0.04) | 0.85 (± 0.04) | |
| NN | 0.71 (± 0.05) | 0.42 (± 0.11) | 0.68 (± 0.05) | 0.85 (± 0.06) | |
| TPO | RF | 0.81 (± 0.05) | 0.63 (± 0.10) | 0.79 (± 0.05) | 0.91 (± 0.04) |
| LR | 0.80 (± 0.06) | 0.60 (± 0.12) | 0.80 (± 0.07) | 0.88 (± 0.05) | |
| XGB | 0.83 (± 0.04) | 0.67 (± 0.09) | 0.82 (± 0.05) | 0.90 (± 0.04) | |
| SVM | 0.80 (± 0.05) | 0.60 (± 0.10) | 0.80 (± 0.05) | 0.88 (± 0.05) | |
| NN | 0.82 (± 0.04) | 0.64 (± 0.08) | 0.81 (± 0.04) | 0.90 (± 0.04) | |
| TR | RF | 0.81 (± 0.01) | 0.62 (± 0.03) | 0.80 (± 0.01) | 0.92 (± 0.01) |
| LR | 0.77 (± 0.02) | 0.54 (± 0.04) | 0.76 (± 0.02) | 0.87 (± 0.03) | |
| XGB | 0.80 (± 0.02) | 0.61 (± 0.04) | 0.79 (± 0.02) | 0.91 (± 0.02) | |
| SVM | 0.77 (± 0.04) | 0.54 (± 0.09) | 0.75 (± 0.04) | 0.87 (± 0.05) | |
| NN | 0.79 (± 0.01) | 0.59 (± 0.02) | 0.77 (± 0.02) | 0.89 (± 0.02) | |
| NIS | RF | 0.60 (± 0.10) | 0.23 (± 0.20) | 0.58 (± 0.07) | 0.86 (± 0.10) |
| LR | 0.70 (± 0.08) | 0.41 (± 0.16) | 0.68 (± 0.06) | 0.86 (± 0.08) | |
| XGB | 0.66 (± 0.09) | 0.32 (± 0.19) | 0.63 (± 0.07) | 0.82 (± 0.11) | |
| SVM | 0.68 (± 0.08) | 0.40 (± 0.15) | 0.66 (± 0.08) | 0.84 (± 0.10) | |
| NN | 0.66 (± 0.10) | 0.32 (± 0.20) | 0.64 (± 0.09) | 0.81 (± 0.12) | |
| TRHR | RF | 0.76 (± 0.10) | 0.58 (± 0.17) | 0.70 (± 0.09) | 0.91 (± 0.05) |
| LR | 0.72 (± 0.09) | 0.46 (± 0.18) | 0.69 (± 0.09) | 0.86 (± 0.07) | |
| XGB | 0.68 (± 0.08) | 0.39 (± 0.15) | 0.66 (± 0.10) | 0.84 (± 0.14) | |
| SVM | 0.77 (± 0.11) | 0.57 (± 0.22) | 0.73 (± 0.11) | 0.90 (± 0.03) | |
| NN | 0.72 (± 0.12) | 0.45 (± 0.25) | 0.69 (± 0.13) | 0.83 (± 0.07) | |
| TSHRAnt | RF | 0.62 (± 0.05) | 0.30 (± 0.13) | 0.58 (± 0.04) | 0.87 (± 0.06) |
| LR | 0.60 (± 0.06) | 0.22 (± 0.14) | 0.58 (± 0.04) | 0.78 (± 0.09) | |
| XGB | 0.63 (± 0.06) | 0.28 (± 0.15) | 0.60 (± 0.04) | 0.82 (± 0.06) | |
| SVM | 0.63 (± 0.06) | 0.32 (± 0.15) | 0.59 (± 0.05) | 0.82 (± 0.07) | |
| NN | 0.65 (± 0.06) | 0.32 (± 0.13) | 0.62 (± 0.05) | 0.76 (± 0.08) | |
| TSHRAg | RF | 0.69 (± 0.04) | 0.44 (± 0.08) | 0.63 (± 0.03) | 0.89 (± 0.03) |
| LR | 0.66 (± 0.06) | 0.34 (± 0.13) | 0.62 (± 0.06) | 0.80 (± 0.06) | |
| XGB | 0.67 (± 0.05) | 0.36 (± 0.11) | 0.63 (± 0.04) | 0.83 (± 0.04) | |
| SVM | 0.66 (± 0.04) | 0.38 (± 0.07) | 0.62 (± 0.03) | 0.82 (± 0.04) | |
| NN | 0.68 (± 0.06) | 0.37 (± 0.11) | 0.64 (± 0.05) | 0.79 (± 0.07) |
The classification models derived for DIO1, DIO2, and DIO3 all showed comparable performance, with mean F1 scores ranging from 0.67 to 0.71, depending on the ML method used (Table 11). Within the individual end points, the largest difference in F1 scores between ML methods was just 0.04. SVM produced the best model for DIO1 (mean F1 score of 0.71) and DIO2 (mean F1 score of 0.71), whereas NN worked best for DIO3 (mean F1 score of 0.71).
The models for the TPO and TR end points yielded mean F1 scores between 0.77 (for TR with LR and SVM) and 0.83 (for TPO with XGB). The best-performing algorithm for TPO was XGB (mean F1 score of 0.83), while RF performed best on the TR data set (mean F1 score of 0.81). For the NIS models, the mean F1 scores ranged from 0.60 (with RF) to 0.70 (with LR). Linear models (LR and SVM) outperformed decision trees (RF and XGB) and NNs on this data set, with up to 0.10 higher F1 scores. The standard deviation of the F1 score among the 10-fold CV models ranges from 0.08 to 0.10 with the different algorithms. The high standard deviation may be related to an overfitting of models as a result of the low number of active compounds in the training set (only 55 active compounds and 747 inactive compounds).
It should also be considered that the data sets for the DIOs, TPO, and NIS include data measured in single- and multiconcentration assays. The class labels for the single-concentration results were set considering the inhibition cutoff of 50%, while for the multiconcentration results, the class labels were derived from a more precise curve fitting on the concentration–response data (for DIO1, TPO, and NIS) or from an inhibition cutoff of 50% (for DIO2 and DIO3; see Materials and Methods for details). The combination of these two types of data may increase the uncertainty of the models and result in lower performance. This difference in the cut-offs for the multiconcentration results may also be the reason why for DIO2 and DIO3, a higher percentage of active compounds does not seem to be beneficial to model performance when compared to DIO1. Although for the latter end point the number of active compounds is lower, they were identified by curve fitting instead of the fixed 50% inhibition threshold applied for DIO2 and DIO3, which may cause a higher number of false positives. In the case of TPO, the better performance of the models could be explained, to some extent, by the fact that the active compounds were also derived from the concentration–response curve and that the percentage of active compounds is higher. Similar causes could explain the performance of the TR models, for which all data was derived from the multiconcentration assays and which has a higher percentage of active compounds.
For the TRHR end point, where the number of active compounds is also small (70 active compounds and 6545 inactive compounds), the standard deviation of the mean F1 score was between 0.08 and 0.12. However, the mean F1 scores were higher than for NIS and ranged from 0.68 (with XGB) to 0.77 (with SVM). The mediocre results and the variability of these models may be caused by the assay design itself. In this assay, the activity of compounds against this receptor is derived from the concentration of intracellular calcium as a marker of GPCR activation (via fluorescence) and is thus prone to interference, for example, by any alteration of intracellular calcium or autofluorescence.
The outcomes of the two TSHR assays were predicted with mean F1 scores ranging from 0.60 (for TSHRAnt with LR) to 0.69 (for TSHRAg with RF). For TSHRAnt, the best results (mean F1 score of 0.65) were obtained with NN, whereas for TSHRAg, the best results (mean F1 score of 0.69) were obtained with RF. An important limitation of the data used for model development is related to assay technology, which employs fluorescent antibodies coupled to a second messenger to derive the activity of the compounds against TSHR.45 Since this second messenger is nonspecific and may be activated via several pathways, and fluorescence measurements may be positive due to fluorescent compounds and dyes, the false-positive rate in the data may be substantial.
Overall, the presented models could contribute to the first level of the OECD approach for the evaluation of potential endocrine disruptors, by making available models for an initial screen to detect the interaction of small molecules with key targets related to thyroid hormone homeostasis. Moreover, the models could help to build or confirm HPT-axis related AOPs.
However, it is important to highlight the intrinsic nature of the modeled assays. These are high-throughput in vitro assays, which usually show high rates of (false) positive outcomes due to interferences, as shown by Paul-Friedman et al.31 for the case of TR. Therefore, compounds showing activity in these assays should be tested in orthogonal assays, and the same principle should be applied to the presented models.
In-Depth Analysis of Model Performance and Prediction Reliability
Among all end points investigated, the best models were obtained for TPO and TR. As these well-performing models will be of primary relevance to investigators, we conducted additional analyses with them in order to gain an in-depth understanding of model performance and the reliability of predictions. Since all algorithms showed a similar performance on TPO and TR, the analysis is exemplified for the RF models in combination with oversampling, which obtained a mean F1 score of 0.81 for both end points during 10-fold CV.
First, we investigated how the distance of the prediction probability to the decision boundary relates to the reliability of a prediction. More specifically, we gradually reduced the coverage of the model by removing compounds from the test set which are predicted with probabilities close to the decision threshold, starting with those closest to the boundary (Figure 7). For both the TPO and TR models, the F1 scores increased as more compounds close to the decision boundary were removed, indicating that there was a higher rate of wrong predictions among compounds closer to the cutoff. We also investigated the number of compounds that are not covered by the model, as we increase the minimum distance to the decision threshold. When excluding around 20% of the test compounds, the TPO model had an F1 score of 0.86 (+0.05) and the TR model an F1 score of 0.89 (+0.07). Reducing the coverage of the model to those compounds predicted with high confidence could therefore increase the validity of the model.
Figure 7.
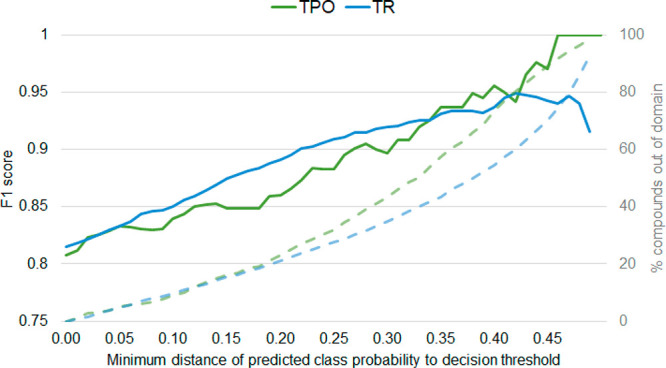
Changes in the F1 score (solid lines) and coverage (dashed lines), as compounds with predicted probabilities close to the decision boundary for the RF model of TPO (green) and TR (blue) were considered out of the applicability domain and removed.
The similarity of the query compounds to the training data can be decisive for prediction success. To determine how this affects model performance, for each compound in the test set, the (average) Tanimoto similarity of the ECFP fingerprint to the one, three, and five nearest neighbors in the training set was calculated. For both the TPO and TR end points, a linear relationship between the similarity of the compounds and the F1 score was observed, consistent when considering different numbers of nearest neighbors (Figure 8). For the TPO model, the F1 score was 0.21 points higher for compounds that are similar to the training data (Tanimoto similarity higher than 0.8) than for compounds that are not represented by structurally related molecules in the training data (Tanimoto similarity lower than 0.2) when considering one nearest neighbor. For the TR model, this difference was 0.18 points. Determining the similarity of new compounds to those in the training sets can therefore help to estimate the reliability of the predictions.
Figure 8.
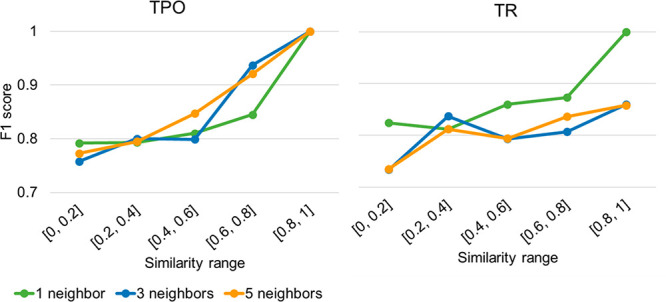
F1 scores as a function of the Tanimoto similarity between the compounds in the test set and in the training set. The similarity was calculated based on the ECFP fingerprint between one, three, or five nearest neighbors.
Single-Task Models Generated from Filtered Data Sets
The data modeled so far originate from high-throughput screening assays and are therefore often error-prone. False positive outcomes may occur if, for instance, a nonspecific interaction between a compound and a protein is measured, or if a compound is falsely perceived as active due to its cytotoxicity. On the other hand, false negative outcomes may be caused by the volatility or low solubility of compounds, which reduces their concentration in the assay sample. In some cases, they may also be caused by the cytotoxicity of compounds, as it impedes the identification of a possible interaction.
Available information about the specificity and cytotoxicity of the assay outcomes was collected from the ToxCast database as well as other publications, and the affected measured data were filtered out from the data sets (see Materials and Methods for details). After this filtering step, sufficient amounts of data for model development (i.e., at least 50 active compounds) remained available only for TPO and TR. Compared to the complete data sets, the filtered data sets for TPO and TR contain 27% and 66% less active compounds (total of 68 and 829 active compounds less), respectively. For TPO, the number of inactive compounds remains the same, and for TR, it is reduced by only 0.3% (16 compounds). Note that filtering does not mitigate the problem of false-negative outcomes related to, for example, compound volatility or solubility issues.
With the filtered data sets for TPO and TR, classification models with the same five ML algorithms in combination with oversampling were developed. For TPO, the models obtained F1 scores of up to 0.81 (with RF in combination with oversampling; Table 12). However, the best F1 score obtained by models trained on the unfiltered data set was marginally higher (0.83). Also for TR, the highest F1 score obtained by the models built on the filtered data set (0.68, obtained with the RF model in combination with oversampling) was 0.13 points lower than the best F1 score obtained by the models trained on the complete data set. The observed lower performance of the models on the filtered data sets may be related to the substantial reduction of active compounds, which leads to a significant loss of information.
Table 12. Mean and Standard Deviation of the Performance of Different Methods for the Models Built on the Filtered Data Sets for Nonspecific and Cytotoxic Compounds for TPO and TR.
| end point | method | F1 score | MCC | balanced accuracy | AUC |
|---|---|---|---|---|---|
| TPO | RF | 0.81 (± 0.05) | 0.63 (± 0.10) | 0.78 (± 0.04) | 0.91 (±0.03) |
| LR | 0.79 (± 0.07) | 0.59 (± 0.13) | 0.79 (± 0.06) | 0.87 (± 0.04) | |
| XGB | 0.80 (± 0.04) | 0.60 (± 0.09) | 0.79 (± 0.04) | 0.89 (± 0.02) | |
| SVM | 0.79 (± 0.03) | 0.58 (± 0.07) | 0.78 (± 0.04) | 0.89 (± 0.03) | |
| NN | 0.79 (± 0.05) | 0.58 (± 0.11) | 0.77 (± 0.05) | 0.88 (± 0.04) | |
| TR | RF | 0.68 (± 0.05) | 0.39 (± 0.10) | 0.65 (± 0.04) | 0.88 (± 0.02) |
| LR | 0.63 (± 0.03) | 0.28 (± 0.05) | 0.62 (± 0.02) | 0.77 (± 0.05) | |
| XGB | 0.67 (± 0.05) | 0.37 (± 0.10) | 0.64 (± 0.04) | 0.85 (± 0.04) | |
| SVM | 0.66 (± 0.04) | 0.34 (± 0.07) | 0.66 (± 0.05) | 0.82 (± 0.04) | |
| NN | 0.64 (± 0.04) | 0.29 (± 0.07) | 0.61 (± 0.04) | 0.81 (± 0.04) |
Although reducing the number of compounds to only those more specific for the inhibitory or antagonistic activity of the targets does not improve the ability of the model to differentiate between active and inactive compounds, these models may have more biological relevance, as they represent a more specific mechanism. However, the substantial reduction of the data sets severely narrows the coverage of the chemical space by the models and therefore their applicability domain.
Multi-task Classification Models
In a further attempt to maximize the performance and scope of in silico models, we explored the use of multi-task models for toxicity prediction, which present the opportunity to combine information and learn a common representation for the molecules.46 These models are trained on multiple end points simultaneously and may hence benefit from regularization and transfer learning (Figure 9). This could be particularly beneficial in the case of small or imbalanced training sets, like some of the ones handled in this work. For the implementation of multi-task models, we selected NNs as they are the preferred approach for multi-task models in the literature47,48 and benefit most from the use of larger data sets.
Figure 9.
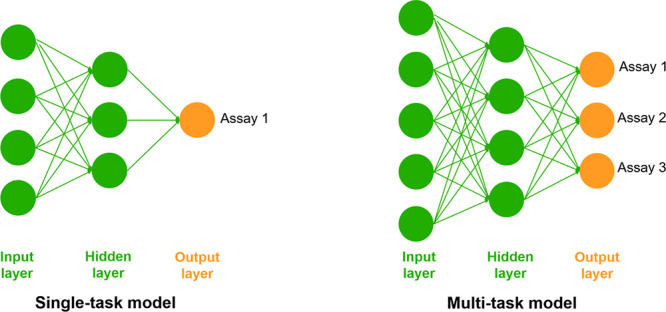
Representation of single-task (left) and multi-task (right) NNs. On the single-task models, only one problem (assay result) is solved at a time, while multi-task models can learn and solve different problems simultaneously.
Four multi-task models were built based on different combinations of end points, each covering two to nine end points. As the single-task models for TPO and TR showed good performance (indicating that the training sets for these end points have a high information content), these end points were included in all multi-task models. The other end points were incrementally added to the training data of the multi-task models.
The multi-task models were developed within a workflow that generates 100 models built on different training sets and with optimized hyperparameters (see Materials and Methods for details). The 100 models are grouped based on their hyperparameters, and one group of models with common hyperparameters is selected as the final model. This selection is based on the number of models in the ensemble and its mean F1 score over the respective test sets of the single models. The performance of the multi-task models was evaluated on the mean F1 score of the selected ensemble.
In all cases, the performance of the multi-task NN models was similar to that of the single-task NN model implementing the oversampling approach (Figure 10). The best mean F1 scores obtained among the models with different end point combinations were of 0.81 for TPO (vs 0.82 for the single-task NN model), 0.79 for TR (vs 0.79), 0.69 for DIO1 (vs 0.70), 0.69 for DIO2 (vs 0.69), 0.68 for DIO3 (vs 0.71), 0.64 for NIS (vs 0.66), 0.72 for TRHR (vs 72), 0.64 for TSHRAnt (vs 0.65), and 0.66 for TSHRAg (vs 0.68) (Table 13). The mean F1 score of the multi-task models was also in general comparable to the one obtained by the best single-task model (Figure 10).
Figure 10.
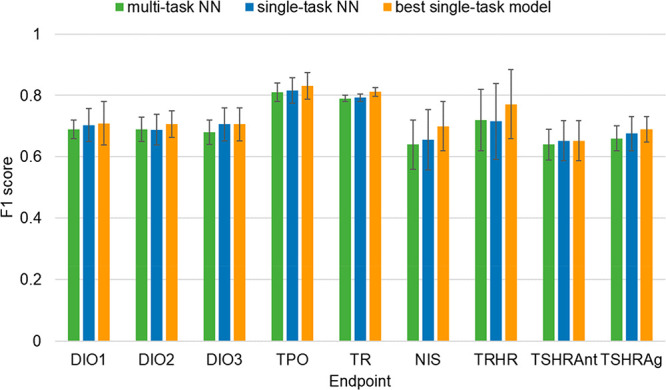
Comparison of single- and multi-task models. Results for single-task methods are divided in (a) best method (orange) and (b) NN method (blue). Performance of multi-task NN is shown in green.
Table 13. Mean F1 Score and Standard Deviation for the Multi-task Models With Different End Point Combinations.
| F1 score |
||||
|---|---|---|---|---|
| end point | model 1 | model 2 | model 3 | model 4 |
| DIO1 | 0.67 (± 0.05) | 0.69 (± 0.03) | 0.68 (± 0.05) | |
| DIO2 | 0.68 (± 0.05) | 0.68 (± 0.04) | 0.69 (± 0.04) | |
| DIO3 | 0.67 (± 0.04) | 0.67 (± 0.04) | 0.68 (± 0.04) | |
| TPO | 0.81 (± 0.03) | 0.81 (± 0.03) | 0.80 (± 0.03) | 0.80 (± 0.03) |
| TR | 0.79 (± 0.02) | 0.79 (± 0.02) | 0.79 (± 0.01) | 0.78 (± 0.01) |
| NIS | 0.63 (± 0.08) | 0.64 (± 0.08) | ||
| TRHR | 0.72 (± 0.02) | 0.72 (± 0.10) | ||
| TSHRAnt | 0.64 (± 0.05) | |||
| TSHRAg | 0.66 (± 0.04) | |||
Those end points implemented in models with different combinations of end points showed similar performance in all combinations (difference in the mean F1 score up to 0.02 points), suggesting that an increase in the number of end points and data sets represented by a model does not contribute much to the learning process. Although all targets are related to thyroid hormone homeostasis, their structure and functions as well as the assays employed for measuring their function are diverse. The transfer of information between end points is then limited to simple molecular features, without benefiting from common biological features. Since these features are already contained in the descriptors used as input for all the models, there would be no information gain in the combination of these end points, explaining the similar results to the single-task models.
Conclusions
We have compiled a comprehensive set of experimental data on the interference of small molecules with nine targets involved in molecular initiating events of thyroid hormone homeostasis (DIO1, DIO2, DIO3, TPO, TR, NIS, TRHR, and TSHR antagonism and agonism) from the ToxCast database and published studies. Five ML algorithms in combination with three data balancing approaches were explored for the generation of single-task models. In addition, NNs were explored for the development of multi-task models combining several end points.
The classifiers for TPO and TR showed high predictive performance during a 10-fold CV, with mean F1 scores of up to 0.83 and 0.81, respectively. The models for the other end points (DIO1, DIO2, DIO3, NIS, TRHR, TSHRAnt, and TSHRAg), for which the quantity and quality of the available data were more limited, yielded mean F1 scores between 0.65 and 0.77. Overall, the impact of the selected ML algorithm and data balancing method on model performance was minor. Larger differences in the performance of the different models were observed for end points for which the amount of data available for model development is very limited (mainly NIS, TRHR, and TSHR). For these end points, models derived in combination with weight balancing and oversampling usually performed better than models derived in combination with undersampling (F1 scores up to 0.24 higher). However, this increase in performance comes with the cost of a higher standard deviation during CV. The performance of the multi-task models was comparable to those of the single-task models, indicating that these models were not able to benefit from a transfer of information. We also showed that the reliability of the predictions is correlated with the similarity of the test compounds and the training instances as well as with the distance of the predicted probability from the decision boundary.
The initial data sets were further filtered with complementary information available on the reliability of assay outcomes (related to cytotoxicity and nonspecific protein inhibition). However, the substantial reduction of training data caused by this refinement procedure resulted in models that did in no case outperform the models trained on unfiltered data. Although the chemical space represented by these models is narrower than the chemical space of those derived from the unfiltered data, these models may be of higher biological relevance as they represent a more specific interaction of the compounds with the target protein.
Overall, the models presented in this work can help in the identification of substances with the potential to disturb the thyroid hormone homeostasis and point out which key events are affected. Thus, they may help to prioritize compounds for further testing in early stages of development and to support read-across. This will ultimately reduce animal testing and increase efficiency of product development and regulatory testing.
Acknowledgments
We thank Katie Paul-Friedman from the United States Environmental Protection Agency for the information about the ToxCast database assays. We are also grateful for the valuable comments and suggestions received by the two anonymous expert reviewers.
Glossary
Abbreviations
- AOP
adverse outcome pathway
- AUC
area under the receiver operating characteristic curve
- CV
cross-validation
- DIOs
deiodinases
- DIO1
deiodinase 1
- DIO2
deiodinase 2
- DIO3
deiodinase 3
- EPA
Environmental Protection Agency
- FRAC
Fungicide Resistance Action Committee
- HPT
hypothalamic–pituitary–thyroid
- HRAC
Herbicide Resistance Action Committee
- IRAC
Insecticide Resistance Action Committee
- LR
logistic regression
- MCC
Matthews correlation coefficient
- MIE
molecular initiating event
- ML
machine learning
- NIS
sodium/iodide symporter
- NN
neural networks
- PCA
principal component analysis
- QSAR
quantitative structure–activity relationship
- RF
random forest
- SVM
support vector machine
- T3
triiodothyronine
- T4
tetraiodothyronine
- TPO
thyroid peroxidase
- TR
thyroid hormone receptor
- TRH
thyrotropin-releasing hormone
- TRHR
thyrotropin-releasing hormone receptor
- TSH
thyroid-stimulating hormone
- TSHR
thyroid-stimulating hormone receptor
- TSHRAg
thyroid-stimulating hormone receptor agonism
- TSHRAnt
thyroid-stimulating hormone receptor antagonism
- XGB
gradient boosting
Supporting Information Available
The Supporting Information is available free of charge at https://pubs.acs.org/doi/10.1021/acs.chemrestox.0c00304.
Additional tables and figures: Flags available in the ToxCast database for tagging potential errors in class labeling; list of molecular descriptors used in principal component analysis; distribution of pairwise Tanimoto similarities based on atom-pair fingerprints; comparison of the mean F1 scores obtained for the nine thyroid end points with different machine learning algorithms and data sampling techniques (PDF)
Additional data: The processed data sets, including the “Complete data set” and the “Filtered data set”, used in this work for model development and validation as well as complementary information on (i) the filtered out compounds due to ToxCast flags and (ii) the raw SMILES and the SMILES standardization steps (XLSX)
Author Present Address
⊥ (J.A.) Bayer AG, 65926 Frankfurt, Germany.
The authors declare the following competing financial interest(s): M.G.d.L., A.G.W., B.B., R.L., K.-J.S., and M.M. are employed at BASF SE. J.A. was employed at BASF SE during the time he was contributing to this work.
Supplementary Material
References
- Zoeller R. T.; Tan S. W.; Tyl R. W. (2007) General Background on the Hypothalamic-Pituitary-Thyroid (HPT) Axis. Crit. Rev. Toxicol. 37, 11–53. 10.1080/10408440601123446. [DOI] [PubMed] [Google Scholar]
- Kim W. G.; Cheng S. Y. (2013) Thyroid Hormone Receptors and Cancer. Biochim. Biophys. Acta, Gen. Subj. 1830, 3928–3936. 10.1016/j.bbagen.2012.04.002. [DOI] [PMC free article] [PubMed] [Google Scholar]
- Brent G. A. (2012) Mechanisms of Thyroid Hormone Action. J. Clin. Invest. 122, 3035–3043. 10.1172/JCI60047. [DOI] [PMC free article] [PubMed] [Google Scholar]
- Leemans M.; Couderq S.; Demeneix B.; Fini J.-B. (2019) Pesticides With Potential Thyroid Hormone-Disrupting Effects: A Review of Recent Data. Front. Endocrinol. 10, 743. 10.3389/fendo.2019.00743. [DOI] [PMC free article] [PubMed] [Google Scholar]
- De Cock M.; Maas Y. G.; Van De Bor M. (2012) Does Perinatal Exposure to Endocrine Disruptors Induce Autism Spectrum and Attention Deficit Hyperactivity Disorders? Review. Acta Paediatr. 101, 811–818. 10.1111/j.1651-2227.2012.02693.x. [DOI] [PubMed] [Google Scholar]
- Hill R. N.; Crisp T. M.; Hurley P. M.; Rosenthal S. L.; Singh D. V. (1998) Risk Assessment of Thyroid Follicular Cell Tumors. Environ. Health Perspect. 106, 447–457. 10.1289/ehp.98106447. [DOI] [PMC free article] [PubMed] [Google Scholar]
- Liu J.; Liu Y.; Barter R. A.; Klaassen C. D. (1995) Alteration of Thyroid Homeostasis by UDP-Glucuronosyltransferase Inducers in Rats: A Dose-Response Study. J. Pharmacol. Exp. Ther. 273, 977–985. [PubMed] [Google Scholar]
- McClain R. M.; Levin A. A.; Posch R.; Downing J. C. (1989) The Effect of Phenobarbital on the Metabolism and Excretion of Thyroxine in Rats. Toxicol. Appl. Pharmacol. 99, 216–228. 10.1016/0041-008X(89)90004-5. [DOI] [PubMed] [Google Scholar]
- McClain R. M. (1989) The Significance of Hepatic Microsomal Enzyme Induction and Altered Thyroid Function in Rats: Implications for Thyroid Gland Neoplasia. Toxicol. Pathol. 17, 294–306. 10.1177/019262338901700206. [DOI] [PubMed] [Google Scholar]
- Harris A. R.; Christianson D.; Smith M. S.; Fang S.-L.; Braverman L. E.; Vagenakis A. G. (1978) The Physiological Role of Thyrotropin-Releasing Hormone in the Regulation of Thyroid-Stimulating Hormone and Prolactin Secretion in the Rat. J. Clin. Invest. 61, 441–448. 10.1172/JCI108955. [DOI] [PMC free article] [PubMed] [Google Scholar]
- Vassart G.; Dumont J. E. (1992) The Thyrotropin Receptor and the Regulation of Thyrocyte Function and Growth. Endocr. Rev. 13, 596–611. 10.1210/edrv-13-3-596. [DOI] [PubMed] [Google Scholar]
- Dohan O.; De la Vieja A.; Paroder V.; Riedel C.; Artani M.; Reed M.; Ginter C. S.; Carrasco N. (2003) The Sodium/Iodide Symporter (NIS): Characterization, Regulation, and Medical Significance. Endocr. Rev. 24, 48–77. 10.1210/er.2001-0029. [DOI] [PubMed] [Google Scholar]
- Köhrle J. (2000) The Deiodinase Family: Selenoenzymes Regulating Thyroid Hormone Availability and Action. Cell. Mol. Life Sci. 57, 1853–1863. 10.1007/PL00000667. [DOI] [PMC free article] [PubMed] [Google Scholar]
- Desvergne B. (1994) How Do Thyroid Hormone Receptors Bind to Structurally Diverse Response Elements?. Mol. Cell. Endocrinol. 100, 125–131. 10.1016/0303-7207(94)90291-7. [DOI] [PubMed] [Google Scholar]
- Andersson N.; Arena M.; Auteri D.; Barmaz S.; Grignard E.; Kienzler A.; Lepper P.; Lostia A. M.; Munn S.; et al. (2018) Guidance for the Identification of Endocrine Disruptors in the Context of Regulations (EU) No 528/2012 and (EC) No 1107/2009. EFSA J. 16, e05311 10.2903/j.efsa.2018.5311. [DOI] [PMC free article] [PubMed] [Google Scholar]
- (2018) Revised Guidance Document 150 on Standardised Test Guidelines for Evaluating Chemicals for Endocrine Disruption. OECD Series on Testing and Assessment, OECD Publishing, Paris. [Google Scholar]
- Murk A. J.; Rijntjes E.; Blaauboer B. J.; Clewell R.; Crofton K. M.; Dingemans M. M. L.; David Furlow J.; Kavlock R.; Köhrle J.; Opitz R.; Traas T.; Visser T. J.; Xia M.; Gutleb A. C. (2013) Mechanism-Based Testing Strategy Using in Vitro Approaches for Identification of Thyroid Hormone Disrupting Chemicals. Toxicol. In Vitro 27, 1320–1346. 10.1016/j.tiv.2013.02.012. [DOI] [PubMed] [Google Scholar]
- Russell W. M. S., and Burch R. L. (1959) The Principles of Humane Experimental Technique, Methuen & Co. Limited, London. [Google Scholar]
- Noyes P. D.; Friedman K. P.; Browne P.; Haselman J. T.; Gilbert M. E.; Hornung M. W.; Barone S. Jr; Crofton K. M.; Laws S. C.; Stoker T. E.; et al. (2019) Evaluating Chemicals for Thyroid Disruption: Opportunities and Challenges with in Vitro Testing and Adverse Outcome Pathway Approaches. Environ. Health Perspect. 127, 095001. 10.1289/EHP5297. [DOI] [PMC free article] [PubMed] [Google Scholar]
- (2017) Continuing Development of Alternative High-Throughput Screens to Determine Endocrine Disruption, Focusing on Androgen Receptor, Steroidogenesis, and Thyroid Pathways. FIFRA Scientific Advisory Panel, Vol. 30, U.S. EPA, Washington, DC.
- Rosenberg S. A.; Watt E. D.; Judson R. S.; Simmons S. O.; Friedman K. P.; Dybdahl M.; Nikolov N. G.; Wedebye E. B. (2017) QSAR Models for Thyroperoxidase Inhibition and Screening of U.S. and EU Chemical Inventories. Comput. Toxicol. 4, 11–21. 10.1016/j.comtox.2017.07.006. [DOI] [Google Scholar]
- Politi R.; Rusyn I.; Tropsha A. (2014) Prediction of Binding Affinity and Efficacy of Thyroid Hormone Receptor Ligands Using QSAR and Structure Based Modeling Methods. Toxicol. Appl. Pharmacol. 280, 177–189. 10.1016/j.taap.2014.07.009. [DOI] [PMC free article] [PubMed] [Google Scholar]
- Liu H.; Gramatica P. (2007) QSAR Study of Selective Ligands for the Thyroid Hormone Receptor β. Bioorg. Med. Chem. 15, 5251–5261. 10.1016/j.bmc.2007.05.016. [DOI] [PubMed] [Google Scholar]
- Azimi G.; Afiuni-Zadeh S.; Karami A. (2012) A QSAR Study for Modeling of Thyroid Receptors β1 Selective Ligands by Application of Adaptive Neuro-Fuzzy Inference System and Radial Basis Function. J. Chemom. 26, 135–142. 10.1002/cem.2421. [DOI] [Google Scholar]
- (2019) ToxCast and Tox21 Summary Files for invitroDBv3.2, U.S. EPA, Washington, DC. (accessed 2020-08-27)
- Filer D. L.; Kothiya P.; Setzer R. W.; Judson R. S.; Martin M. T. (2016) tcpl: the Tox Cast Pipeline for High-Throughput Screening Data. Bioinformatics 33, 618–620. 10.1093/bioinformatics/btw680. [DOI] [PubMed] [Google Scholar]
- Olker J. H.; Korte J. J.; Denny J. S.; Hartig P. C.; Cardon M. C.; Knutsen C. N.; Kent P. M.; Christensen J. P.; Degitz S. J.; Hornung M. W. (2019) Screening the Tox Cast Phase 1, Phase 2, and e1k for Inhibitors of Iodothyronine. Toxicol. Sci. 168, 430–442. 10.1093/toxsci/kfy302. [DOI] [PMC free article] [PubMed] [Google Scholar]
- Friedman K. P.; Watt E. D.; Hornung M. W.; Hedge J. M.; Judson R. S.; Crofton K. M.; Houck K. A.; Simmons S. O. (2016) Tiered High-Throughput Screening Approach to Identify Thyroperoxidase Inhibitors Within the Tox Cast Phase I and II Chemical Libraries. Toxicol. Sci. 151, 160–180. 10.1093/toxsci/kfw034. [DOI] [PMC free article] [PubMed] [Google Scholar]
- Wang J.; Hallinger D. R.; Murr A. S.; Buckalew A. R.; Lougee R. R.; Richard A. M.; Laws S. C.; Stoker T. E. (2019) High-Throughput Screening and Chemotype-Enrichment Analysis of Tox Cast Phase II Chemicals Evaluated for Human Sodium-Iodide Symporter (NIS) Inhibition. Environ. Int. 126, 377–386. 10.1016/j.envint.2019.02.024. [DOI] [PMC free article] [PubMed] [Google Scholar]
- Richard A. M.; Judson R. S.; Houck K. A.; Grulke C. M.; Volarath P.; Thillainadarajah I.; Yang C.; Rathman J.; Martin M. T.; Wambaugh J. F.; Knudsen T. B.; Kancherla J.; Mansouri K.; Patlewicz G.; Williams A. J.; Little S. B.; Crofton K. M.; Thomas R. S. (2016) Tox Cast Chemical Landscape: Paving the Road to 21st Century Toxicology. Chem. Res. Toxicol. 29, 1225–51. 10.1021/acs.chemrestox.6b00135. [DOI] [PubMed] [Google Scholar]
- Paul-Friedman K.; Martin M.; Crofton K. M.; Hsu C. W.; Sakamuru S.; Zhao J.; Xia M.; Huang R.; Stavreva D. A.; Soni V.; Varticovski L.; Raziuddin R.; Hager G. L.; Houck K. A. (2019) Limited Chemical Structural Diversity Found to Modulate Thyroid Hormone Receptor in the Tox21 Chemical Library. Environ. Health Perspect. 127, 097009. 10.1289/EHP5314. [DOI] [PMC free article] [PubMed] [Google Scholar]
- DrugBank Version 5.1.5. https://www.drugbank.ca (accessed 2020-02-14).
- CosIng (Cosmetic Ingredient Database) - Growth - European Commission. http://ec.europa.eu/growth/tools-databases/cosing/index.cfm?fuseaction=search.simple (accessed 2020-02-14).
- Gaulton A.; Bellis L. J.; Bento A. P.; Chambers J.; Davies M.; Hersey A.; Light Y.; McGlinchey S.; Michalovich D.; Al-Lazikani B.; Overington J. P. (2012) ChEMBL: A Large-Scale Bioactivity Database for Drug Discovery. Nucleic Acids Res. 40, D1100–D1107. 10.1093/nar/gkr777. [DOI] [PMC free article] [PubMed] [Google Scholar]
- Berthold M. R., Cebron N., Dill F., Gabriel T. R., Kötter T., Meinl T., Ohl P., Sieb C., Thiel K., and Wiswedel B. (2007) KNIME: The Konstanz Information Miner. In Studies in Classification, Data Analysis, and Knowledge Organization (GfKL 2007), Springer, Berlin. [Google Scholar]
- Standardizer was used for structure canonicalization and transformation.
- Landrum G. (2018) RDKit: Open-Source Cheminformatics Software, version 2018.09.1.
- Pedregosa F.; Varoquaux G.; Gramfort A.; Michel V.; Thirion B.; Grisel O.; Blondel M.; Prettenhofer P.; Weiss R.; Dubourg V.; Vanderplas J.; Passos A.; Cournapeau D.; Brucher M.; Perrot M.; Duchesnay É. (2011) Scikit-learn: Machine Learning in Python. J. Machine Learn. Res. 12, 2825–2830. [Google Scholar]
- Chollet F., and Al E. (2015) Keras (Version 2.2.4.).
- NCI/CADD Chemical Identifier Resolver. https://cactus.nci.nih.gov/chemical/structure (accessed 2019-10-01).
- Chawla N. V.; Bowyer K.; Hall L. O.; Kegelmeyer P. O. (2002) SMOTE: Synthetic Minority Over-Sampling Technique. 16, 321–357. 10.1613/jair.953. [DOI] [Google Scholar]
- Carhart R. E.; Smith D. H.; Venkataraghavan R. (1985) J. Chem. Inf. Model. 25, 64–73. 10.1021/ci00046a002. [DOI] [Google Scholar]
- Laggner C. (2005) SMARTS Patterns for Functional Group Classification, Git Hub repository, Inte:Ligand Software-Entwicklungs und Consulting GmbH, Austria, https://github.com/openbabel/openbabel/blob/master/data/SMARTS_InteLigand.txt (accessed 2020-09-01).
- O’Boyle N. M.; Banck M.; James C. A.; Morley C.; Vandermeersch T.; Hutchison G. R. (2011) Open Babel: An open chemical toolbox. J. Cheminf. 3, 33. 10.1186/1758-2946-3-33. [DOI] [PMC free article] [PubMed] [Google Scholar]
- Friedman K. P., Zhao J., Huang R., Xia M., Crofton K., and Houck K. (2017) Screening the Tox21 10K Library for Thyroid Stimulating Hormone Receptor Agonist and Antagonist Activity. Proceedings from the Society of Toxicology Annual Meeting, March 12–16, 2017, Baltimore, MD, Society of Toxicology, Reston, VA.
- Caruana R. (1997) Multi-task Learning. Mach. Learn. 28, 41–75. 10.1023/A:1007379606734. [DOI] [Google Scholar]
- Li X.; Xu Y.; Lai L.; Pei J. (2018) Prediction of Human Cytochrome P450 Inhibition Using a Multi-task Deep Autoencoder Neural Network. Mol. Pharmaceutics 15, 4336–4345. 10.1021/acs.molpharmaceut.8b00110. [DOI] [PubMed] [Google Scholar]
- Wenzel J.; Matter H.; Schmidt F. (2019) Predictive Multi-task Deep Neural Network Models for ADME-Tox Properties: Learning from Large Data Sets. J. Chem. Inf. Model. 59, 1253–1268. 10.1021/acs.jcim.8b00785. [DOI] [PubMed] [Google Scholar]
Associated Data
This section collects any data citations, data availability statements, or supplementary materials included in this article.