

Abstract
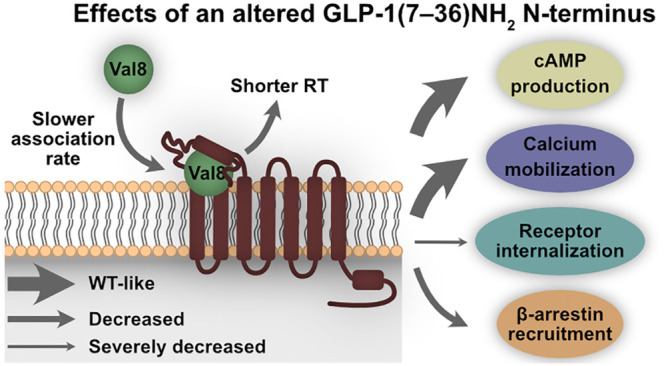
Biased ligands that selectively confer activity in one pathway over another are pharmacologically important because biased signaling may reduce on-target side effects and improve drug efficacy. Here, we describe an N-terminal modification in the incretin hormone glucagon-like peptide (GLP-1) that alters the signaling capabilities of the GLP-1 receptor (GLP-1R) by making it G protein biased over internalization but was originally designed to confer DPP-4 resistance and thereby prolong the half-life of GLP-1. Despite similar binding affinity, cAMP production, and calcium mobilization, substitution of a single amino acid (Ala8 to Val8) in the N-terminus of GLP-1(7–36)NH2 (GLP-1 Val8) severely impaired its ability to internalize GLP-1R compared to endogenous GLP-1. In-depth binding kinetics analyses revealed shorter residence time for GLP-1 Val8 as well as a slower observed association rate. Molecular dynamics (MD) displayed weaker and less interactions of GLP-1 Val8 with GLP-1R, as well as distinct conformational changes in the receptor compared to GLP-1. In vitro validation of the MD, by receptor alanine substitutions, confirmed stronger impairments of GLP-1 Val8-mediated signaling compared to GLP-1. In a perfused rat pancreas, acute stimulation with GLP-1 Val8 resulted in a lower insulin and somatostatin secretion compared to GLP-1. Our study illustrates that profound differences in molecular pharmacological properties, which are essential for the therapeutic targeting of the GLP-1 system, can be induced by subtle changes in the N-terminus of GLP-1. This information could facilitate the development of optimized GLP-1R agonists.
Keywords: functional selectivity, ligand−receptor binding kinetics, glucagon-like peptide-1 receptor, GLP-1(7−36)NH2, GLP-1 Val8
Introduction
G protein-coupled receptors (GPCRs), the largest class of cell surface receptors targeted by marketed drugs, are important mediators of many physiological processes.1 As mediators of the incretin effect (a larger insulin release after oral glucose administration compared to intravenous dosing resulting in similar glucose levels),2 members of the secretin receptor family of GPCRs (class B1), such as the glucagon-like peptide-1 (GLP-1) receptor (GLP-1R) and glucose-dependent insulinotropic polypeptide (GIP) receptor (GIPR), are particularly interesting due to their roles in the hormonal imbalance identified in obesity and type 2 diabetes mellitus (T2DM).3,4 In addition to stimulating insulin secretion from pancreatic β-cells, GLP-1 also suppresses glucagon secretion from pancreatic α-cells, whereas GIP enhances glucagon release.3 Currently, it is debated whether the GLP-1R-mediated insulin secretion is predominantly regulated through G protein activation and cAMP production5 (by Gαs coupling), or whether the recruitment of β-arrestins (as described by Sonoda et al.6), the downstream signaling hereof, and/or receptor trafficking also play a role.7,8 The role of arrestins in internalization of GLP-1R is not as clearly established as for GIPR, where they are essential for internalization.9 In fact, it has been shown that GLP-1R internalizes independently of arrestins,6,10 meaning that arrestin binding for these receptors does not necessary lead to internalization. This suggests a different role of arrestins in downstream signaling and receptor trafficking of GLP-1R compared to GIPR.
Functional selectivity, alternatively framed as biased agonism, is a process in which a ligand selectively confers activity in one pathway over another relative to a reference ligand: for instance, G protein activation over the recruitment of β-arrestin (and their downstream-mediated effects). The therapeutic benefit of developing biased ligands is a potential reduction of side effects by selectively targeting the pathway relevant for the therapeutic outcome. This has been shown for the class A μ-opioid receptor, where G protein-biased agonists showed stronger analgesic effects compared to unselective ligands.11,12 Recently, several GLP-1R agonists have been investigated, and in a few cases, these ligands were biased with preferred activation of G proteins over β-arrestin and/or receptor internalization relative to GLP-1 or exendin-4.7,13−18 Intriguingly, in most cases, these biased ligands had improved insulinotropic effects with better glucose tolerance in vivo,7,13,16,18 highlighting biased agonism may be essential for the therapeutic targeting of the GLP-1 system.
An important strategy to evaluate the efficacy of a ligand is the analysis of ligand–receptor binding kinetics, where the focus lies on measuring the on- (kon), off-rate (koff), and residence time (RT; reciprocal of koff) of a certain ligand. Ligand binding kinetics has facilitated the translation of results from in vitro to in vivo, because these parameters are better predictors for in vivo efficacy and the onset of action than the classical parameters, such as affinity.19 Moreover, ligand binding kinetics differentially affects signaling capabilities and therefore also has implications in functional selectivity.19
At present, the “two-stage binding process” of peptide ligands to class B1 GPCRs is still the overall leading paradigm.20 This model postulates that the peptide’s C-terminal part interacts with the extracellular domain (ECD) of the receptor, which, in turn, allows the N-terminal part of the peptide to dock deep into the transmembrane domain (TMD) of the receptor. As a result of this, several conformational changes occur within the receptor leading to its activation. Given the central role of the N-terminus for receptor activation,21−24 we investigated the impact of a single amino acid substitution in the second amino acid position of the N-terminus (Ala8 to Val8) of GLP-1(7–36)NH2 on ligand binding, receptor signaling, and internalization in vitro. This substitution was originally introduced as a therapeutic lead strategy to render GLP-1 resistant to cleavage by the enzyme DPP-425−28 and thereby to prolong its otherwise very short half-life (2–3 min) resulting from its cleavage into inactive GLP-1(9–36)NH2.29,30 Furthermore, we exploited an in silico model to explore the docking and receptor activation dynamics of GLP-1 versus GLP-1 Val8 in GLP-1R and supported these data with an extensive mutagenesis analysis of both ligand–receptor and intramolecular receptor interactions. As last, we investigated how this N-terminal modification affected the hormone release from the pancreas ex vivo. Our data demonstrate that profound changes in molecular events, following interaction of an N-terminally modified GLP-1 with the receptor, lead to biased agonism and distinct integrated action on hormone release.
Results
An N-Terminal Modification of GLP-1 Alters Its Signaling Profile
Human GLP-1(7–36)NH2 was modified at position eight by a substitution of alanine to valine (GLP-1 Val8), which confers resistance to DPP-4 degradation (Figure 1a).26−28 We used circular dichroism to determine whether GLP-1 Val8 had maintained identical α-helical properties in solution as GLP-1 (Figure S-1). Here, a nearly identical behavior and thus secondary structure was observed for GLP-1 and GLP-1 Val8, which was expected, since the mutation of alanine to valine is a minor and conservative modification.
Figure 1.
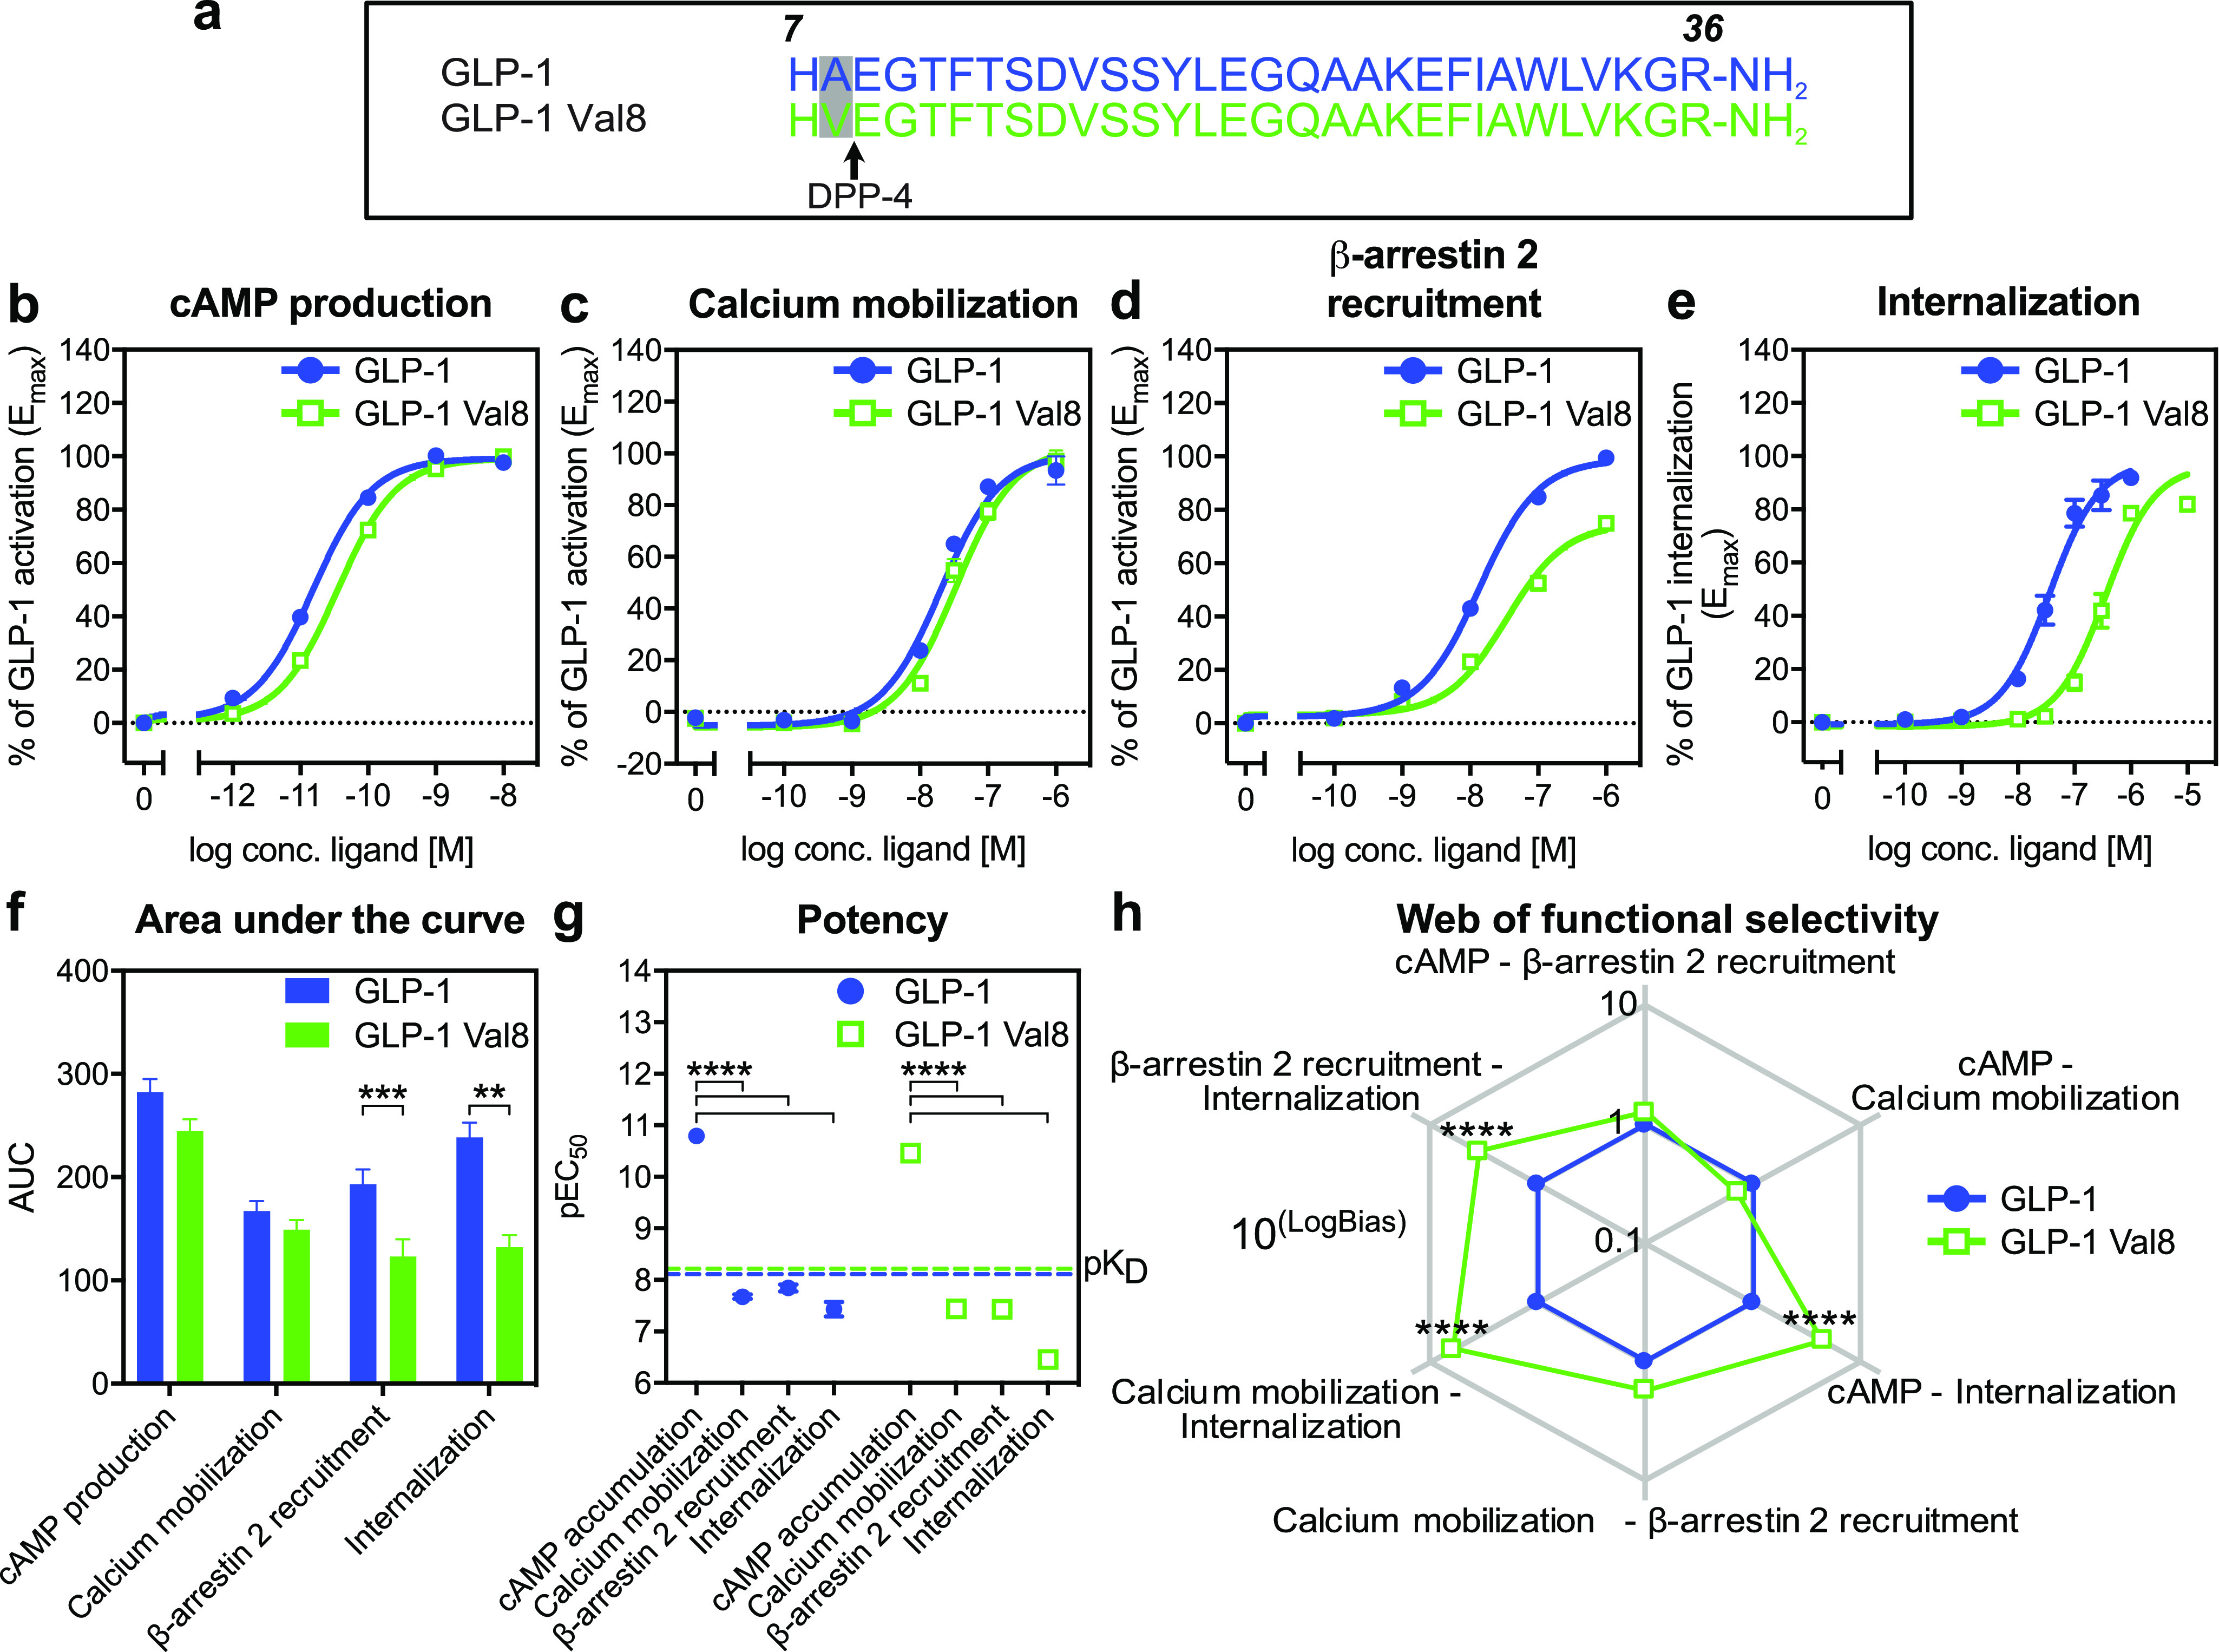
GLP-1 Val8 is a functionally selective ligand for GLP-1R. (a) Sequence comparison of GLP-1 Val8 with GLP-1. (b) BRET cAMP production at 30 min in HEK 293 cells expressing human GLP-1R (n = 18). (c) FRET calcium mobilization at peak response in HEK 293 cells stably expressing human GLP-1R (n = 4). (d) BRET β-arrestin 2 recruitment at 30 min in HEK 293 cells expressing human GLP-1R (n = 18). (e) TR-FRET internalization (n = 6) at 30 min in HEK 293 cells expressing SNAP-tagged human GLP-1R. (f) Area under the curve (AUC) of dose–response data from cAMP production, calcium mobilization, β-arrestin 2 recruitment, and internalization. (g) Differences in potencies between cAMP production, calcium mobilization, β-arrestin 2 recruitment, and receptor internalization for GLP-1 and GLP-1 Val8. (h) Web of functional selectivity (10LogBias) obtained for GLP-1 Val8 (normalized to GLP-1) between cAMP production, calcium mobilization, β-arrestin 2 recruitment, and internalization (errors were propagated during the analysis). Data represent the mean ± s.e.m. of n independent experiments performed in duplicate for cAMP production, calcium mobilization, and β-arrestin 2 recruitment and in duplicate and triplicate for internalization. Statistical significance was assessed using an ordinary ANOVA for pEC50 and a (repeated measures) two-way ANOVA for AUC and the web of functional selectivity (**P < 0.01; ****P < 0.0001; between GLP-1 and GLP-1 Val8 in a functional outcome).
To address the function of GLP-1 Val8 in vitro, we used bioluminescence resonance energy transfer (BRET) in cells expressing human GLP-1R and 1) the CAMYEL sensor, to determine cAMP production (Figure 1b), or 2) the mem-citrine-SH3 and Rluc8-Arrestin3-SP1 sensors, to study β-arrestin 2 membrane recruitment (Figure 1d). Furthermore, we used fluorescence resonance energy transfer (FRET) to determine the calcium mobilization capabilities, which is Gαs and Gαq dependent (Figure 1c).31 For the cAMP production and calcium mobilization, we observed a similar maximal signal (Emax) and potency (pEC50) of GLP-1 Val8 compared to GLP-1 (Figure 1b, 1c and Table 1). The β-arrestin 2 recruitment was, however, impaired for GLP-1 Val8 with an Emax of 75% relative of GLP-1 but with similar potency (Figure 1d and Table 1).
Table 1. GLP-1R Pharmacologya.
| cAMP
production (n = 18) |
calcium
mobilization (n = 4) |
β-arrestin
2 recruitment (n = 18) |
internalization (n = 6) |
|||||
|---|---|---|---|---|---|---|---|---|
| ligand | pEC50 | Emax (%) | pEC50 | Emax (%) | pEC50 | Emax (%) | pEC50 | Emax (%) |
| GLP-1 | 10.8 ± 0.1 | 100 ± 0.0 | 7.7 ± 0.04 | 100 ± 0.0 | 7.8 ± 0.1 | 100 ± 0.0 | 7.4 ± 0.1 | 100 ± 0.0 |
| GLP-1 Val8 | 10.5 ± 0.1 | 100 ± 0.9 | 7.4 ± 0.05 | 103 ± 6.6 | 7.4 ± 0.1 | 75 ± 3.4**** | 6.5 ± 0.1*** | 94 ± 3.5 |
All data were fitted with the three-parameter logistic curve to obtain pEC50 and Emax. pEC50 represents the negative logarithm of agonist concentration in molar that produces half the maximal response. Emax is characterized as the maximal response normalized to the GLP-1 response. Data represent the mean ± s.e.m. of n independent experiments performed in duplicate for cAMP production, β-arrestin 2 recruitment, calcium mobilization, and duplicate and triplicate for internalization. Statistical significance was assessed using an unpaired two-tailed t-test for pEC50 and a two-tailed paired t-test for Emax on non-normalized data (***P < 0.001; ****P < 0.0001; as compared to the GLP-1 response).
Since an increased receptor endocytosis has previously been shown to negatively affect GLP-1 stimulated insulin secretion in vivo,7,14 we focused on receptor internalization using a time-resolved (TR) FRET assay based on incorporating an N-terminal SNAP-tag on GLP-1R with a cell impermeable long lifetime donor fluorophore and an extracellular acceptor fluorophore.32,33 Intriguingly, the GLP-1R internalization capacity was significantly impaired upon GLP-1 Val8 binding with a 9.5-fold lower potency relative to GLP-1 (Figure 1e, Figure S-2, and Table 1).
To further quantify the differences between the two ligands, we compared the area under the curve (AUC) of the dose–response data for the four pathways (Figure 1f). In brief, the AUC consists of the integrated response of the EC50, Emax and hillslope of the sigmoidal curves. Here, we observed that the β-arrestin 2 recruitment capacity was lower after stimulation with GLP-1 Val8, consistent with the lower Emax, and that a larger loss was observed for the receptor internalization capacity by GLP-1 Val8, thereby largely mimicking the changes in potency (Figure 1g). This is in agreement with findings that ligands for class B1 receptors, including GIPR and GLP-1R, possess an inherent higher potency for cAMP over arrestin recruitment and internalization.34−36
To rule out the involvement of system bias (cellular background) and observational bias (assay conditions), we quantified the functional selectivity by fitting the data to the operational model of agonism (Table 2).37 In short, the transduction coefficient (τ/KA) for each ligand at each functional assay (cAMP production, calcium mobilization, β-arrestin 2 recruitment, and internalization) was compared across the three functional outcomes and normalized using GLP-1 Δlog(τ/KA). This value was then compared across the three different assays to obtain a ΔΔlog(τ/KA) (LogBias), and the corresponding bias values (10LogBias) were graphically displayed in a web (Figure 1h and Table 2). Here, a bias value higher than one for GLP-1 Val8 indicates functional selectivity toward a certain pathway relative to GLP-1, whereas a value lower than one specifies less bias for that pathway compared to GLP-1. This method confirmed that GLP-1 Val8 significantly favored cAMP production, calcium mobilization, and the recruitment of β-arrestin 2 over internalization more than GLP-1. On the other hand, GLP-1 Val8 was not biased for cAMP production and calcium mobilization over β-arrestin 2 as well as cAMP production over calcium mobilization. Overall, these findings show that even a small change in the N-terminus of GLP-1 can dramatically affect its pharmacological properties, as seen for GLP-1 Val8 by turning it into a biased agonist with preferred activation of G proteins over receptor internalization.
Table 2. Quantification of Biased Agonism (ΔΔlog(τ/KA)) on GLP-1Ra.
| ligand | cAMP:β-arrestin 2 | cAMP:calcium mobilization | cAMP:internalization | calcium mobilization:β-arrestin 2 | calcium mobilization:internalization | β-arrestin 2:internalization |
|---|---|---|---|---|---|---|
| GLP-1 | 0.00 ± 0.03 | 0.00 ± 0.05 | 0.00 ± 0.05 | 0.00 ± 0.06 | 0.00 ± 0.07 | 0.00 ± 0.05 |
| GLP-1 Val8 | 0.10 ± 0.05 | –0.14 ± 0.05 | 0.65 ± 0.04**** | 0.24 ± 0.07 | 0.79 ± 0.06**** | 0.55 ± 0.06**** |
ΔΔlog(τ/KA) values determined for GLP-1 and GLP-1 Val8 across different functional outcomes. Data represent the mean ± s.e.m. of 18 independent experiments performed in duplicate for cAMP production and β-arrestin 2 recruitment, 4 independent experiments in duplicate for calcium mobilization, and 6 independent experiments performed in duplicate and triplicate for internalization. Statistical significance was assessed using a repeated measures two-way ANOVA (****P < 0.0001; between GLP-1 and GLP-1 Val8).
GLP-1 Val8 Binds Differently to the Human GLP-1R
To investigate how the altered activation profile of GLP-1 Val8 was associated with the binding to GLP-1R, we performed competition binding, association, and dissociation experiments using [125I]GLP-1 Val8 and [125I]GLP-1 as radioligands (Figure 2). First, we determined the binding affinity (KD) during a homologous competition binding experiment where both radiolabeled and unlabeled ligands were the same (Figure 2a and Table 3). Here, we obtained similar KD values for GLP-1 Val8 and GLP-1, emphasizing that the N-terminal modification does not impair the overall binding to human GLP-1R. In accordance with previous data,36 we noticed that the KD for both ligands was much lower (310-fold GLP-1; 177-fold GLP-1 Val8) than the potency observed in cAMP production (Figure 1f, Tables 1 and 3), which suggests the presence of receptor reserve. To determine the probe dependency, we performed heterologous binding, where [125I]GLP-1 competed with GLP-1 Val8 and [125I]GLP-1 Val8 with GLP-1. In contrast to the similar KD values obtained in the homologous binding (Figure 2a), GLP-1, in competition with [125I]GLP-1 Val8, obtained a higher affinity (1.9-fold decreased Ki compared to its KD), whereas a decreased affinity (1.7-fold higher Ki compared to its KD) was observed for GLP-1 Val8 in competition with [125I]GLP-1 (Figure 2b, 2c and Table 3). These results imply that the two ligands do not share the exact same binding mode.
Figure 2.

Kinetic characterization of GLP-1 Val8 shows distinct binding properties. (a) Homologous competition binding with 12.73 ± 3.35 pM [125I]GLP-1 and unlabeled GLP-1 (blue) (n = 4) and 15.56 ± 1.46 pM [125I]GLP-1 Val8 and unlabeled GLP-1 Val8 (n = 3) in COS-7 cells expressing human GLP-1R. (b) Heterologous competition binding with 12.73 ± 3.35 pM [125I]GLP-1 and unlabeled GLP-1 Val8 (green; n = 3) and 15.56 ± 1.46 pM [125I]GLP-1 Val8 with unlabeled GLP-1 (blue; n = 3) in COS-7 cells expressing human GLP-1R. (c) Comparison between homologous and heterologous binding affinity. (d and e) Association (n = 3–4) and (f and g) dissociation (n = 3) of 58.40 ± 3.66 pM [125I]GLP-1 and 200.16 ± 9.86 pM [125I]GLP-1 Val8 on/from human GLP-1R expressing COS-7 membranes at 30 °C. The dissociation was initiated by the addition of 1 μM unlabeled GLP-1 or GLP-1 Val8. (h) Comparison of binding kinetic parameters between GLP-1 and GLP-1 Val8 obtained from association and dissociation assays. (i) Comparison of Bmax between homologous competition binding (4 °C) and ligand–receptor binding kinetics (30 °C). Data represent the mean ± s.e.m. of n independent experiments performed in duplicate (homologous and heterologous binding) or triplicate in the case of association and dissociation. Statistical significance was assessed using an unpaired two-tailed t-test (*P < 0.05; **P < 0.01; ****P < 0.0001; between GLP-1 and GLP-1 Val8).
Table 3. Binding Kinetics of GLP-1 and GLP-1 Val8 at GLP-1Ra.
|
koff (n = 3) |
||||||||
|---|---|---|---|---|---|---|---|---|
| ligand | affinity pKD (n = 3–4) (homologous) | affinity pKi (n = 3) (heterologous) | kobs (n = 3–4) (min–1) | fast (min−1) | % fast phase | slow (min−1) | Bmax (homologous) (n = 3–4) (fmol/10.000 cells) | Bmax (kinetics) (n = 3–4) (CPM/pM) |
| GLP-1 | 8.3 ± 0.1 | 8.6 ± 0.2b | 0.054 ± 0.007 | 0.014 ± 0.001 | 53 ± 3 | 0.0023 ± 0.0003 | 53 ± 20 | 11.3 ± 1.30 |
| GLP-1 Val8 | 8.2 ± 0.1 | 8.0 ± 0.1c* | 0.029 ± 0.005* | 0.052 ± 0.008** | 49 ± 5 | 0.0026 ± 0.0010 | 20 ± 8 | 0.762 ± 0.08**** |
All data were fitted with the three-parameter logistic curve to obtain pIC50 and Bmax. pIC50 represents the negative logarithm of the half maximal inhibitory concentration in molar. The association data were analyzed through a one-phase association model, whereas the dissociation data were best fitted with a two-phase decay model. Bmax values are calculated using the homologous competition binding results with different concentrations of [125I]GLP-1 (Val8). Kinetic Bmax was calculated by taking the saturation point in CPM (plateau) of the association curve and the CPM value at zero minutes from the dissociation curve. Statistical significance was assessed using an unpaired two-tailed t-test (*P < 0.05; **P < 0.01; ****P < 0.0001; as compared to the GLP-1 response).
Radioligand [125I]GLP-1 Val8.
Radioligand [125I]GLP-1. Data represent the mean ± s.e.m. of n independent experiments performed in triplicate or duplicate (homologous and heterologous binding).
The profile of the binding kinetics confirmed this difference. For both radioligands, the association curves (Figure 2d and 2e) were best fitted with a one-phase association model, and equilibrium was approached after approximately 100 (GLP-1) and 120 (GLP-1 Val8) min with significantly slower observed on-rate (kobs) for GLP-1 Val8 compared to GLP-1 (1.9-fold; Figure 2h). The dissociation curves, after addition of excess (1 μM) GLP-1 or GLP-1 Val8 (Figure 2f and 2g), were best fitted with a two-phase decay, with the initial fast dissociation rate (koff (fast)) of GLP-1 Val8 being significantly faster than for GLP-1 (3.7-fold) (Figure 2h), whereas the koff (slow) values were comparable for GLP-1 and GLP-1 Val8. Interestingly, no complete dissociation was observed. Instead, an equilibrium was reached at around 31% for [125I]GLP-1, in agreement with previous studies,38,39 and 43% for [125I]GLP-1 Val8. Finally, a markedly higher maximal binding (Bmax; up to 14.8-fold) was observed for [125I]GLP-1 versus [125I]GLP-1 Val8 in both the competition binding and the kinetic profiling (Figure 2i and Table 3). Taken together, these data suggest that the N-terminal variation in GLP-1 Val8 results in an altered receptor binding compared to GLP-1.
Binding of GLP-1 Val8 Results in Distinct Conformational Changes of GLP-1R
Having established that GLP-1 Val8 had an altered binding and distinct activation profile, we moved on to determine the conformational changes of the receptor upon ligand binding in silico. Here, GLP-1 Val8 and GLP-1 were simulated in complex with GLP-1R using the cryogenic electron microscope (cryo-EM) structure of an active GLP-1R conformation originally elucidated in complex with GLP-1 (Protein Data Bank (PDB) accession number: 5VAI).21 The stability of the simulation was assessed by the development of the RMSD (root-mean-square deviation) over time (Figure S-3a). Both systems reached a stable state after ca. 150 ns, with an RMSD of 3.5 ± 0.05 and 3.7 ± 0.09 Å for GLP-1 and GLP-1 Val8, respectively. The RMSF (root-mean-square fluctuation) of the two systems showed higher flexibility in the loop regions (Figure S-3b). The GLP-1R–GLP-1 Val8 complex displayed a generally higher motility with RMSF differences observed in extracellular loop (ECL) 1, ECL2, intracellular loop (ICL) 3, and ECL3 of GLP-1R (Figure S-3c). Of these regions, ICL3 participates in G protein binding upon activation, which was not simulated in this study.21 Therefore, it could be that the higher motility in this region was an artifact of lacking a G protein. The ECLs, however, are in closer proximity to GLP-1 Val8, and changes in this area are likely resulting from the inserted valine.
A substantial difference between the two simulations was the orientation of the extracellular domain (ECD) and the C-terminal part of the ligands (Figure 3a). While GLP-1 was oriented toward ECL1, GLP-1 Val8 resided in closer proximity to TM1 and was straighter. This is, however, not an uncommon observation; several studies described that class B1 structures contain very dynamic ECDs when bound to their ligand.40−42 The main conformational differences in the transmembrane domain were found in TM2, -5, -6, and -7, which moved 6, 2.5, 2, and 5 Å outward, respectively, in the model with GLP-1 Val8 (Figure 3b and 3c). For TM2 and TM5, these changes took place in the upper half and were most likely induced by the bulkier side chain in valine. Furthermore, ECL1 and ECL3 were more flexible, and the upper part of TM3 was less helical for GLP-1 Val8 binding compared to GLP-1. Overall, the GLP-1 Val8 bound GLP-1R model suggests higher flexible regions and thus less intramolecular interactions, as well as distinct conformational changes compared to GLP-1, with the loop regions (ECL1, -2, -3 and ICL3) and the connecting TM domains of the receptor being most prominent.
Figure 3.

Conformational differences of GLP-1R between GLP-1 and GLP-1 Val8. A summary of the most prominent conformational differences that were observed in the (a) ECD and (b and c) TMD of GLP-1R in complex with GLP-1 and GLP-1 Val8. In b and c, the ECD is removed from the snapshots. A shift of any of the helices is represented by a red arrow, above which the average shifting distance is shown. The change in movement between the ECD, the ligand, and the folding of the top part of TM3 in GLP-1 compared to GLP-1 Val8 is only represented by a red arrow. Alignment was performed at the stable state of the MD (residues 136 to 404).
Different Hydrogen Bonding Pattern in GLP-1R Complexes with GLP-1 or GLP-1 Val8
In order to visualize the differential interaction patterns of the two ligands with the receptor, as a result of the conformational changes observed above, we created heat maps of hydrogen bonds (occupancy ≥20%) between the receptor and either GLP-1 or GLP-1 Val8 (Figure 4a and 4b). Many identical interaction pairs were observed for the two ligands with GLP-1R, including receptor residues S31ECD, E68ECD, R121ECD, E128ECD, E3646.53, and R376ECL3 (Wootten numbering system in superscript43).
Figure 4.

Overview of the most frequent hydrogen bonds between the GLP-1R and its ligand. Heat maps of the direct hydrogen bond interactions between the GLP-1R and (a) GLP-1 or (b) GLP-1 Val8 observed in the molecular dynamics simulations. Only contact having an occupancy of 20% or higher are presented. To give an indication where these residues are located inside GLP-1 (c), GLP-1 Val8 (d), and the receptor-complex (e; GLP-1R–GLP-1 and f; GLP-1R–GLP-1 Val8), we highlighted these residues with a similar color in the structure. In case multiple interactions between receptor and ligand occur, only the highest occupancy is shown as color. The snapshots were taken from the side in the upper part of GLP-1R where the peptide binding pocket is located. (g) Hydrogen bond interactions (in red) between GLP-1R R1902.60 and E9 of GLP-1 (left) and GLP-1R Y2413.44 and H7 of GLP-1 (right). GLP-1R–GLP-1 is in blue; GLP-1R–GLP-1 Val8 is in green.
In the ligand’s N-terminus, however, receptor residue E3646.53 selectively interacted with H7 in GLP-1 Val8 (Figure 4a–f). Moreover, R1902.60 and Y2413.44 selectively interacted with GLP-1. Visual inspection showed that the difference in R1902.60 was caused by the outward movement of TM2, increasing the side chain’s distance to the peptide (Figure 4g left), whereas Y2413.44 resided in almost identical positions in both simulations (Figure 4g right).
In the C-terminal half of the ligands, we observed that hydrogen bonds between W31 in the ligand and the main chain of A209ECL1 and the side chain of Q210ECL1 in GLP-1R were only present with GLP-1; similarly, in the middle of the ligand, hydrogen bonds with the main chain of L32ECD in GLP-1R were only observed with GLP-1 (Figure 4a–f). Only one receptor residue, E1381.33 in TM1, was selectively interacting with Q23 and K26 in GLP-1 Val8. These different interaction networks were a result of the previously mentioned conformational differences in the ECD, combined with the bending of the ligands in different directions, which allowed them to interact with different parts of the receptor (Figure 3a). Altogether, these results suggest that the N-terminal variant of GLP-1, GLP-1 Val8, possesses less and weaker ligand–receptor interactions with GLP-1R than GLP-1.
In Vitro Probing of GLP-1R Residues Confirms Different Ligand Dependency
The molecular dynamics (MD) simulations served as a guiding tool to illustrate whether GLP-1 Val8-mediated signaling is more susceptible for impairment compared to GLP-1, which may be associated with different binding characteristics of GLP-1 Val8 in vitro and weaker and less interactions in silico. We introduced alanine substitutions at 27 receptor sites involved in ligand–receptor interactions and/or intramolecular receptor interactions. Figure S-4 provides an overview of the selected residues. All mutations were probed for cAMP production in response to both ligands (Figure 5a and 5b and Figure S-5).
Figure 5.

In vitro validation of receptor residues suggests preferred Gαs activation of GLP-1R by GLP1. (a) pEC50 of GLP-1 and GLP-1 Val8 on mutated GLP-1R. (b) Emax of GLP-1 and GLP-1 Val8 on mutated GLP-1R. (c) Scatterplot of GLP-1 versus GLP-1 Val8, using the area under the curve (AUC) of the dose–response data on cAMP production. The correlation was obtained by calculating the ratio of AUC between GLP-1 Val8 and GLP-1 in cAMP production (y = 0.90x). Data represent the mean ± s.e.m. of 18 independent experiments performed in duplicate on WT and 3–4 on the mutants. The average data for analysis were taken in the case of R310A5.40.
The majority of mutations displayed similar activity (at 10 nM) as wild-type (WT) GLP-1R for both ligands, albeit with different potencies, which agreed with our predictions from the MD simulations. Mutations revealing a pEC50 below 9.5 were located in TM2 (R1762.46A, N1822.52A, and R1902.60A), TM3 (R2273.30A (only for GLP-1 Val8) and W2433.46A), ECL2 (R299ECL2A), and TM5 (R3105.40A) (Figure 5a). We observed <80% activation for N1822.52A, R1902.60A (for GLP-1 Val8), W2433.46A, R3105.40A, and E3646.53A (Figure 5b). The majority of these residues was important for intramolecular interactions in GLP-1R, whereas some were involved in both types of interactions (ligand-, and/or intramolecular receptor interactions), such as R1902.60, R299ECL2, and R3105.40 (Figure 4a and 4b). Other residues were only important for ligand–receptor interactions, such as E3646.53. The hydrogen bond occupancy for R299ECL2 and R3105.40 between GLP-1 Val8 and GLP-1R was 18% and 14%, respectively, and therefore was not shown in Figure 4b. Strikingly, even though our in silico analysis predicted interaction of GLP-1 (and not GLP-1 Val8) with R1902.60, the impact of Ala-substitution at this position was larger for GLP-1 Val8. For the three mutations H1802.50A, W2744.50A, and Y4027.57A, which were selected based on intramolecular receptor interactions in the MD simulation, no cAMP production was observed. This is in agreement with previous findings that also showed a loss in signaling, which was associated with a loss of membrane expression of these mutations.43
To explain the differential impact of each mutation on GLP-1- and GLP-1 Val8-mediated Gαs activation, a scatterplot was drawn using the AUC of the dose–response data (Figure 5c). Depicted this way, a mutation located under the line (defined by WT GLP-1R) has a higher impact on GLP-1 Val8 compared to GLP-1. Around 33% had a generally greater effect on GLP-1 Val8 (compared to GLP-1) as illustrated by most mutations being located under this line. These substitutions involved both ligand–receptor interactions and intramolecular interactions. Moreover, none of the receptor substitutions preferred activation by GLP-1 Val8 over GLP-1. The rest (67%) was WT-like or impaired similarly for both ligands. These findings confirm that the weaker and less interactions observed in GLP-1R with GLP-1 Val8 in silico may contribute to a greater impact on GLP-1 Val8-mediated signaling than on GLP-1.
Impaired Hormone Release for GLP-1 Val8 Compared to GLP-1
As last, we determined whether the Val8 introduction affected the acute release of insulin, glucagon, and somatostatin, using a rat pancreas perfusion model. First, we examined the cAMP accumulation and β-arrestin 2 recruitment in vitro on cells expressing rat GLP-1R to ensure proper translation from rat to human. Consistent with the data on human GLP-1R, GLP-1 and GLP-1 Val8 acted equipotently and with similar Emax and showed lower Emax in arrestin recruitment on rat GLP-1R (Figure 6a and 6b and Table S-1). We then investigated the hormone release in the rat pancreas perfusion model by adding GLP-1 and GLP-1 Val8 to the arterial perfusate for 5–10 min and observed a significantly lower insulin and somatostatin secretion for 1 nM GLP-1 Val8 compared with 1 nM GLP-1, whereas no significant difference was observed for glucagon release (Figure 6c). Taken together, these data suggest that the N-terminus of GLP-1 is important not only for the activation of different signaling pathways but also for the integrated action on hormone release.
Figure 6.

Lower insulin and somatostatin secretion by GLP-1 Val8 in a perfused rat pancreas. (a) DiscoverX HitHunter based cAMP accumulation (n = 3) in COS-7 cells expressing rat GLP-1R. (b) BRET based β-arrestin 2 recruitment at 30 min in HEK 293 cells expressing rat GLP-1R (n = 3). (c) Rat pancreas perfusion (n = 6) measuring insulin (left), glucagon (middle), and somatostatin (right) secretion after stimulation with 0.1 and 1 nM GLP-1 or GLP-1 Val8. Ten mM arginine was used as a positive control. Data represent the mean ± s.e.m. of n independent experiments performed in duplicate for cAMP accumulation or six male Wistar rats in the case of the perfused rat pancreas. Statistical significance was assessed using a paired t-test (*P < 0.05; ***P < 0.001; between GLP-1 and GLP-1 Val8 stimulated perfusion of the pancreas).
Discussion
With 1.6 million deaths a year, diabetes is the seventh most common cause of death worldwide.44 Insufficient insulin secretion together with insulin resistance and hyperglucagonemia lead to hyperglycemia; the hallmark in the pathogenesis of T2DM. As an insulinotropic and glucagonostatic hormone, GLP-1 has shown its therapeutic potential for the treatment of T2DM.3,4 Moreover, it has been ascribed cardiovascular- and neuroprotection, satiety, and appetite control,45−49 adding up to its huge therapeutic potential in the treatment of T2DM and lately also obesity.3,4 Hence, several GLP-1 analogs have reached the marked,50 and recent studies have pointed toward biased signaling, with preferred G protein activation over arrestin recruitment and/or internalization, as playing a role for superior therapeutic outcome.7,14,15 Here, we show that a single amino acid substitution in position 8 (Ala to Val) in GLP-1(7–36)NH2 led to a significantly lower receptor internalization, impaired Emax in β-arrestin 2 recruitment, but similar cAMP production and calcium mobilization, hence, making GLP-1 Val8 a G protein biased agonist for GLP-1R. The binding kinetic profile was substantially altered with a slower on-rate and a faster off-rate, leading to decreased RT and a very low Bmax, despite similar affinity (KD) for GLP-1 Val8 compared to GLP-1.
In the closely related “sister incretin” GIP, a naturally occurring variant of the GIP receptor, E3546.53Q, was recently described to be associated with a longer RT of the endogenous agonist GIP(1–42) and a faster internalization rate relative to WT GIPR despite unaltered affinity for GIP(1–42).35 Mimicking the GIPR E3546.53Q phenotype, a similar phenomenon was induced by a ligand (FTY720-P) for the sphingosine-1-phosphate receptor 1, where a slow off-rate and more efficacious arrestin recruitment resulted in a prolonged receptor internalization.51 These findings suggest that internalization is positively correlated with RT, which is consistent with our data on GLP-1 Val8 and data on several exendin-4 variants.7
The two-stage binding process implies that the interaction between the exterior part of the transmembrane helices of GLP-1R and GLP-1’s N-terminus is crucial for receptor activation,20,21 a finding which has facilitated the design of several functionally selective ligands.7,14,52 The time scale for a ligand to activate a GPCR is in the order of seconds to minutes. This is much slower than the time scale that can be explored with MD simulations (a factor 106 to 108), meaning that MD unfortunately cannot provide the exact and detailed structural differences upon ligand binding and subsequent activation. It is, however, possible to discuss the metastable states that were found in our study. Our MD simulations provided a set of structural differences between GLP-1 and GLP-1 Val8 bound GLP-1R, which reside in the ECD, the loop regions, TM2, -5, -6, and -7. Consistent with this, TM6 is often pointed out as central for receptor activation in class B1, and the altered position of this TM may contribute to the preferred G protein signaling of GLP-1 Val8 over internalization.18,21,40,53
Currently, many GLP-1R structures of partially or fully active states have been published,18,21,53−56 whereas only two elucidate inactive state(s).42,57 Four of the active GLP-1R structures include biased agonists; the small molecules TTOAD2 (modified variant of TTP-273, a small molecule agonist for GLP-1R, evaluated in humans58), LY3502970, and CHU-128 and the peptide ExP5.18,53,55,56 A previous comparison of biased and unbiased ligand-bound GLP-1R structures highlighted major differences in TM1, TM7, and ECL3.18 An overlay of the four structures with biased agonists (TTOAD2, LY3502970, CHU-128, and ExP5) with our MD simulated GLP-1R–GLP-1 pointed toward similar differences, where TM1, TM7, and ECL3 also turned out to be more flexible (Figure 7). This is also in agreement with the differences seen between GLP-1 and GLP-1 Val8 bound GLP-1R. Since ExP5, TTOAD2, LY3502970, CHU-128, and GLP-1 Val8 are all biased agonists with a relatively similar activation profile (maintained cAMP but impaired arrestin recruitment and/or receptor internalization), these findings may point toward a contribution of these receptor regions to functional selectivity. However, further research is warranted to confirm these findings.
Figure 7.

Comparison of GLP-1 (Val8)–GLP-1R with (non)peptide agonist-bound GLP-1R structures. (a) Overlay of structures of agonist-bound GLP-1R: (blue) GLP-1 MD simulation; (green) GLP-1 Val8 MD simulation; (red) ExP5 peptide cryo-EM structure; (yellow) small molecule TT-OAD2 cryo-EM structure. (b) Alignment of (blue) GLP-1 MD simulation; (green) GLP-1 Val8 MD simulation; (gray) small molecule LY3502970 cryo-EM structure; (pink) small molecule CHU-128 cryo-EM structure. These GLP-1R overlays reveal a highly movable TM1 and TM7, as well as a more flexible ECL3. Movements are shown with arrows relative to GLP-1. The alignment of the structures was performed on the intracellular part of the receptor (residues 156:165 + 177:187 + 242:253 + 263:274 + 321:330 + 348:358 + 390:401) at the stable state of the MD simulation. The ECD was removed when the snapshots were taken.
The MD simulations also suggest weaker hydrogen bond interactions, both in terms of ligand–receptor and intramolecular receptor interactions for GLP-1 Val8 in complex with GLP-1R. Our in vitro binding support this by means of 1) slower on-rate and faster off-rate for GLP-1 Val8, 2) overall lower Bmax for GLP-1 Val8, and 3) weaker competition of GLP-1 Val8 with [125I]GLP-1, despite similar KD values for the two ligands. The weaker competition of GLP-1 Val8 with [125I]GLP-1 suggests that GLP-1 Val8 and GLP-1 do not share the exact same binding mode, which probably arises from different conformations of the receptor, i.e., distinct G protein- and/or transducer-bound and -unbound states. This may also explain why we observe less and weaker interactions with GLP-1R in the MD simulations and several distinct conformational changes in the receptor in silico. Hence, this overall altered binding of GLP-1 Val8 may lead to an altered receptor internalization but maintained G protein activation of GLP-1R.
Previously, GLP-1R has been extensively studied via receptor mutagenesis, both in terms of ligand binding and receptor activation.36,59 In the present study, we used the MD simulations, in combination with receptor mutagenesis, as advisory tools to demonstrate if GLP-1R activation by GLP-1 Val8 is more susceptible for impairment than with GLP-1. Several residues were identified with importance for both ligands; however, in most cases, the impact was stronger for GLP-1 Val8 (33% of total). This was the case, for instance, for R121ECDA, R1902.60A, R2273.30A, R299ECL2A, and R3105.40A, i.e., mutations in residues that either interacted directly with GLP-1 Val8 and/or were involved in intramolecular hydrogen bonds. Overall, the stronger impairment of GLP-1 Val8-mediated activation of GLP-1R may indeed suggest that this derives from altered binding kinetics of GLP-1 Val8 in vitro, weaker and less interactions with GLP-1R in silico, as well as distinct conformational changes of GLP-1R when bound to GLP-1 Val8.
The GLP-1-mediated insulin release from pancreatic β-cells is regulated by G protein-mediated signaling through Gαs.60 Adding to this, Sonoda et al.6 underlined the importance of β-arrestin for the production of cAMP involved in the insulin secretion through GLP-1 and also showed that β-arrestin does not seem to be involved in receptor endocytosis, a finding which was also made by Syme et al.10 In pancreatic α-cells, the suppression of glucagon secretion by GLP-1 has been reported to be mediated through Gαs,60 whereas the mechanism involved in the GLP-1-mediated secretion of somatostatin from pancreatic δ-cells is currently not known. The complex regulatory role of GLP-1 on the endocrine pancreas opens the possibility to target GLP-1R by a more delicate pharmacological approach, where functional selectivity could enhance certain actions and suppress others by affecting, for instance, receptor internalization.
Compared to GLP-1, we observed a decreased insulinotropic effect of GLP-1 Val8 during acute administrations in the perfused pancreas model. Recently, a similar G protein-biased GLP-1R agonist (ExP5) was presented, based on several N-terminal modifications of exendin-4, and like GLP-1 Val8, it displayed a weaker insulinotropic effect after acute administration.13 However, chronic treatment of ExP5 improved glycemic control and hepatic steatosis in diabetic mice. In line with these findings, chronic treatment with GLP-1 Val8 had previously shown to improve glucose tolerance relative to GLP-1.26−28 Similarly, Jones et al.7 reported that the chronic administration of a compound with a single N-terminal modification in the first position of exendin-4 (His1 to Phe), which displayed reduced β-arrestin recruitment, lower receptor internalization, shorter RT, and slower on-rate (like GLP-1 Val8 in the present study), resulted in a stronger insulinotropic effect compared to exendin-4. Additionally, the activity of the GLP-1R- and GIPR-targeting dual-agonist Tirzepatide, which is biased similarly as GLP-1 Val8 on GLP-1R (maintained cAMP formation, decreased arrestin recruitment, and markedly impaired internalization) but has similar GIPR activation as GIP(1–42), resulted in long-term superior blood glucose control.15 Overall, these results suggest that chronic and persistent treatment with a ligand that is functionally selective for Gαs over receptor internalization leads to improved insulinotropic effects, presumably through a lower desensitization of the system, whereas acute administration of the same ligand (like in our pancreas perfusion model with brief stimulations lasting maximally 10 min) does not reveal such difference.
In conclusion, our characterization of the G protein tailored agonist GLP-1 Val8 provides insight in how subtle changes in the N-terminus of GLP-1 can have a dramatic effect on molecular events leading to altered signaling balance and thereby ultimately affecting integrated biological actions in the sense of hormone release of the GLP-1 system. This knowledge may help to improve the rational design of novel therapeutics targeting GLP-1R, where GLP-1 Val8 could be used as a tool to study the effects, not only in T2DM and obesity but also in other diseases where the GLP-1 system is involved, such as Parkinson’s or Alzheimer’s disease. For these diseases, it may be that the therapeutic effect is achieved through a molecular pharmacological approach that may differ from that employed to address diabetes and obesity.
Methods
Materials
pcDNA3.1+ plasmids encoding the human wild-type or mutated GLP-1R were obtained from GenScript (Piscataway, NJ). Human GLP-1R with an N-terminal SNAP-tag was encoded in pcDNA3.1+ plasmids, as previously described.32 Rat GLP-1R, was encoded in pcDNA3.1 plasmids. l-Arginine monohydrochloride (10 mmol/L) (Sigma-Aldrich, St. Louis, MO) was dissolved in perfusion buffer and used as a positive control after each experiment. Ligands, such as GLP-1 and GLP-1 Val8, were purchased from Caslo ApS (Lyngby, Denmark). Polyethylenimine (PEI) was purchased from Polysciences, Inc. (Warrington, PA). HEK293 and COS-7 cells were bought from ATTC (Manassas, VA), whereas HEK 293A cells were purchased from Thermo Fisher Scientific (Boston, MA). Cell medium was bought from Thermo Fisher Scientific. Other chemicals were purchased from standard commercial sources.
Cell Culture, Transfection, and Generation of Stable Cell Line
HEK 293 cells were grown in Dulbecco’s Modified Eagle Medium (DMEM), containing 1% GlutaMAX, supplemented with 10% fetal bovine serum (FBS) and 1% penicillin (180 U/mL)/streptomycin (45 μg/mL), and incubated at 37 °C, 10% CO2, and 95% air humidity. The cells were subcultured twice a week in 175 cm2 flasks, in which they were released with 1% Trypsin. Cell viability was checked microscopically, and their density was measured using the NucleoCounter SCC-100 from Chemometec (Lillerød, Denmark). HEK 293 cells (500,000–750,000 cells/well) were seeded in tissue culture-treated 6-well plates before a PEI transfection was performed. For the cAMP assays, cells were transfected with 0.2 μg of human (mutated or wild-type) GLP-1R and 1 μg of CAMYEL (YFP-Epac-RLuc).61 For the β-arrestin 2 recruitment assays, HEK 293 cells were transfected with 0.33 μg of human or rat wild-type GLP-1R, 0.042 μg of Rluc8-Arrestin3-SP1, and 0.8 μg of mem-citrine-SH3.62 DNA constructs were mixed with 1:1.5 or 1:2 DNA:PEI and nonsupplemented DMEM and then incubated at room temperature for 15 min before the sample was added dropwise to the cells. The transfection was terminated by replacing the cell transfection-medium with fresh supplemented DMEM medium after approximately 24 h.
COS-7 cells were cultured in DMEM 1885 medium, containing 3.9 g/L NaHCO3, supplemented with 10% FBS, 1% l-glutamine, and 1% penicillin (180 U/mL)/streptomycin (45 μg/mL), and stored at 37 °C, 10% CO2, and 95% air humidity. COS-7 cells (6× 10⁶ cells/flask) were seeded in 175 cm2 flasks before a calcium phosphate transfection was performed. Forty micrograms of human or rat GLP-1R (or pcDNA3.1) in 480 μL of Tris-EDTA (TE) buffer (10 mM Tris-HCl, 2 mM EDTA-Na2, pH 7.5) was mixed with 60 μL of CaCl2 and then titrated into 480 μL of 2x HEPES buffered saline (HBS) buffer (280 mM NaCl, 50 mM HEPES, 1.5 mM Na2HPO4, pH 7.2), to perform a transiently transfection of COS-7 cells. The mixture was incubated for 45 min at room temperature, before it was added dropwise to the cells together with 2 mg/mL chloroquine. After 5 h, the transfection was stopped by replacing the transfection medium with fresh DMEM 1885 medium.
HEK 293A cells (Thermo Fisher Scientific), used for the real-time internalization assay, were cultured in DMEM with 4.5 g/L d-glucose, GlutaMAX, and sodium pyruvate supplemented with 10% FBS (Thermo Fisher Scientific) and 100 U/mL penicillin/streptomycin (Thermo Fisher Scientific) in a humid atmosphere at 37 °C and 5% CO2. Cells (9 × 10⁶ cells/dish) were transfected in 10 cm dishes (60 cm2) with 7.2 μg of pcDNA3.1, 2.4 μg of human SNAP-tagged GLP-1R plasmid, and 24 μL of Lipofectamine 2000 (Thermo Fisher Scientific) according to the reverse transfection protocol from the manufacturer. Twenty-four hours after transfection, cells were harvested and seeded on poly-d-lysine (Sigma-Aldrich) coated white Falcon 384-well plates (Corning Inc., Corning, NY) at a density of 2 × 10⁴ cells/well and cultured overnight.
HEK 293 cells stably expressing human GLP-1R were generated by transfecting the cells with 20 μg of the corresponding constructs through a calcium phosphate transfection in 75 cm2 flasks. Subsequently, G418 selection medium (0.4 mg/mL) was added to perform cell selection, after which monoclonals were picked. The expression/activity of the receptor in the monoclonals was assessed in a cAMP accumulation assay. The HEK 293 cells stably expressing the GLP-1R were maintained in DMEM, containing 1% GlutaMAX, supplemented with 10% FBS, 1% penicillin (180 U/mL)/streptomycin (45 μg/mL), and 0.4 mg/mL G418, and incubated at 37 °C, 10% CO2, and 95% air humidity.
Radioligands
[125I]GLP-1 was a gift from Novo Nordisk (Bagsværd, Denmark). The [125I]GLP-1 Val8 radioligand was produced in-house by oxidative iodination, which incorporates 125I at the meta-position of tyrosine residue side chains. GLP-1 Val8 was dissolved in 300 mM phosphate buffer (pH 7.4), and 0.4 mCi 125I was added to 1 nmol of peptide. Phosphate buffer (6 × 5 μL) supplemented with Chloramine-T was added each minute while stirring, and the reaction was terminated by the addition of 400 μL of H2O with 0.1% trifluoroacetic acid (TFA). Product purification was done by a reverse-phase HPLC, using a C18 column and a gradient from H2O to acetonitrile, both containing 0.1% TFA. The fractions were collected in a total of 1 mL/aliquot. The radioligand was identified by determining the γ radiation intensity and during a competitive binding assay using a Wallac 1470 Wizard Automatic Gamma Counter (PerkinElmer, Waltham, MA).
Membrane Preparation of COS-7 Cells
Membranes were prepared from COS-7 cells transiently transfected with human GLP-1 receptor constructs or pcDNA3.1 (control), as previously described.35 The cells were harvested using ice-cold PBS and a cell scraper and subsequently homogenized using a Dounce. The homogenate was centrifuged for 3 min at 500 rpm (54g) at 4 °C. The supernatant was then centrifuged at 14,000 rpm (21,036g) for 45 min at 4 °C. Membrane pellets were resuspended in 2 mM HEPES buffer (pH 7.2) supplemented with 2 mM MgCl2 and a complete protease inhibitor mixture (Roche Applied Science), before they were stored at −80 °C. Protein concentration was performed according to a standard Pierce BCA protein assay protocol (Thermo Fisher Scientific).
Homologous and Heterologous Competition Binding Experiments
COS-7 cells transiently transfected with the human GLP-1 receptor or pcDNA3.1 were aliquoted in a 96 white CulturPlate (35,000 cells/well, PerkinElmer). The cells were then washed with binding buffer (50 mM HEPES buffer (pH 7.2), 1 mM CaCl2, 5 mM MgCl2, 0.5% (w/v) bovine serum albumin (BSA)) and incubated for 15 min at 5 °C. After ligand addition (concentration ranging from 0.1 nM to 1 μM), 12.73 ± 3.35 pM [125I]GLP-1 or 15.56 ± 1.46 pM [125I]GLP-1 Val8 was added, and the plate was incubated for 3 h at 4 °C. The reaction was terminated by washing two times with ice-cold binding buffer. The cells were subsequently lysed with 200 mM NaOH containing 1% SDS. The γ radiation intensity was measured with a Wallac 1470 Wizard Automatic Gamma Counter.
Radioligand Association and Dissociation Experiments
For association assays, a mixture of 5 μg of human GLP-1 wild-type receptor or pcDNA3.1 (control) membranes and 0.2 μg of wheatgerm agglutinin coated (WGA) PVT SPA bead was precoupled on a shaker in a volume of 50 μL of binding buffer for 30 min at 30 °C. Subsequently, the membrane-bead mixture was distributed over a white CulturPlate-96 (PerkinElmer) in a total volume of 90 μL of binding buffer and spun down (1,500 rpm; 485g, 5 min, room temperature). Then, 10 μL of 58.40 ± 3.66 pM [125I]GLP-1 or 200.16 ± 9.86 pM [125I]GLP-1 Val8 was added, and the amount of radioligand bound to receptor was measured every minute during a total incubation of 240 min. The measurements took place at 30 °C and were taken with a TopCount NXT Microplate Scintillation & Luminescence Counter (Packard).
For dissociation assays, the membrane-bead mixture was distributed in a total of volume of 85 μL of binding buffer. The mixture was then preincubated for 120 or 240 min at 30 °C, for [125I]GLP-1 and [125I]GLP-1 Val8, respectively. The dissociation of [125I]GLP-1 or [125I]GLP-1 Val8 was initiated by the addition of 5 μL of 1 μM unlabeled GLP-1 or GLP-1 Val8. The amount of radioligand bound to receptor was measured every minute and taken up to 999 min.
DiscoverX HitHunter cAMP Assay
The assay was carried out according to the manufacturer’s protocol (DiscoverX, Fremont, CA). Transiently transfected COS-7 cells were seeded into a 96 white CulturPlate (35,000 cells/well, PerkinElmer) and washed with 1xHBS. Subsequently, the cells were incubated in 100 μL of 1 mM 3-isobutyl-1-methylxanthine (IBMX) diluted in 2xHBS for 30 min at 37 °C. To test the agonistic properties of ligands (concentrations ranging from 1 pM to 1 μM), 5 μL of ligand was incubated for 30 min at 37 °C. After the incubation, the assay medium was removed, and the cells were washed with 30 μL of PBS and treated with 40 μL of ED/Lysis/CL and 10 μL of cAMP antibodies for 60 min, before they were treated with 40 μL of EA solution. After a 3-h incubation in the dark, the accumulation of cAMP was measured as luminescence using the PerkinElmer EnVision 2104 Multilabel Microplate Reader.
Bioluminescence Resonance Energy Transfer cAMP (CAMYEL) and β-Arrestin 2 (Rluc8-Arrestin3-SP1)
One day after cell transfection, HEK293 cells were resuspended in PBS with 1% glucose (5 mM), before they were aliquoted into a white CulturPlate-96 (85 μL, PerkinElmer). Subsequently, Coelenterazine h (Nanolight Technologies, Pinetop, AZ) was added in a final concentration of 5 μM, and the reaction was started after the addition of ligands, in which their concentrations ranged from 1 pM to 1 μM. Following a 30-min incubation at room temperature, the luminescence (Rluc 485/40 nm and YFP 530/25 nm) was measured by a LB 940 Mithras Multimode Microplate Reader (Berthold Technologies GmbH & CO. KG, Bad Wildbad, Germany).
Real-Time Internalization Assay
Real-time internalization was performed as previously described.32,63 Briefly, SNAP-tagged receptors were labeled with 100 nM Tag-lite SNAP-Lumi4-Tb (donor, Cisbio Bioassays, Codolet, France) for 60 min at 37 °C in assay buffer (HBSS (Thermo Fisher Scientific) supplemented with 1 mM CaCl2, 1 mM MgCl2, 0.1% BSA, and 20 mM HEPES pH 7.4). Subsequently, cells were washed four times with assay buffer, and a final concentration of 50 μM fluorescein-O′-acetic acid (acceptor, Sigma-Aldrich) was added. Agonists diluted in assay buffer with a final concentration of 0.1% Pluronic F-68 were added with a VIAFLO 384-channel pipet (Integra Biosciences, Zizers, Switzerland). Donor and acceptor emission were measured every 6 min for 66 min with an EnVision 2104 Multilabel Reader (PerkinElmer) at 37 °C using a 340/60 nm excitation filter and 520/8 nm (acceptor) and 615/8.5 nm (donor) emission filters. The area under donor/acceptor ratio curves as a function of time was used for concentration–response curves of receptor internalization. All buffers and solutions were preheated to 37 °C.
Calcium Mobilization
WT HEK 293 and HEK 293 cells stably expressing human GLP-1R were seeded at a concentration of 40.000 cells per well in poly-d-lysine coated 96-well plates (black, clear bottom, Costar#3603). Medium was removed the next day, and the cells were incubated in 50 μL of loading buffer (HBSS with 1 mM CaCl2, 1 M MgCl2, 1.25 mM probenecid, and 0.2% Fluo-4, pH 7.4 (Invitrogen, Carlsbad, CA)) for 1 h at 37 °C in the dark. The loading buffer was removed, the cells were washed twice in 75 μL of wash buffer (HBSS with 1 mM CaCl2, 1 M MgCl2, and probenecid, pH 7.4), and finally 100 μL of wash buffer was added to each well before the plates were placed in a FlexStation 3 Multi-Mode Microplate Reader (Molecular Devices, San Jose, CA) for automated pipetting and measurements. Ligands were prepared in a 96 clear, round-bottomed compound plate at a 5× concentration in wash buffer. Upon addition to the cell plate, the final concentration reached 1×. Ca2+ mobilization elicited by the ligands at various concentrations was recorded as fluorescence at excitation and emission wavelengths of 485 and 520 nm, respectively.
Animals
Handling of the donor animals was performed in accordance with international accepted guidelines and with permission from the Danish Animal Experiments Inspectorate (license no. 2018-15-0201-01397). Male Wistar rats (Janvier, Saint Berthevin Cedex, France) (250–300 g) were used as donors. They were housed 2–3 a cage and followed a 12:12-h light-dark cycle with free access to standard chow and water. Nonfasted rats were used for experiments after at least 1 week of acclimatization and were anaesthetized with a subcutaneous injection of hypnorm/midazolam (0.0158 mg of fentanyl citrate + 0.5 mg of fluanisone + 0.25 mg of midazolam/100 g) before surgery.
Isolation of the Pancreas
After induction of surgical anesthesia, a midline incision exposing the abdominal cavity was made. The pancreatic vascular supply was isolated from the remaining circulation as described in more detail elsewhere.64,65 In brief, the arterial supply to the colon, small intestine, spleen, stomach, and kidneys was ligated thus preventing perfusion of these organs. A catheter was inserted into the abdominal aorta thereby allowing perfusion of the pancreas through the superior mesenteric artery and the celiac artery. For collection of venous effluent, a draining catheter was inserted into vena portae. Finally, the animal was euthanized by cutting the diaphragm, while the pancreas was kept artificially alive.
Perfusion Protocol
After the operation, the pancreas was perfused in situ using equipment dedicated for rodent organ perfusion (Hugo Sachs Elektronik, March-Hugstetten, Germany). Experiments started after a 30-min equilibrium period to ensure that hormone secretion had stabilized and that any impact from anesthesia had vanished. The perfusion buffer consisted of a modified Krebs-Ringer bicarbonate buffer, containing in addition 5% dextran T-70 (Pharmacosmos, Denmark), 0.1% BSA, (Merck), 7 mM glucose, and 5 mM pyruvate, fumarate, and glutamate. Perfusion buffer was heated to 37 °C and continuously gassed throughout the experiment with 95% O2 and 5% CO2 to achieve pH 7.4 and a high oxygen partial pressure. Perfusion buffer was infused at a constant flow rate of 4 mL/min, while test substances were infused via a side arm syringe infusion pump at a flow rate of 0.2 mL/min. Effluent samples were collected by a fraction collector at 1-min intervals, stored on ice within a few minutes, and subsequently kept at −20 °C until analysis. Effluent output and perfusion pressure were monitored throughout the experiments and used as an indication of the organ’s wellbeing.
Sample Analysis
Effluent perfusion samples were analyzed for insulin, glucagon, and somatostatin by in-house radioimmunoassay’s. Insulin concentrations were determined using an antiserum (codename 2006) which strongly cross-reacts with human, rat, and mouse insulin.66 Glucagon was measured using a C-terminally directed antiserum (codename 4305), which measures fully processed glucagon.67 Finally, somatostatin was measured using a rabbit antiserum (codename 1758) raised against synthetic cyclic somatostatin, recognizing both somatostatin-14 and somatostatin-28.68
Circular Dichroism
The studied peptides were dissolved in a 10 mM NaPi buffer at pH 7.5, and their concentrations were determined by measuring their absorbance at 280 nm using a UV–vis spectrophotometer, being 32 μM and 33 μM, for GLP-1 and GLP-1 Val8, respectively. A Jasco J-1500 Circular Dichroism Spectrophotometer was employed to measure the circular dichroism (CD). The CD was measured using a 0.1-cm quartz cuvette over a range of 190 to 250 nm with a scanning speed of 50 nm/min, a data pitch of 0.1 nm, a bandwidth of 1 nm, and D.I.T. of 4 s. All measurements were averaged over 3 accumulations and baseline corrected. The measurement was repeated over a temperature range of 5 to 80 °C, with intervals of 5 °C, a heating of 5 °C/min, and a halt time of 60 s per temperature increment.
Molecular Dynamics Simulations
For the MD simulations, the cryo-EM structure of human GLP-1 bound to Oryctolagus Cuniculus (i.e., European rabbit) GLP-1R (PDB: 5VAI) was used.21 Schrödinger’s Maestro was used to add missing amino acid residues and subsequently humanize (homology = 96%) the receptor.69 In the case of the simulation with GLP-1 Val8, the eighth amino acid residue of GLP-1 (Ala8) was mutated into a valine. Since the N-terminal and C-terminal in the cryo-EM structures were shorter than in the sequenced protein, termini were respectively acetylated and amidated. All disulfide bridges from the cryo-EM structure were maintained, i.e., between residues 46–71, 62–104, 85–126, and 226–296.21 Alignment of the homology model with the membrane was determined using the Orientations of Proteins in Membranes (OPM) database (PDB: 5VAI),70 after which the receptor was inserted in a hexagonal lipid bilayer using the CHARMM-GUI Membrane builder, consisting of 150 1-palmitoyl-2-oleoyl-sn-glycero-3-phosphocholine (POPC) lipids.70−72 The receptor and membrane were dissolved in water with physiological salt concentration (0.15 M), resulting in a system size of ca. 80k atoms with a lipid plane radius of 8.5 nm and a height of 13 nm. Gromacs 2018.3 was employed as an MD engine.73,74 CHARMM36m was employed as a force field with a van der Waals cutoff radius of 1.2 nm and TIP3P as a water model.75,76 Relaxation of the system was done following a 6-stage equilibration procedure (Table S-2), by slowly reducing restraints on the receptor and lipids. The production runs were performed at 310 K for 750 ns, of which the first 150 ns were considered as part of the equilibration and therefore omitted from analysis. During both the equilibration as well as the production run, periodic boundary conditions were employed in all directions. A Verlet leapfrog integrator with a time step of 2 fs was used to solve Newtonian laws of motion, and nonbonded interactions were treated with a Verlet list cutoff scheme.77 The short-range electrostatic interactions were calculated using a nonbonded pair list which is updated every 0.01 ps, and Particle Mesh Ewald (PME) was used to handle the long-range electrostatic interactions with a grid spacing of 0.12 nm. Long-range dispersion corrections were applied to the system for both energy and pressure. The receptor, the lipid bilayer, and solvent plus ions were separately coupled to temperature baths at 310 K using a Nosé–Hoover thermostat with a 1-ps time constant for coupling.78,79 A Parrinello–Rahman pressure coupling was used at 1 bar with a relaxation time of 5 ps and isothermal compressibility of 4.5 × 10⁻⁵ bar. All bond lengths to hydrogen atoms were constrained using the LINCS algorithm. Snapshots of the full system were saved every 10 ps. Alignment and analysis were performed using VMD,128 Gromacs tools and home-written scripts. To consider possible flexibility of the ECD, the MD structures were aligned based on the position of the backbone atoms of the TMD, i.e., residues 136 to 404. All plots and images were rendered using GNUplot,80 Python’s Matplotlib,81 and PyMOL.82−84
Data Analysis
The nonlinear regression curve fitting program Graphpad 8.0 was used to analyze the data and to obtain the following parameters: IC50, EC50, Emax, koff, kobs, and Bmax (Graphpad software, San Diego, CA). All sigmoidal curves were fitted with a Hill slope of either 1 for activation curves or −1 for inhibition curves. For the dissociation experiments, Y0 was set to be less than the plateau of the association experiments. In the case of GLP-1 Val8, we constrained one of the three dissociation experiments to the plateau of the association due to ambiguous curve fitting. Bmax (the total density of receptors in the sample) was calculated from homologous competitive binding curves85 according to eq 1
| 1 |
in which B0 is the total specific binding, and [L] is the ligand concentration.
The equilibrium dissociation constant (KD) was also calculated from the homologous competitive binding curves85 according to eq 2:
| 2 |
The inhibition constant (Ki) was obtained from the heterologous competitive binding curves by using the Cheng-Prusoff equation86 (3):
| 3 |
The BRET signal was obtained by calculating BRET ratios using eq 4:
| 4 |
To quantify biased agonism, dose–response data was fitted to eq 5 of the operational model of agonism37
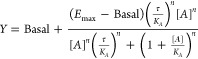 |
5 |
in which Basal is the basal level response without agonist, Emax is the maximal response of the system (in this case derived from the full agonist GLP-1), τ is an index of signaling efficacy of the agonist and can be calculated by RT/KE, KA is the equilibrium dissociation constant of the agonist A, [A] is the molar concentration of the agonist, and n represents the slope of the transducer function linking occupancy to response. RT can be described as the total number of receptors in the system, and KE is the coupling efficiency of each agonist-occupied receptor. The model assumes that Emax and n are shared between agonists. To obtain the parameters KA and τ for each pathway, the data was fitted, and subsequently biased agonism was quantified. To summarize, for each ligand the efficacy in each signaling pathway (cAMP, β-arrestin 2 recruitment, and internalization) was extracted as log(τ/KA). Then this value was subtracted by the log(τ/KA) of GLP-1 resulting in the Δlog(τ/KA) for that ligand. Next the differential efficacy of a ligand compared to GLP-1 in two signaling pathways (cAMP vs β-arrestin 2 recruitment, cAMP vs internalization, β-arrestin 2 recruitment vs internalization) was calculated, and consequently the bias factor or LogBias (ΔΔlog(τ/KA)) was obtained. During the analysis, the errors were propagated.
The extinction coefficient of the peptides was calculated according to eq 6
| 6 |
where nX represents the number of tryptophans (W), tyrosines (Y), and cysteines (C) in the peptide.
Measured ellipticity θobs(λ) was converted to mean residue molar ellipticity ([θ]mr) using the relation in eq 7:
| 7 |
Here θobs(λ) is the
observed ellipticity in millidegrees as a function of the wavelength
λ, npb is the number of amide bonds
(no. amino acids −1),  is the path
length in cm, and c is the peptide concentration
in [M]. [θ]mr has
historically been in units of deg·cm2·dmol–1.
is the path
length in cm, and c is the peptide concentration
in [M]. [θ]mr has
historically been in units of deg·cm2·dmol–1.
To estimate the probability (P(r)) of a chain containing r helical residues, eq 8 was used:87
| 8 |
In this formula, [θ]∞ is the value of a parameter corresponding to an infinite helix, which is set to 40,000 deg·cm2·dmol–1, and the empirical constant for the 222 nm nπ* band (k) is set to 4.6, based on the article by Manning and Woody.88
The root-mean-square deviation (RMSD) is the average distance between a set of superimposed atoms relative to a reference structure, which–unless specified otherwise–is the starting structure of the simulation. The RMSD is calculated using eq 9
| 9 |
where M is the sum of all masses (∑i=1nmi), mi is the mass of atom i, and ri(t) – ri| is the distance between an atom and its reference (ref) equivalent. Due to high flexibility of the ECD and Helix 8, the RMSD is calculated for the backbone heavy atoms C, N, O, and Cα of the TMD, i.e., residues 138 to 405.
The root-mean-square fluctuation (RMSF) represents the fluctuation of a residue around its average position in a stable system and is formulated as in eq 10:
| 10 |
Here the distance is defined between the position of residue i (ri) at time t to its time-averaged equivalent, i.e., rref = ⟨ri⟩. Mi and mi are again the sum of all masses (∑i=1nmi) and the mass of residue I, respectively.
Hydrogen bonds are defined as contacts between a hydrogen bond donor and a hydrogen bond acceptor whose distance r ≤ 0.35 nm and whose angle is made by the donor-hydrogen bond with respect to the vector connecting the donor and acceptor α ≤ 30. The occupancy of a hydrogen bond is defined as the percentage of simulation time the hydrogen bond is observed, for which a cutoff of 20% is handled.
Statistical Analysis
For in vitro experiments, statistical significance was addressed by (un)paired two-tailed t-tests, ordinary ANOVA, and (repeated measures) two-way ANOVA. We used paired two-tailed t-tests for the pancreas perfusion models. The definition of statistical significance was P < 0.05.
Acknowledgments
We thank Maibritt S. Baggesen, Adrian Dragan, and Søren Petersen for their technical assistance. We further thank Stefanie Karlshøj for the assistance with the membrane preparation and Ole H. Olsen for discussing and interpretating the computational data. As last, we would like to thank Signe Mathiasen for critically reading and discussing the manuscript. T.C.M. acknowledges funding from the Novo Nordisk Foundation (NNF17OC0027004).
Supporting Information Available
The Supporting Information is available free of charge at https://pubs.acs.org/doi/10.1021/acsptsci.0c00193.
Table of additional pharmacology with pEC50 and Emax values in cAMP accumulation and β-arrestin 2 recruitment (in vitro), table of relaxation of in silico model, circular dichroism of GLP-1 and GLP-1 Val8, internalization kinetics of GLP-1 and GLP-1 Val8, stability and mobility of ligand–receptor complexes in silico, serpentine model of GLP-1R, with substituted residues highlighted, and dose–response curves of mutated GLP-1R with GLP-1 and GLP-1 Val8 in cAMP production (PDF)
Author Contributions
W.J.C.v.d.V. performed the majority of experiments, analyzed, and interpreted the data, made the figures, and wrote the manuscript. F.X.S. performed the modeling and circular dichroism and analyzed and interpreted the computational data. C.B.C. handled the animal studies, isolated the pancreas, and performed the perfusion, including sample analysis and data interpretation. T.C.M. performed the real time internalization and analyzed the data. G.M.H. performed the intracellular calcium mobilization and analyzed the data. O.L. iodinated GLP-1 Val8. S.P.S. performed the DiscoverX HitHunter assays and analyzed the data. H.B.-O. supervised the internalization experiments. B.H. and J.J.H. supervised the animal studies. T.M.F. supervised the computational part. M.M.R. provided overall project supervision, interpreted data, and wrote the manuscript. All authors have given feedback and approval to the final version of the manuscript.
The authors declare no competing financial interest.
Supplementary Material
References
- Hauser A. S.; Attwood M. M.; Rask-Andersen M.; Schiöth H. B.; Gloriam D. E. (2017) Trends in GPCR Drug Discovery: New Agents, Targets and Indications. Nat. Rev. Drug Discovery 16 (12), 829–842. 10.1038/nrd.2017.178. [DOI] [PMC free article] [PubMed] [Google Scholar]
- Holst J. J.; Ørskov C. (2004) The Incretin Approach for Diabetes Treatment: Modulation of Islet Hormone Release by GLP-1 Agonism. Diabetes 53 (SUPPL. 3), S197–S204. 10.2337/diabetes.53.suppl_3.S197. [DOI] [PubMed] [Google Scholar]
- Baggio L. L.; Drucker D. J. (2007) Biology of Incretins: GLP-1 and GIP. Gastroenterology 132 (6), 2131–2157. 10.1053/j.gastro.2007.03.054. [DOI] [PubMed] [Google Scholar]
- Riddy D. M.; Delerive P.; Summers R. J.; Sexton P. M.; Langmead C. J. (2018) G Protein–Coupled Receptors Targeting Insulin Resistance, Obesity, and Type 2 Diabetes Mellitus. Pharmacol. Rev. 70 (1), 39–67. 10.1124/pr.117.014373. [DOI] [PubMed] [Google Scholar]
- Harmar A. J. (2001) Family-B G-Protein-Coupled Receptors. Genome Biol. 2 (12), reviews3013.1. 10.1186/gb-2001-2-12-reviews3013. [DOI] [PMC free article] [PubMed] [Google Scholar]
- Sonoda N.; Imamura T.; Yoshizaki T.; Babendure J. L.; Lu J.-C.; Olefsky J. M. (2008) β-Arrestin-1 Mediates Glucagon-like Peptide-1 Signaling to Insulin Secretion in Cultured Pancreatic Cells. Proc. Natl. Acad. Sci. U. S. A. 105 (18), 6614–6619. 10.1073/pnas.0710402105. [DOI] [PMC free article] [PubMed] [Google Scholar]
- Jones B.; Buenaventura T.; Kanda N.; Chabosseau P.; Owen B. M.; Scott R.; Goldin R.; Angkathunyakul N.; Corrêa I. R. Jr; Bosco D.; et al. (2018) Targeting GLP-1 Receptor Trafficking to Improve Agonist Efficacy. Nat. Commun. 9 (1), 1602. 10.1038/s41467-018-03941-2. [DOI] [PMC free article] [PubMed] [Google Scholar]
- Graaf C. d.; Donnelly D.; Wootten D.; Lau J.; Sexton P. M.; Miller L. J.; Ahn J.-M.; Liao J.; Fletcher M. M.; Yang D.; et al. (2016) Glucagon-Like Peptide-1 and Its Class B G Protein-Coupled Receptors: A Long March to Therapeutic Successes. Pharmacol. Rev. 68 (4), 954–1013. 10.1124/pr.115.011395. [DOI] [PMC free article] [PubMed] [Google Scholar]
- Gabe M. B. N.; Sparre-Ulrich A. H.; Pedersen M. F.; Gasbjerg L. S.; Inoue A.; Bräuner-Osborne H.; Hartmann B.; Rosenkilde M. M. (2018) Human GIP(3–30)NH2inhibits G Protein-Dependent as Well as G Protein-Independent Signaling and Is Selective for the GIP Receptor with High-Affinity Binding to Primate but Not Rodent GIP Receptors. Biochem. Pharmacol. 150, 97–107. 10.1016/j.bcp.2018.01.040. [DOI] [PubMed] [Google Scholar]
- Syme C. A.; Zhang L.; Bisello A. (2006) Caveolin-1 Regulates Cellular Trafficking and Function of the Glucagon-Like Peptide 1 Receptor. Mol. Endocrinol. 20 (12), 3400–3411. 10.1210/me.2006-0178. [DOI] [PubMed] [Google Scholar]
- Soergel D. G.; Subach R. A.; Burnham N.; Lark M. W.; James I. E.; Sadler B. M.; Skobieranda F.; Violin J. D.; Webster L. R. (2014) Biased Agonism of the L-Opioid Receptor by TRV130 Increases Analgesia and Reduces on-Target Adverse Effects versus Morphine: A Randomized, Double-Blind, Placebo-Controlled, Crossover Study in Healthy Volunteers. Pain 155 (9), 1829–1835. 10.1016/j.pain.2014.06.011. [DOI] [PubMed] [Google Scholar]
- Manglik A.; Lin H.; Aryal D. K.; McCorvy J. D.; Dengler D.; Corder G.; Levit A.; Kling R. C.; Bernat V.; Hübner H.; et al. (2016) Structure-Based Discovery of Opioid Analgesics with Reduced Side Effects. Nature 537, 185–190. 10.1038/nature19112. [DOI] [PMC free article] [PubMed] [Google Scholar]
- Zhang H.; Sturchler E.; Zhu J.; Nieto A.; Cistrone P. A.; Xie J.; He L.; Yea K.; Jones T.; Turn R.; et al. (2015) Autocrine Selection of a GLP-1R G-Protein Biased Agonist with Potent Antidiabetic Effects. Nat. Commun. 6 (May), 1–13. 10.1038/ncomms9918. [DOI] [PMC free article] [PubMed] [Google Scholar]
- Fang Z.; Chen S.; Pickford P.; Broichhagen J.; Hodson D. J.; Corrêa I. R.; Kumar S.; Görlitz F.; Dunsby C.; French P. M. W. (2020) The Influence of Peptide Context on Signaling and Trafficking of Glucagon-like Peptide-1 Receptor Biased Agonists. ACS Pharmacol. Transl. Sci. 3, 345–360. 10.1021/acsptsci.0c00022. [DOI] [PMC free article] [PubMed] [Google Scholar]
- Willard F. S.; Douros J. D.; Gabe M. B.; Showalter A. D.; Wainscott D. B.; Suter T. M.; Capozzi M. E.; van der Velden W. J. C.; Stutsman C.; Cardona G. R. (2020) Tirzepatide Is an Imbalanced and Biased Dual GIP and GLP-1 Receptor Agonist. JCI Insight 5 (17), e140532. 10.1172/jci.insight.140532. [DOI] [PMC free article] [PubMed] [Google Scholar]
- Lucey M.; Pickford P.; Bitsi S.; Minnion J.; Ungewiss J.; Schoeneberg K.; Rutter G. A.; Bloom S. R.; Tomas A.; Jones B. (2020) Disconnect between Signalling Potency and in Vivo Efficacy of Pharmacokinetically Optimised Biased Glucagon-like Peptide-1 Receptor Agonists. Mol. Metab. 37 (April), 100991. 10.1016/j.molmet.2020.100991. [DOI] [PMC free article] [PubMed] [Google Scholar]
- Jones B.; McGlone E. R.; Fang Z.; Pickford P.; Corrêa I. R.; Oishi A.; Jockers R.; Inoue A.; Kumar S.; Görlitz F.; et al. (2020) Genetic and Biased Agonist-Mediated Reductions in β-Arrestin Recruitment Prolong CAMP Signalling at Glucagon Family Receptors. J. Biol. Chem. 10.1074/jbc.RA120.016334. [DOI] [PMC free article] [PubMed] [Google Scholar]
- Zhao P.; Liang Y.; Belousoff M. J.; Deganutti G.; Fletcher M. M.; Willard F. S.; Bell M. G.; Christe M. E.; Sloop K. W.; Inoue A. (2020) Activation of the GLP-1 Receptor by a Non-Peptidic Agonist. Nature 577 (January), 432. 10.1038/s41586-019-1902-z. [DOI] [PubMed] [Google Scholar]
- van der Velden W. J. C.; Heitman L. H.; Rosenkilde M. M. (2020) Perspective: Implications of Ligand–Receptor Binding Kinetics for Therapeutic Targeting of G Protein-Coupled Receptors. ACS Pharmacol. Transl. Sci. 3 (2), 179–189. 10.1021/acsptsci.0c00012. [DOI] [PMC free article] [PubMed] [Google Scholar]
- Schwartz T. W.; Frimurer T. M. (2017) Structural Biology: Full Monty of Family B GPCRs. Nat. Chem. Biol. 13 (8), 819–821. 10.1038/nchembio.2438. [DOI] [PubMed] [Google Scholar]
- Zhang Y.; Sun B.; Feng D.; Hu H.; Chu M.; Qu Q.; Tarrasch J. T.; Li S.; Sun Kobilka T.; Kobilka B. K.; et al. (2017) Cryo-EM Structure of the Activated GLP-1 Receptor in Complex with a G Protein. Nature 546 (7657), 248–253. 10.1038/nature22394. [DOI] [PMC free article] [PubMed] [Google Scholar]
- Wootten D.; Reynolds C. A.; Smith K. J.; Mobarec J. C.; Furness S. G. B.; Miller L. J.; Christopoulos A.; Sexton P. M. (2016) Key Interactions by Conserved Polar Amino Acids Located at the Transmembrane Helical Boundaries in Class B GPCRs Modulate Activation, Effector Specificity and Biased Signalling in the Glucagon-like Peptide-1 Receptor. Biochem. Pharmacol. 118, 68–87. 10.1016/j.bcp.2016.08.015. [DOI] [PMC free article] [PubMed] [Google Scholar]
- Wootten D.; Reynolds C. A.; Smith K. J.; Mobarec J. C.; Koole C.; Savage E. E.; Pabreja K.; Simms J.; Sridhar R.; Furness S. G. B.; et al. (2016) The Extracellular Surface of the GLP-1 Receptor Is a Molecular Trigger for Biased Agonism. Cell 165 (7), 1632–1643. 10.1016/j.cell.2016.05.023. [DOI] [PMC free article] [PubMed] [Google Scholar]
- Gabe M. B. N.; van der Velden W. J. C.; Smit F. X.; Gasbjerg L. S.; Rosenkilde M. M. (2020) Molecular Interactions of Full-Length and Truncated GIP Peptides with the GIP Receptor – A Comprehensive Review. Peptides 125 (October), 170224. 10.1016/j.peptides.2019.170224. [DOI] [PubMed] [Google Scholar]
- Deacon C. F. (2004) Circulation and Degradation of GIP and GLP-1. Horm. Metab. Res. 36 (11–12), 761–765. 10.1055/s-2004-826160. [DOI] [PubMed] [Google Scholar]
- Green B.; Gault V.; Mooney M.; Irwin N.; Bailey C.; Harriott P.; Greer B.; Flatt P.; O’Harte F. (2003) Novel Dipeptidyl Peptidase IV Resistant Analogues of Glucagon-like Peptide-1(7–36)Amide Have Preserved Biological Activities in Vitro Conferring Improved Glucose-Lowering Action in Vivo. J. Mol. Endocrinol. 31 (3), 529–540. 10.1677/jme.0.0310529. [DOI] [PubMed] [Google Scholar]
- Green B. D.; Gault V. A.; Mooney M. H.; Irwin N.; Harriott P.; Greer B.; Bailey C. J.; O’Harte F. P. M.; Flatt P. R. (2004) Degradation, Receptor Binding, Insulin Secreting and Antihyperglycaemic Actions of Palmitate-Derivatised Native and Ala8-Substituted GLP-1 Analogues. Biol. Chem. 385 (2), 169–177. 10.1515/BC.2004.035. [DOI] [PubMed] [Google Scholar]
- Green B. D. (2006) Novel Glucagon-Like Peptide-1 (GLP-1) Analog (Val8)GLP-1 Results in Significant Improvements of Glucose Tolerance and Pancreatic Beta-Cell Function after 3-Week Daily Administration in Obese Diabetic (Ob/Ob) Mice. J. Pharmacol. Exp. Ther. 318 (2), 914–921. 10.1124/jpet.105.097824. [DOI] [PubMed] [Google Scholar]
- Seino Y.; Fukushima M.; Yabe D. (2010) GIP and GLP-1, the Two Incretin Hormones: Similarities and Differences. J. Diabetes Investig. 1 (1–2), 8–23. 10.1111/j.2040-1124.2010.00022.x. [DOI] [PMC free article] [PubMed] [Google Scholar]
- Nissen A.; Marstrand S.; Skov-Jeppesen K.; Bremholm L.; Hornum M.; Andersen U. B.; Holst J. J.; Rosenkilde M. M.; Hartmann B. (2019) A Pilot Study Showing Acute Inhibitory Effect of GLP-1 on the Bone Resorption Marker CTX in Humans. JBMR Plus 3, 1–6. 10.1002/jbm4.10209. [DOI] [PMC free article] [PubMed] [Google Scholar]
- Wheeler M. B.; Lu M.; Dillon J. S.; Leng X. H.; Chen C.; Boyd A. E. (1993) Functional Expression of the Rat Glucagon-like Peptide-I Receptor, Evidence for Coupling to Both Adenylyl Cyclase and Phospholipase-C. Endocrinology 133 (1), 57–62. 10.1210/endo.133.1.8391428. [DOI] [PubMed] [Google Scholar]
- Roed S. N.; Wismann P.; Underwood C. R.; Kulahin N.; Iversen H.; Cappelen K. A.; Schäffer L.; Lehtonen J.; Hecksher-Soerensen J.; Secher A.; et al. (2014) Real-Time Trafficking and Signaling of the Glucagon-like Peptide-1 Receptor. Mol. Cell. Endocrinol. 382 (2), 938–949. 10.1016/j.mce.2013.11.010. [DOI] [PubMed] [Google Scholar]
- Crivat G.; Taraska J. W. (2012) Imaging Proteins inside Cells with Fluorescent Tags. Trends Biotechnol. 30 (1), 8–16. 10.1016/j.tibtech.2011.08.002. [DOI] [PMC free article] [PubMed] [Google Scholar]
- Sparre-Ulrich A. H.; Gabe M. N.; Gasbjerg L. S.; Christiansen C. B.; Svendsen B.; Hartmann B.; Holst J. J.; Rosenkilde M. M. (2017) GIP(3–30)NH2 Is a Potent Competitive Antagonist of the GIP Receptor and Effectively Inhibits GIP-Mediated Insulin, Glucagon, and Somatostatin Release. Biochem. Pharmacol. 131, 78–88. 10.1016/j.bcp.2017.02.012. [DOI] [PubMed] [Google Scholar]
- Gabe M. B. N.; van der Velden W. J. C.; Gadgaard S.; Smit F. X.; Hartmann B.; Bräuner-Osborne H.; Rosenkilde M. M. (2020) Enhanced Agonist Residence Time, Internalization Rate and Signalling of the GIP Receptor Variant [E354Q] Facilitate Receptor Desensitization and Long-term Impairment of the GIP System. Basic Clin. Pharmacol. Toxicol. 126 (S6), 122–132. 10.1111/bcpt.13289. [DOI] [PMC free article] [PubMed] [Google Scholar]
- Lei S.; Clydesdale L.; Dai A.; Cai X.; Feng Y.; Yang D.; Liang Y.-L.; Koole C.; Zhao P.; Coudrat T.; et al. (2018) Two Distinct Domains of the Glucagon-like Peptide-1 Receptor Control Peptide-Mediated Biased Agonism. J. Biol. Chem. 293 (3), 9370–9387. 10.1074/jbc.RA118.003278. [DOI] [PMC free article] [PubMed] [Google Scholar]
- Kenakin T.; Watson C.; Muniz-Medina V.; Christopoulos A.; Novick S. (2012) A Simple Method for Quantifying Functional Selectivity and Agonist Bias. ACS Chem. Neurosci. 3 (3), 193–203. 10.1021/cn200111m. [DOI] [PMC free article] [PubMed] [Google Scholar]
- Beak A.; Small J.; Ilovaiskaia I.; Hurley D.; Bloom R.; Smith M. (1996) Glucagon-like Peptide-1 (GLP-1) Releases Thyrotropin (TSH): Characterization of Binding Sites for GLP-1 on Alpha-TSH Cells. Endocrinology 137 (10), 4130–4138. 10.1210/endo.137.10.8828468. [DOI] [PubMed] [Google Scholar]
- Roed S. N.; Orgaard A.; Jorgensen R.; De Meyts P. (2012) Receptor Oligomerization in Family B1 of G-Protein-Coupled Receptors: Focus on BRET Investigations and the Link between GPCR Oligomerization and Binding Cooperativity. Front. Endocrinol. (Lausanne). 3 (MAY), 62. 10.3389/fendo.2012.00062. [DOI] [PMC free article] [PubMed] [Google Scholar]
- Liang Y. L.; Khoshouei M.; Radjainia M.; Zhang Y.; Glukhova A.; Tarrasch J.; Thal D. M.; Furness S. G. B.; Christopoulos G.; Coudrat T.; et al. (2017) Phase-Plate Cryo-EM Structure of a Class B GPCR-G-Protein Complex. Nature 546 (7656), 118–123. 10.1038/nature22327. [DOI] [PMC free article] [PubMed] [Google Scholar]
- Zhao L.-H.; Ma S.; Sutkeviciute I.; Shen D.-D.; Zhou X. E.; de Waal P. W.; Li C.-Y.; Kang Y.; Clark L. J.; Jean-Alphonse F. G.; et al. (2019) Structure and Dynamics of the Active Human Parathyroid Hormone Receptor-1. Science (Washington, DC, U. S.) 364 (6436), 148–153. 10.1126/science.aav7942. [DOI] [PMC free article] [PubMed] [Google Scholar]
- Wu F.; Yang L.; Hang K.; Laursen M.; Wu L.; Han G. W.; Ren Q.; Roed N. K.; Lin G.; Hanson M. A.; et al. (2020) Full-Length Human GLP-1 Receptor Structure without Orthosteric Ligands. Nat. Commun. 11, 1–10. 10.1038/s41467-020-14934-5. [DOI] [PMC free article] [PubMed] [Google Scholar]
- Wootten D.; Simms J.; Miller L. J.; Christopoulos A.; Sexton P. M. (2013) Polar Transmembrane Interactions Drive Formation of Ligand-Specific and Signal Pathway-Biased Family B G Protein-Coupled Receptor Conformations. Proc. Natl. Acad. Sci. U. S. A. 110 (13), 5211–5216. 10.1073/pnas.1221585110. [DOI] [PMC free article] [PubMed] [Google Scholar]
- WHO Disease burden and mortality estimates. https://www.who.int/healthinfo/global_burden_disease/estimates/en/ (accessed 2020-08-18).
- Batista A. F.; Bodart-Santos V.; De Felice F. G.; Ferreira S. T. (2019) Neuroprotective Actions of Glucagon-Like Peptide-1 (GLP-1) Analogues in Alzheimer’s and Parkinson’s Diseases. CNS Drugs 33 (3), 209–223. 10.1007/s40263-018-0593-6. [DOI] [PubMed] [Google Scholar]
- Tong J.; D’Alessio D. (2014) Give the Receptor a Brake: Slowing Gastric Emptying by GLP-1. Diabetes 63 (2), 407–409. 10.2337/db13-1764. [DOI] [PubMed] [Google Scholar]
- Dailey M. J.; Moran T. H. (2013) Glucagon-like Peptide 1 and Appetite. Trends Endocrinol. Metab. 24 (2), 85–91. 10.1016/j.tem.2012.11.008. [DOI] [PMC free article] [PubMed] [Google Scholar]
- del Olmo-Garcia M. I.; Merino-Torres J. F. (2018) GLP-1 Receptor Agonists and Cardiovascular Disease in Patients with Type 2 Diabetes. J. Diabetes Res. 2018, 1–12. 10.1155/2018/4020492. [DOI] [PMC free article] [PubMed] [Google Scholar]
- Müller T. D.; Finan B.; Bloom S. R.; D’Alessio D.; Drucker D. J.; Flatt P. R.; Fritsche A.; Gribble F.; Grill H. J.; Habener J. F.; et al. (2019) Glucagon-like Peptide 1 (GLP-1). Mol. Metab. 30 (September), 72–130. 10.1016/j.molmet.2019.09.010. [DOI] [PMC free article] [PubMed] [Google Scholar]
- Lee S.; Lee D. Y. (2017) Glucagon-like Peptide-1 and Glucagon-like Peptide-1 Receptor Agonists in the Treatment of Type 2 Diabetes. Ann. Pediatr. Endocrinol. Metab. 22 (1), 15–26. 10.6065/apem.2017.22.1.15. [DOI] [PMC free article] [PubMed] [Google Scholar]
- Sykes D. A.; Riddy D. M.; Stamp C.; Bradley M. E.; McGuiness N.; Sattikar A.; Guerini D.; Rodrigues I.; Glaenzel A.; Dowling M. R.; et al. (2014) Investigating the Molecular Mechanisms through Which FTY720-P Causes Persistent S1P1 Receptor Internalization. Br. J. Pharmacol. 171 (21), 4797–4807. 10.1111/bph.12620. [DOI] [PMC free article] [PubMed] [Google Scholar]
- Hager M. V.; Clydesdale L.; Gellman S. H.; Sexton P. M.; Wootten D. (2017) Characterization of Signal Bias at the GLP-1 Receptor Induced by Backbone Modification of GLP-1. Biochem. Pharmacol. 136, 99–108. 10.1016/j.bcp.2017.03.018. [DOI] [PMC free article] [PubMed] [Google Scholar]
- Liang Y. L.; Khoshouei M.; Glukhova A.; Furness S. G. B.; Zhao P.; Clydesdale L.; Koole C.; Truong T. T.; Thal D. M.; Lei S.; et al. (2018) Phase-Plate Cryo-EM Structure of a Biased Agonistbound Human GLP-1 Receptor-Gs Complex. Nature 555 (7694), 121–125. 10.1038/nature25773. [DOI] [PubMed] [Google Scholar]
- Jazayeri A.; Rappas M.; Brown A. J. H.; Kean J.; Errey J. C.; Robertson N. J.; Fiez-Vandal C.; Andrews S. P.; Congreve M.; Bortolato A.; et al. (2017) Crystal Structure of the GLP-1 Receptor Bound to a Peptide Agonist. Nature 546 (7657), 254–258. 10.1038/nature22800. [DOI] [PubMed] [Google Scholar]
- Zhang X.; Belousoff M. J.; Zhao P.; Kooistra A. J.; Truong T. T.; Ang S. Y.; Underwood C. R.; Egebjerg T.; Šenel P.; Stewart G. D.; et al. (2020) Differential GLP-1R Binding and Activation by Peptide and Non-Peptide Agonists. Mol. Cell 80 (3), 485–500.e7. 10.1016/j.molcel.2020.09.020. [DOI] [PubMed] [Google Scholar]
- Kawai T.; Sun B.; Yoshino H.; Feng D.; Suzuki Y.; Fukazawa M.; Nagao S.; Wainscott D. B.; Showalter A. D.; Droz B. A.; et al. (2020) Structural Basis for GLP-1 Receptor Activation by LY3502970, an Orally Active Nonpeptide Agonist. Proc. Natl. Acad. Sci. U. S. A. 117 (47), 29959–29967. 10.1073/pnas.2014879117. [DOI] [PMC free article] [PubMed] [Google Scholar]
- Song G.; Yang D.; Wang Y.; de Graaf C.; Zhou Q.; Jiang S.; Liu K.; Cai X.; Dai A.; Lin G.; et al. (2017) Human GLP-1 Receptor Transmembrane Domain Structure in Complex with Allosteric Modulators. Nature 546 (7657), 312–315. 10.1038/nature22378. [DOI] [PubMed] [Google Scholar]
- Valcarce C.; Dunn I.; Freeman J. L. R. (2019) 1015-P: Effects of the Oral, Small Molecule GLP-1R Agonist TTP273 on Patients with Stage 2 Hypertension: Results from a Post Hoc Analysis of the Phase 2 Logra Study. Diabetes 68 (Supplement 1), 1015-P. 10.2337/db19-1015-P. [DOI] [Google Scholar]
- Yang D.; de Graaf C.; Yang L.; Song G.; Dai A.; Cai X.; Feng Y.; Reedtz-Runge S.; Hanson M. A.; Yang H.; et al. (2016) Structural Determinants of Binding the Seven-Transmembrane Domain of the Glucagon-like Peptide-1 Receptor (GLP-1R). J. Biol. Chem. 291 (25), 12991–13004. 10.1074/jbc.M116.721977. [DOI] [PMC free article] [PubMed] [Google Scholar]
- Rowlands J.; Heng J.; Newsholme P.; Carlessi R. (2018) Pleiotropic Effects of GLP-1 and Analogs on Cell Signaling, Metabolism, and Function. Front. Endocrinol. (Lausanne, Switz.) 9 (November), 1–23. 10.3389/fendo.2018.00672. [DOI] [PMC free article] [PubMed] [Google Scholar]
- Jiang L. I.; Collins J.; Davis R.; Lin K. M.; DeCamp D.; Roach T.; Hsueh R.; Rebres R. A.; Ross E. M.; Taussig R.; et al. (2007) Use of a CAMP BRET Sensor to Characterize a Novel Regulation of CAMP by the Sphingosine 1-Phosphate/G13 Pathway. J. Biol. Chem. 282 (14), 10576–10584. 10.1074/jbc.M609695200. [DOI] [PMC free article] [PubMed] [Google Scholar]
- Donthamsetti P.; Quejada J. R.; Javitch J. A.; Gurevich V. V.; Lambert N. A. (2015) Using Bioluminescence Resonance Energy Transfer (BRET) to Characterize Agonist-Induced Arrestin Recruitment to Modified and Unmodified G Protein-Coupled Receptors. Curr. Protoc. Pharmacol. 70 (1), 2.14.1–2.14.14. 10.1002/0471141755.ph0214s70. [DOI] [PMC free article] [PubMed] [Google Scholar]
- Foster S. R.; Bräuner-Osborne H. (2017) Investigating Internalization and Intracellular Trafficking of GPCRs: New Techniques and Real-Time Experimental Approaches. Handb. Exp. Pharmacol. 245, 41–61. 10.1007/164_2017_57. [DOI] [PubMed] [Google Scholar]
- Christiansen C. B.; Svendsen B.; Holst J. J. (2015) The VGF-Derived Neuropeptide TLQP-21 Shows No Impact on Hormone Secretion in the Isolated Perfused Rat Pancreas. Horm. Metab. Res. 47 (7), 537–543. 10.1055/s-0034-1395615. [DOI] [PubMed] [Google Scholar]
- De Heer J.; Holst J. J. (2007) Sulfonylurea Compounds Uncouple the Glucose Dependence of the Insulinotropic Effect of Glucagon-like Peptide 1. Diabetes 56 (2), 438–443. 10.2337/db06-0738. [DOI] [PubMed] [Google Scholar]
- Brand C. L.; Jørgensen P. N.; Knigge U.; Warberg J.; Svendsen I.; Kristensen J. S.; Holst J. J. (1995) Role of Glucagon in Maintenance of Euglycemia in Fed and Fasted Rats. Am. J. Physiol. 269 (3), E469–E477. 10.1152/ajpendo.1995.269.3.E469. [DOI] [PubMed] [Google Scholar]
- Orskov C.; Jeppesen J.; Madsbad S.; Holst J. J. (1991) Proglucagon Products in Plasma of Noninsulin-Dependent Diabetics and Nondiabetic Controls in the Fasting State and after Oral Glucose and Intravenous Arginine. J. Clin. Invest. 87 (2), 415–423. 10.1172/JCI115012. [DOI] [PMC free article] [PubMed] [Google Scholar]
- Hilsted L.; Holst J. J. (1982) On the Accuracy of Radioimmunological Determination of Somatostatin in Plasma. Regul. Pept. 4 (1), 13–31. 10.1016/0167-0115(82)90105-7. [DOI] [PubMed] [Google Scholar]
- Schrödinger L. (2019) Maestro, Schrödinger Release 2019-2.
- Jo S.; Kim T.; Iyer V. G.; Im W. (2008) CHARMM-GUI: A Web-Based Graphical User Interface for CHARMM. J. Comput. Chem. 29 (11), 1859–1865. 10.1002/jcc.20945. [DOI] [PubMed] [Google Scholar]
- Wu E. L.; Cheng X.; Jo S.; Rui H.; Song K. C.; Dávila-Contreras E. M.; Qi Y.; Lee J.; Monje-Galvan V.; Venable R. M.; et al. (2014) CHARMM-GUI Membrane Builder toward Realistic Biological Membrane Simulations. J. Comput. Chem. 35 (27), 1997–2004. 10.1002/jcc.23702. [DOI] [PMC free article] [PubMed] [Google Scholar]
- Lee J.; Cheng X.; Swails J. M.; Yeom M. S.; Eastman P. K.; Lemkul J. A.; Wei S.; Buckner J.; Jeong J. C.; Qi Y.; et al. (2016) CHARMM-GUI Input Generator for NAMD, GROMACS, AMBER, OpenMM, and CHARMM/OpenMM Simulations Using the CHARMM36 Additive Force Field. J. Chem. Theory Comput. 12 (1), 405–413. 10.1021/acs.jctc.5b00935. [DOI] [PMC free article] [PubMed] [Google Scholar]
- Berendsen H. J. C.; van der Spoel D.; van Drunen R. (1995) GROMACS: A Message-Passing Parallel Molecular Dynamics Implementation. Comput. Phys. Commun. 91 (1–3), 43–56. 10.1016/0010-4655(95)00042-E. [DOI] [Google Scholar]
- Abraham M. J.; Murtola T.; Schulz R.; Páll S.; Smith J. C.; Hess B.; Lindah E. (2015) Gromacs: High Performance Molecular Simulations through Multi-Level Parallelism from Laptops to Supercomputers. SoftwareX 1–2, 19–25. 10.1016/j.softx.2015.06.001. [DOI] [Google Scholar]
- Huang J.; Rauscher S.; Nawrocki G.; Ran T.; Feig M.; De Groot B. L.; Grubmüller H.; MacKerell A. D. (2017) CHARMM36m: An Improved Force Field for Folded and Intrinsically Disordered Proteins. Nat. Methods 14 (1), 71–73. 10.1038/nmeth.4067. [DOI] [PMC free article] [PubMed] [Google Scholar]
- Jorgensen W. L.; Chandrasekhar J.; Madura J. D.; Impey R. W.; Klein M. L. (1983) Comparison of Simple Potential Functions for Simulating Liquid Water. J. Chem. Phys. 79 (2), 926–935. 10.1063/1.445869. [DOI] [Google Scholar]
- Páll S.; Hess B. (2013) A Flexible Algorithm for Calculating Pair Interactions on SIMD Architectures. Comput. Phys. Commun. 184 (12), 2641–2650. 10.1016/j.cpc.2013.06.003. [DOI] [Google Scholar]
- Nosé S. (1984) A Unified Formulation of the Constant Temperature Molecular Dynamics Methods. J. Chem. Phys. 81 (1), 511–519. 10.1063/1.447334. [DOI] [Google Scholar]
- Hoover W. G. (1985) Canonical Dynamics: Equilibrium Phase-Space Distributions. Phys. Rev. A: At., Mol., Opt. Phys. 31 (3), 1695–1697. 10.1103/PhysRevA.31.1695. [DOI] [PubMed] [Google Scholar]
- Williams T., Kelley C., Campbell J., Cunningham R., Denholm D., Elber G., Fearick R., Grammes C., Hart L., and Hecking L.; et al. (2014) Gnuplot 4.6.
- Hunter J. D. (2007) Matplotlib: A 2D Graphics Environment. Comput. Sci. Eng. 9 (3), 90–95. 10.1109/MCSE.2007.55. [DOI] [Google Scholar]
- Schrödinger, LLC. (2015) The {AxPyMOL} Molecular Graphics Plugin for {Microsoft PowerPoint}, Version ∼ 1.8.
- Schrödinger, LLC. (2015) The {JyMOL} Molecular Graphics Development Component, Version ∼ 1.8.
- Schrödinger, LLC. (2015) The {PyMOL} Molecular Graphics System, Version ∼ 1.8.
- DeBlasi A.; O’Reilly K.; Motulsky H. J. (1989) Calculating Receptor Number from Binding Experiments Using Same Compound as Radioligand and Competitor. Trends Pharmacol. Sci. 10 (6), 227–229. 10.1016/0165-6147(89)90266-6. [DOI] [PubMed] [Google Scholar]
- Yung-Chi C.; Prusoff W. H. (1973) Relationship between the Inhibition Constant (KI) and the Concentration of Inhibitor Which Causes 50 per Cent Inhibition (I50) of an Enzymatic Reaction. Biochem. Pharmacol. 22 (23), 3099–3108. 10.1016/0006-2952(73)90196-2. [DOI] [PubMed] [Google Scholar]
- Gans P. J.; Lyu P. C.; Manning M. C.; Woody R. W.; Kallenbach N. R. (1991) The Helix-Coil Transition in Heterogeneous Peptides with Specific Side-Chain Interactions: Theory and Comparison with CD Spectral Data. Biopolymers 31 (13), 1605–1614. 10.1002/bip.360311315. [DOI] [PubMed] [Google Scholar]
- Manning M. C.; Woody R. W. (1991) Theoretical CD Studies of Polypeptide Helices: Examination of Important Electronic and Geometric Factors. Biopolymers 31 (5), 569–586. 10.1002/bip.360310511. [DOI] [PubMed] [Google Scholar]
Associated Data
This section collects any data citations, data availability statements, or supplementary materials included in this article.