Abstract
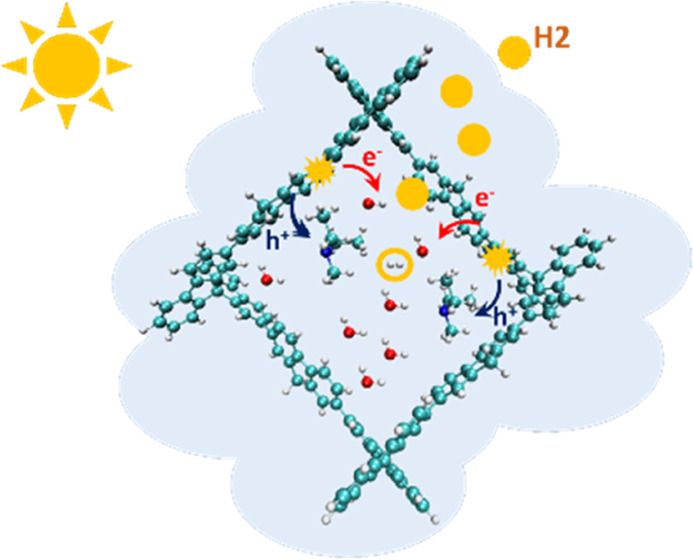
Hydrogen fuel can contribute as a masterpiece in conceiving a robust carbon-free economic puzzle if cleaner methods to produce hydrogen become technically efficient and economically viable. Organic photocatalytic materials such as conjugated microporous materials (CMPs) are potential attractive candidates for water splitting as their energy levels and optical band gap as well as porosity are tunable through chemical synthesis. The performances of CMPs depend also on the mass transfer of reactants, intermediates, and products. Here, we study the mass transfer of water (H2O and D2O) and of triethylamine, which is used as a hole scavenger for hydrogen evolution, by means of neutron spectroscopy. We find that the stiffness of the nodes of the CMPs is correlated with an increase in trapped water, reflected by motions too slow to be quantified by quasi-elastic neutron scattering (QENS). Our study highlights that the addition of the polar sulfone group results in additional interactions between water and the CMP, as evidenced by inelastic neutron scattering (INS), leading to changes in the translational diffusion of water, as determined from the QENS measurements. No changes in triethylamine motions could be observed within the CMPs from the present investigations.
Keywords: water diffusion, conjugated microporous polymers, neutron spectroscopy, water splitting, photocatalysis
Introduction
The need for a renewable energy carrier has resulted in intense research over the last decades on the generation of hydrogen from water via water splitting. Solar energy can be utilized to facilitate the water splitting process using a photocatalyst. Most of the photocatalysts studied are inorganic,1,2 but, since the first report on carbon nitrides as potential photocatalyst in 2009,3 organic polymer photocatalysts have also been studied intensively.4−6 Initially, carbon nitrides3,7 were the main focus, but in recent years, conjugated microporous polymer networks (CMPs),8−10 linear conjugated polymers,11−17 triazine-based frameworks,18−21 covalent organic frameworks (COFs),22−24 and molecular compounds25,26 have also been proposed for sacrificial proton reduction half-reaction. Activities that rival those obtained with inorganic systems have been achieved in some cases.27−29 The interest in organic photocatalysts arises from the ease of synthesis of polymer photocatalysts via low-temperature routes that allow for precise control over the polymer sequence, hence allowing for tailoring of their functionalities.5,30
Over the years, these studies have led to an understanding of the importance of several factors that result in high activity in polymer photocatalysts, such as light absorption,8,31,32 driving force for proton reduction and scavenger oxidation,31 exciton separation,16,33 and crystallinity.34−36 Due to the hydrophobic nature of most polymeric photocatalyst surface, wetting seems to be particularly important.37−39 Several studies have shown that the introduction of polar groups results in materials with higher photocatalytic activities.12,39−41 Large surface area to maximize the exposed surface to water can also be beneficial. Therefore, porous photocatalysts with high Brunauer–Emmett–Teller surface areas (SABET), namely, COFs and CMPs,42−44 have been developed for photocatalysis.10,34,45−47 In a previous paper, we studied CMPs and their linear polymer analogues and found that the porous materials do not always outperform their non-porous analogues.45
For porous materials, the interaction between the surface of the photocatalyst and water, which can be tuned by modifying the polarity of the photocatalyst,34,45 as well as the size of the pores will impact the dynamics of water on the surface and within the material. If the water dynamics is particularly slow in comparison to the kinetics of the photocatalytic reaction, the increased surface area will not improve significantly the overall activity. However, very few studies have explored transport of water through organic photocatalysts and the interaction of water with the surface of these materials.12,41 At the macroscopic scale, contact angle measurements with water and water sorption measurements give information about the wetting of particles12,41 and their available surface.34,45 No kinetic information can be obtained by these techniques, and specific interactions can only be inferred.
Neutron spectroscopy is a master technique of probe to study the guest–host dynamics, at the microscopic level. Quasi-elastic neutron scattering (QENS) and inelastic neutron scattering (INS) were applied recently to map in detail the microstructural dynamics up to the nanosecond of the conjugated polymer poly(3-hexylthiophene), under both its regioregular and regiorandom forms.48 QENS has found application in the study of the transport of lithium ions in inorganic electrodes for batteries,49 gases in metal–organic frameworks,50 and the rotational dynamics of hydrogen adsorbed in covalent organic frameworks.51 It has also been used to study water on the surface of oligonucleotide crystals and52 cages crystals.53 We demonstrated previously that QENS can be used to study the water dynamics in CMPs.45
Here, we go a step further and combine QENS and inelastic neutron scattering (INS) to quantify the water dynamics in three CMPs and study the interactions between water and CMPs at the molecular level. We also report on the dynamics of the hole scavenger triethylamine (TEA) used for the sacrificial proton reduction half-reaction. We select, as model systems, the previously reported F-CMP3, S-CMP3, and S-CMP1 (Figure 1a,b).45 The labeling of the systems is the same adopted in ref (45), which also reported on their synthesis, their full relevant characterization and photocatalytic activities. Comparing F-CMP3 and S-CMP3 allows us to study the impact of introducing a polar sulfone group in the strut of the CMPs, and comparing S-CMP3 with S-CMP1 enables us to study the impact of the network structure on the reactant (water and TEA) dynamics.
Figure 1.
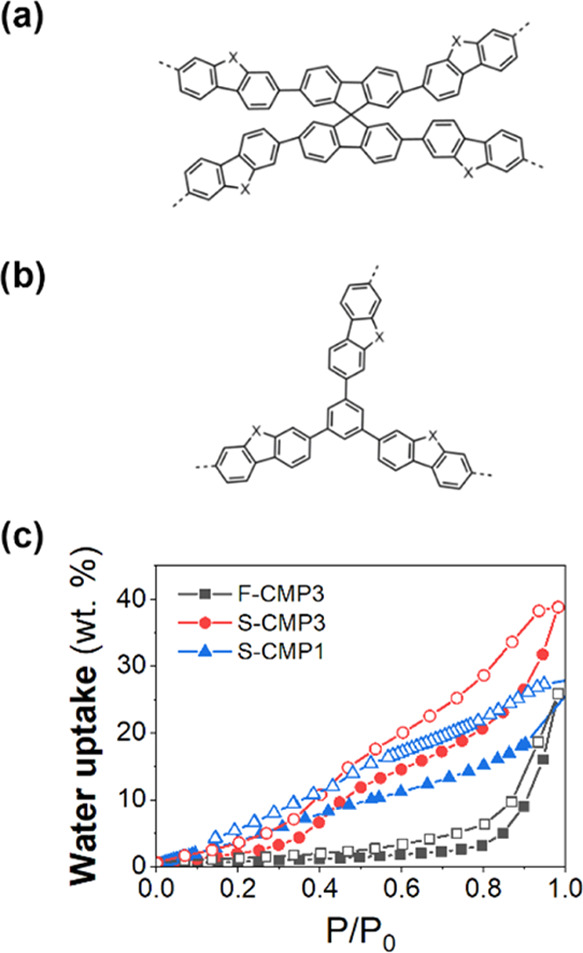
Schematic illustration of the chemical structures of (a) F-CMP3 (X = CH2) and S-CMP3 (X = SO2) and (b) S-CMP1 (X = SO2). (c) Water uptake measurements as a function of relative pressure P/P0 (P0 is the saturation pressure of water) at 20.0 °C of F-CMP3, S-CMP3, and S-CMP1, showing the evolution of both adsorption (solid symbols) and desorption (open symbols) processes.
Experimental Section
The neutron scattering measurements were performed using the direct geometry, cold-neutron, time-of-flight, time-focusing spectrometer IN6 and the hot-neutron, inverted geometry spectrometer IN1-Lagrange, at the Institut Laue-Langevin (ILL, Grenoble, France). About 300 mg of CMP samples was loaded into thin aluminum hollow cylindrical containers dedicated for neutron spectroscopy. An optimized sample thickness of 0.2 mm was considered, relevant to the minimization of effects like multiple scattering and absorption. Water was introduced in the container just before measurement, the container was tightly sealed, and an indium wire was used as a gasket. The mass (the smallest mass of water equals about 50 mg) was recorded before and after each measurement. No evaporation was recorded. The water was fully evaporated between the measurements on the different instruments, and the same procedure was followed for new measurements. All measurements are performed under vacuum. The QENS spectra were collected on IN6 using an ILL orange cryostat at 2, 200, and 300 K, and an incident neutron wavelength of 5.12 Å (Ei ≈ 3.12 meV), offering an optimal energy resolution at the elastic line of ∼0.07 meV. Standard corrections including detector efficiency calibration and background subtraction were performed. A vanadium sample was used to calibrate the detectors and to measure the instrumental resolution under the same operating conditions. At the used wavelength (λi = 5.12 Å), the IN6 angular detector coverage (ca. 10–114°) corresponds to a Q-range of ca. 0.2–2.1 Å–1. The data reduction and analysis were done using ILL software tools. For the QENS spectra, different datasets were extracted either by performing a full Q-average in the (Q, E) space to get the scattering function S(E, T) or by considering Q-slices to study the S(Q, E, T). The INS spectra, in terms of the generalized density of states (GDOS),54 were collected using both IN6 and IN1-Lagrange. On IN6, this was done concomitantly with the acquisition of the QENS data, in the up-scattering, neutron energy-gain mode, and the one-phonon GDOS were extracted, within the incoherent approximation framework.55−57 On IN1-Lagrange, the GDOS spectra were collected in the down-scattering, neutron energy-less mode at 10 K, using a closed-cycle refrigerator, with the fixed final analyzer energy of 4.5 meV. The incident energy was varied in a stepwise manner via Bragg scattering from a copper monochromator crystal. In this work, using the doubly focused Cu(220) monochromator setting, the incident energy was ca. 210–3500 cm–1, leading after subtraction of the fixed final energy value (4.5 meV) to an accessible energy transfer range of ca. 180–3500 cm–1, hence covering the full molecular vibrational frequencies.
Results and Discussion
The CMPs were synthesized using previously reported methods.45 All materials were found to be porous to nitrogen with Brunauer–Emmett–Teller surface areas (SABET) determined to be 596 m2 g–1 for F-CMP3, 431 m2 g–1 for S-CMP3, and 508 m2 g–1 for S-CMP1. The relatively high SABET for all three CMPs may allow for water penetration into the network as water sorption measurements show water uptake for all of the CMPs (Figure 1c); however, condensation on the surface cannot be ruled out. S-CMP1 adsorbs water at a lower relative pressure than both S-CMP3 and F-CMP3, but S-CMP3 uptake is higher overall. F-CMP3 adsorbs only at a very high relative pressure.
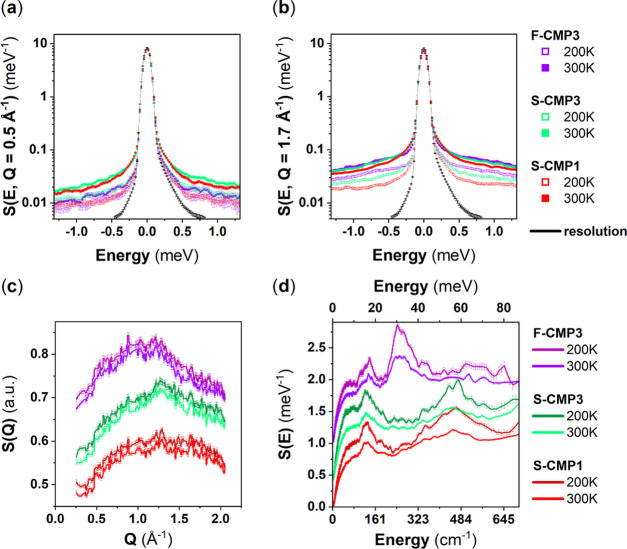
Figure 2a–c shows the temperature evolution of the Q-dependence of the QENS spectra of F-CMP3, S-CMP3, and S-CMP1. The QENS spectra of the three CMPs, on the accessible instrumental energy window, is mainly elastic with a background increasing with both temperature and Q, and a small quasi-elastic contribution with a half-width at half-maximum (HWHM) of about 0.2 meV. The overall Q-dependence of F-CMP3 is more pronounced than for both S-CMP1 and S-CMP3. At 200 K, only F-CMP3 presents a Q-dependence of the quasi-elastic contribution. At 300 K, the quasi-elastic contribution is broader for S-CMP1 and S-CMP3, as can be clearly seen in Figure 2b. Indeed, the background for all of the three CMPs is similar at 300 K and at Q = 1.1 Å–1, but the quasi-elastic contribution is narrower in the case of F-CMP3. The Q-dependence of the background of F-CMP3 is stronger at 300 K than for S-CMP3 and S-CMP1, which is consistent with that observed at 200 K, indicating that the degree of freedom captured at 200 K by the instrumental energy window becomes too fast at 300 K to be properly resolved and contribute to the background. Hydrogen has a large incoherent neutron cross section in comparison to oxygen, and therefore, the Q-dependent motion seen at 200 K and linked with the background at 300 K is assigned to a motion related to the −C(CH3)2 group of F-CMP3. Within the energy window of the instrument, the rotational motion of the entire linker is likely to be captured at 300 K. The presence of the −C(CH3)2 group seems to induce a frustration of this motion in comparison to the sulfone group −SO2. This could be explained by the larger −C(CH3)2 group more likely to create a steric hindrance. Interestingly, no strong differences in the QENS spectra between S-CMP1 and S-CMP3 related to the difference of nodes are observed at those temperatures, within this instrumental energy window. The CMPs are reported to be largely amorphous as measured by powder X-ray diffraction.45 All of the CMPs feature a broad Bragg peak around 1.3 Å–1, as measured by X-ray diffraction45 and as observed by neutron diffraction in Figure 2e. Further neutron diffractograms down to 2 K are presented in Figure S9 in the Supporting Information. No differences as a function of temperature is observed for all of the CMPs. The generalized density-of-states (GDOS)1 spectra of S-CMP1 and S-CMP3 exhibit similar vibrational aspects, in both intensity and profile (Figure 2f), and notable differences compared to F-CMP3. Indeed, the vibrational band observed around 480 cm–1 in S-CMP1 and S-CMP3 is absent in F-CMP3, while the band around 250 cm–1 in F-CMP3 is absent in S-CMP1 and S-CMP3. Thus, the features around 250 and 480 cm–1 can be assigned to vibrational modes involving the −CH2 group and the sulfone group −SO2, respectively. Upon cooling from 300 to 200 K, the peaks at 250 and 480 cm–1 in F-CMP3 and S-CMP3, respectively, exhibit a pronounced narrowing while the narrowing of the peak at 480 cm–1 for S-CMP1 is less pronounced than in S-CMP3 (Figure 2e). This can be explained by the different nodes in F-CMP3 and S-CMP3 in comparison to S-CMP1. The spiro node is expected to be more rigid, leading to a more ordered structure in F-CMP3 and S-CMP3 than in S-CMP1. Although the overall GDOS is more impacted by the presence of the sulfone group than the differences in nodes, INS proves to be very sensitive to the subtle differences of the chemical structures of F-CMP3, S-CMP3, and S-CMP1. The energy range up to 700 cm–1, from the cold-neutron measurements using IN6, likely covers the external (phonon) modes (Figure 2f).
Figure 2.
Top: Q-dependent QENS spectra of dried F-CMP3, S-CMP3, and S-CMP1 at 200 and 300 K: (a) Q = 0.5 Å–1 and (b) Q = 1.7 Å–1. The instrumental resolution function of IN6 is measured by quenching S-CMP3 at 2 K and is represented by the narrow black solid elastic line. Bottom: (c) Neutron diffractograms of F-CMP3, S-CMP3, and S-CMP1, extracted from the same IN6 measurements at 200 and 300 K. (d) Generalized phonon density of states (GDOS) of F-CMP3, S-CMP3, and S-CMP1 at 200 and 300 K, also obtained from the same IN6 measurements.
To probe a full spectrum including the internal (molecular) degrees of freedom, we went a step further and performed measurements on the hot-neutron IN1-Lagrange spectrometer on F-CMP3 and S-CMP3 (Figure 3). We focus on comparing the vibrational response of F-CMP3 and S-CMP3 to further understand the impact of the sulfone group on the molecular vibrations in terms of interaction with water. To get a resolved and structured molecular vibrational spectrum, the spectra were collected at 10 K to considerably reduce the temperature-induced Debye–Waller effect. This allowed us to extend the accessible energy range of the IN6 spectra to higher energies on IN1-Lagrange, hence leading to cover the full molecular vibrational range, up to the C–H stretch band around 3600 cm–1. The bands at 250 and 480 cm–1 are also well captured in the IN1-Lagrange measurements. Compared to IN6, where measurements were performed at 200 and 300 K, decreasing the temperature to 10 K on IN1-Lagrange enabled us to better resolve both the features at 250 and 480 cm–1 (Figure 3).
Figure 3.
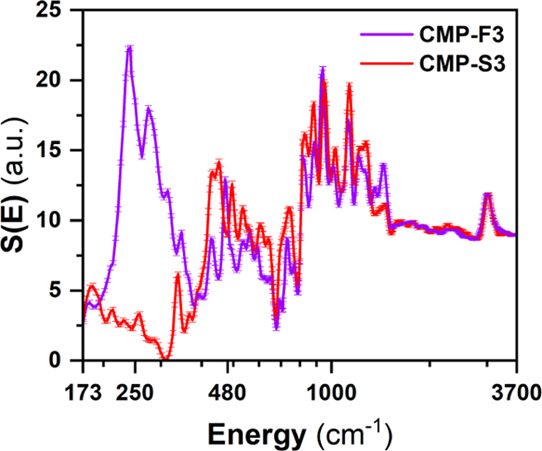
GDOS of F-CMP3 and S-CMP3, at 10 K, measured on the hot-neutron spectrometer IN1-Lagrange, allowing to probe the full molecular vibrational spectrum up to 3700 cm–1 (∼459 meV).
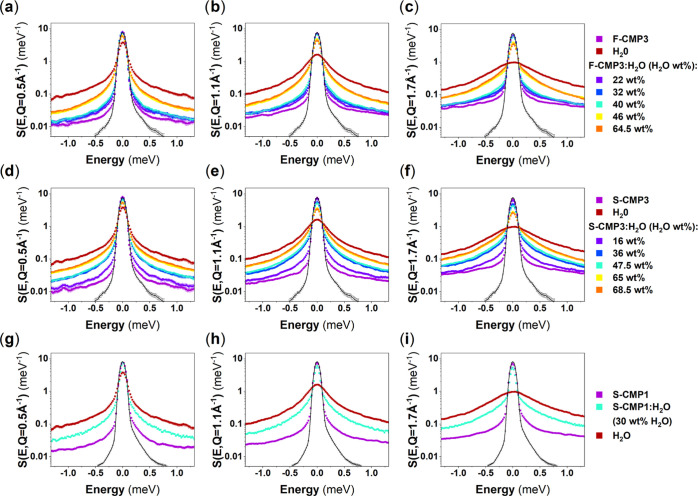
Figure 4 compares the Q-dependence of the QENS spectra of the three CMPs mixed with H2O (CMPs:H2O) with the Q-dependence of the QENS spectra of dried CMPs and bulk H2O. At higher H2O concentrations, the spectra are expected to be dominated by the signal of H2O, as the neutron incoherent cross section of H2O is larger than the neutron incoherent cross section of the CMPs (Table S1 in the Supporting Information). The presence of the sulfone group −SO2 in S-CMP3 lowers the neutron incoherent cross section with respect to the neutron incoherent cross section of F-CMP3; thus, the H2O contribution to the overall QENS spectra is dominating the QENS signals of S-CMP3:H2O and F-CMP3:H2O for concentrations above 16 and 40 wt %, respectively. As mentioned above, the QENS spectra of CMPs are mainly elastically shaped, and an increased elastic contribution is observed, in comparison to bulk H2O, even for the highest H2O concentrations. Water can bind to the CMP; be strongly adsorbed on the surface of the pores, leading to strong hindrance of water motions and diffusion; or be free to diffuse. We will refer to these three types of water as bound water, constrained water, and free water, respectively. Trapped water will be used as a loose term encompassing both bound and constrained water. This increased elastic contribution could originate from the CMP signals or may be due to the presence of bound water. For simplicity, we use hereafter the wording bound water to refer to both water bound to CMPs and water with motions too slow to be captured by the instrument. The spectra of water in CMPs appear to be narrower than the bulk water signal, pointing toward the presence of constrained or trapped water. The CMPs spectra may change with the presence of water, and may dominate the changes in QENS spectra at lower H2O concentrations. It cannot be ruled out without a further analysis that the observed changes in the QENS spectra of CMPs:H2O with respect to the dried CMPs are a combination of a change in the QENS signals of both the CMPs and water. To gain insights into the specific behavior of water in the different CMPs, we further exploit the GDOS of water and water-mixed CMPs, from IN6 INS measurements. Figure 5 shows the GDOS of the dried CMPs, of the CMPs mixed with H2O and of bulk H2O. The broad peak around 80 meV of bulk H2O is assigned to the libration of water.58,59 It can be fitted by a combination of three gaussians representing the rock, wag, and twist modes of water, as presented in Figure 6 for bulk water.
Figure 4.
Q-dependent room-temperature QENS spectra of dried CMPs, bulk H2O, and CMPs mixed with different amounts of H2O, CMPs:H2O, for: (a–c) F-CMP3, (d–f) S-CMP3, and (g–i) S-CMP1, at (a, d, g) Q = 0.5 Å–1, (b, e, h) Q = 1.1 Å–1, and (c, f, i) Q = 1.7 Å–1. The instrumental resolution function is measured by quenching S-CMP3 at 2 K, and is represented by the narrow black solid elastic line.
Figure 5.
GDOS from IN6 measurements at 300 K of (a) F-CMP3, (b) S-CMP3, and (c) S-CMP1 mixed with different amounts of H2O.
Figure 6.
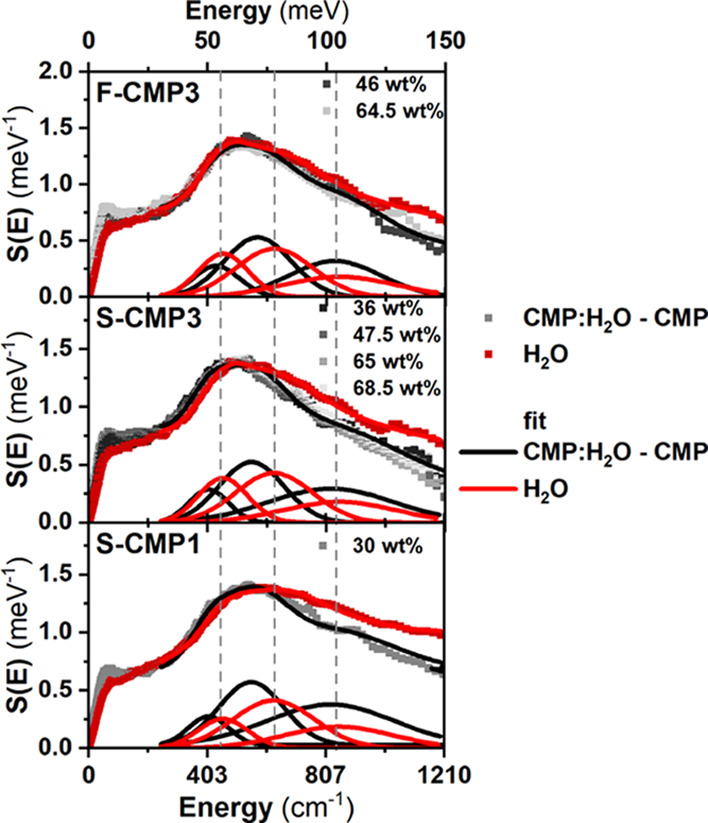
GDOS of bulk reference H2O and H2O in (top) F-CMP3, (middle) S-CMP3, and (bottom) S-CMP1. The GDOS of H2O in the CMP samples is presented here as the difference of the water-mixed CMPs (F-CMP3:H2O, S-CMP3:H2O, or S-CMP1:H2O) and dried CMPs (F-CMP3, S-CMP3, or S-CMP1). The broad peak at around 80 meV is assigned to the libration band of water and is fitted for bulk water (red line) and for the difference of the water-mixed CMPs and dried CMPs (black lines) with a combination of three gaussians representing the rock, wag, and twist modes of water.2,3
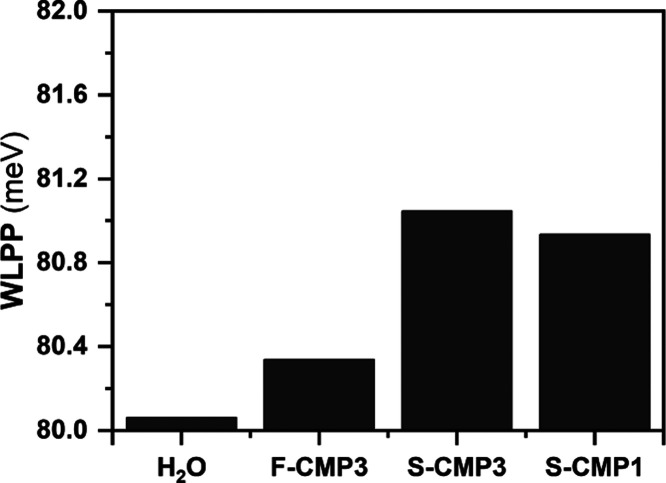
In Figure 6, bulk H2O is presented as a “reference”, compared to the difference of the GDOS of the water-mixed CMPs and dried CMPs. The intensity of the low-energy feature of water, at ∼7 meV, increases for all CMPs although more significantly for F-CMP3. This could reflect a change in organization of water, especially in the hydration monolayer of all of the CMPs. The difference in GDOS of the water-mixed CMPs and dried CMPs is fitted similarly to the bulk water with three gaussians. The comparison gaussian-wise between bulk water (red line) and the difference in GDOS (black lines) clearly highlights some hindrance and change in the vibrational distribution of the librational degrees of freedom of H2O in the CMPs. To quantify this hindrance for the respective CMPs, we calculate the weighted librational peak position (WLPP)59 as follows
| 1 |
where AGn and xGn are the area and the center of the gaussians, respectively. A higher WLPP value indicates a higher energy required to excite the water libration mode or, in other words, a lower water librational mobility. The WLLP is higher for S-CMP3 and S-CMP1 in comparison to F-CMP3, although a small hindrance of the librational water mobility is still observed for F-CMP3 (Figure 7).
Figure 7.
Weighted librational peak position (WLPP) in meV for H2O, F-CMP3, S-CMP3, and S-CMP1.
To better resolve the librational motion of water, we further perform measurements for S-CMP3 and F-CMP3 with H2O at 10 K (Figure 8) to significantly reduce the Debye–Waller effect, using IN1-Lagrange. The vibrational spectra of the water-mixed CMP samples include contribution of both the GDOS of the dried CMPs and reference bulk H2O (ice down to 10 K). This points to the presence of free water at the probed concentration. By subtracting the contribution of the dried F-CMP3 and S-CMP3 from the two water-mixed CMP form (Figure 8, bottom), it appears that the GDOS of H2O in both F-CMP3 and S-CMP3 deviate from the GDOS of the reference bulk H2O. The features at 225 and 300 cm–1 are assigned to the hydrogen-bond bending and stretching components of bulk ice, while the edge at 300 cm–1 is assigned to the libration edge of ice. No differences are observed in the region 200–320 cm–1. A broad feature around 500 cm–1 is observed for H2O in S-CMP3, and its magnitude varies with water concentration. The sharp libration edge of ice is observed for H2O in both S-CMP3 and F-CMP3; however, an extra contribution for both materials is seen at 600 cm–1. From this vibrational study, it can be concluded that the broad features at 500 cm–1 in the case of S-CMP3 and the additional feature at 600 cm–1 for both S-CMP3 and F-CMP3 are associated with interfacial water. The absence of extra features in the region dominated by the stretching and bending of weak hydrogen bonding reveals that the structures of interfacial water are perturbed considerably from the bulk state for both CMPs. Furthermore, the extra feature at about 500 cm–1 for S-CMP3 appears at a frequency where, in the dried CMPs, a more pronounced band is observed for S-CMP3 compared to F-CMP3 (Figure 3), thus indicating a specific interaction between the sulfone group and water. To summarize, the hindrance of the librational degrees of freedom of water in S-CMP3 and S-CMP1 is a clear indication of the transition from free water to constrained/trapped water and/or bound water. The changes observed at 10 K for both F-CMP3 and S-CMP3 reflect the presence of bound water, as well as an additional interaction between the sulfone group and water.
Figure 8.
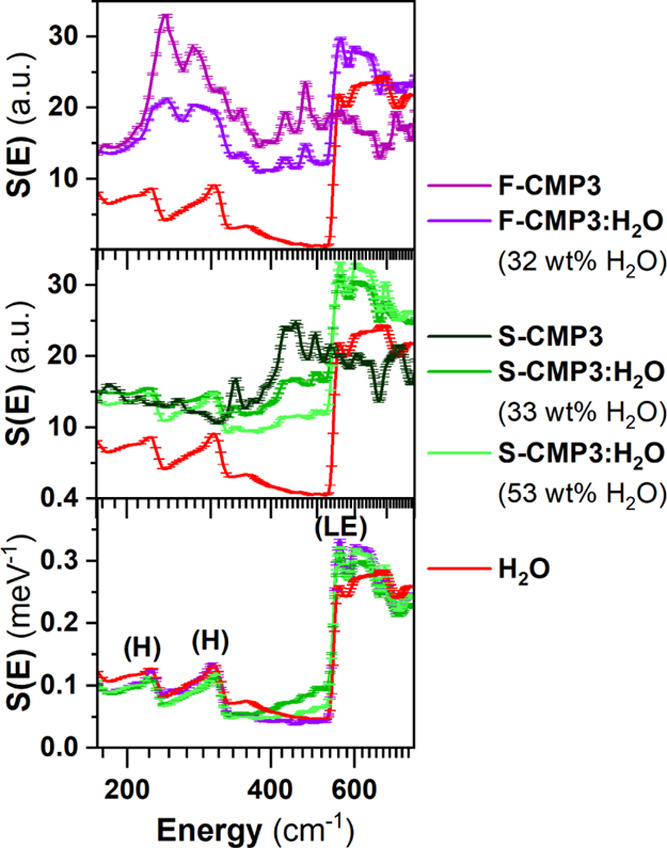
GDOS spectra, from INS measurements at 10 K using IN1-Lagrange, of (top) F-CMP3 and (middle) S-CMP3 with H2O. (bottom) GDOS of bulk reference H2O and H2O in the F-CMP3 and S-CMP3, taken as the difference of the water-mixed CMPs (either F-CMP3:H2O or S-CMP3:H2O) and dried CMPs (either F-CMP3 or S-CMP3, respectively). The peaks labeled as (H) are assigned to the hydrogen-bond bending and stretching60 and as (LE) to refer to the librational edge.52,61
The behavior of water can further be explored and quantified, by fitting the QENS data. The dynamical structure factor of water Swater(Q,ω) is expressed as a convolution of the dynamical structure factors of the vibrational SV(Q,ω), translational ST(Q,ω) and rotational motions of water SR(Q,ω).62
| 2 |
The SV(Q,ω) component is mainly elastic with a background
due to vibrations (inelastic contributions), and thus can be written
as A(Q)δ(ω) + B(Q). A(Q) is proportional to the Debye–Waller factor, δ(ω)
is a Dirac function, and B(Q) is
the background due to vibrations. ST(Q,ω) is represented by a single Lorentzian function  of HWHM ΓT(Q). We use the well-known
Sears formalism63,64 to describe SR(Q,ω)
| 3 |
where jk is the kth Bessel function; a is the radius of rotation, taken to be the O–H distance in the water molecule (0.98 Å); ℏ is the reduced Planck constant; and τR denotes the relaxation time of rotational diffusion. Up to a momentum transfer Q = 1.1 Å–1, the third term can be neglected, but at Q = 1.7 Å–1, the first term becomes smaller than the third term (see Table S2 in the Supporting Information). Thus, we keep the three terms, given the Q-range of the instrument, and τR is shared through each dataset during the fit to minimize the error on ΓT(Q). The QENS spectrum of water Iwater(Q,ω), taking into account the resolution of the instrument R(ω), can be expressed as
 |
4 |
The Q-dependence of ΓT is expected to follow the random-jump diffusion model65
| 5 |
where DT and τT are the translational diffusion constant and the residence time of the translational diffusion, respectively.
This model fits reasonably well both H2O and D2O data (χ2 = 0.46 and 0.45, respectively), at the exception of Q = 1.7 A–1 for D2O (Figure 9a,b), due to the pair distribution function of D2O exhibiting a strong Bragg peak around Q = 1.7 A–1 (Figure 9d). We find a relaxation time τR = 0.940 ps for both H2O and D2O, a residence time τT = 1.736 ps for H2O and 2.257 ps for D2O, and a diffusion coefficient DT = 2.2 10–5 cm2·s–1 for H2O and 2.5 10–5 cm2·s–1 for D2O (Figure 9c). This compares well with the literature where the residence time for the rotation and translation are both 1.1 ps and the diffusion coefficient is 2.3 10–5 cm2·s–1.7 The remaining fitting parameters can be found in Table S3 in the Supporting Information.
Figure 9.
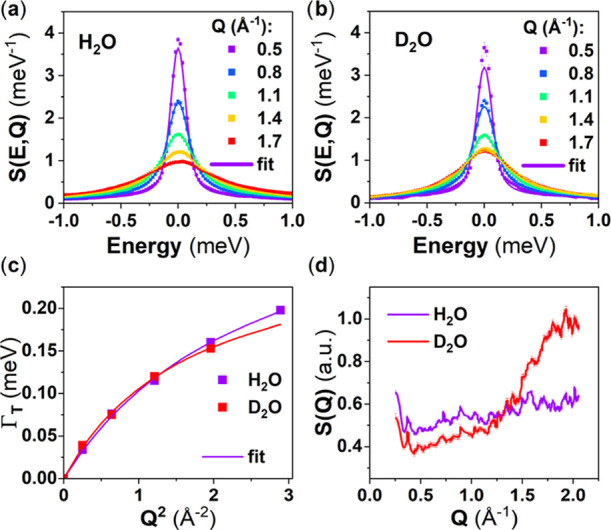
(a, b) Measured (scatter points) and associated fit (solid line) using the described model, room-temperature Q-dependent QENS spectra of (a) H2O and (b) D2O. (c) HWHM of the Lorentzian representing the translational diffusion of water extracted from the fits of the QENS spectra as a function of Q2 (scatter points) and fits using the random-jump diffusion model (solid line). (d) Diffractograms of H2O and D2O extracted from the present IN6 measurement.
To fit the QENS signals of the CMPs mixed with H2O, the above model can further be formulated as
 |
6 |
where ICMP(Q,ω) is the measured normalized signal of the CMP and C is the contribution of the CMP to the signal of CMP:H2O, which can, in principle, be calculated from Table S1 in the Supporting Information. Three possible types of water can be present: bound water, constrained water, and free water. The presence of bound water can lead to an extra elastic contribution. The QENS spectra of the dried CMPs being mainly elastic, the difference between C extracted from the fit and calculated from Table S1 in the Supporting Information is used to estimate the amount of bound water. A(Q) is fixed here, and the corresponding values are taken to be equal to those extracted from the fit of the free water (see Supporting Information Table S2). To avoid overparametrization, treatments of constrained water and free water are averaged. Thus, the diffusion coefficient extracted from Figure 10 represents an upper limit to the diffusion coefficient of constrained water.
Figure 10.
HWHM of the Lorentzian representing the translational diffusion of water extracted from the fits of the QENS spectra (scatter points) as a function of Q2 and fits using the random-jump diffusion model (solid line) for (a) F-CMP3:H2O, (b) S-CMP3:H2O, both at different H2O concentrations, and (c) S-CMP1:H2O. The horizontal dashed line represents the instrumental resolution.
The model fits well with the higher H2O concentrations where the H2O signal dominates the QENS spectra (Supporting Information Figures S1, S3, and S5). The water dynamics is impacted when mixed with S-CMP3 and S-CMP1, while it is unchanged in F-CMP3 (Figure 10). The residence time τT of the translational motion increases from about 1 ps for bulk water to about 4 ps when water is mixed with both S-CMP1 and S-CMP3. The diffusion coefficient value decreases with respect to bulk water when water is mixed with S-CMP3 but seems similar when mixed with S-CMP1 (Table 1). We quantify the amount of bound water for all CMPs from the difference between the expected C calculated from Table S1 in the Supporting Information, and C extracted from the fit. F-CMP3 exhibits the largest amount of bound water with about 30 wt %, S-CMP3 has about 25 wt %, while S-CMP1 shows about 10 wt %.
Table 1. Main Parameters Obtained from the Above-Described Fitting Procedurea.
| water
content |
C |
bound water | τR | DT | τT | ||
|---|---|---|---|---|---|---|---|
| (wt %) | expected | from fit | (wt %) | (ps) | (10–5 cm2 s–1) | (ps) | |
| H2O | 100.0 | 0.00 | 0.00 | 0.00 | 0.94 | 2.15 | 1.74 |
| F-CMP3 | 22.0 | 55.1 | 94.3 | 19.8 | NA | NA | NA |
| 32.0 | 42.4 | 90.8 | 28.3 | NA | NA | NA | |
| 40.0 | 34.2 | 87.8 | 35.2 | 1.32 | 2.10 | 1.03 | |
| 46.0 | 22.1 | 55.9 | 21.6 | 1.32 | 1.81 | 1.34 | |
| 64.5 | 38.1 | 45.3 | 36.5 | 1.32 | 1.46 | 1.66 | |
| S-CMP3 | 16.0 | 55.4 | 90.9 | 13.2 | NA | NA | NA |
| 36.0 | 29.6 | 65.3 | 22.2 | 1.32 | 2.60 | 4.49 | |
| 47.5 | 20.7 | 56.4 | 28.9 | 1.30 | 1.76 | 4.11 | |
| 65.0 | 11.3 | 29.5 | 27.6 | 1.13 | 1.79 | 3.34 | |
| 68.5 | 9.8 | 26.5 | 28.7 | 1.14 | 1.89 | 3.14 | |
| S-CMP1 | 30.0 | 34.0 | 52.8 | 10.9 | 0.97 | 3.21 | 4.45 |
| D2O | 100.0 | 0.00 | 0.00 | 0.00 | 0.94 | 2.52 | 2.26 |
| F-CMP3 | 32.0 | 96.8 | 96.7 | 0.0 | NA | NA | NA |
| 48.0 | 93.9 | 97.2 | 33.1 | NA | NA | NA | |
| 65.0 | 88.4 | 94.6 | 49.8 | NA | NA | NA | |
| S-CMP3 | 33.0 | 95.1 | 98.2 | 23.8 | NA | NA | NA |
| 48.0 | 91.2 | 93.9 | 21.7 | NA | NA | NA | |
| 67.0 | 82.6 | 82.4 | 0.0 | NA | NA | NA | |
| S-CMP1 | 30.0 | 95.5 | 82.7 | 0.0 | NA | NA | NA |
The remaining fitting parameters can be found in the Supporting Information (Tables S4–S6). The amount of bound water is calculated from the experimental water content, the value of C from the fit, and the estimated neutron incoherent cross sections. The expected C value is inferred from the experimental water content and the estimated neutron incoherent cross sections with the assumption that in this case C is solely linked with the contribution of the CMP to the overall QENS spectra. The translational residence time and diffusion coefficients are extracted from the fits of the HWHM, obtained from fitting the QENS data, as a function of Q2, as shown in Figure 6.
At low concentrations (16 wt % for S-CMP3 and, 22 and 32 wt % for F-CMP3), the fits are not very satisfactory. Considering the large amount of bound water and the lower contrast between CMP and H2O, the contribution from H2O to the QENS signal is significantly reduced, and thus, it is impossible to perform a reliable fit. The amount of bound water is likely to be lower at a lower concentration due to a reduced pressure. Furthermore, the CMP materials may exhibit an extra QENS contribution triggered by the hydration. In this context, to gain deeper insights, we performed further measurements with D2O for a contrast variation purpose between the CMP and water (Table S1 in the Supporting Information). Interestingly, our attempt to model the low H2O concentration CMPs:H2O samples, and the D2O-containing CMPs, with a weighted average of the dried CMP signal and the water signal extracted from the previous fit was successful (Supporting Information Figures S2, S4, and S6). We find an amount of bound water close to the ones we obtained for H2O (Table 1), noting that for D2O, the errors are too large to give meaningful numbers. Although the fits are reasonable for all of the concentrations, it is improved for S-CMP3 and F-CMP3 with D2O at the highest concentrations, compared to H2O, when Q = 1.7 Å–1 is not included in the dataset. Diffractograms (Figure S9 in the Supporting Information) exhibit the additional Bragg peak for CMPs mixed with D2O. This supports the fact that a significant contribution from water is still probed.
Figure 11 shows the evolution of the vibrational spectra of both dried and wetted F-CMP3 and S-CMP3, from IN6 and IN1-Lagrange measurements. This time we make use of the unique contrast variation potential offered by neutron, and D2O is used instead of H2O for the wetted CMPs. The signal from water is no more of a dominant nature as D2O has a much lower neutron incoherent cross section than H2O. Therefore, we expect that the changes between the dried CMP spectra and the wetted CMP spectra reflect, in this case, both the changes in the water and CMP spectra. At present, the observed changes are small. We consider the resolved IN1-Lagrange spectra, and by subtracting dried and wetted F-CMP3 from dried and wetted S-CMP3 (Figure 12a), respectively, we could highlight these changes. It is found that the differences due to hydration occur mainly in the energy range up to 1000 cm–1, with two vibrational bands around 250 and 750 cm–1 being the most strongly affected. To gain an insight into the nature of the modes concerned by these changes, we went a step further and simulated the inelastic neutron spectra of the fluorene unit with the −CH2 and −SO2 group by adopting a density-functional theory (DFT)-based single-molecule approach. Figure 12b,c compares measured and calculated neutron vibrational spectra of the dried CMPs. Interestingly, the agreement is found to be good. The single-molecule approach reproduced rather well the measured spectra, hence reflecting the dominant intramolecular or simply the pronounced molecular aspect of the interaction within the CMPs. Having validated the calculated spectra, these can be used to spot some specific modes that could be relevant to the dynamics of the mass transfer we are reporting on. We found that these modes are related to the coupling of specific modes of the −C(CH3)2 and −SO2 groups with out-of-plane motions of the backbones for the 250 cm–1 band and with some modes of the benzene groups forming the fluorene unit for the 750 cm–1 band. Figure 12a highlights the impacted regions by these changes, and Table S8 gathers the mode frequencies and associated assignments of the -(CH3)2 and -SO2 groups from our DFT-based single-molecule calculations.
Figure 11.
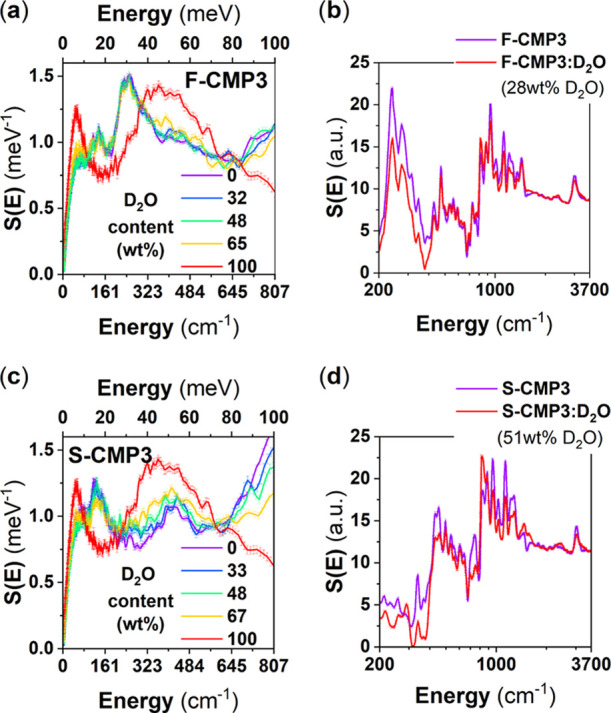
Room-temperature GDOS of F-CMP3 (a), S-CMP3 (c), D2O, and their mixtures, collected using the cold-neutron spectrometer IN6. The GDOS at 10 K of F-CMP3 (b), S-CMP3 (d), and their mixtures with D2O, using the hot-neutron spectrometer IN1-Lagrange, allowing to cover the full molecular vibrational range.
Figure 12.
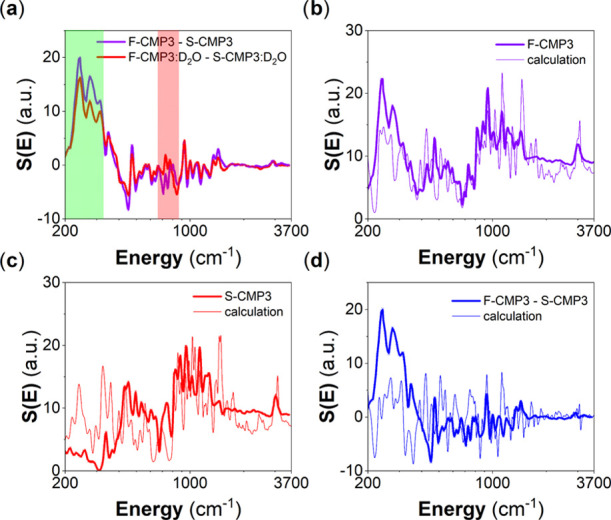
(a) Difference of measured GDOS of dried F-CMP3 and S-CMP3 compared with the difference of measured GDOS of D2O-mixed F-CMP3 and S-CMP3. Comparison of measured and calculated GDOS of (b) dried F-CMP3, (c) dried S-CMP3, and (d) the associated difference GDOS(F-CMP3)-GDOS(S-CMP3). The measured spectra were collected at 10 K using the hot-neutron spectrometer IN1-Lagrange, allowing to cover the full molecular vibrational range. The calculated GDOS are DFT-based (0 K), where a single-molecule approach was adopted, neglecting any potential lattice effect (external degrees of freedom) and intermolecular interactions.
For hydrogen evolution applications, a hole scavenger is used in combination with water. We attempt to study the mass transfer of triethylamine (TEA) at 5 vol % in D2O as used in previously reported hydrogen evolution measurements using QENS (Figure 13a). Although no differences in the QENS spectra are observed for F-CMP3 with and without D2O:TEA, the QENS spectra are different for S-CMP3 and S-CMP1 with and without D2O:TEA. We can fit the D2O:TEA with a similar model as for water (Supporting Information Figure S7 and Table S7). The diffusion coefficient is lower than that for bulk water, and the residence time is longer. Based on the fits of the QENS spectra with and without D2O:TEA (Supporting Information Figure S8), we do not observe within error bars of the measurement/fit (Figure 13b) any differences between D2O:TEA with and without the CMPs. Thus, we postulate that the TEA molecule does not enter the pores nor interact strongly with the CMPs, but the difference in QENS spectra with and without D2O:TEA is solely due to a superposition of the QENS signals of CMPs and D2O:TEA. It is worth noting that TEA is a rather large molecule and a smaller hole scavenger, with the appropriate energy level, might be beneficial to maximize the potential of those CMPs. This calls for further investigations to explore different hole scavengers.
Figure 13.
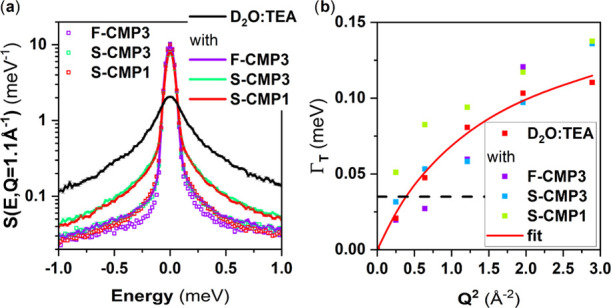
(a) QENS spectra, at Q = 1.1 Å–1, of F-CMP3, S-CMP3, and S-CMP1, the mixture of solvents D2O:TEA and the CMPs mixed with D2O:TEA.. (b) HWHM of the Lorentzian representing the translational diffusion of the mixture of solvents D2O:TEA extracted from the fits as a function of Q2, with a jump diffusion fit (solid line). The horizontal dashed line represents the instrumental resolution.
Conclusions
To summarize, the amount of bound water is significantly lower in S-CMP1 than in F-CMP3 and S-CMP3. This can be correlated with the difference in nodes between the two types of CMPs. The spiro link, which is likely to be stiffer, contributes to trapping water, resulting in an increase of the water described in this paper as “bound” water. The bound water and water exhibiting motions too slow to be captured by the spectrometer cannot be clearly differentiated here. The diffusion coefficient of water in S-CMP1 is nonetheless found to be significantly lower than free water, indicating as in the case of S-CMP3 the presence of constrained water. All three CMPs present therefore a significant amount of trapped water, but the range of dynamics of this trapped water differ. Indeed, water in F-CMP3 is either bound or free, while water in S-CMP1 is either constrained or free, S-CMP3 exhibits all of the three behavior types of water.
The presence of the sulfone group, in S-CMP1 and S-CMP3, induces a change in translational motions of water accompanied by changes in the librational motions of water as observed by INS, while for F-CMP3, both translational and librational motions resemble the motion of bulk water. Therefore, it seems reasonable to infer that the stiffer spiro link contributes to a water trapping mechanism within the pores of the materials while the addition of the sulfone group leads to better interactions between the CMP surface and water, and thus induces slower dynamics of water.
We previously reported a much higher activity for S-CMP3 than for S-CMP1 and F-CMP3 that presented similar activities, and all three CMPs were presenting larger activities than their linear analogue, pointing toward a benefit of porous materials.45 F-CMP3, as measured by water sorption (Figure 1), absorbs the least amount of water but similar activities to S-CMP1. The adsorbed water in F-CMP3 is mainly bound, while it is mainly constrained in S-CMP1. Thus, bound water seems the most beneficial water type for photocatalytic application. S-CMP3 benefits from both a large amount of bound water and a larger adsorption than F-CMP3. Photocatalytic activity is not only impacted by the mass transfer but also by the optoelectronic character of the materials. The nodes as well as the sulfone groups impact the electronic properties of the materials, and S-CMP3 was reported to have the lowest optical gap, for instance.45 The mass transfer has also to be balanced against the speed of the photocatalytic reaction. Therefore, it would not be plausible to draw a strong correlation between mass transfer and photocatalytic activity.45 The addition of the hole scavenger TEA does not seem, presently, to lead to a strong interaction with the CMPs for the considered concentration. Further study with different concentrations and hole scavengers of different sizes is therefore needed.
Acknowledgments
The Institut Laue-Langevin (ILL) facility (Grenoble, France) is acknowledged for providing beam time on the IN6 and IN1-Lagrange spectrometers. A.A.Y.G. acknowledges the Engineering and Physical Sciences Research Council (EPSRC) for the award of an EPSRC Postdoctoral Fellowship (EP/P00928X/1). Y.B., C.M.A., and R.S.S. from the group of Prof. Andrew I. Cooper thank EPSRC for funding (EP/N004884/1). Y.B. thanks the China Scholarship Council for a Ph.D. studentship.
Glossary
Abbreviations
- CMP
conjugated microporous polymer
- COF
covalent organic framework
- TEA
triethylamine
- QENS
quasi-elastic neutron scattering
- INS
inelastic neutron scattering
- GDOS
generalized density of states
- HWHM
half-width at half-maximum
Supporting Information Available
The Supporting Information is available free of charge at https://pubs.acs.org/doi/10.1021/acsapm.0c01070.
Neutron incoherent cross sections of the samples, QENS spectra and associated fits with supplementary fitting parameters, neutron diffractograms, and GDOS of CMPs mixed with D2O and with D2O:TEA obtained from IN6 measurements of all of the measured samples. The fit procedure detailed in the manuscript and in the SI was coded in a python script, which could be obtained from the corresponding authors upon a reasonable request (PDF)
Author Contributions
A.A.Y.G. and M.Z. conceived and developed the project, wrote the neutron beamtime proposals, planned and performed the neutron experiments, and treated and analyzed the neutron data. Y.B. and C.M.A. synthesized the materials and performed together with R.S.S. materials characterization. A.A.Y.G. and M.Z. wrote the manuscript with contribution from all of the coauthors.
The authors declare no competing financial interest.
Supplementary Material
References
- Kudo A.; Miseki Y. Heterogeneous Photocatalyst Materials for Water Splitting. Chem. Soc. Rev. 2009, 38, 253–278. 10.1039/B800489G. [DOI] [PubMed] [Google Scholar]
- Hisatomi T.; Kubota J.; Domen K. Recent Advances in Semiconductors for Photocatalytic and Photoelectrochemical Water Splitting. Chem. Soc. Rev. 2014, 43, 7520–7535. 10.1039/C3CS60378D. [DOI] [PubMed] [Google Scholar]
- Wang X.; Maeda K.; Thomas A.; Takanabe K.; Xin G.; Carlsson J. M.; Domen K.; Antonietti M. A Metal-Free Polymeric Photocatalyst for Hydrogen Production from Water under Visible Light. Nat. Mater. 2009, 8, 76–80. 10.1038/nmat2317. [DOI] [PubMed] [Google Scholar]
- Wang X.; Zhang G.; Lan Z.-A. Organic Conjugated Semiconductors for Photocatalytic Hydrogen Evolution with Visible Light. Angew. Chem., Int. Ed. 2016, 55, 15712–15727. 10.1002/anie.201607375. [DOI] [PubMed] [Google Scholar]
- Jayakumar J.; Chou H. Recent Advances in Visible-Light-Driven Hydrogen Evolution from Water Using Polymer Photocatalysts. ChemCatChem 2020, cctc.201901725 10.1002/cctc.201901725. [DOI] [Google Scholar]
- Wang T.-X.; Liang H.-P.; Anito D. A.; Ding X.; Han B.-H. Emerging Applications of Porous Organic Polymers in Visible-Light Photocatalysis. J. Mater. Chem. A 2020, 8, 7003–7034. 10.1039/D0TA00364F. [DOI] [Google Scholar]
- Kong D.; Zheng Y.; Kobielusz M.; Wang Y.; Bai Z.; Macyk W.; Wang X.; Tang J. Recent Advances in Visible Light-Driven Water Oxidation and Reduction in Suspension Systems. Mater. Today 2018, 21, 897–924. 10.1016/j.mattod.2018.04.009. [DOI] [Google Scholar]
- Li L.; Cai Z.; Wu Q.; Lo W. Y.; Zhang N.; Chen L. X.; Yu L. Rational Design of Porous Conjugated Polymers and Roles of Residual Palladium for Photocatalytic Hydrogen Production. J. Am. Chem. Soc. 2016, 138, 7681–7686. 10.1021/jacs.6b03472. [DOI] [PubMed] [Google Scholar]
- Kochergin Y. S.; Schwarz D.; Acharjya A.; Ichangi A.; Kulkarni R.; Eliášová P.; Vacek J.; Schmidt J.; Thomas A.; Bojdys M. J. Exploring the “Goldilocks Zone” of Semiconducting Polymer Photocatalysts by Donor–Acceptor Interactions. Angew. Chem., Int. Ed. 2018, 14188–14192. 10.1002/anie.201809702. [DOI] [PubMed] [Google Scholar]
- Lee J. S. M.; Cooper A. I. Advances in Conjugated Microporous Polymers. Chem. Rev. 2020, 120, 2171–2214. 10.1021/acs.chemrev.9b00399. [DOI] [PMC free article] [PubMed] [Google Scholar]
- Sprick R. S.; Bonillo B.; Clowes R.; Guiglion P.; Brownbill N. J.; Slater B. J.; Blanc F.; Zwijnenburg M. A.; Adams D. J.; Cooper A. I. Visible-Light-Driven Hydrogen Evolution Using Planarized Conjugated Polymer Photocatalysts. Angew. Chem., Int. Ed. 2016, 55, 1792–1796. 10.1002/anie.201510542. [DOI] [PMC free article] [PubMed] [Google Scholar]
- Sachs M.; Sprick R. S.; Pearce D.; Hillman S. A. J.; Monti A.; Guilbert A. A. Y.; Brownbill N. J.; Dimitrov S.; Shi X.; Blanc F.; Zwijnenburg M. A.; Nelson J.; Durrant J. R.; Cooper A. I. Understanding Structure-Activity Relationships in Linear Polymer Photocatalysts for Hydrogen Evolution. Nat. Commun. 2018, 9, 4968 10.1038/s41467-018-07420-6. [DOI] [PMC free article] [PubMed] [Google Scholar]
- Bai Y.; Wilbraham L.; Slater B. J.; Zwijnenburg M. A.; Sprick R. S.; Cooper A. I. Accelerated Discovery of Organic Polymer Photocatalysts for Hydrogen Evolution from Water through the Integration of Experiment and Theory. J. Am. Chem. Soc. 2019, 141, 9063–9071. 10.1021/jacs.9b03591. [DOI] [PMC free article] [PubMed] [Google Scholar]
- Tseng P.-J. J.; Chang C.-L. L.; Chan Y.-H. H.; Ting L.-Y. Y.; Chen P.-Y. Y.; Liao C.-H. H.; Tsai M.-L. L.; Chou H.-H. H. Design and Synthesis of Cycloplatinated Polymer Dots as Photocatalysts for Visible Light-Driven Hydrogen Evolution. ACS Catal. 2018, 8, 7766–7772. 10.1021/acscatal.8b01678. [DOI] [Google Scholar]
- Matsuoka S.; Fujii H.; Yamada T.; Pac C.; Ishida A.; Takamuku S.; Kusaba M.; Nakashima N.; Yanagida S. Photocatalysis of Oligo(p-Phenylenes). Photoreductive Production of Hydrogen and Ethanol in Aqueous Triethylamine. J. Phys. Chem. A. 1991, 95, 5802–5808. 10.1021/j100168a018. [DOI] [Google Scholar]
- Kosco J.; Bidwell M.; Cha H.; Martin T.; Howells C. T.; Sachs M.; Anjum D. H.; Gonzalez Lopez S.; Zou L.; Wadsworth A.; Zhang W.; Zhang L.; Tellam J.; Sougrat R.; Laquai F.; DeLongchamp D. M.; Durrant J. R.; McCulloch I. Enhanced Photocatalytic Hydrogen Evolution from Organic Semiconductor Heterojunction Nanoparticles. Nat. Mater. 2020, 19, 559–565. 10.1038/s41563-019-0591-1. [DOI] [PMC free article] [PubMed] [Google Scholar]
- Vogel A.; Forster M.; Wilbraham L.; Smith C. L.; Cowan A. J.; Zwijnenburg M. A.; Sprick R. S.; Cooper A. I. Photocatalytically Active Ladder Polymers. Faraday Discuss. 2019, 215, 84–97. 10.1039/C8FD00197A. [DOI] [PMC free article] [PubMed] [Google Scholar]
- Bi J.; Fang W.; Li L.; Wang J.; Liang S.; He Y.; Liu M.; Wu L. Covalent Triazine-Based Frameworks as Visible Light Photocatalysts for the Splitting of Water. Macromol. Rapid Commun. 2015, 36, 1799–1805. 10.1002/marc.201500270. [DOI] [PubMed] [Google Scholar]
- Wang K.; Yang L.; Wang X.; Guo L.; Cheng G.; Zhang C.; Jin S.; Tan B.; Cooper A. Covalent Triazine Frameworks via a Low Temperature Polycondensation Approach. Angew. Chem., Int. Ed. 2017, 56, 14149–14153. 10.1002/anie.201708548. [DOI] [PMC free article] [PubMed] [Google Scholar]
- Guo L.; Niu Y.; Razzaque S.; Tan B.; Jin S. Design of D–A1–A2 Covalent Triazine Frameworks via Copolymerization for Photocatalytic Hydrogen Evolution. ACS Catal. 2019, 9, 9438–9445. 10.1021/acscatal.9b01951. [DOI] [Google Scholar]
- Meier C. B.; Clowes R.; Berardo E.; Jelfs K. E.; Zwijnenburg M. A.; Sprick R. S.; Cooper A. I. Structurally Diverse Covalent Triazine-Based Framework Materials for Photocatalytic Hydrogen Evolution from Water. Chem. Mater. 2019, 31, 8830–8838. 10.1021/acs.chemmater.9b02825. [DOI] [PMC free article] [PubMed] [Google Scholar]
- Banerjee T.; Haase F.; Savasci G.; Gottschling K.; Ochsenfeld C.; Lotsch B. V. Single-Site Photocatalytic H2 Evolution from Covalent Organic Frameworks with Molecular Cobaloxime Co-Catalysts. J. Am. Chem. Soc. 2017, 139, 16228–16234. 10.1021/jacs.7b07489. [DOI] [PMC free article] [PubMed] [Google Scholar]
- Vyas V. S.; Haase F.; Stegbauer L.; Savasci G.; Podjaski F.; Ochsenfeld C.; Lotsch B. V. A Tunable Azine Covalent Organic Framework Platform for Visible Light-Induced Hydrogen Generation. Nat. Commun. 2015, 6, 8508 10.1038/ncomms9508. [DOI] [PMC free article] [PubMed] [Google Scholar]
- Pachfule P.; Acharjya A.; Roeser J.; Langenhahn T.; Schwarze M.; Schomäcker R.; Thomas A.; Schmidt J. Diacetylene Functionalized Covalent Organic Framework (COF) for Photocatalytic Hydrogen Generation. J. Am. Chem. Soc. 2018, 140, 1423–1427. 10.1021/jacs.7b11255. [DOI] [PubMed] [Google Scholar]
- Aitchison C. M.; Kane C. M.; McMahon D. P.; Spackman P. R.; Pulido A.; Wang X.; Wilbraham L.; Chen L.; Clowes R.; Zwijnenburg M. A.; Sprick R. S.; Little M. A.; Day G. M.; Cooper A. I. Photocatalytic Proton Reduction by a Computationally Identified, Molecular Hydrogen-Bonded Framework. J. Mater. Chem. A 2020, 8, 7158–7170. 10.1039/D0TA00219D. [DOI] [Google Scholar]
- Yang X.; Hu Z.; Yin Q.; Shu C.; Jiang X. X. F.; Zhang J.; Wang X.; Jiang J. X.; Huang F.; Cao Y.; Yin Q.; Cao Y.; Shu C.; Wang X.; Huang F.; Yang X.; Hu Z.; Jiang X. X. F.; Yin Q.; Shu C.; Jiang X. X. F.; Zhang J.; Wang X.; Jiang J. X.; Huang F.; Cao Y. Water-Soluble Conjugated Molecule for Solar-Driven Hydrogen Evolution from Salt Water. Adv. Funct. Mater. 2019, 29, 1–9. 10.1002/adfm.201808156. [DOI] [Google Scholar]
- Zhang G.; Lin L.; Li G.; Zhang Y.; Savateev A.; Zafeiratos S.; Wang X.; Antonietti M. Ionothermal Synthesis of Triazine-Heptazine-Based Copolymers with Apparent Quantum Yields of 60% at 420 Nm for Solar Hydrogen Production from “Sea Water.”. Angew. Chem. 2018, 130, 9516–9520. 10.1002/ange.201804702. [DOI] [PubMed] [Google Scholar]
- Bai Y.; Woods D. J.; Wilbraham L.; Aitchison C. M.; Zwijnenburg M. A.; Sprick R. S.; Cooper A. I. Hydrogen Evolution from Water Using Heteroatom Substituted Fluorene Conjugated Co-Polymers. J. Mater. Chem. A 2020, 8, 8700–8705. 10.1039/d0ta02599b. [DOI] [Google Scholar]
- Wang Q.; Domen K. Particulate Photocatalysts for Light-Driven Water Splitting: Mechanisms, Challenges, and Design Strategies. Chem. Rev. 2020, 22, 919–985. 10.1021/acs.chemrev.9b00201. [DOI] [PubMed] [Google Scholar]
- Wang Y.; Vogel A.; Sachs M.; Sprick R. S.; Wilbraham L.; Moniz S. J. A.; Godin R.; Zwijnenburg M. A.; Durrant J. R.; Cooper A. I.; Tang J. Current Understanding and Challenges of Solar-Driven Hydrogen Generation Using Polymeric Photocatalysts. Nat. Energy 2019, 4, 746–760. 10.1038/s41560-019-0456-5. [DOI] [Google Scholar]
- Sprick R. S.; Aitchison C. M.; Berardo E.; Turcani L.; Wilbraham L.; Alston B. M.; Jelfs K. E.; Zwijnenburg M. A.; Cooper A. I. Maximising the Hydrogen Evolution Activity in Organic Photocatalysts by Co-Polymerisation. J. Mater. Chem. A 2018, 6, 11994–12003. 10.1039/C8TA04186E. [DOI] [Google Scholar]
- Kochergin Y. S.; Schwarz D.; Acharjya A.; Ichangi A.; Kulkarni R.; Eliášová P.; Vacek J.; Schmidt J.; Thomas A.; Bojdys M. J. Exploring the “Goldilocks Zone” of Semiconducting Polymer Photocatalysts by Donor-Acceptor Interactions. Angew. Chem., Int. Ed. 2018, 57, 14188–14192. 10.1002/anie.201809702. [DOI] [PubMed] [Google Scholar]
- Yang H.; Li X.; Sprick R. S.; Cooper A. I. Conjugated Polymer Donor–Molecular Acceptor Nanohybrids for Photocatalytic Hydrogen Evolution. Chem. Commun. 2020, 56, 6790–6793. 10.1039/D0CC00740D. [DOI] [PubMed] [Google Scholar]
- Wang X.; Chen L.; Chong S. Y.; Little M. A.; Wu Y.; Zhu W.-H.; Clowes R.; Yan Y.; Zwijnenburg M. A.; Sprick R. S.; Cooper A. I. Sulfone-Containing Covalent Organic Frameworks for Photocatalytic Hydrogen Evolution from Water. Nat. Chem. 2018, 10, 1180–1189. 10.1038/s41557-018-0141-5. [DOI] [PubMed] [Google Scholar]
- Schwinghammer K.; Hug S.; Mesch M. B.; Senker J.; Lotsch B. V. Phenyl-Triazine Oligomers for Light-Driven Hydrogen Evolution. Energy Environ. Sci. 2015, 8, 3345–3353. 10.1039/C5EE02574E. [DOI] [Google Scholar]
- Lau V. W. H.; Mesch M. B.; Duppel V.; Blum V.; Senker J.; Lotsch B. V. Low-Molecular-Weight Carbon Nitrides for Solar Hydrogen Evolution. J. Am. Chem. Soc. 2015, 137, 1064–1072. 10.1021/ja511802c. [DOI] [PubMed] [Google Scholar]
- Sprick R. S.; Cheetham K. J.; Bai Y.; Alves Fernandes J.; Barnes M.; Bradley J. W.; Cooper A. I. Polymer Photocatalysts with Plasma-Enhanced Activity. J. Mater. Chem. A 2020, 8, 7125–7129. 10.1039/D0TA01200A. [DOI] [Google Scholar]
- Li L.; Lo W. Y.; Cai Z.; Zhang N.; Yu L. Donor-Acceptor Porous Conjugated Polymers for Photocatalytic Hydrogen Production: The Importance of Acceptor Comonomer. Macromolecules 2016, 49, 6903–6909. 10.1021/acs.macromol.6b01764. [DOI] [Google Scholar]
- Lin K.; Wang Z.; Hu Z.; Luo P.; Yang X.; Zhang X.; Rafiq M.; Huang F.; Cao Y. Amino-Functionalised Conjugated Porous Polymers for Improved Photocatalytic Hydrogen Evolution. J. Mater. Chem. A 2019, 19087–19093. 10.1039/c9ta06219j. [DOI] [Google Scholar]
- Hu Z.; Wang Z.; Zhang X.; Tang H.; Liu X.; Huang F.; Cao Y. Conjugated Polymers with Oligoethylene Glycol Side Chains for Improved Photocatalytic Hydrogen Evolution. iScience 2019, 13, 33–42. 10.1016/j.isci.2019.02.007. [DOI] [PMC free article] [PubMed] [Google Scholar]
- Woods D. J.; Hillman S.; Pearce D.; Wilbraham L.; Flagg L.; Duffy W.; Mcculloch I.; Durrant J.; Guilbert A.; Zwijnenburg M.; Sprick R. S.; Nelson J.; Cooper A. Side-Chain Tuning in Conjugated Polymer Photocatalysts for Improved Hydrogen Production from Water. Energy Environ. Sci. 2020, 13, 1843–1855. 10.1039/D0EE01213K. [DOI] [Google Scholar]
- Jiang J. X.; Su F.; Trewin A.; Wood C. D.; Campbell N. L.; Niu H.; Dickinson C.; Ganin A. Y.; Rosseinsky M. J.; Khimyak Y. Z.; Cooper A. I. Conjugated Microporous Poly(Aryleneethynylene) Networks. Angew. Chem., Int. Ed. 2007, 46, 8574–8578. 10.1002/anie.200701595. [DOI] [PubMed] [Google Scholar]
- Cooper A. I. Conjugated Microporous Polymers. Adv. Mater. 2009, 21, 1291–1295. 10.1002/adma.200801971. [DOI] [Google Scholar]
- Xu Y.; Jin S.; Xu H.; Nagai A.; Jiang D. Chemical Society Reviews Conjugated Microporous Polymers: Design, Synthesis and Application. Chem. Soc. Rev 2013, 42, 7965–8178. 10.1039/c3cs60160a. [DOI] [PubMed] [Google Scholar]
- Sprick R. S.; Bai Y.; Guilbert A. A. Y.; Zbiri M.; Aitchison C. M.; Wilbraham L.; Yan Y.; Woods D. J.; Zwijnenburg M. A.; Cooper A. I. Photocatalytic Hydrogen Evolution from Water Using Fluorene and Dibenzothiophene Sulfone-Conjugated Microporous and Linear Polymers. Chem. Mater. 2019, 31, 305–313. 10.1021/acs.chemmater.8b02833. [DOI] [Google Scholar]
- Xu Y.; Mao N.; Feng S.; Zhang C.; Wang F.; Chen Y.; Zeng J.; Jiang J.-X. Perylene-Containing Conjugated Microporous Polymers for Photocatalytic Hydrogen Evolution. Macromol. Chem. Phys. 2017, 218, 1700049 10.1002/macp.201700049. [DOI] [Google Scholar]
- Yu J.; Sun X.; Xu X.; Zhang C.; He X. Donor-Acceptor Type Triazine-Based Conjugated Porous Polymer for Visible-Light-Driven Photocatalytic Hydrogen Evolution. Appl. Catal., B 2019, 257, 117935 10.1016/j.apcatb.2019.117935. [DOI] [Google Scholar]
- Guilbert A. A. Y.; Zbiri M.; Finn P. A.; Jenart M.; Fouquet P.; Cristiglio V.; Frick B.; Nelson J.; Nielsen C. B. Mapping Microstructural Dynamics up to the Nanosecond of the Conjugated Polymer P3HT in the Solid State. Chem. Mater. 2019, 31, 9635–9651. 10.1021/acs.chemmater.9b02904. [DOI] [Google Scholar]
- Wagemaker M.; Kearley G. J.; Van Well A. A.; Mutka H.; Mulder F. M. Multiple Li Positions inside Oxygen Octahedra in Lithiated TiO2 Anatase. J. Am. Chem. Soc. 2003, 125, 840–848. 10.1021/ja028165q. [DOI] [PubMed] [Google Scholar]
- Rosenbach N.; Jobic H.; Ghoufi A.; Salles F.; Maurin G.; Bourrelly S.; Llewellyn P. L.; Devic T.; Serre C.; Férey G. Quasi-Elastic Neutron Scattering and Molecular Dynamics Study of Methane Diffusion in Metal Organic Frameworks MIL-47(V) and MIL-53(Cr). Angew. Chem., Int. Ed. 2008, 47, 6611–6615. 10.1002/anie.200801748. [DOI] [PubMed] [Google Scholar]
- Pham T.; Forrest K. A.; Mostrom M.; Hunt J. R.; Furukawa H.; Eckert J.; Space B. The Rotational Dynamics of H 2 Adsorbed in Covalent Organic Frameworks. Phys. Chem. Chem. Phys. 2017, 19, 13075–13082. 10.1039/C7CP00924K. [DOI] [PubMed] [Google Scholar]
- Ruffle S. V.; Michalarias I.; Li J.-C.; Ford R. C. Inelastic Incoherent Neutron Scattering Studies of Water Interacting with Biological Macromolecules. J. Am. Chem. Soc. 2002, 124, 565–569. 10.1021/ja016277w. [DOI] [PubMed] [Google Scholar]
- Liu M.; Chen L.; Lewis S.; Chong S. Y.; Little M. A.; Hasell T.; Aldous I. M.; Brown C. M.; Smith M. W.; Morrison C. A.; Hardwick L. J.; Cooper A. I. Three-Dimensional Protonic Conductivity in Porous Organic Cage Solids. Nat. Commun. 2016, 7, 12750 10.1038/ncomms12750. [DOI] [PMC free article] [PubMed] [Google Scholar]
- A Generalized Density of States (GDOS) Is the Phonon Spectrum Measured from Inelastic Neutron Scattering (INS). In Contrast to the Vibrational Density of States, the GDOS Involves a Weighting of the Scatterers (Atoms) with Their Scattering Powers σ/M (σ: cross section, M: mass). These are presently for various atoms in the units of barns.amu–1: H, 81.37; D, 3.8; C, 0.46; O, 0.2645; and S, 0.032.
- Sjolander A. Multi-phonon processes in slow neutron scattering by Crystals. Ark. Fys. 1958, 14, 1958. [Google Scholar]
- Squires L. G.Introduction to the Theory of Thermal Neutron Scattering; Dover Publications, 1996. [Google Scholar]
- Sköld K.; Price D. L.. Neutron Scattering; Sköld K.; Price D. L., Eds.; Methods in Experimental Physics; Academic Press, 1986; Vol. 23. https://doi.org/10.1016/S0076-695X(08)60552-9. [Google Scholar]
- Cygan R. T.; Daemen L. L.; Ilgen A. G.; Krumhansl J. L.; Nenoff T. M. Inelastic Neutron Scattering and Molecular Simulation of the Dynamics of Interlayer Water in Smectite Clay Minerals. J. Phys. Chem. C 2015, 119, 28005–28019. 10.1021/acs.jpcc.5b08838. [DOI] [Google Scholar]
- Gong K.; Cheng Y.; Daemen L. L.; White C. E. In Situ Quasi-Elastic Neutron Scattering Study on the Water Dynamics and Reaction Mechanisms in Alkali-Activated Slags. Phys. Chem. Chem. Phys. 2019, 21, 10277–10292. 10.1039/c9cp00889f. [DOI] [PubMed] [Google Scholar]
- Li J.; Ross D. K. Evidence for Two Kinds of Hydrogen Bond in Ice. Nature 1993, 365, 327–329. 10.1038/365327a0. [DOI] [Google Scholar]
- Ockwig N. W.; Cygan R. T.; Hartl M. A.; Daemen L. L.; Nenoff T. M. Incoherent Inelastic Neutron Scattering Studies of Nanoconfined Water in Clinoptilolite and Heulandite Zeolites. J. Phys. Chem. C 2008, 112, 13629–13634. 10.1021/jp803770v. [DOI] [PubMed] [Google Scholar]
- Teixeira J.; Bellissent-Funel M.-C.; Chen S. H.; Dianoux A. J. Experimental Determination of the Nature of Diffusive Motions of Water Molecules at Low Temperatures. Phys. Rev. A 1985, 31, 1913–1917. 10.1103/PhysRevA.31.1913. [DOI] [PubMed] [Google Scholar]
- Sears V. F. Theory of cold neutron scattering by homonuclear diatomic liquids: I. Free rotation. Can. J. Phys. 1966, 44, 1279–1297. 10.1139/p66-108. [DOI] [Google Scholar]
- Sears V. F. Theory of cold neutron scattering by homonuclear diatomic liquids: II. Hindered rotation. Can. J. Phys. 1966, 44, 1299–1311. 10.1139/p66-109. [DOI] [Google Scholar]
- Bee M.Quasielastic Neutron Scattering; Adam Hilger: United Kingdom, 1988. [Google Scholar]
Associated Data
This section collects any data citations, data availability statements, or supplementary materials included in this article.


