

Abstract
Stem cells need to be protected from genotoxic and proteotoxic stress to maintain a healthy pool throughout life1–3. Little is known about the proteostasis mechanism that safeguards the stem cells. Here, we report Endoplasmic Reticulum-Associated Degradation (ERAD) as a protein quality checkpoint that controls hematopoietic stem cell (HSC)-niche interaction and determines the fate of HSC. SEL1L-HRD1 complex, the most conserved branch of ERAD4, is highly expressed in HSC. Deletion of Sel1l led to niche displacement of HSC, complete loss of HSC identity, and allowed highly efficient donor-HSC engraftment without irradiation. Mechanistic studies identified MPL, the master regulator of HSC identity5, as a bona-fide ERAD substrate that became aggregated in the ER upon ERAD deficiency. Restoration of MPL signaling with an agonist partially rescued the number and reconstitution capacity of Sel1l-deficient HSCs. Our study defines ERAD as an essential proteostasis mechanism to safeguard a healthy stem cell pool through regulating the stem cell-niche interaction.
Our analysis revealed that the expression of ERAD pathway components was markedly enriched in mouse long-term repopulating HSCs6, 7 (LT-HSCs; Fig. 1a, b and Extended Data Fig. 1 and 2). ERAD is the principal protein quality control machinery responsible for targeting misfolded proteins in the ER for cytosolic proteasomal degradation4. The SEL1L-HRD1 complex, which consists of the E3 ubiquitin ligase HRD1 and its adaptor protein SEL1L, is the most conserved branch of ERAD4.
Figure 1 |. SEL1L is highly expressed and required for the steady-state HSC.
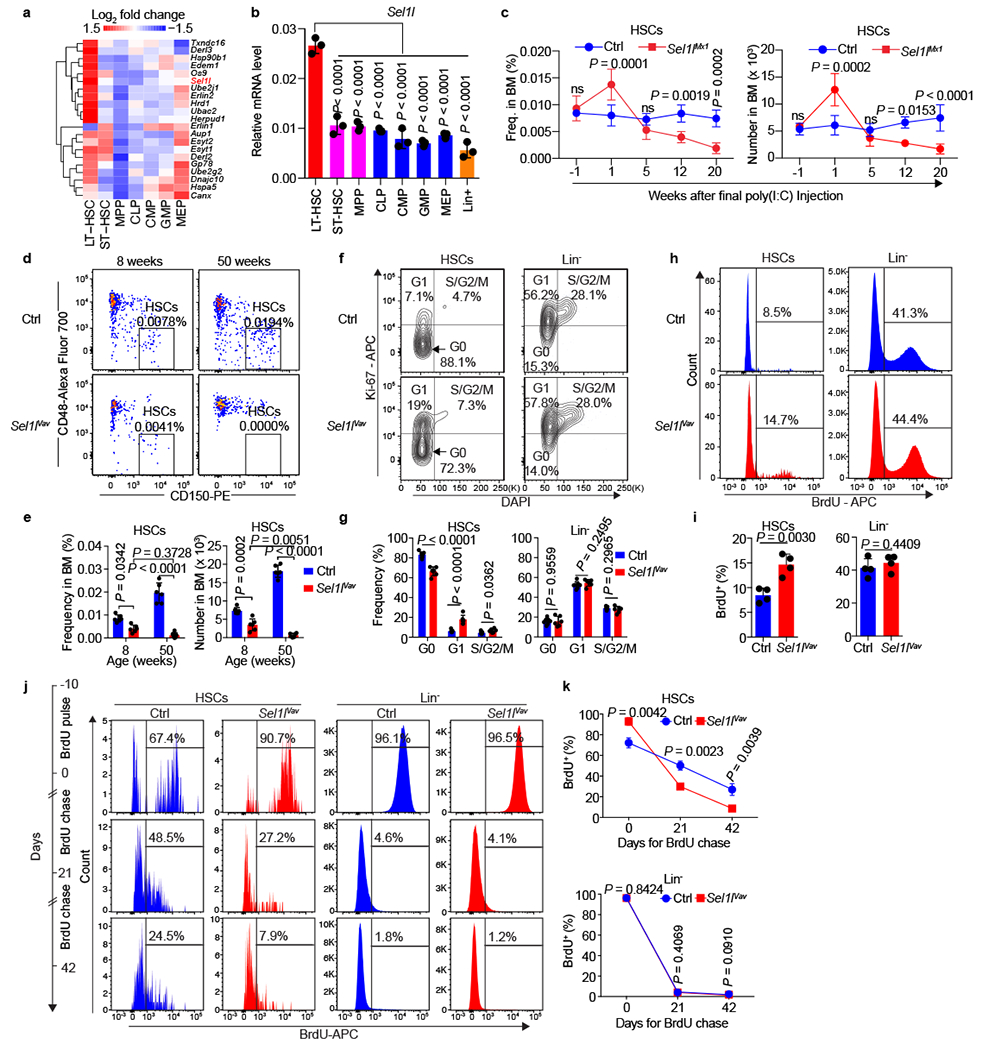
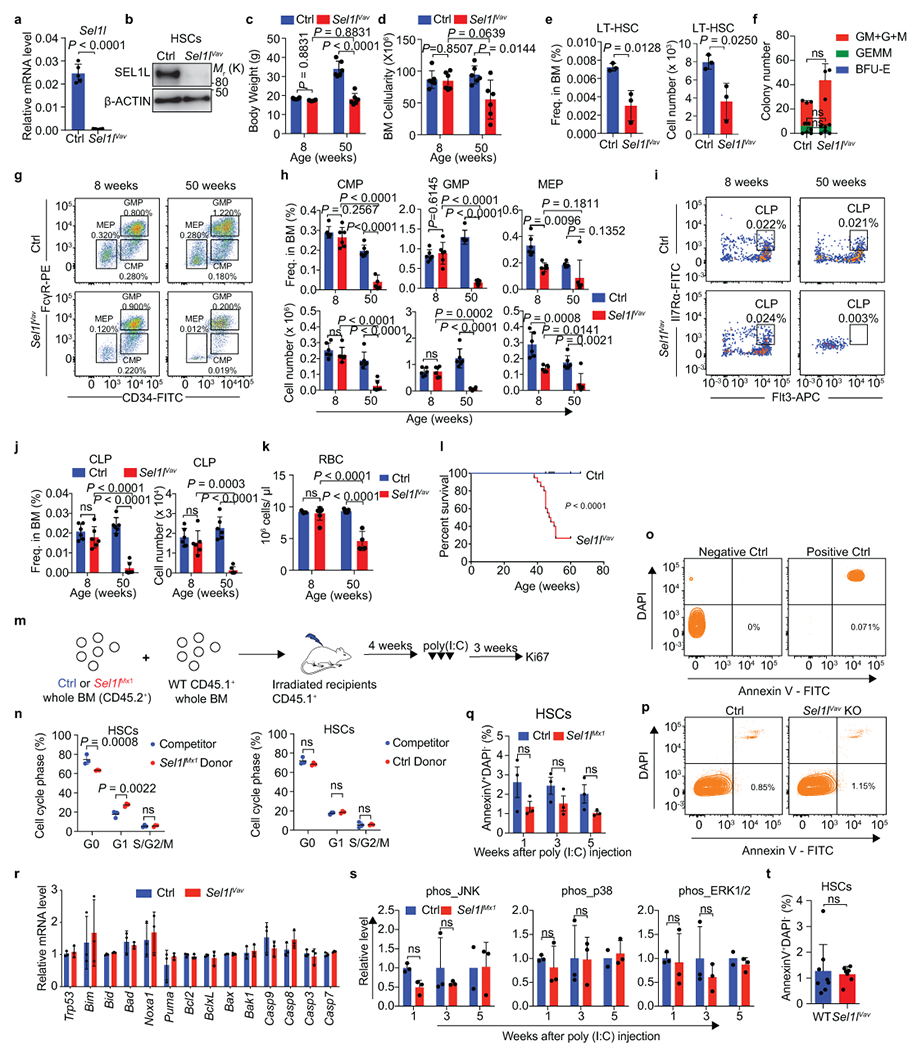
a, Heatmap showing the expression profile of ERAD-related genes in mouse HSCs and progenitor cells. LT-HSC: long-term HSC (LSK CD34−Flk2−); ST-HSC: short-term HSC (LSK CD34+Flk2−); MPP: multipotent progenitors (LSK CD34+Flk2+); CLP: common lymphoid progenitors (Lin−Sca-1lowc-KitlowFlk2+IL7Rα+); CMP: common myeloid progenitors (LS-K CD34+FcγR−); GMP: granulocyte/macrophage progenitors (LS-K CD34+FcγR+); MEP: megakaryocytic/erythroid progenitors (LS-K CD34−FcγR−). Data are extracted from GSE60101. b, Quantitative RT-PCR analysis of Sel1l expression in mouse HSCs and progenitors. Data are presented relative to Gapdh. n = 3. c, Frequency and absolute number of HSCs (LSK CD150+CD48−) in the bone marrow (BM) of control (Ctrl, Sel1lflox/flox) and Sel1lMx1 KO (Sel1lflox/flox; Mx1-Cre) mice at different time points after final poly(I:C) injection, −1 indicates 1 week before poly (I:C) injection. Ctrl: n = 4 for time points −1 and 1, n = 5 for the other time points; Sel1lMx1: n = 4. d, e, Representative pseudo color dot plots (d) and quantification (e) of HSCs frequency and number in 8-week-old and 50-week-old control (Ctrl, Sel1lflox/flox) or Sel1lVav KO (Sel1lflox/flox; Vav-icre) mice. n = 6. f, g, Cell cycle analysis of HSCs and Lin− cells in 8-week-old Ctrl and Sel1lVav KO mice using Ki67 and DAPI. Representative flow cytometry plots (f) and quantification (g) are shown. Ctrl: n = 7; Sel1lVav: n = 6. h, i, BrdU incorporation in HSCs and Lin− cells from 8-week-old Ctrl or Sel1lVav KO mice. Representative flow cytometry plots (h) and quantification (i) of the BrdU+ HSCs or Lin− cells are shown. n = 4. j, k, Schematic diagram of the BrdU label retention assay, representative flow cytometry plots (j) and quantification (k) of BrdU+ HSCs and Lin− cells from Ctrl or Sel1lVav KO BM at indicated time points. Ctrl-Day42: n = 4; all the others: n = 3. n means independent mice. One-way ANOVA (b), two-tailed Student’s t-tests (g, i) or two-way ANOVA (c, e, k) was used to calculate P values. Results are shown as mean ± s.d. ns, not significant. Statistical information is provided as source data.
We generated an inducible knockout mouse model Sel1lflox/flox/Mx1-cre (Sel1lMx1-KO) to delete Sel1l from hematopoietic cells via injections of polyinosinic-polycytidylic acid (poly(I:C)). Sel1l depletion had little acute effect on the BM cellularity (Extended Data Fig. 3a, b). Serial analysis of HSCs revealed that Sel1l depletion led to progressive decline of steady-state HSCs after transient expansion at 1-week (Fig. 1c). The committed progenitors and the mature cells in BM also progressively declined with Sel1l deletion (Extended Data Fig. 3c–f). As a consequence, Sel1l-KO led to anemia 30 weeks after poly(I:C) injection (Extended Data Fig. 3g–n).
We also generated Sel1lflox/flox/Vav-icre (Sel1lVav-KO) mice. Deletion of Sel1l in Sel1lVav-KO mice had little effect on the body weight and BM cellularity of 8-week-old mice (Extended Data Fig. 4a–d), but substantially reduced the steady-state HSCs compared to control littermates (Fig. 1d, e and Extended Data Fig. 4e). In contrast, Sel1l deletion did not impair the in vitro colony-forming activity of progenitors from 8-week-old mice (Extended Data Fig. 4f). In 50-week-old Sel1lVav-KO mice, more than 95% of HSCs, as well as the committed progenitors, were lost in the BM compared with control littermates (Fig. 1d, e, and Extended Data Fig. 4g–j). As a consequence, Sel1l deletion led to anemia and early lethality (Extended Data Fig. 4k, l). These data demonstrate that Sel1l deletion leads to HSC exhaustion, indicating that SEL1L is indispensable for the maintenance of steady-state HSCs.
Cell cycle analysis showed that Sel1l deletion led to decreased HSCs in G0 and increased the proportion of HSCs in G1 (Fig. 1f, g). Sel1lVav-KO HSCs also exhibited a significant increase in 5-bromodeoxyuridine (BrdU) incorporation, compared to those from control littermates (Fig. 1h, i). BM chimera experiments confirmed an increased proliferation of donor-derived Sel1lMx1-KO HSCs as compared with that of competitor wild-type (WT) HSCs in the same BM (Extended Data Fig. 4m, n), indicating that the increased proliferation of Sel1l-deficient HSCs is due to cell intrinsic defect. Detection of long-lived quiescent HSCs with a BrdU label-retention assay showed that BrdU labeling decreased much faster in Sel1lVav-KO HSCs compared to control littermates (Fig. 1j, k). In contrast, we did not observe differences in lineage-negative BM cells (Fig. 1f–k). These data suggest that Sel1l loss caused an increase in HSC division with a concomitant loss of quiescence. Sel1l-deficiency did not induce apoptosis or mitogen-activated protein kinase (MAPK) signaling that drives ER-stress induced cell death8 in Sel1lMx1-KO or Sel1lVav-KO HSCs (Extended Data Fig. 4o–t). Collectively, these data demonstrate that SEL1L is required for the maintenance of HSC quiescence.
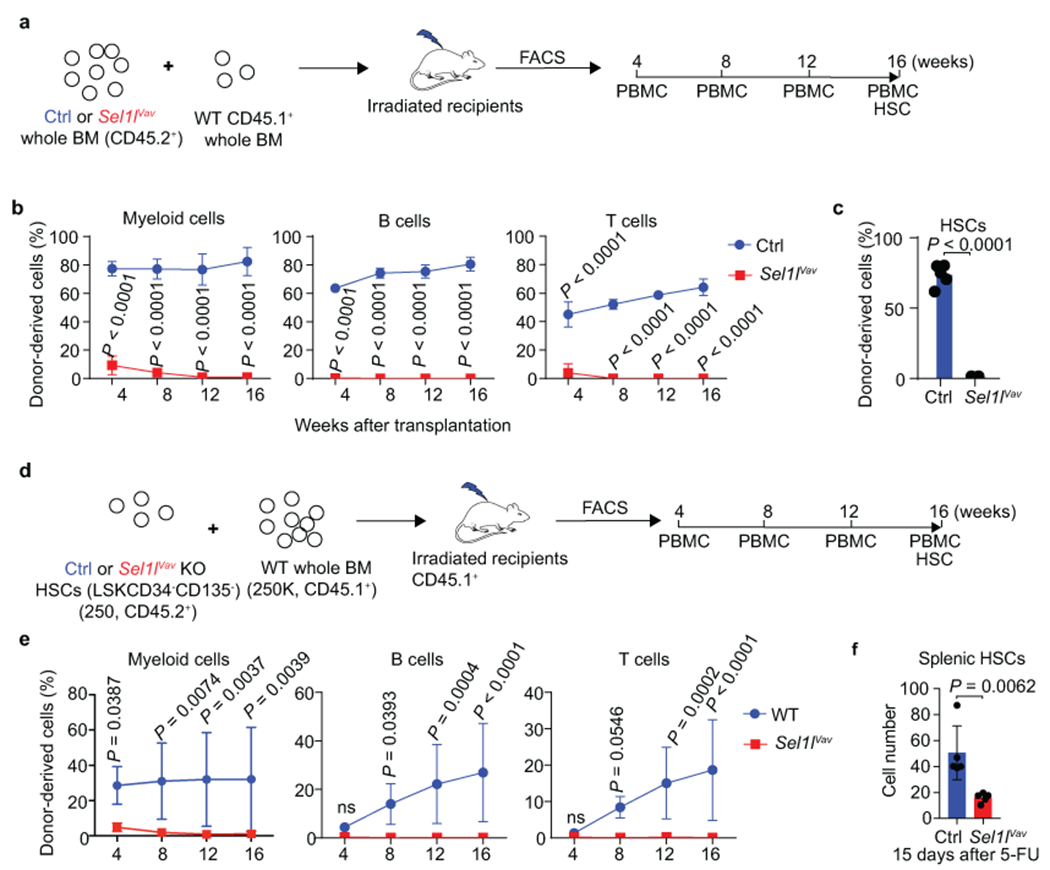
To understand the impact of SEL1L on HSC competitiveness under hematological stress, we transplanted whole bone marrow (WBM) cells, purified SLAM HSCs or LT-HSCs obtained from Sel1lflox/flox or Sel1lVav-KO mice into irradiated recipient mice together with competitor WBM cells. Sel1lVav-KO HSCs completely lost the reconstitution activity (Fig. 2a–c and Extended Data Fig. 5). No donor-derived Sel1lVav-KO HSCs were detected in the BM of recipient mice. Furthermore, we allowed the untreated control or Sel1lMx1 donor WBM cells to stably engraft in irradiated recipient mice for 4 weeks before injection of poly(I:C) (Fig. 2d). Deletion of Sel1l in reconstituted recipient mice resulted in rapid and almost complete loss of HSC competitiveness (Fig. 2e). Very few donor-derived Sel1lMx1-KO HSCs were recovered from the BM of recipient mice (Fig. 2f). These data demonstrate that SEL1L is essential for the competitiveness of HSCs under hematological stress.
Figure 2 |. SEL1L is required for HSC regenerative potential under hematopoietic stress.
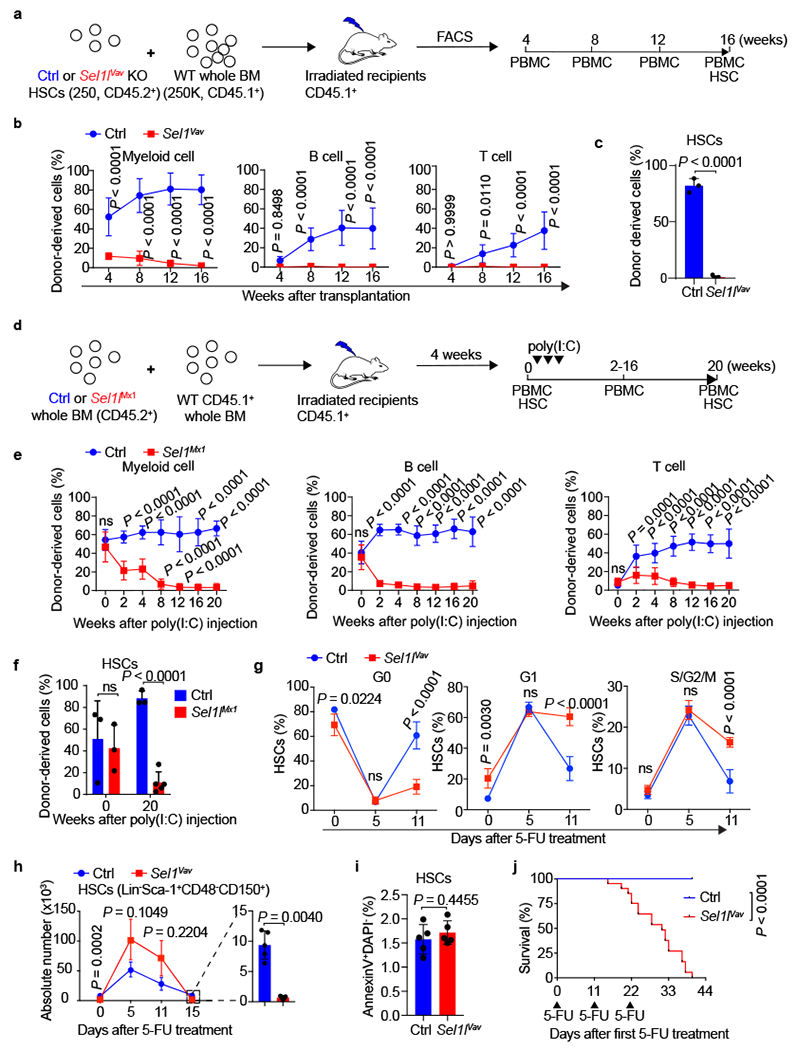
a, Schematic depiction of the competitive bone marrow transplantation (BMT) experiment using sorted HSCs (LSK CD150+CD48−) from control (Ctrl) or Sel1lVav KO mice as donor. b, Percentage of Ctrl or Sel1lVav KO donor-derived cells in the peripheral blood of recipient mice at indicated time points. n = 8. c, Percentage of Ctrl or Sel1lVav KO donor derived HSCs in the BM of recipient mice 16 weeks after transplantation. n = 3. d, Schematic depiction of the competitive BMT experiment using BM cells from Ctrl or Sel1lMx1 mice. Poly(I:C) was injected 4 weeks after transplantation. e, Percentage of Ctrl or Sel1lMx1 donor-derived cells in the peripheral blood of recipient mice at indicated time points. Ctrl: week 0 and 20, n = 3; week 2–16, n = 6. Sel1lMx1: week 0, n = 3; week 2–16, n = 8; week 20: n = 5. f, Percentage of Ctrl or Sel1lMx1 donor-derived HSCs in the BM of recipient mice at indicated time points. Week 0, n = 3; Week 20, Ctrl: n = 3; Sel1lMx1: n = 5. g, h, Percentage of Ctrl or Sel1lVav KO HSCs (Lin−Sca-1+CD48−CD150+) in G0, G1 and S/G2/M phases of cell cycle and HSCs number at indicated time points after single 5-FU treatment. Day 0: n = 4; Day 5: n = 5; Day 11: Ctrl, n = 3, Sel1lVav KO, n = 4; Day 15: n = 5. i, Percentage of apoptotic HSCs in the BM of Ctrl or Sel1lVav KO mice 15 days after single 5-FU treatment. n = 5. j, Kaplan-Meier survival plot of Ctrl or Sel1lVav KO mice treated with 3 doses of 5-FU. Ctrl: n = 18; Sel1lVav KO: n = 20. Arrows indicate 5-FU injections. n means independent mice. Two-way ANOVA (b, e-g, h) with Bonferroni test, two-tailed Student’s t-tests (c, i) or log-rank test (j) was used to calculate P values. Results are shown as mean ± s.d. ns, not significant. Statistical information is provided as source data.
In response to myeloablation agent 5-fluorouracil (5-FU), HSCs begin to proliferate, reach maximal proliferation on day 5–7, and then gradually return to quiescence9. Sel1l deletion significantly impaired the ability of HSCs to re-enter quiescence after proliferation and resulted in HSC exhuastion 15 days after 5-FU treatment (Fig. 2g, h). We did not observe increased HSC mobilization or apoptosis in the Sel1l-deficient HSCs (Fig. 2i and Extended Data Fig. 5f). Challenging the mice with three doses of 5-FU9 showed that the Sel1l-KO mice succumbed much faster than controls and did not survive 5-FU-mediated myeloablation (Fig. 2j). These data demonstrate that loss of SEL1L impairs the re-entry of HSCs into quiescence after proliferation, eventually leading to HSC exhaustion and failure to re-establish homeostasis following hematological stress.
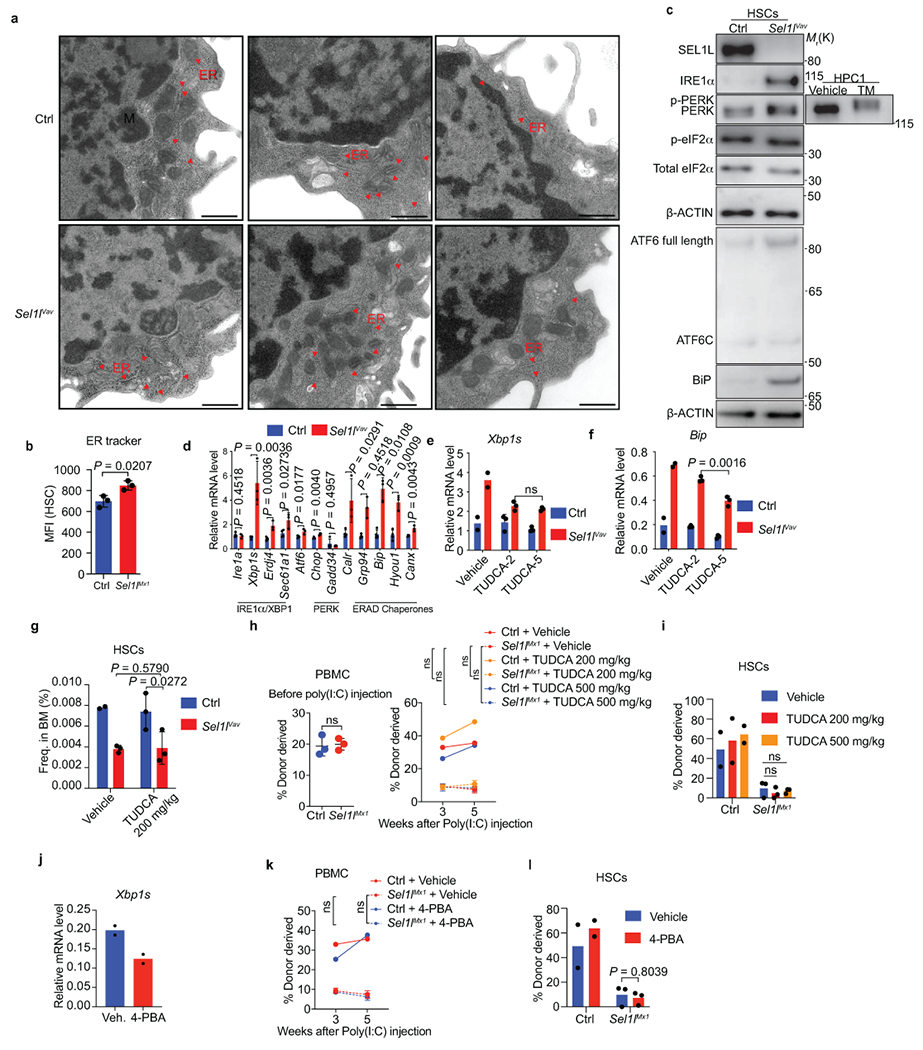
We next investigated how SEL1L regulates HSC identity. First, we asked whether loss of SEL1L induces ER stress and the unfolded protein response (UPR) that may contribute to the impairment of HSCs10–12. Transmission electron microscope analysis and quantification of ER mass showed mild ER stress in Sel1lVav-KO HSCs as compared to control cells (Extended Data Fig. 6a, b). ER stress triggers UPR that is mediated by IRE1α, ATF6, and PERK13. Consistent with an earlier study showing that IRE1α is an ERAD substrate14, we observed a significant increase in IRE1α protein levels and splicing of its substrate Xbp1 (Xbp1s) in Sel1l-KO HSCs (Extended Data Fig. 6c, d). PERK and ATF6 pathways were minimally or modestly induced upon Sel1l deletion (Extended Data Fig. 6c, d). Sel1l-deficiency in certain cell types also induces very mild ER stress, as a result of adaptation through enhanced ER-chaperone expression and UPR activation15. Accordingly, we observed a marked upregulation of the ER-chaperones in Sel1l-KO HSCs (Extended Data Fig. 6d). These data suggest that Sel1l deletion triggers mild ER stress and preferentially induces the IRE1α/XBP1 branch of UPR in HSCs.
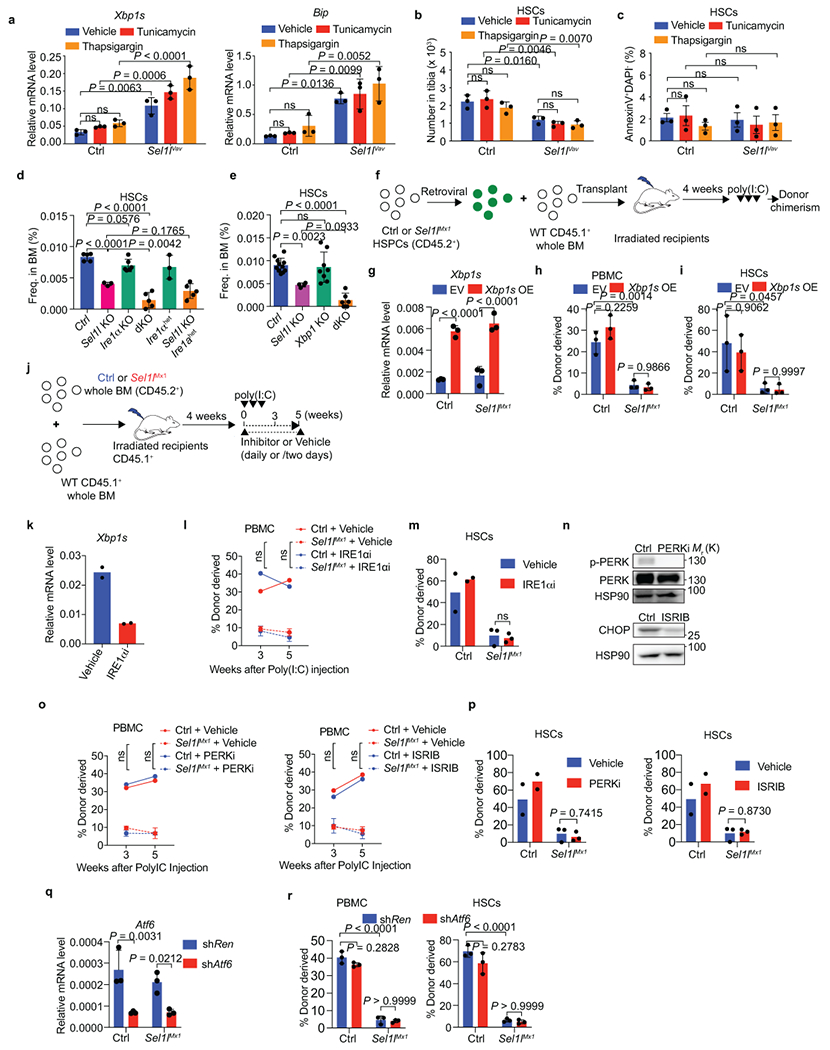
To understand whether the Sel1l loss-induced mild ER stress leads to the loss of HSC identity, we used chemical chaperones tauroursodeoxycholic acid (TUDCA) and 4-phenylbutyric acid (4-PBA)16, which enhance protein folding and alleviate ER stress (Extended Data Fig. 6e, f, j), to perform the rescue experiments. TUDCA and 4-PBA failed to rescue the steady-state HSCs and the defective reconstitution ability of Sel1l-deficient HSCs (Extended Data Fig. 6g–l). Moreover, chronic levels of ER stress induced by low doses of tunicamycin or thapsigargin did not cause phenotypes in HSCs similar to Sel1l deletion (Extended Data Fig. 7a–c). These data demonstrate that the Sel1l-KO HSC defects are not attributable to ER stress.
Next, we evaluated the contribution of the upregulated IRE1α/XBP1 pathway to the Sel1l-KO phenotypes by generating Sel1lflox/flox/Ire1αflox/flox/Vav-icre and Sel1lflox/flox/Xbp1flox/flox/Vav-icre double-KO mice. The combined deletion of Sel1l and Ire1α or Xbp1 led to a more severe HSC deficiency than Sel1l-KO alone (Extended Data Fig. 7d, e). Haploinsufficiency of Ire1α in the Sel1l-KO mice also failed to rescue the phenotype. In contrast to Sel1l-KO mice, loss of Ire1α or Xbp1 alone had no effect on HSCs (Extended Data Fig. 7d, e). Moreover, genetic and pharmacological approaches that modulate all UPR pathways or MAPK signaling, including Xbp1s overexpression, IRE1α inhibitor MKC8866, PERK inhibitor GSK2656157, eIF2α inhibitor ISRIB, Atf6 knockdown, p38 inhibitor SB202190, ERK inhibitor SCH772984 or JNK inhibitor SP6001258, 17, 18, were unable to rescue the loss of donor-derived HSCs and defective donor chimerism upon Sel1l deletion in BM transplantation assays (Extended Data Fig. 7f–r and 8). Collectively, these data demonstrate that the IRE1α/XBP1 pathway provides a protective mechanism to maintain ER homeostasis and prevent HSCs from further damage and the deleterious consequences elicited by Sel1l deletion. The Sel1l KO phenotypes are specific to ERAD and independent of ER stress or UPR.
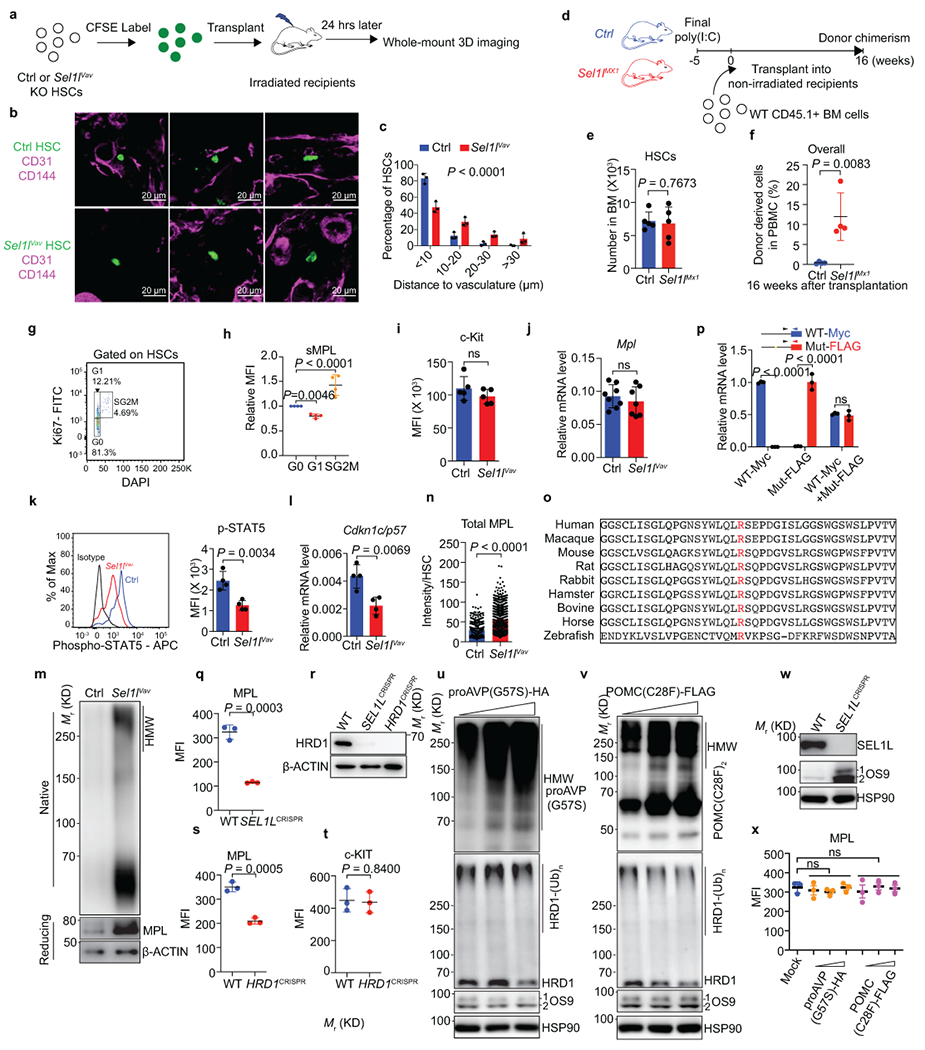
The HSC niche is a key determinant of quiescence and self-renewal5, 19. Communication between HSC and niche is mediated by surface receptors and secreted proteins that are synthesized and mature in the ER4, 20. We investigated whether Sel1l deletion compromises the post-translational maturation of the surface receptors in HSCs and thus impairs the HSC-niche interactions. Control or Sel1lVav-KO HSCs were stained with carboxyfluorescein succinimidyl ester (CFSE) and infused into the irradiated recipient mice. Sel1l-deficient HSCs were located significantly farther from the vascular cells compared to control HSCs (Extended Data Fig. 9a–c and Supplementary Video 1, 2). Whole-mount imaging of steady-state HSCs21, 22 in control or Sel1lVav-KO mice confirmed the displacement of Sel1l-KO HSCs in the BM (Fig. 3a, b).
Figure 3 |. SEL1L regulates HSC-niche interaction.
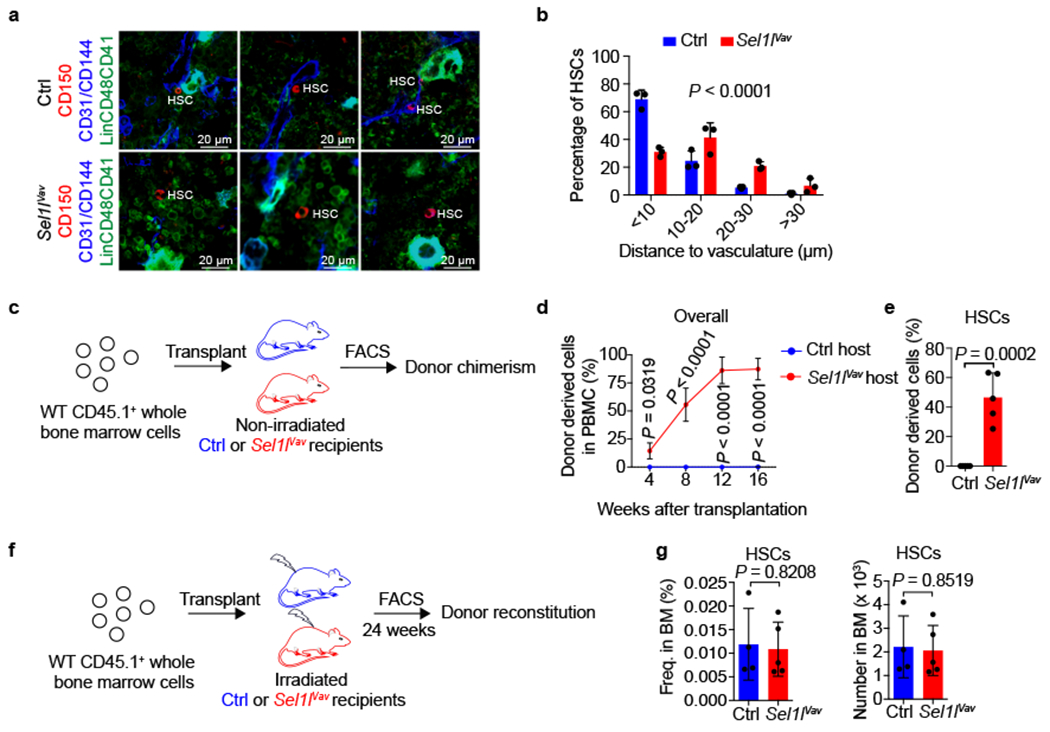
a, b, Representative 2D images (a) and quantification (b) of the distances between HSCs (CD150+Lin−CD48−CD41−, Red) and the closest vascular structure (CD31+ and/or CD144+, Blue). A total of 150 control (Ctrl) or 126 Sel1lVav KO HSCs were analyzed in n=3 independent experiments. Scale bar, 20 μm. c, Experimental schematic for non-conditioned transplantation of donor cells into congenic mice. 1 x 10⁷ CD45.1+ whole BM cells from WT mice were transplanted into non-irradiated 8-week-old CD45.2+ control (Ctrl) or Sel1lVav KO mice. d, Percentage of donor derived (CD45.1+) cells in the peripheral blood of non-irradiated Ctrl or Sel1lVav KO recipient mice at indicated time points. n = 5. e, Percentage of donor-derived (CD45.1+) HSCs in the bone marrow of non-irradiated control or Sel1lVav KO recipient mice at 16 weeks after transplantation. n = 5. f, Experimental schematic of the transplantation of CD45.1+ donor whole BM cells into lethally irradiated CD45.2+ control (Ctrl) or Sel1lVav KO mice. Donor chimerism was analyzed 24 weeks after transplantation. g, Frequencies of donor derived WT HSCs are similar in the BM of irradiated Ctrl and Sel1lVav KO recipient mice. Frequencies (left) and numbers (right) of donor derived HSCs in the BM of recipient control (Ctrl) or Sel1lVav KO mice were analyzed by flow cytometry. Ctrl: n = 4; Sel1lVav KO: n = 5. n means independent mice. Two-sample Kolmogorov–Smirnov test (b), two-way ANOVA (d), or two-tailed Student’s t-tests (e, g) was used to calculate all the P values. In b, d, and e, results are shown as mean ± s.d. In g, results are shown as mean ± SEM. Statistical information is provided as source data.
We next tested whether the mislocalization of Sel1l-KO HSCs in the BM permitted donor-HSC engraftment without irradiation. Whereas WT donor cells failed to engraft and reconstitute the non-irradiated control recipient mice, the Sel1lVav-KO recipient mice allowed highly efficient donor-HSCs engraftment and reconstitution (Fig. 3c–e). As control, donor-HSCs equally reconstituted the irradiated control or Sel1lVav-KO mice (Fig. 3f, g), suggesting that the acceptance of donor engraftment was not due to niche cell defects. Similar nonconditioned transplantation when HSC numbers were comparable in control and Sel1lMx1-KO mice showed that only Sel1lMx1-KO recipient mice permitted long-term HSC reconstitution (Extended Data Fig. 9d–f). These data demonstrate that Sel1l-deficient HSCs are lodged outside the BM niche.
MPL and c-Kit are two master regulators of HSC quiescence and govern interaction with the niche5. Deletion of Sel1l resulted in a substantial reduction of MPL, but not c-Kit, on the surface of HSCs (Fig. 4a and Extended Data Fig. 9g–j). We also observed a marked decrease of MPL downstream phospho-STAT5 and p57 expression in Sel1l-deficient HSCs (Extended Data Fig. 9k, l). These data demonstrate that SEL1L is essential for surface expression of MPL and its downstream signaling. Reciprocal co-immunoprecipitation experiments showed an interaction between MPL and the ERAD factors SEL1L and HRD1 (Fig. 4b, c). Additionally, MPL was polyubiquitylated by the E3 ligase HRD1(Fig. 4d). Cycloheximide chase assays showed substantial blockade of MPL protein degradation in the absence of SEL1L (Fig. 4e). We confirmed the accumulation of total MPL protein in primary Sel1l-KO HSCs (Extended Data Fig. 9m, n). However, MPL was largely co-localized with ER-exclusive chaperone GRP94 and accumulated in the ER in Sel1l-KO HSCs (Fig. 4f). These data identify MPL as a bona-fide endogenous substrate of SEL1L-HRD1 and demonstrate that SEL1L deficiency results in profound ER retention of MPL.
Figure 4 |. SEL1L regulates MPL maturation.
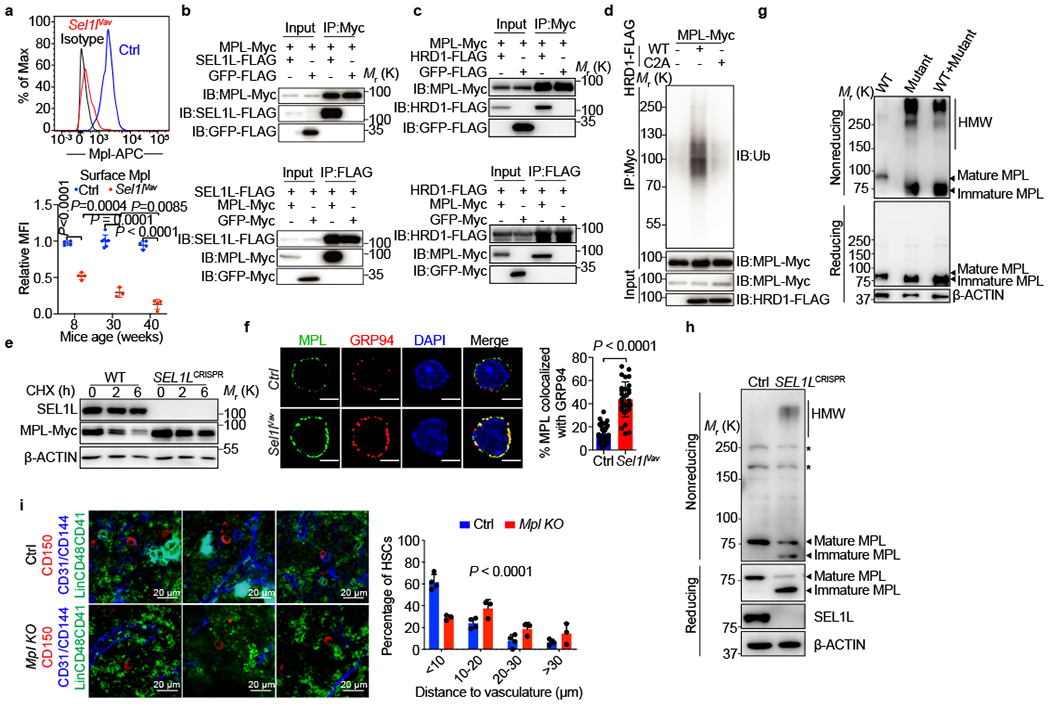
a, Representative flow cytometry plots (upper) and quantification (lower) of surface MPL expression in Ctrl or Sel1lVav-KO HSCs at indicated ages. MFI, mean fluorescence intensity. Week 8 and 40: n = 4; week 30, Ctrl: n = 7, Sel1lVav-KO: n = 7. b, SEL1L interacts with MPL. Co-immunoprecipitation was performed with anti-Myc (upper) or anti-FLAG antibody (lower). IP: immunoprecipitation; IB: immunoblotting. c, HRD1 interacts with MPL. Co-immunoprecipitation was performed with anti-Myc (upper) or anti-FLAG antibody (lower). MG132 (10 μM) was added into culture medium 6 hours before harvest. d, MPL is ubiquitinated by HRD1. 293T cells were transfected with indicated plasmids were subjected to immunoprecipitation with anti-Myc antibody in denatured condition. The immunoblot was probed with anti-Ub antibody. e, Western blot analysis of MPL decay in cycloheximide (CHX)-treated WT or SEL1LCRISPR-KO 293T cells at indicated time points. f, MPL protein is retained in the ER in the absence of SEL1L. Representative images (left) and quantification (right) of MPL that colocalized with exclusive ER-resident protein GRP94 in primary HSCs from 8-week-old Ctrl or Sel1lVav-KO mice. n=30 HSCs from Ctrl or Sel1lVav-KO mice were analyzed. Scale bar, 3 μm. g, Western blot analysis of Myc-tagged MPL in 293T cells transfected with Myc-tagged wildtype MPL (WT) or Myc-tagged mutant MPL (Mut) under reducing (with DTT) or non-reducing (without DTT) conditions. HMW, high molecular weight. h, WT MPL forms HMW aggregates in SEL1LCRISPR-KO 293T cells. Western blot analysis of HA-tagged WT-MPL in WT or SEL1LCRISPR-KO 293T cells under reducing (with DTT) and non-reducing (without DTT) conditions. * indicates unspecific band. i, Representative 2D images (left) and quantification (right) of the distances between HSCs (CD150+Lin−CD48−CD41−, Red) and the closest vascular structure (CD31+ and/or CD144+, Blue). Ctrl: n = 4 independent experiments, Mpl KO: n = 3 independent experiments. In a, f and i, results are shown as mean ± s.d. Two-tailed Student’s t-tests (f), two-way ANOVA (a) or two-sample Kolmogorov–Smirnov (i) test were used to assess the statistical significance. Statistical information and unprocessed blots are provided as source data.
We hypothesized that the inability to clear misfolded MPL in the absence of SEL1L causes MPL to be recruited into the misfolded protein aggregates and thus retained in the ER. To test this hypothesis, we used a disease-associated recurrent MPL mutation (R257C) that is predicted to be misfolded and drives the pathogenesis of human congenital amegakaryocytic thrombocytopenia23 (Extended Data Fig. 9o). The heterozygous arginine-to-cysteine mutation of MPL leads to complete loss of WT-MPL surface expression in patients and causes HSC defects23. Most of the MPL-mutant was in the partially glycosylated inmature form in 293T cells and formed high-molecular-weight (HMW) aggregates via disulfide-bonds (Fig. 4g). In contrast, the WT-MPL predominantly formed monomers and was in fully-glycosylated mature form. Importantly, the presence of the misfolded MPL-mutant led to the recruitment of coexpressed WT-MPL into the HMW complexes and formed aggregates while their mRNA levels were comparable (Fig. 4g and Extended Data Fig. 9p). WT-MPL formed HMW aggregates in SEL1L-KO, but not in control 293T cells (Fig. 4h). Surface MPL expression was markedly reduced in SEL1L- or HRD1-KO 293T cells (Extended Data Fig. 9q–x). We confirmed the accumulation of HMW MPL aggregates in primary Sel1l-deficient HSCs (Extended Data Fig. 9m). These data indicate that SEL1L-HRD1 ERAD prevents the dominant-negative effect of misfolded MPL in forming aggregates with the other fraction of MPL that leads to ER retention.
We next asked whether reduced surface expression of MPL causes the mislocalization of Sel1l-deficient HSCs in the niche. Similar to Sel1l-KO HSCs, steady-state Mpl−/− HSCs are located at a greater distance from the BM vasculature as compared with littermate control (Fig. 4i and Extended Data Fig. 10a). Transplanting equal numbers of CFSE-labeled control or Mpl−/− HSCs into the irradiated recipient mice confirmed the mislocalization of Mpl−/− HSCs in the BM (Extended Data Fig. 10b–d). Blocking the MPL-TPO interaction with MPL- or TPO- neutralizing antibody also led to a significant mislocalization of HSCs in the BM (Extended Data Fig. 10e–i). In contrast, chemical ER stressors did not alter the localization of HSCs (Extended Data Fig. 10j, k). These results demonstrate that MPL is important for HSCs localization in the BM, and that reduced surface MPL is associated with the mislocalization of Sel1l-KO HSCs in the niche.
Next, we performed rescue experiments using a MPL agonist that alters the positioning of the MPL dimer to constitutively activate downstream signaling and slows down MPL internalization24, 25 (Extended Data Fig. 10l). Treatment of Sel1lMx1-KO mice with the agonist successfully restored the phospho-STAT5 levels, and partially rescued the steady-state HSCs (Fig. 5a–c). Furthermore, the MPL agonist partially restored the reconstitution capacity of Sel1lMx1-KO HSCs and the donor-derived Sel1lMx1-KO HSCs in the BM of recipient mice, although the rescue efficiency declined over time (Fig. 5d–f). The rescue effects of MPL agonists depend on the abundance of remaining transmembrane-MPL in Sel1l-KO HSCs. However, we observed a time-dependent decrease of surface MPL in Sel1l-KO HSCs over the course of reconstitution and in steady-state (Fig. 4a, 5g). This is likely due to the sustained accumulation of misfolded MPL over time, especially when HSCs divide with increased protein synthesis. Although proliferation may dilute out misfoded proteins, recent study shows that increased protein synthesis causes HSCs to accumulate misfolded/unfolded proteins despite of cell proliferation26. These data demonstrate that the restoration of MPL signaling with the MPL agonist partially rescues Sel1l-deficient HSC phenotypes, but that the rescue is transient until MPL is too low or undetectable on the surface of Sel1l-KO HSCs. Besides MPL, it is likely that ERAD also regulates other surface receptors that contribute to HSC maintenance. Future technical advances in the development of highly sensitive proteomic approaches to profile rare population of cells will be required to globally map the ERAD-regulated receptor repertoires in HSCs.
Figure 5 |. MPL agonist partially rescues the phenotypes of Sel1l-KO HSCs.
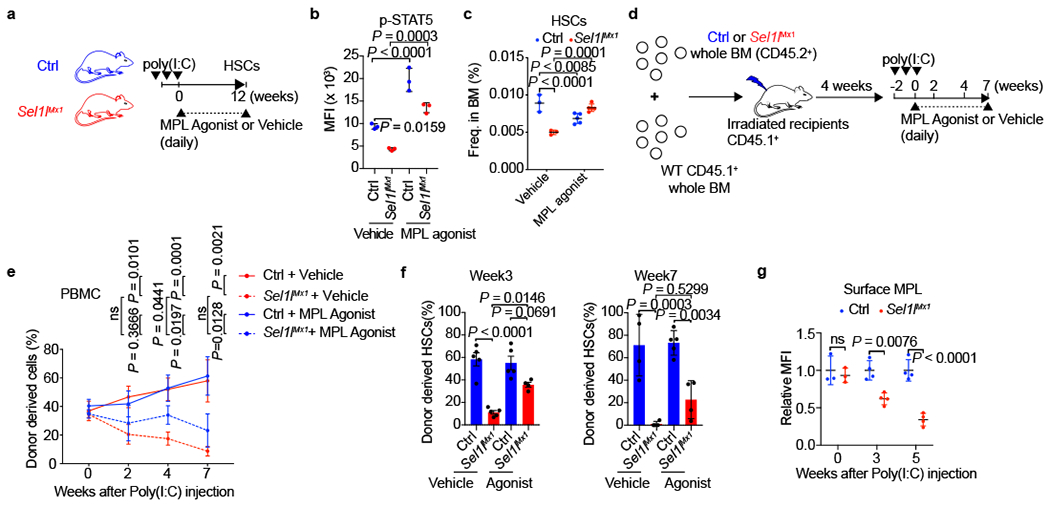
a, Schematic depiction of the rescue experiment with MPL agonist in Ctrl or Sel1lMx1 mice. b, MPL agonist restores MPL downstream STAT5 phosphorylation in Sel1lMx1 KO HSCs 12 weeks after poly(I:C) injection. n = 3. c, MPL agonist partially rescues steady-state HSCs in Sel1lMx1 KO mice 12 weeks after poly(I:C) injection. Vehicle: n = 3; MPL agonist: n = 5. d, Schematic depiction of the competitive BMT rescue experiment with MPL agonist. e, MPL agonist partially rescues the reconstitution capacity of Sel1lMx1 KO HSCs under BM transplantation condition. Frequency of donor derived PBMCs at indicated time points were analyzed by flow cytometry. n = 4 except for week 7. Sel1lMx1+ Vehicle and Sel1lMx1 + MPL agonist at week 7: n = 3. f, MPL agonist partially rescues the donor derived Sel1lMx1 KO HSCs in the BM of irradiated recipient mice at indicated time points. Percentages of donor derived HSCs at week 3 and week 7 after poly(I:C) injection were analyzed by flow cytometry. Week 3: n = 5 except for Sel1lMx1+ MPL agonist (n = 4); week 7: n = 4 except for Ctrl + MPL agonist (n = 5). g, Surface MPL expression in donor-derived Ctrl or Sel1lMx1 KO HSCs in the recipient mice at indicated time points. Week 0: n = 3; Week 3/5: n =4. In b, c, f and g, results are shown as mean ± s.d. In e, results are shown as mean ± s.e.m. One-way ANOVA (e) or two-way ANOVA (b, c, f, g) were used to assess statistical significance. ns, not significant. Statistical information is provided as source data.
In summary, this study demonstrates an unprecedented physiological mechanism of ER protein quality control machinery in selective regulation of HSC-niche communication and HSC identity (Extended Data Fig. 10m). HSCs exhibit low levels of protein synthesis27 and employ highly robust protein quality control via ERAD to prevent misfolded protein aggregation and ensure efficient maturation of surface receptors to ultimately safeguard the stem cell pool. Our study reveals an essential stem cell safeguard mechanism that could be potentially targeted to enhance HSC function in future studies.
METHODS
Mice.
Mice were maintained in a pure C57BL/6 background and were kept under specific-pathogen-free conditions in the transgenic mouse facility of Baylor College of Medicine (BCM) (22–24 °C, 30%−70% humidity with 12h dark/12h light cycle). Sel1lflox/flox, Ire1αflox/flox, Xbp1flox/flox and Mpl−/− mice were described previously28–31. The floxed mice were crossed with either Mx1-Cre (The Jackson Laboratory, 005673) or Vav-iCre (The Jackson Laboratory, 008610) mice to generate Sel1lflox/flox:Mx1-Cre, Sel1lflox/flox:Vav-iCre, Ire1αflox/flox:Vav-iCre, or Xbp1flox/flox:Vav-iCre mice. The Sel1lflox/flox:Ire1αflox/flox:Vav-iCre and Sel1lflox/flox:Xbp1flox/flox:Vav-iCre mice were generated by crossing Sel1lflox/flox:Vav-iCre mice with Ire1αflox/flox or Xbp1flox/flox mice respectively. 8-week-old Sel1lflox/flox:Mx1-Cre mice were intraperitoneally injected with poly(I:C) (GE) every other day (1 μg/g body weight) for three times. Poly(I:C)-injected Sel1lflox/flox littermates were used as controls. Both male and female mice were used. For transplantation assays, female eight-to-twelve-week-old C57BL/6-Ly5.1 (CD45.1+) mice (Charles river, 564) were used. All procedures were approved by the BCM Institutional Animal Care and Use Committee. The study is compliant with all relevant ethical regulations regarding animal research.
In vivo assays.
For competitive bone marrow transplantation (BMT) experiments, CD45.1+ recipient mice were lethally irradiated (10 Gy, delivered with 2 equal doses by 4 h apart) and injected retro-orbitally with either 250 freshly sorted CD45.2+ HSCs, together with 250,000 helper CD45.1+ BM cells, or CD45.2+ BM cells with equal numbers of CD45.1+ competitor BM cells. For genetic rescue experiments, 2,000 sorted Zsgreen/GFP+ HSPCs were transplanted into lethally irradiated CD45.1+ recipient mice together with 250,000 CD45.1+ BM cells. For non-conditioned transplantation experiments, recipient mice were injected with 1 x 10⁷ CD45.1+ BM cells via tail vein. To induce Sel1l deletion after the donor cells stably engraft in the recipient mice, irradiated recipient mice were injected with polyI:C 4 weeks after transplantation and were analyzed for donor-derived chimerism at indicated time points. For HSCs localization assay, 10,000 CFSE labelled HSCs were injected retro-orbitally to lethally irradiated mice 24h before analysis. Mice were injected intraperitoneally with 5-fluorouracil (Sigma, F6627) (150 mg/kg) once or 3 times at 11 days interval. For BrdU incorporation assay, mice were injected intraperitoneally with one dose of BrdU (Sigma, B5002; 1 mg/6g body weight) 12h prior to euthanization. For pulse-chase assay, mice were injected with one dose of BrdU as above and were maintained on 1mg/ml BrdU in drinking water for 10 days, followed by regular water feeding for up to 42 days. Amber bottles containing BrdU were changed every 3 days. For rescue experiments, MPL agonist was dissolved in DMSO (40 mg/ml) and resuspended in 1% microcrystalline cellulose and 50% sucrose solution and was administered by daily oral gavage (2mg/kg). For treatment under BMT condition, PBMCs from three randomly picked control or Sel1lMx1 donors were collected before treatment to examine donor chimerism. Mice from the same batch BMT experiment were then randomized for treatment. The PERK inhibitor GSK2656157 was formulated in 0.5% hydroxypropyl methyl cellulose, 0.1% tween-80 in water (pH 6.75) and was administered by daily oral gavage (150 mg/kg). The IRE1α RNase inhibitor MKC8866 was formulated in 1% microcrystalline cellulose and 50% sucrose solution and was administered by daily oral gavage (150 mg/kg). The eIF2α inhibitor ISRIB (2.5 mg/kg, every two days), p38 inhibitor SB202190 (20 mg/kg, daily), ERK inhibitor SCH772984 (25 mg/kg, daily) and JNK inhibitor SP600125 (20 mg/kg, daily) formulated in 45% saline, 50% PEG 400, 5% DMSO was administered by intraperitoneal injection. Tunicamycin or thapsigargin was administrated at 0.1 mg/kg (three times/week) by intraperitoneal injection (150 mM dextrose, 1% DMSO in PBS). Tauroursodeoxycholic acid (TUDCA) was administered daily by intraperitoneal injection (200 or 500 mg/kg in PBS). Mice were given regular drinking water or 4-PBA (1 g/kg/day) in the drinking water. For TPO-MPL neutralization assay, mice were administered daily by intraperitoneal injection of 5mg/kg of anti-TPO (Biolegend, # 696104), anti-MPL antibody (Biolegend, #393702) or isotype control antibodies (Biolegend, # 400602 and #401502) respectively. For survival assay, Mice were euthanized when endpoints were met according to approved IACUC protocol. The information of chemicals are in Supplementary Table 1.
Retroviral HSPCs transduction assays:
Retrovirus was generated in 293T cells. LSK cells sorted from 8-week-old control or Sel1lMx1 mice were cultured in X-Vivo 15 medium (Lonza, 04–418Q) supplemented with 1% heat-inactivated FBS, 50 ng/ml SCF, 50 ng/ml TPO, 10 ng/ml IL-3 and 10 ng/ml IL-6 (Peprotech) for 24 hours. Cells were spin-infected with retroviral supernatant supplemented with polybrene (8 mg/ml) in retronectin (Clontech, T202) coated plates at 1,100g for 90 min at 32 °C. Fresh medium was replaced 3 hours after spin-infection. Cells were spin-infected again on the 3rd day. GFP/Zsgreen+ cells were sorted for BMT assay on the 4th day.
Colony forming unit (CFU) assay.
For CFU assay, freshly purified HSCs were plated in methylcellulose culture medium (Stem Cell Technologies, M3434). BFU-E, CFU-GM/G/M, CFU-GEMM were scored on day 12 under an inverted microscope and standard morphological criteria32.
Flow cytometry and cell sorting.
Flow cytometry data were collected by BD FACS Diva 8 on BD LSR II or BD Fortessa analyzer. Cell sorting experiments were performed on FACS Aria II cell sorter (BD). The acquired data were analyzed using FlowJo 10 software. BM cells were isolated by flushing the femur/tibia with Ca2+- and Mg2+-free DPBS containing 2% FBS using a 10 ml syringe fitted with a 25-gauge needle. Spleen cells were obtained by gently crushing the spleen. Peripheral blood was obtained via tail vein bleeding. Complete blood count analyses were performed using a Hemavet haematology system (Drew Scientific). Erythrocytes were removed by ACK lysis buffer (Thermo Fisher, A1049201). Single-cell suspensions of BM cells, spleen cells or PBMCs were obtained by filtering through 40 μm strainers. For cell analyses, BM cells or spleen cells were incubated with anti-mouse Lineage Cocktail (including CD3 (17A2), Gr-1 (RB6-8C5), CD11b (M1/70), B220 (RA3-6B2) and Ter119) , c-Kit (2B8), Sca-1 (E13-161.7), CD150 (TC15-12F12.2), and CD48 (HM48-1) for SLAM HSCs; or together with c-Kit (2B8), Sca-1 (E13-161.7), CD34 (RAM34), and Flk2 (A2F10) for LT-HSCs; or together with c-Kit (2B8), Sca-1 (E13-161.7), FcγR (93), CD34 (RAM34), Flk2 (A2F10), and IL7Rα (A7R34) for progenitors. CD3 (17A2), Gr-1 (RB6-8C5), CD11b (M1/70), and B220 (RA3-6B2) were used for analyses of mature cells in peripherial blood. CD45.1 (A20) and CD45.2 (104) antibodies were used for analyses of donor chimerism in the transplantation assay. Anti-MPL (S16017E) antibody was used to evaluate MPL protein expression on HSCs. Antibodies were obtained from Biolegend or eBioscience (Supplementary Table 2). DAPI was used to exclude dead cells.
For cell sorting, single cells were incubated with the lineage depletion beads (Miltenyi, 130-110-470) followed by LS column depletion (Miltenyi,130-042-401). The lineage-depleted fraction was used for staining as described above.
For intracellular Ki67 staining, lineage-depleted BM cells were fixed and permeabilized with True-Nuclear™ transcription factor buffer (Biolegend, #424401) after surface maker staining. Then cells were stained with anti-Ki-67 antibody (BioLegend, # 652405) for 1 hour at room temperature (RT). Cells were resuspended in flow buffer containing 1 μg/mL DAPI for analysis. Lineage-depleted BM cells were stained with surface markers to define each BM subset followed by intracellular staining using the BrdU staining kit according to the manufacturer’s instructions (BD Biosciences). For Annexin V staining, lineage-depleted BM cells were firstly stained with surface makers and then stained with Annexin V antibody for 30 mins at RT in Annexin V binding buffer (eBioscience, 88-8007-72). Cells were resuspended in flow buffer with 1 μg/mL DAPI for analysis. For intracellular phosphoprotein staining, sorted SLAM HSCs were fixed by IC Fixation Buffer (eBioscience, # 00-8222-49) for 30 mins at RT followed by permeabilization with methanol for 1 hour at 4°C. Cells were then stained by indicated antibodies (Supplementary Table 1). For ER analyses, sorted SLAM HSCs were washed with HBSS, incubated for 15 min at 37°C with 100 nM ER-Tracker Green (Thermo Fisher, E34251) in HBSS containing 50 μM verapamil (Sigma, V4629). Cells were then washed and resuspended with HBSS containing 50 μM verapamil for flow analysis.
Immunofluorescence staining.
SLAM HSCs were sorted as above in PBS and fixed with 4% PFA for 10 min at RT. Cells were then applied onto poly-lysine coated slides by cytospin, permeabilized in PBS containing 0.1% Triton X-100 for 5 min and blocked in PBS containing 1% BSA for 1h at RT. Slides were then incubated with either anti-GRP94 (Cell Signaling, #20292), anti-MPL (Biolegend, S16017E), Normal Rabbit IgG (Cell Signaling, #2729), or Purified Mouse IgG2a, κ Isotype Ctrl Antibody (Biolegend, 401501) in PBS containing 1% BSA for 12h at 4 °C. Slides were then washed three times in PBS containing 0.05% Tween-20 and incubated with Alexa Fluor 488-conjugated goat anti-mouse IgG (Invitrogen, A-11029), or Alexa Fluor 594 -conjugated goat anti-rabbit IgG (A-11012) secondary antibody in PBS containing 1% BSA in dark for 1h at 37°C. Slides were washed three times in PBS with 0.05% Tween-20 and mounted using VectaShield (Vector Laboratories) containing 1 μg/ml DAPI. Immunofluorescent images were acquired on GE Healthcare DeltaVision LIVE Deconvolution Microscope (20x air or 100x oil) along the z axis (step size 0.25 μm). Images obtained by 20x objective were processed and analyzed by CellProfiler 3.0 to quantify the expression of GRP94 protein and MPL protein in HSCs. Images obtained by 100x objective were processed and analyzed by BioImageXD 1.2233 to quantify the co-localization (Mander’s coefficient) between GRP94 signals and MPL signals. The representative images of control or Sel1l-KO HSCs were presented in the same scales using ImageJ 1.51.
For immunofluorescence staining of frozen sections of long bones, recipient mice were perfusion-fixed and the bones were post-fixed for 4 hours with 4% PFA at 4°C. The bones were embedded, and sectioned (60μm) according to the Kusumbe method34. Sections were rehydrated and permeabilized in PBS with 0.3% Triton X-100, and blocked in staining solution (PBS containing 5% Donkey serum, 10% DMSO, 0.5% IgePal-CA630) plus anti-mouse CD16/32 antibody (1:100, 70-0161-M001, Tonbo Bio) for 4 hours. Sections were then stained overnight with anti-CD150-PE (Biolegend, 400213, 1:100), Biotin lineage cocktail (Supplementary Table 1), anti-CD31 (R&D, AF3628, 1:200), anti-VE-Cadherin (R&D, AF1002, 1:200) in staining at 4°C. Donkey anti-goat Alexa Fluor 647 (1:200, 705-606-147, Jackson Immunoresearch) and Alexa Fluor 488-streptavidin (Biolegend, 115918, 1:100) were used as secondary antibodies for overnight incubation in staining solution at 4°C. Slides were mounted with anti-fade prolong diamond (P36961, Thermo Fisher), and imaged immediately by a Zeiss LSM780 confocal microscope with a 20x objective. Z-stack images were acquired at 1 μm steps in 16-bit greyscale. The stacks were converted into RGB images, and the noise was removed from the images by the despeckle function of ImageJ 1.51. A threshold was given to reduce the background in each channel. 3D images and videos were produced by the 3D viewer plugins in ImageJ 1.51. The distance from HSCs to the closest vessel was measured with ImageJ 1.51.
Transmission Electron Microscopy.
Around 20,000 freshly sorted control or Sel1lVav-KO SLAM HSCs were fixed (3% PFA, 2.5% glutaraldehyde and 0.1 M cacodylate) in 1.5 ml microcentrifuge tubes for 1 hour at room temperature. Fixed HSCs were washed once by 0.1M cacodylate buffer (CB) and stained by Evans blue (1 mg/ml in 0.1M CB) for 20 minutes at room temperature. HSCs were washed 3 times by 0.1M CB and pelleted in 2% low melting agarose35. Solidified agarose with HSCs pellet was trimmed and washed in 0.1M CB and treated with 0.1% Millipore-filtered cacodylate buffered tannic acid, post fixed with 1% buffered osmium, and stained with 1% Millipore-filtered uranyl acetate. The samples were dehydrated in increasing concentrations of ethanol, infiltrated, and embedded in LX-112 medium. The samples were polymerized in a 60°C oven for approximately 3 days. Ultrathin sections were cut in a Leica Ultracut microtome (Leica), stained with uranyl acetate and lead citrate in a Leica EM Stainer, and examined in a JEM 1010 transmission electron microscope (JEOL) at an accelerating voltage of 80 kV. Digital images were obtained using AMT Imaging System (Advanced Microscopy Techniques Corp).
Quantitative real-time PCR
Cells were sorted directly into TRIzol LS Reagent (Invitrogen, #10296010). Total RNA was extracted according to the manufacturer’s instructions. Total RNA was reverse transcribed using SuperScript IV Reverse Transcriptase (Invitrogen, 18091050). Quantitative real-time PCR was performed using SYBR Green PCR master mix (Applied Biosystems, 4367695) on a QuantStudio 6 Real-Time PCR system (Applied Biosystems). Primer sequences are in Supplementary Table 3.
Plasmids.
The following plasmids were used: The pMSCV-Xbp1s-IRES-GFP plasmid was generated by cloning the Xbp1s cDNA into pMSCV-IRES-GFP (pMIG, Addgene, #20672); The LEPZ miR30-based control shRNA that targets Renilla Luciferase (shRen.713) was a gift from Johannes Zuber (Addgene, # 111161). The oligonucleotides targeting mouse Atf6 (5’-TGCTGTTGACAGTGAGCGCCAGCAGGTACATACACCTCAATAGTGAAGCCACAGATGTATTGAGGTGTATGTACCTGCTGATGCCTACTGCCTCGGA-3’) was synthesized to generate shAtf6 construct as reported36; The MPL, SEL1L and HRD1 gene was PCR amplified from mouse BM cDNA and cloned into pcDNA3.1-Myc tag and pcDNA3.1-FLAG tag vectors; The R258C mutated MPL and the HRD1 RING finger mutant (C291A/C294A) was generated by overhang extension (OE) PCR and cloned into pcDNA3.1-Myc tag and/or pcDNA3.1-FLAG tag vector; The GFP was amplified from pMIG and cloned into pcDNA3.1-Myc tag and pcDNA3.1-FLAG tag vector; pMx-HA-MPL used in Fig. 4h (gift from Wei Tong, University of Pennsylvania, USA); pcDNA3.1-proAVP(G57S)-HA and pcDNA3.1-POMC (C28F)-FLAG (gifts from Ling Qi, University of Michigan, USA). Primers used to generate the plasmids are in Supplementary Table 3.
Co-immunoprecipitation.
293T cells were transfected with plasmids as indicated in Figure 4b, c. Cells were lysed in lysis buffer (1% Triton X - 100, 150 mM NaCl, 1 mM EDTA, 50 mM Tris-HCl pH7.5) supplemented with 1X protease inhibitor cocktail (Roche, 14826500) 36h after transfection. A total of 2mg protein lysates was incubated with antibody-conjugated affinity gel (anti-FLAG M2, Sigma F-2426; or anti-Myc, Sigma E6654) overnight at 4°C with gentle rocking. Immunocomplexes were washed once with lysis buffer followed by three times with wash buffer (1% Triton X-100, 137 mM NaCl, 2 mM EDTA, 20 mM Tris-HCl pH 7.5, 10% glycerol), eluted directly by boiling in 2X SDS sample buffer without DTT (100 mM Tris-HCl pH 6.8, 2% SDS, 0.01% bromophenyl blue, 10% glycerol) for 10 minutes. The samples were spun down at 12,000 g for 1 minute and supernatant was transferred to microcentrifuge tubes containing DTT (0.1 M final concentration). Samples were analyzed by SDS-PAGE and Western blot (WB). Antibodies used are in Supplementary Table 2.
Cycloheximide (CHX) chase assay.
WT or SEL1L CRISPR knockout 293T cells37 were transfected with pcDNA3.1-MPL-Myc tag or pcDNA3.1-MPL mutant-Myc tag plasmid. Cells were treated with CHX (Millipore, 239764, 200 μg/ml) for the indicated times thirty-six hours post-transfection. Cells were lysed in 1x SDS sample buffer (50 mM Tris-HCl pH 6.8, 1% SDS, 0.005% bromophenyl blue, 0.1 M DTT, 5% glycerol) and boiled for 10 minutes followed by SDS-PAGE and WB. Antibodies used are in Supplementary Table 2.
In vivo ubiquitylation assays.
293T cells were transfected with indicated plasmids as in Fig. 4d. 36h post-transfection, cells were treated with 10 μM MG132 for 6h. Cells were lysed in denaturing buffer (1% SDS, 50 mM Tris-HCL, pH 7.5, 0.5 mM EDTA, 10 mM N-ethymaleimide and 1 mM DTT). After incubation at 100°C for 10 minutes, the lysate was sonicated for 5 minutes by Bioruptor (Diagenode, B01020001) at high amplitude and 30s on/30s off. Supernatant of the lysate was dilute with lysis buffer (1% Triton X-100, 150 mM NaCl, 1 mM EDTA, 50 mM Tris-HCl pH7.5, and 10 mM N-ethymaleimide) supplemented with 1x protease inhibitor cocktail (Roche, 14826500). Immunoprecipitation and western blot were performed as described above. Antibodies used are in Supplementary Table 2.
Non-reducing western blot.
293T cells were transfected with pcDNA3.1-MPL-Myc tag, pcDNA3.1-MPL mutant-Myc tag or pcDNA3.1-MPL-Myc tag together with pcDNA3.1-MPL mutant-Myc tag plasmids. 36h post-transfection, cells were lysed in 1x SDS sample buffer (50 mM Tris-HCl pH 6.8, 0.1% SDS, 0.005% bromophenyl blue, 5% glycerol) without reducing agent and boiled for 10 minutes followed by SDS-PAGE and WB.
Western blot for HSC.
WB was performed as described previously38. Approximately 20,000 SLAM HSCs were sorted into 250 μl PBS containing 20% trichoracetic acid (TCA). The concentration of TCA was adjusted to 10% after sorting. Extracts were incubated on ice for 30 min and centrifuged at 13,000 rpm for 10 min at 4°C. Precipitates were washed in pure acetone (Fisher scientific, A18-4) twice and the dried pellets were solubilized in 9 M urea, 2% Triton X-100, and 1% DTT together with 1X LDS buffer (Invitorgen, NP0007). Samples were separated on NuPAGE 4–12% Bis-Tris protein gels (Invitrogen, NP0336BOX) and transferred to PVDF membrane (Millipore). The blots were incubated with primary antibodies overnight at 4°C and then with secondary antibodies. NativePAGE™ 4-16% Bis-Tris protein gel was used to detect MPL aggregates in HSCs as manufacturer’s instructions39 (Invitrogen, BN1002BOX). Blots were developed with the SuperSignal West Femto chemiluminescence kit (Thermo Scientific, 34096). Antibodies and reagents used are in Supplementary Table 1 and 2.
Statistics and Reproducibility.
Data are expressed as mean ± standard deviation (s.d.), or mean ± standard error of the mean (s.e.m.) as indicated in the figure legend. n is the number of independent biological replicates unless indicated specifically in the figure legend. Respective n values are shown in the figure captions and in the source data files. Pooled mice were used for Figs 2a, 4f and Extended Data Figs 4b, 5d, 6a, 6c, 9b, 9m, 9n and 10b . Experiments for Figs. 3a–e,4b–e, 4i, 4g and Extended Data Figs 4b, 6c, 9m, 9r and 9u–w were performed at least twice independently. Experiments for Figs. 4h and Extended Data Figs.1a, 7n and 8 were performed once. Mice for transplantation were randomized and no blinding protocol was used. No statistical method was used to predetermine sample size. The results were quantified using GraphPad Prism 7. P values were generated using two-tailed unpaired/paired (Extended Data Fig. 9h), Student’s t-test, two-sample Kolmogorov–Smirnov test, two-way ANOVA with Bonferroni’s multiple comparison test or Fisher’s LSD test (Extended Data Fig. 6i, 6l, 7m, 7p, 8b (right panel), 8d (right panel), 8f (right panel)), one-way ANOVA with Tukey’s multiple comparison tests or Fisher’s LSD test (Fig. 5e) as indicated.
Data availability.
Previously published sequencing data that were re-analysed here are available under accession codes GSE60101 for Fig 1a [7] and GSE109125 for Extended Data Fig 2b [6].
Source data are provided with this study. All other data supporting the findings of this study are available from the corresponding author on reasonable request.
Extended Data
Extended Data Fig. 1. SEL1L-ERAD is highly expressed in HSCs compared to progenitors.
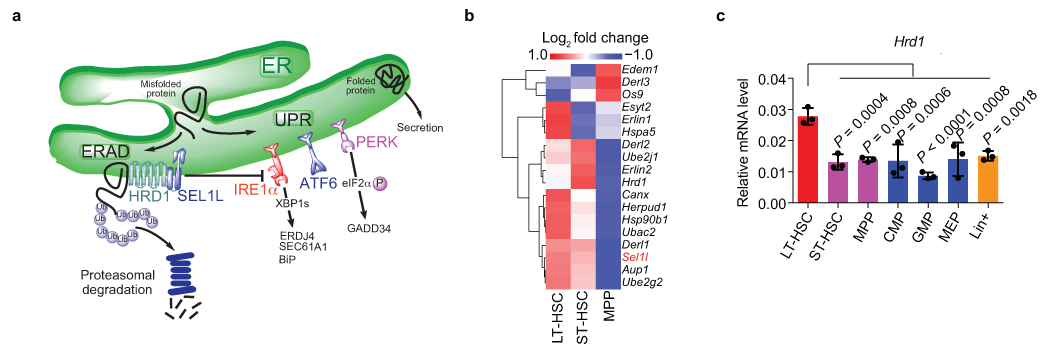
a, Diagram showing the ERAD and UPR pathways. The ER is the major subcellular site for synthesis and maturation of all transmembrane and secreted proteins. To maintain protein homeostasis and normal cell function, cells have evolved highly sensitive and sophisticated quality control systems and/or stress response pathways to ensure the fidelity of protein structure. Two such systems conserved across different species are ERAD and UPR. Among the mammalian ERAD complexes, the SEL1L-HRD1 complex, consisting of the E3 ubiquitin ligase HRD1 and its adaptor protein SEL1L, is the most conserved branch that ubiquitinates and targets selective substrates for proteasomal degradation. Many physiological or pathological stresses cause the accumulation of unfolded or misfolded proteins in the ER and activate the ER stress response or UPR that is mediated by three ER transmembrane sensors IRE1α, ATF6 and PERK. IRE1α is the most ancient and conserved sensor of the UPR. Upon activation, IRE1α dimerizes and trans-autophosphorylates to activate its RNase domain to induce unconventional splicing of its substrate XBP1. Recent study reveals that IRE1α, rather than ATF6 and PERK, as a selective endogenous substrate that is degraded by SEL1L-HRD1 ERAD. b, Heatmap showing the expression of ERAD genes in mouse HSCs and progenitors. LT-HSC: long term HSC (LSK CD150+CD48−CD135−); ST-HSC: short term HSC (LSK CD150−CD48−CD135−); MPP: multipotent progenitors (LSK CD135+). Data extracted from GSE109125. c, Quantitative RT–PCR analysis of Hrd1 expression in mouse HSCs and progenitors. Data are presented relative to Gapdh. n = 3 biologically independent mice. One-way ANOVA was used to calculate P values. Results are shown as mean ± s.d. Statistical information is provided as source data.
Extended Data Fig. 2. Representative flow cytometry gating strategy used in this study.
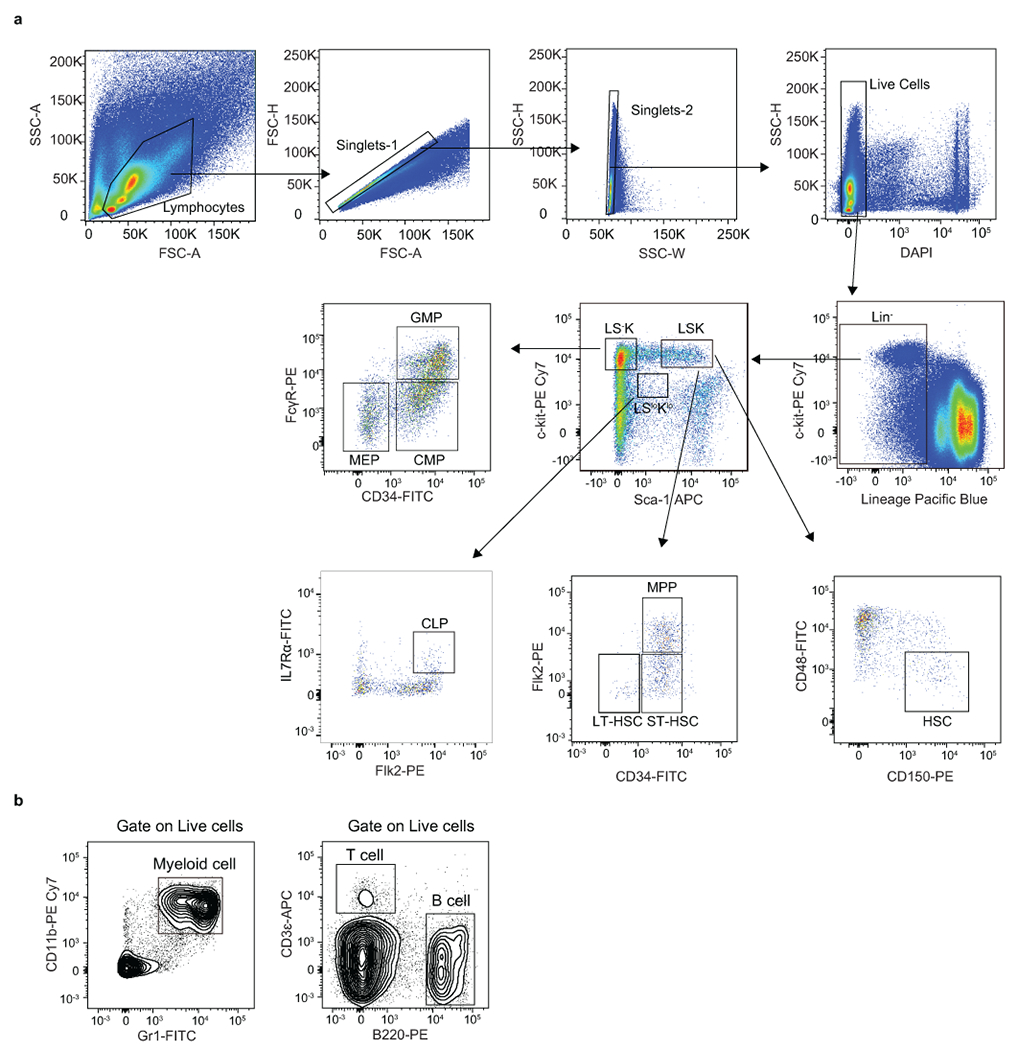
a, Strategy used to isolate the hematopoietic stem and progenitor cell populations in mouse bone marrow presented on Fig. 1d, 1f, 1h, 1j, 2c, 2f, 2h, 2i, 3e, 3g 4a, 5b, 5c, 5f, 5g, Extended Data Fig. 3c, 3d, 4e, 4g, 4i, 4n–q, 4s, 4t, 5c, 5f, 6b, 6g, 6i, 6l, 7b–e, 7i, 7m, 7p, 7r (right panel), 8a–f (right panel), 9e, 9g, 9k, 10a and 10f. LSK: Lin−Sca-1+c-Kit+; LT-HSC: long-term HSC (LSK CD34−Flk2−); ST-HSC: short-term HSC (LSK CD34+Flk2−); MPP: multipotent progenitors (LSK CD34+Flk2+); CLP: common lymphoid progenitors (Lin−Sca-1lowc-KitlowFlk2+IL7Rα+); CMP: common myeloid progenitors (LS-K CD34+FcγR−); GMP: granulocyte/macrophage progenitors (LS-K CD34+ FcγR+); MEP: megakaryocytic/erythroid progenitors (LS-K CD34−FcγR−). b, Strategy used to isolate myeloid cell (CD11b+Gr1+), B cell (B220+CD3ε−) and T cell (CD3ε+B220−) in mouse bone marrow presented on Fig.2b, 2e, 3d, 5e, Extended Data Fig. 3e, 5b, 5e, 6h, 6k, 7h, 7l, 7o, 7r (left panel), 8b(left panel), 8d (left panel), 8f (left panel) and 9f.
Extended Data Fig. 3. Progressive loss of progenitor cells in Sel1l knockout mice.
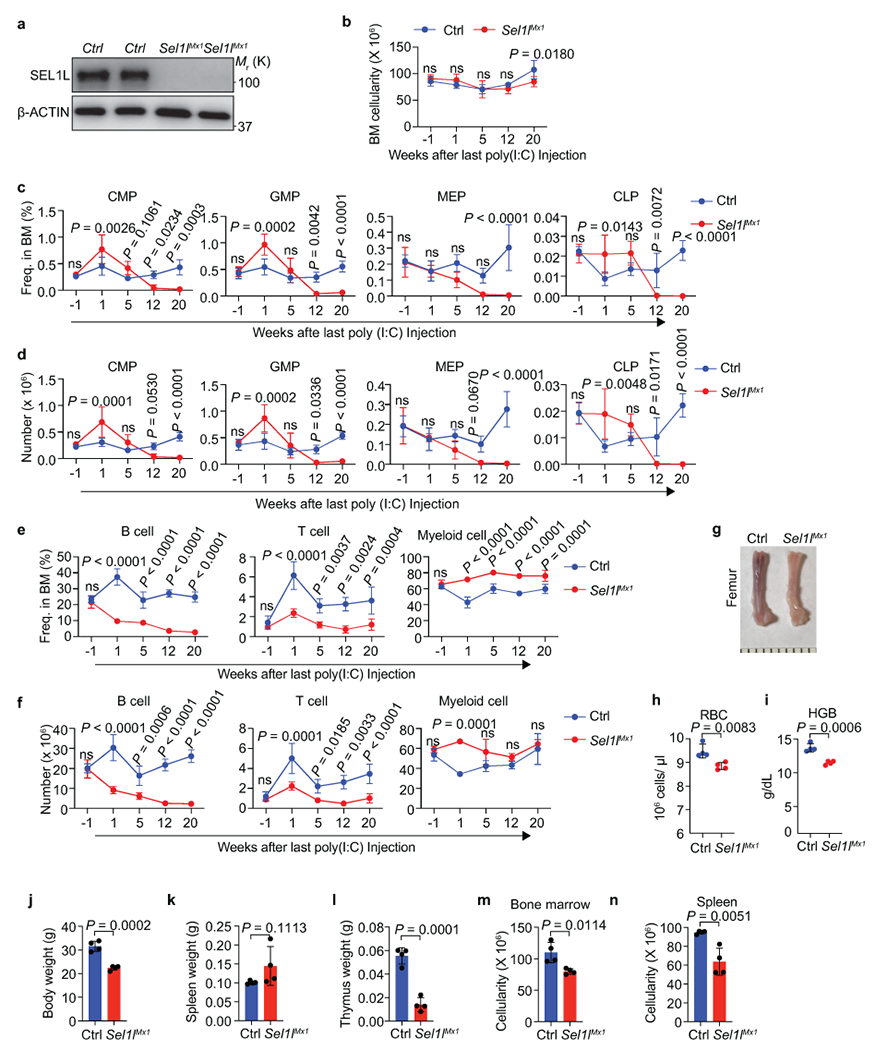
a, Western blot analysis of SEL1L expression in LSK cells from 2 control (Ctrl) and 2 Sel1lMx1 mice 1 week after last poly (I:C) injection. β-ACTIN was used as loading control. b, Bone marrow (2 femurs and 2 tibiae) cellularity of Ctrl and Sel1lMx1 mice at the indicated time points. −1 indicates 1 week before poly (I:C) injection. Age and gender matched littermates were used in each time points. Ctrl (12, 20): n = 5, Ctrl (5): n = 6 and the others: n = 4. c, d, Percentage (c) and number (d) of CMP, GMP, MEP and CLP in the BM of control (Ctrl) and Sel1lMx1 mice at the indicated time points. Ctrl (12, 20): n = 5, Ctrl (5): n = 6 and the others: n = 4. e, f, Percentage (e) and number (f) of B, T and myeloid cells in the BM of control (Ctrl) and Sel1lMx1 mice at the indicated time points. Ctrl and Sel1lMx1 (1, 12): n = 3, Ctrl (5): n = 6 and the others: n = 4. g, Representative image of femur bone from control and Sel1lMx1 mice 30 weeks after poly (I:C) injection. h, i, Quantification of Red blood cell (RBC, h) and hemoglobin (HGB, i) in peripheral blood of Ctrl and Sel1lMx1 mice 30 weeks after poly (I:C) injection. n = 4. j-l, Body weight (j), spleen weight (k) and thymus weight (l) in control and Sel1lMx1 mice as in h. n = 4. m, n, BM (m) and spleen (n) cellularity in mice as in h. n = 4. Results are shown as mean ± s.d. Two-way ANOVA (b-f) or two-tailed Student’s t-tests (h-n) was used to assess statistical significance. ns, not significant. Statistical information and unprocessed blots are provided as source data.
Extended Data Fig. 4. Characterization of the Sel1lVav knockout mice.
a, b, Expression of Sel1l mRNA (a) or protein (b) in primary control (Ctrl) or Sel1lVav-KO HSCs. n = 5 in a. c, Body weight of Ctrl and Sel1lVav-KO mice at indicated time points, n = 6. d, BM cellularity of Ctrl and Sel1lVav-KO mice at the indicated time points. n = 6. e, Frequency and absolute number of LT-HSCs from 8-week-old Ctrl and Sel1lVav-KO mice. n = 3. f, Colony formation in methylcellulose from equal number of Ctrl or Sel1lVav-KO HSCs. CFU-GM/G/M: colony forming unit granulocytic and monocytic (GM)/ granulocytic (G)/ monocytic (M); CFU-GEMM: colony forming unit granulocytic, erythrocytic, monocytic and megakaryocytic; BFU-E: blast forming unit erythrocytic. The colonies were counted after 12 days of culture. n = 3. g-j, Representative pseudocolor dot plots showing the gating strategy to identify CMP, GMP, MEP, CLP (g, i) and quantification (h, j) in the BM of Ctrl and Sel1lVav-KO mice. n = 6 for each group. k, RBC count in peripheral blood of Ctrl and Sel1lVav-KO mice at indicated age. 8-week-old Ctrl: n = 3; 8-week-old Sel1lVav: n = 7; 50-week-old Crl: n = 7; 50-week-old Sel1lVav: n = 5. l, Kaplan–Meier survival analysis of Ctrl and Sel1lVav-KO mice. n = 20. m, Schematic diagram of the Ki67 assay under BMT condition. n, Cell cycle analysis of donor and competitor derived HSCs using Ki67 and 7-AAD. n = 3. o, p, Representative FACS plot for apoptosis analysis from freshly isolated control and Sel1lVav-KO HSCs. Sample without Annexin V stain served as negative control. Sample treated by heat shock served as positive control. q, Quantification of apoptotic HSCs in control and Sel1lMx1-KO mice at indicated time points, n = 3. r, Quantification of apoptosis-related genes expression in control and Sel1lVav-KO HSCs. n = 4. s, Quantification of phos-p38, phos-JNK and phos-ERK in control and Sel1lMx1 HSC at indicated time points. n = 3 for all groups except 5 weeks Ctrl (n = 2). t, Percentage of apoptotic HSCs in the BM of 8-week-old Ctrl and Sel1lVav-KO mice. Ctrl: n = 8; Sel1lVav: n = 7. Two-way ANOVA (c, d, h, j, k, q, s), two-tailed Student’s t-tests (a, e, f, n, r, t), or log-rank test (l) were used to calculate P values. Results are shown as mean ± s.d. ns, not significant. Statistical information and unprocessed blots are provided as source data.
Extended Data Fig. 5. SEL1L is required for HSC regenerative potential under hematological stress condition.
a, Schematic depiction of the competitive bone marrow transplantation scheme using whole bone marrow cells. CD45.2+ donor BM cells isolated from control (Ctrl) or Sel1lVav mice were mixed with CD45.1+ competitor BM cells at 3:1 ratio, transplanted into lethally irradiated CD45.1+ recipients respectively. Reconstitution levels were monitored for 16 weeks in peripheral blood (PBMC) including myeloid cells, B cells and T cells and HSCs were examined 16 weeks after transplantation. b, c, Percentage of donor-derived myeloid cells, B cells and T cells in peripheral blood at indicated time points (b) or HSC in the BM at 16 weeks after transplantation (c). Week4 in b: n = 8; n = 5 in all the other time points. n = 5 in c. d, Schematic depiction of the competitive bone marrow transplantation scheme using LT-HSCs (LSK CD34−Flk2−) as donor. 250 HSCs were mixed with 250,000 CD45.1+ BM cells for each recipient mice in this assay. e, Percentage of donor-derived myeloid cells, B cells and T cells in peripheral blood at indicated time points using LT-HSC as donor. n = 7. f, Quantification of HSCs number in the spleen of control (Ctrl) and Sel1lVav mice 15 days after 5-FU treatment. n = 5. Results are shown as mean ± s.d. Two-way ANOVA (b, e, h) or two-tailed Student’s t-tests (c, f) were used to assess statistical significance. ns, not significant. Statistical information is provided as source data.
Extended Data Fig. 6. Characterization of ER stress and UPR activation in Sel1l-KO HSCs.
a, Transmission electron microscopic analysis of the ER and mitochondria (M) in HSCs from Control (Ctrl) or Sel1lVav-KO mice. Scale bar, 1 μm. b, ER-tracker staining in Ctrl and Sel1lMx1 HSCs. n = 3. c, WB analysis of HSCs from 8-week-old control and Sel1lVav-KO mice. d, RT-PCR analysis of UPR and ERAD in 8-week-old control or Sel1lVav-KO HSCs. Ctrl: n = 4; Sel1lVav: n = 3. e, f, RT-PCR analysis of Xbp1s (e) and Bip (f) expression in c-Kit-enriched BM cells from Ctrl and Sel1lVav-KO mice treated with vehicle or TUDCA (TUDCA-2: 200 mg/kg, TUDCA-5: 500 mg/kg). Vehicle: n = 2; TUDCA: n = 3. g, Frequency of HSCs in vehicle- or TUDCA (200 mg/kg)-treated Ctrl and Sel1lVav mice. n = 2 for vehicle-treated control group and n = 3 for the other 3 groups. h, i, Percentage of control and Sel1lMx1 donor-derived PBMC (h) and HSCs (i) in recipient mice at indicated time after vehicle or TUDCA treatment (daily i.p. injection) starting from the first poly(I:C) injection (4 weeks after donor-reconstitution). HSCs were analyzed at week 5. Ctrl: n = 2; Sel1lMx1: n = 3. The Vehicle groups and donor chimerism of n=3 randomly sampled mice from control or Sel1lMx1 donor group before poly(I:C) injection (left panel of h) is the same as in Extended Data Fig.6k, l, 7, 8. j, RT-PCR analysis of Xbp1s expression in LSK cells from 4-PBA treated mice. n = 2. k, l, Percentage of Ctrl and Sel1lMx1 donor-derived PBMC (k) and HSCs (l) in recipient mice at indicated time after vehicle or 4-PBA treatment (in drinking water) starting from the first poly(I:C) injection. Ctrl: n = 2; Sel1lMx1: n = 3. Results are shown as mean ± s.d. Two-tailed Student’s t-tests (b, d, j) or two-way ANOVA with Bonferroni test (e-i, k, l) were used to calculate P values. ns, not significant. Statistical information and unprocessed blots are provided as source data.
Extended Data Fig. 7. Regulation of HSC identity by SEL1L ERAD is independent of ER stress and UPR.
a, Quantification of Xbp1s (left) and Bip (right) expression in control (Ctrl) or Sel1lVav-KO HSCs treated with tunicamycin (0.1mg/kg) or thapsigargin (0.05 mg/kg) for 4 weeks (i.p. injection, 3 times/week). n = 3. b, c, Number of HSCs (b) and quantification of apoptotic HSCs (c) from Ctrl and Sel1lVav-KO mice as in a. n = 3. d, Frequency of HSCs in the BM of 8-week-old mice with indicated genotypes. Sel1lf/f; Ire1αf/f (Ctrl): n = 5; Sel1lVav (Sel1l-KO): n = 3; Ire1αVav (Ire1α-KO): n = 6; Sel1l; Ire1α double-knockout (dKO): n = 5; Vav-iCre: Ire1αhet, n = 3; Vav-iCre; Sel1lf/f; Ire1αhet, n = 5, data are combined from 2 independent experiments. e, Frequency of HSCs in the BM of 8-week-old mice with indicated genotypes. Sel1lf/f; XBP1f/f (Ctrl): n = 11, Sel1lVav (Sel1l-KO): n = 4, Xbp1Vav(Xbp1-KO): n = 8, Sel1l; Xbp1 double-knockout (dKO): n = 6, data are combined from 3 independent experiments. f, Schematic of BMT assay using retroviral transduced HSPCs. g, Quantification of Xbp1s expression in Ctrl and Sel1lMx1-KO HSPCs transduced by empty vector (EV) or Xbp1s. n = 3 independent samples. h, i, Percentage of Ctrl and Sel1lMx1-KO donor-derived PBMC (h) and HSCs (i) transduced with indicated construct in recipient mice. n = 3. j. Schematic of treatment strategy for competitive BMT assay. k, Quantification of Xbp1s expression in vehicle or IRE1α inhibitor MKC8866 (IRE1αi) treated HSCs. HSCs were sorted from Ctrl + Vehicle or Ctrl + IRE1αi group at the end of the rescue experiments. n = 2. l, m, Percentage of Ctrl and Sel1lMx1 donor-derived PBMC (l) and HSCs in the BM (m) of recipient mice at the indicated time points. HSCs were analyzed at week 5. Ctrl: n = 2; Sel1lMx1: n = 3. n, WB analysis of p-PERK and CHOP in WBM cells from mice treated with PERK inhibitor GSK2656157 (PERKi) or eIF2α inhibitor ISRIB respectively as in j. o, p, Percentage of Ctrl and Sel1lMx1 donor-derived PBMC (o) and HSCs (p) in recipient mice treated with vehicle, PERKi or ISRIB at the indicated time points. HSCs were analyzed at week 5. Ctrl: n = 2; Sel1lMx1: n = 3. q, Quantification of Atf6 expression in Ctrl and Sel1lMx1 HSPCs transduced with control shRNA (shRen) or shRNA targeting Atf6 (shAtf6). n = 3 independent samples. r, Percentage of Ctrl and Sel1lMx1 donor-derived PBMC (left) and HSCs (right) in recipient mice transduced with indicated construct. n = 3. The same vehicle group was used in l, m, o, p. Two-way ANOVA (a-c, g-i, l, m, o-r), one-way ANOVA (d, e) or two-tailed Student’s t-tests (k) were used to calculate P values. Results are shown as mean ± s.d or mean ± s.e.m (c). Statistical information and unprocessed blots are provided as source data.
Extended Data Fig. 8. Regulation of HSC identity by SEL1L ERAD is independent of MAPK signaling.
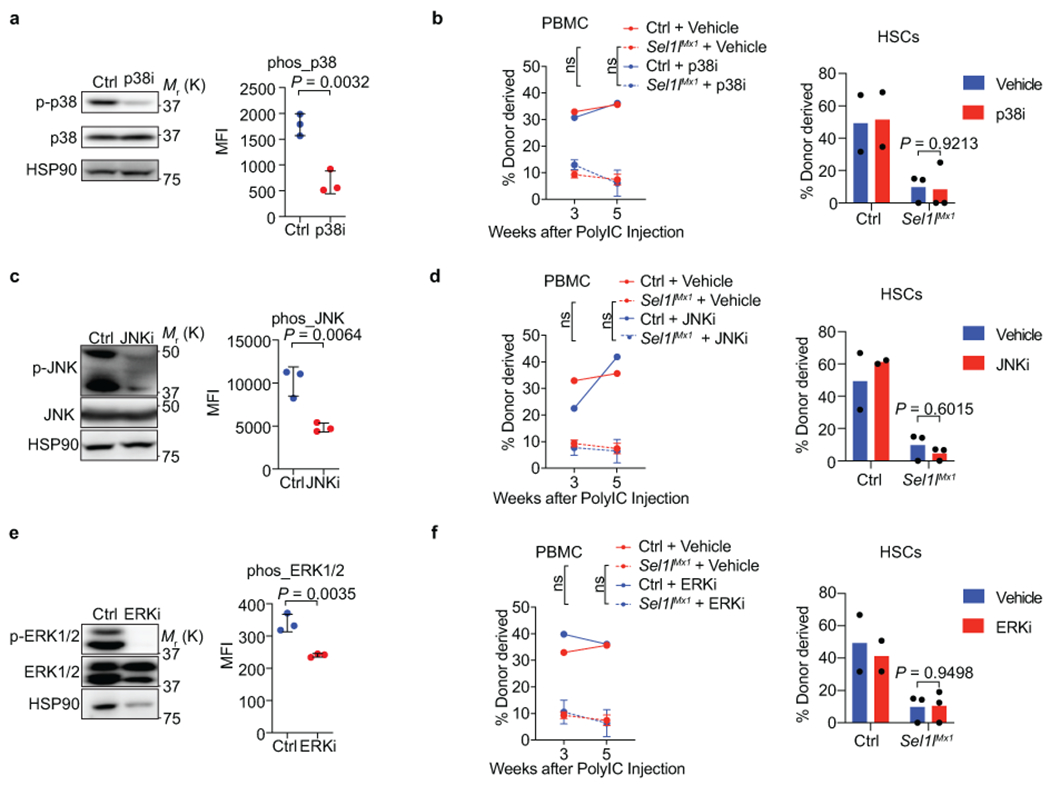
a, Analysis of p-p38 levels in whole bone marrow (WBM) by western blot (left) or in HSCs by flow cytometry from mice treated with vehicle or p38 inhibitor SB202190 (p38i). For flow analysis, n = 3 (3 of the 5 vehicle or p38i treated mice were randomly picked and donor-competitor HSCs were not distinguished). b, Percentage of control (Ctrl) and Sel1lMx1 donor-derived PBMC (left) and HSCs in the BM (right) of recipient mice treated with vehicle or p38i at the indicated time points. HSCs were analyzed at week 5. Ctrl: n = 2; Sel1lMx1: n = 3. c, Analysis of p-JNK levels in WBM by western blot (left) or in HSCs by flow cytometry from mice treated by vehicle or JNK inhibitor SP600125 (JNKi). n = 3. d, Percentage of control (Ctrl) and Sel1lMx1 donor-derived PBMC (left) and HSCs in the BM (right) of recipient mice treated with vehicle or JNKi at the indicated time points. HSCs were analyzed at week 5. Ctrl: n = 2; Sel1lMx1: n = 3. e, Analysis of p-ERK1/2 levels in WBM by western blot (left) or in HSCs by flow cytometry from mice treated with vehicle or ERK1/2 inhibitor SCH772984 (ERKi). n = 3. f, Percentage of control (Ctrl) and Sel1lMx1 donor-derived PBMC (left) and HSCs in the BM (right) of recipient mice treated with vehicle or ERKi at the indicated time points. HSCs were analyzed at week 5. Ctrl: n = 2; Sel1lMx1: n = 3. The same vehicle group was used in b, d and f. Two-way ANOVA (b, d and f), or two-tailed Student’s t-tests (a, c and e) were used to calculate P values. Results are shown as mean ± s.d. Statistical information and unprocessed blots are provided as source data.
Extended Data Fig. 9. SEL1L regulates MPL maturation.
a, Schematic of HSC (LSK CD150+CD48−)-vasculature distance measurement in the BM. b, c, Representative 2D images (b) and quantification (c) of the distances between CFSE-labelled HSCs (green) and vascular structure (CD31+ and/or CD144+, magenta). 177 control (Ctrl) and 147 Sel1lVav-KO HSCs were analyzed over n=3 independent experiments. Scale bar, 20 μm. d, Schematic for non-conditioned transplantation of donor cells into Ctrl or Sel1lMx1-KO congenic mice. e, The HSCs numbers in Ctrl and Sel1lMx1-KO mice 5 weeks after poly (I:C) injection. n = 5. f, Percentage of donor-derived (CD45.1+) cells in the PBMC of non-irradiated Ctrl or Sel1lMx1-KO recipient mice 16 weeks after transplantation. n = 4. g, h, Flow analysis of surface MPL expression in HSCs at different cell cycle states. Representative flow cytometry plots (g) and quantification (h) are shown. n = 4. i, Quantification of surface c-Kit expression from 8-week-old Ctrl and Sel1lVav-ko HSCs. n = 5. j, RT-PCR analysis of Mpl mRNA in 8-week-old Ctrl or Sel1lVav-KO HSCs. Data are presented relative to Actb. Ctrl: n = 8; Sel1lVav: n = 7. k, Representative histogram and quantification of phospho-STAT5 (Tyr694) level from 30-week-old Ctrl or Sel1lVav-KO HSCs. n = 4. l, Quantification of p57 mRNA by qPCR in 8-week-old Ctrl or Sel1lVav-KO HSCs. n = 4. m, WB analysis of total MPL in HSCs from 8-week-old Ctrl and Sel1lVav-KO mice under native or denature conditions. n, Quantification of total MPL signal in Ctrl and Sel1lVav-KO HSCs from immunostaining experiment in Fig. 4f. Ctrl HSCs: n = 100; Sel1lVav HSCs: n = 250. o, Sequence alignment of MPL from indicated species with R257 (Human) highlighted in red. p, 293T cells were transfected with Myc-tagged wildtype MPL (WT-Myc), FLAG-tagged mutant MPL (Mut-FLAG) or 1:1-mixed WT and Mut MPL (WT-Myc + Mut-FLAG) for 48h. The expression of WT or Mutant MPL was quantified by qPCR primers specific to Myc or FLAG tag. n = 3 independent samples. q, WT or SEL1LCRISPR-KO 293T cells were transfected with HA-tagged MPL and surface MPL expression was determined by flow cytometry 48h later. n = 3. r, WB analysis of HRD1 expression in WT, SEL1LCRISPR-KO or HRD1CRISPR-KO 293T cells. s, t, WT or HRD1CRISPR-KO 293T cells were transfected with HA-tagged MPL and surface MPL or C-KIT expression were determined by flow cytometry 48h after transfection. n = 3. u-x, Expression of aggregation-prone mutant proAVP (G57S) (u) or POMC (C28F) (v) forms aggregates in WT 293T cells, but is not sufficient to inhibit ERAD activity (u, v, w) and thus does not reduce surface MPL expression (x). HRD1 autoubiquitination (u, v) and OS9 (OS9–1 and OS9–2) accumulation (u, v, w) were used as validated indicators for ERAD activity. The experiments for q and u-x are performed together, the MPL level in WT (r) and Mock (x) was from the same experiment. n=3. Results are shown as mean ± s.d. Two-tailed Student’s t-test (e, f, h-l, n, p, q, s, t, x), or two-sample Kolmogorov–Smirnov test (c) were used to assess statistical significance. ns, not significant. Statistical information and unprocessed blots are provided as source data.
Extended Data Fig. 10: MPL-TPO is important for HSC-niche interaction.
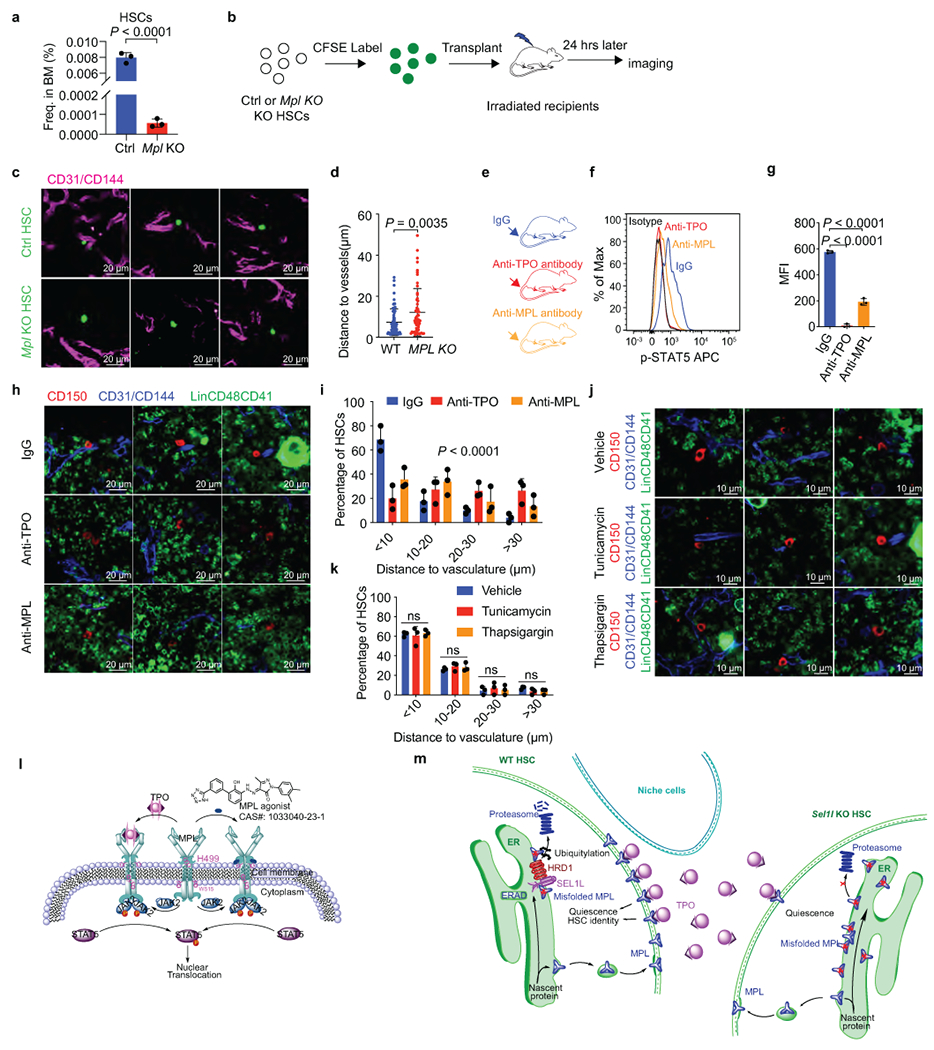
a, Frequency of HSCs in 20-week-old control (Ctrl) and Mpl-KO mice. n = 3. b, Schematic of HSC (LSK CD150+CD48−)-vasculature distance measurement in the BM. Donor HSCs were analyzed by whole-mount confocal microscope in femurs and tibiae. c, d, Representative 2D images (c) and quantification (d) of the distances between CFSE-labelled HSCs (green) and vascular structure (CD31+ and/or CD144+, magenta). A total of n=71 Ctrl and n=57 Mpl-KO HSCs were analyzed over 3 independent experiments. Scale bar, 20 μm. e, Mice were treated by indicated antibodies daily for 7 days before examining the HSC-vasculature distance in the BM. f, g, Both MPL and TPO antibodies blocked TPO-induced phospho-STAT5 in HSCs in vitro. n = 3 independent samples. h, i, Representative 2D images (h) and quantification (i) of the distances between indicated HSCs (CD150+Lin−CD48−CD41−, Red) and the closest vascular structure (CD31+ and/or CD144+, Blue). HSCs from mice treated with IgG control (combined, total of 71 HSCs), anti-TPO antibody (total of 83 HSCs) or anti-MPL antibody (total of 73 HSCs) were analyzed in n = 3 independent experiments for all groups. Scale bar, 20 μm. j, k, Representative 2D images (j) and quantification (k) of the distance between indicated HSCs (Red) and the closest vascular structure (Blue). HSCs from mice treated with vehicle (total = 123), tunicamycin (total = 101) or thapsigargin (total = 98) were analyzed. n = 3 independent samples. Scale bar, 10 μm. l, Diagram showing the structure of MPL agonist and its binding to the juxtamembrane end of MPL. m, Schema depicting the regulation of HSC identity by SEL1L-HRD1 ERAD. Results are shown as mean ± s.d. Two-tailed Student’s t-test (a, d, g), or two-sample Kolmogorov–Smirnov test (i, k) were used to assess statistical significance. ns, not significant. Statistical information and unprocessed blots are provided as source data.
Supplementary Material
Interaction of Sel1l-KO HSCs with the perivascular niche. CD45.2+ Sel1l-KO HSCs (CD150+CD48− LSK, from Sel1lflox/flox; Vav-iCre mice) were purified, labeled with CFSE (green), and transplanted into irradiated CD45.1+ recipient mice. The recipient mice were euthanized after 24 h. The femurs and tibias were collected and perfusion-fixed. The bones were embedded and sectioned for immunostaining with antiCD31 and anti-CD144 antibodies (Magenta). 3D images were captured by a Zeiss LSM780 confocal microscope and videos were produced by the 3D viewer plugins.
Interaction of control HSCs with the perivascular niche. CD45.2+ control HSCs (CD150+CD48− LSK, from Sel1lflox/flox mice) were purified, labeled with CFSE (green), and transplanted into irradiated CD45.1+ recipient mice. The recipient mice were euthanized after 24 h. The femurs and tibias were collected and perfusion-fixed. The bones were embedded and sectioned for immunostaining with anti-CD31 and antiCD144 antibodies (Magenta). 3D images were captured by a Zeiss LSM780 confocal microscope and videos were produced by the 3D viewer plugins.
Acknowledgements.
We thank Margaret Goodell and Katherine King for advice, discussion and critical review of the manuscript. We are grateful to Laurie Glimcher for providing the Xbp1 flox mice. This work was supported by the National Institutes of Health (R01HL146642 and R37CA228304 to X.C.; R01DK107413 and R01CA193235 to D.N.; R01CA016303 to J.M.R.; R01CA228140 to W.L.; R01DK115454 to A.C.; R01 AI1143992 and K22CA 218467 to S.A.; R01AR072018 and R21AG064345 to D.P.; R01HL095675 and R01HL133828 to W.T.; R35GM130292, R01DK120330, and R01DK120047 to L.Q.), U.S. Department of Defense Congressionally Directed Medical Research Programs (W81XWH1910524 to X.C.), Cancer Prevention and Research Institute of Texas (RR150009 CPRIT Scholar in Cancer Research award to X.C.; RR140038 CPRIT Scholar in Cancer Research award to A.C.; RP160283 Baylor College of Medicine Comprehensive Cancer Training Program award to F.P.), St. Baldrick’s Foundation and Alex’s Lemonade Research Foundation (to W.T.). This work was supported by the Cytometry and Cell Sorting Core at Baylor College of Medicine with funding from the CPRIT Core Facility Support Award (CPRIT-RP180672), the NIH (CA125123, S10OD025251, and RR024574) and the assistance of Joel M. Sederstrom. Transmission electron microscopy for this project was supported by the High Resolution Electron Microscopy Facility at MD Anderson Cancer Center with funding from NIH (P30CA016672). Imaging for this work was supported by the Integrated Microscopy Core at Baylor College of Medicine with funding from NIH (DK56338, and CA125123) and CPRIT (RP150578, RP170719).
Footnotes
Financial and non-financial competing interests. J.W. is the co-founder of CoActigon Inc. and Chemical Biology Probes LLC. The other authors declare no competing interests in relation to this work.
REFERENCES:
- 1.Garcia-Prat L, Sousa-Victor P & Munoz-Canoves P Proteostatic and Metabolic Control of Stemness. Cell Stem Cell 20, 593–608 (2017). [DOI] [PubMed] [Google Scholar]
- 2.Vilchez D, Saez I & Dillin A The role of protein clearance mechanisms in organismal ageing and age-related diseases. Nat Commun 5, 5659 (2014). [DOI] [PubMed] [Google Scholar]
- 3.Bakker ST & Passegue E Resilient and resourceful: genome maintenance strategies in hematopoietic stem cells. Exp Hematol 41, 915–923 (2013). [DOI] [PMC free article] [PubMed] [Google Scholar]
- 4.Brodsky JL Cleaning up: ER-associated degradation to the rescue. Cell 151, 1163–1167 (2012). [DOI] [PMC free article] [PubMed] [Google Scholar]
- 5.Morrison SJ & Scadden DT The bone marrow niche for haematopoietic stem cells. Nature 505, 327–334 (2014). [DOI] [PMC free article] [PubMed] [Google Scholar]
- 6.Yoshida H et al. The cis-Regulatory Atlas of the Mouse Immune System. Cell 176, 897–912 e820 (2019). [DOI] [PMC free article] [PubMed] [Google Scholar]
- 7.Lara-Astiaso D et al. Chromatin state dynamics during blood formation. Science 345, 943–949 (2014). [DOI] [PMC free article] [PubMed] [Google Scholar]
- 8.Schinzel RT et al. The Hyaluronidase, TMEM2, Promotes ER Homeostasis and Longevity Independent of the UPRER. Cell 179, 1306–1318.e1318 (2019). [DOI] [PMC free article] [PubMed] [Google Scholar]
- 9.Ehninger A et al. Loss of SPARC protects hematopoietic stem cells from chemotherapy toxicity by accelerating their return to quiescence. Blood 123, 4054–4063 (2014). [DOI] [PubMed] [Google Scholar]
- 10.Sigurdsson V et al. Bile Acids Protect Expanding Hematopoietic Stem Cells from Unfolded Protein Stress in Fetal Liver. Cell Stem Cell 18, 522–532 (2016). [DOI] [PubMed] [Google Scholar]
- 11.van Galen P et al. The unfolded protein response governs integrity of the haematopoietic stem-cell pool during stress. Nature 510, 268–272 (2014). [DOI] [PubMed] [Google Scholar]
- 12.Miharada K, Sigurdsson V & Karlsson S Dppa5 Improves Hematopoietic Stem Cell Activity by Reducing Endoplasmic Reticulum Stress. Cell Reports 7, 1381–1392 (2014). [DOI] [PubMed] [Google Scholar]
- 13.Karagoz GE, Acosta-Alvear D & Walter P The Unfolded Protein Response: Detecting and Responding to Fluctuations in the Protein-Folding Capacity of the Endoplasmic Reticulum. Cold Spring Harb Perspect Biol (2019). [DOI] [PMC free article] [PubMed] [Google Scholar]
- 14.Sun S et al. IRE1alpha is an endogenous substrate of endoplasmic-reticulum-associated degradation. Nat Cell Biol 17, 1546–1555 (2015). [DOI] [PMC free article] [PubMed] [Google Scholar]
- 15.Qi L, Tsai B & Arvan P New Insights into the Physiological Role of Endoplasmic Reticulum-Associated Degradation. Trends in Cell Biology 27, 430–440 (2017). [DOI] [PMC free article] [PubMed] [Google Scholar]
- 16.Cortez L & Sim V The therapeutic potential of chemical chaperones in protein folding diseases. Prion 8 (2014). [DOI] [PMC free article] [PubMed] [Google Scholar]
- 17.Zhao N et al. Pharmacological targeting of MYC-regulated IRE1/XBP1 pathway suppresses MYC-driven breast cancer. J Clin Invest 128, 1283–1299 (2018). [DOI] [PMC free article] [PubMed] [Google Scholar]
- 18.Sidrauski C et al. Pharmacological brake-release of mRNA translation enhances cognitive memory. eLife 2, e00498 (2013). [DOI] [PMC free article] [PubMed] [Google Scholar]
- 19.Pinho S & Frenette PS Haematopoietic stem cell activity and interactions with the niche. Nat Rev Mol Cell Biol 20, 303–320 (2019). [DOI] [PMC free article] [PubMed] [Google Scholar]
- 20.Walter P & Ron D The unfolded protein response: from stress pathway to homeostatic regulation. Science 334, 1081–1086 (2011). [DOI] [PubMed] [Google Scholar]
- 21.Acar M et al. Deep imaging of bone marrow shows non-dividing stem cells are mainly perisinusoidal. Nature 526, 126–130 (2015). [DOI] [PMC free article] [PubMed] [Google Scholar]
- 22.Kunisaki Y et al. Arteriolar niches maintain haematopoietic stem cell quiescence. Nature 502, 637–643 (2013). [DOI] [PMC free article] [PubMed] [Google Scholar]
- 23.Ballmaier M & Germeshausen M Advances in the understanding of congenital amegakaryocytic thrombocytopenia. British Journal of Haematology 146, 3–16 (2009). [DOI] [PubMed] [Google Scholar]
- 24.Varghese LN, Defour JP, Pecquet C & Constantinescu SN The Thrombopoietin Receptor: Structural Basis of Traffic and Activation by Ligand, Mutations, Agonists, and Mutated Calreticulin. Front Endocrinol (Lausanne) 8, 59 (2017). [DOI] [PMC free article] [PubMed] [Google Scholar]
- 25.Fox NE, Lim J, Chen R & Geddis AE F104S c-Mpl responds to a transmembrane domain-binding thrombopoietin receptor agonist: proof of concept that selected receptor mutations in congenital amegakaryocytic thrombocytopenia can be stimulated with alternative thrombopoietic agents. Exp Hematol 38, 384–391 (2010). [DOI] [PMC free article] [PubMed] [Google Scholar]
- 26.Hidalgo San Jose L et al. Modest Declines in Proteome Quality Impair Hematopoietic Stem Cell Self-Renewal. Cell Reports 30, 69–80.e66 (2020). [DOI] [PMC free article] [PubMed] [Google Scholar]
- 27.Signer RA, Magee JA, Salic A & Morrison SJ Haematopoietic stem cells require a highly regulated protein synthesis rate. Nature 509, 49–54 (2014). [DOI] [PMC free article] [PubMed] [Google Scholar]
- 28.Iwawaki T, Akai R, Yamanaka S & Kohno K Function of IRE1 alpha in the placenta is essential for placental development and embryonic viability. Proc Natl Acad Sci U S A 106, 16657–16662 (2009). [DOI] [PMC free article] [PubMed] [Google Scholar]
- 29.Lee AH, Scapa EF, Cohen DE & Glimcher LH Regulation of hepatic lipogenesis by the transcription factor XBP1. Science 320, 1492–1496 (2008). [DOI] [PMC free article] [PubMed] [Google Scholar]
- 30.Sun S et al. Sel1L is indispensable for mammalian endoplasmic reticulum-associated degradation, endoplasmic reticulum homeostasis, and survival. Proc Natl Acad Sci U S A 111, E582–591 (2014). [DOI] [PMC free article] [PubMed] [Google Scholar]
- 31.Murone M, Carpenter DA & de Sauvage FJ Hematopoietic Deficiencies in c-mpl and TPO Knockout Mice. STEM CELLS 16, 1–6 (1998). [DOI] [PubMed] [Google Scholar]
- 32.Miller CL, Dykstra B & Eaves CJ Characterization of Mouse Hematopoietic Stem and Progenitor Cells. Current Protocols in Immunology 80, 22B.22.21–22B.22.31 (2008). [DOI] [PubMed] [Google Scholar]
- 33.Kankaanpaa P et al. BioImageXD: an open, general-purpose and high-throughput image-processing platform. Nat Methods 9, 683–689 (2012). [DOI] [PubMed] [Google Scholar]
- 34.Kawamoto T Use of a new adhesive film for the preparation of multi-purpose fresh-frozen sections from hard tissues, whole-animals, insects and plants. Arch Histol Cytol 66, 123–143 (2003). [DOI] [PubMed] [Google Scholar]
- 35.Kumar S & Filippi MD An Alternative Approach for Sample Preparation with Low Cell Number for TEM Analysis. J Vis Exp (2016). [DOI] [PMC free article] [PubMed] [Google Scholar]
- 36.Fellmann C et al. An Optimized microRNA Backbone for Effective Single-Copy RNAi. Cell Reports 5, 1704–1713 (2013). [DOI] [PubMed] [Google Scholar]
- 37.Sun S et al. IRE1alpha is an endogenous substrate of endoplasmic-reticulum-associated degradation. Nat Cell Biol 17, 1546–1555 (2015). [DOI] [PMC free article] [PubMed] [Google Scholar]
- 38.Nakada D, Saunders TL & Morrison SJ Lkb1 regulates cell cycle and energy metabolism in haematopoietic stem cells. Nature 468, 653 (2010). [DOI] [PMC free article] [PubMed] [Google Scholar]
- 39.Betts S, Speed M & King J Detection of early aggregation intermediates by native gel electrophoresis and native Western blotting, in Methods in Enzymology, Vol. 309 333–350 (Academic Press, 1999). [DOI] [PubMed] [Google Scholar]
Associated Data
This section collects any data citations, data availability statements, or supplementary materials included in this article.
Supplementary Materials
Interaction of Sel1l-KO HSCs with the perivascular niche. CD45.2+ Sel1l-KO HSCs (CD150+CD48− LSK, from Sel1lflox/flox; Vav-iCre mice) were purified, labeled with CFSE (green), and transplanted into irradiated CD45.1+ recipient mice. The recipient mice were euthanized after 24 h. The femurs and tibias were collected and perfusion-fixed. The bones were embedded and sectioned for immunostaining with antiCD31 and anti-CD144 antibodies (Magenta). 3D images were captured by a Zeiss LSM780 confocal microscope and videos were produced by the 3D viewer plugins.
Interaction of control HSCs with the perivascular niche. CD45.2+ control HSCs (CD150+CD48− LSK, from Sel1lflox/flox mice) were purified, labeled with CFSE (green), and transplanted into irradiated CD45.1+ recipient mice. The recipient mice were euthanized after 24 h. The femurs and tibias were collected and perfusion-fixed. The bones were embedded and sectioned for immunostaining with anti-CD31 and antiCD144 antibodies (Magenta). 3D images were captured by a Zeiss LSM780 confocal microscope and videos were produced by the 3D viewer plugins.
Data Availability Statement
Previously published sequencing data that were re-analysed here are available under accession codes GSE60101 for Fig 1a [7] and GSE109125 for Extended Data Fig 2b [6].
Source data are provided with this study. All other data supporting the findings of this study are available from the corresponding author on reasonable request.