

Abstract
l ‐Methionine decarboxylase (MetDC) from Streptomyces sp. 590 is a vitamin B6‐dependent enzyme and catalyzes the non‐oxidative decarboxylation of l ‐methionine to produce 3‐methylthiopropylamine and carbon dioxide. We present here the crystal structures of the ligand‐free form of MetDC and of several enzymatic reaction intermediates. Group II amino acid decarboxylases have many residues in common around the active site but the residues surrounding the side chain of the substrate differ. Based on information obtained from the crystal structure, and mutational and biochemical experiments, we propose a key role for Gln64 in determining the substrate specificity of MetDC, and for Tyr421 as the acid catalyst that participates in protonation after the decarboxylation reaction.
Keywords: amino acid, amino acid decarboxylase, crystal structure, l‐methionine decarboxylase, pyridoxal 5′‐phosphate, reaction mechanism, site‐directed mutagenesis, Streptomyces, substrate specificity, vitamin B6 ‐ dependent enzyme
Abbreviations
- DOPADC
DOPA decarboxylase
- GAD
glutamate decarboxylase
- HisDC
l ‐histidine decarboxylase
- HME
l ‐histidine methyl ester
- MetDC
l ‐methionine decarboxylase
- MME
l ‐methionine methyl ester
- MMT buffer
l ‐malic acid, MES, Tris buffer
- PLP
pyridoxal 5′‐phosphate
- SAD
single‐wavelength anomalous dispersion
1. INTRODUCTION
l ‐Methionine decarboxylase (MetDC, EC: 4.1.1.57), a pyridoxal 5′‐phosphate (PLP) dependent enzyme, catalyzes the non‐oxidative decarboxylation of l ‐methionine to 3‐methylthiopropylamine and carbon dioxide. 1 , 2 In 1980, Misono et al. 2 reported several properties of MetDC using partially purified enzyme from Streptomyces sp. 590. To date, few properties of MetDC have been reported because only a few species have been identified that have this enzyme: Streptomyces sp. strains, 1 , 3 the fern Dryopteris filix‐mas, 4 and the marine dinoflagellate Crypthecodinium cohnii. 5 MetDC has high specificity for l ‐methionine and thus may be appropriate for use as a sensor for l ‐methionine. 3
Amino acid decarboxylase (EC 4.1.1) is a group of enzymes that catalyze the formation of carbon dioxide and amines from amino acids and is commonly found in microorganisms, animals, and plants. The physiological role of amino acid decarboxylase varies depending on the enzyme. For example, glutamate decarboxylase (GAD) is believed to help prevent pH drops in the growth environment by producing amines. 6
Most amino acid decarboxylases are vitamin B6‐dependent enzyme that require PLP as a coenzyme. 7 PLP enzymes can be classified as Fold type I, II, III, IV, or V based on differences in their structures, and PLP dependent amino acid decarboxylases are classified as Fold type I or Fold type III. 8 , 9 , 10 Furthermore, PLP dependent amino acid decarboxylases are classified into four groups based on their amino acid sequences. 7 Group I, Group II, and Group III comprise Fold type I enzymes, and Group IV comprises Fold type III enzymes. The crystal structures of several amino acid decarboxylases have been determined to date. Group I contains only glycine decarboxylase, 11 Group II includes histidine decarboxylase (HisDC), 12 GAD, 13 l ‐tyrosine decarboxylase, 14 l ‐lysine decarboxylase, 15 and aromatic‐l ‐amino acid decarboxylase, 16 Group III includes l ‐ornithine (bacterial) decarboxylase 17 and l ‐arginine decarboxylase (bio‐degradative) 18 and Group IV includes l ‐ornithine decarboxylase (eukaryotic), 19 l ‐arginine decarboxylase, 20 and diaminopimelate decarboxylase. 21
The Group II PLP dependent enzymes comprise the best characterized group and form homodimers or multimers. 16 , 22 , 23 Each dimer has two active centers, with the active site located at the dimer interface. Each monomer of Group II enzymes has three domains (large domain, small domain [C‐terminal domain], and N‐terminal domain). The large domain contains a PLP binding site and comprises seven β‐strands surrounded by eight α‐helices. The N‐terminal domain contributes to the formation of the dimer structure and is formed by three α‐helices. The small domain, comprising the C‐terminal part of the chain, which folds into a three‐ or four‐stranded β sheet covered with helices on one side.
GAD 13 and l ‐tyrosine decarboxylase 14 are the only bacterial Group II amino acid decarboxylase whose structures are known; little information is available regarding the structures of other amino acid decarboxylases, including MetDC. Recently, we reported the recombinant expression, purification and several enzymatic properties of MetDC, including its antitumor activity, 24 as well as a novel method for determining l ‐methionine and/or l ‐homocysteine concentrations using MetDC. 25 In this work, recombinant MetDC enzymes were expressed, purified and crystallized in order to understand their specificity for l ‐methionine based on the X‐ray crystal structure of MetDC. Given the snapshot crystal structures obtained during the enzymatic reaction, we propose a reaction mechanism for MetDC. This is the first report on the crystal structure of MetDC and its reaction mechanism.
2. RESULTS
2.1. Overall structure of MetDC
The structure of MetDC was determined by a single‐wavelength anomalous dispersion (SAD) method using a Pt derivative crystal with a resolution of 3.0 Å, and the final structure was determined at 1.8 Å and refined to an R free/R work of 0.190/0.231. An attempt to solve the MetDC structure by molecular replacement using human histidine decarboxylase (HisDC, 12 PDB code: 4E1O, 22% sequence identity) as an initial model failed. The overall structure of ligand‐free MetDC is shown in Figure 1a,b. The asymmetric unit contains two independent molecules, related by a non‐crystallographic two‐fold axis, and forms a tightly associated dimer structure (Figure 1a). Gel filtration chromatography shows that MetDC is a dimer in solution, 24 suggesting that the biological assembly unit of MetDC is a dimer. Like HisDC 12 and DOPADC, 26 MetDC is divided into three distinct structural domains: an N‐terminal domain (N‐terminus ‐ 63), a large domain (64–449), and a small C‐terminal domain (450 ‐ C‐terminus). The N‐terminal domain lacks the N‐terminal 17 residues and contains one long α‐helix and one short α‐helix (Figure 1b). The large domain of MetDC contains the PLP‐binding site and a seven‐stranded mixed β‐sheet surrounded by eight α‐helices (Figure 1b). The small C‐terminal domain contains a four‐stranded antiparallel β‐sheet with three α‐helices packed against the opposite surface of the large domain (Figure 1b). Structural comparison of MetDC with other group II decarboxylases showed that the MetDC active site pocket has a slightly different conformation compared to those of other decarboxylases.
FIGURE 1.

Crystal structure of the ligand‐free form of MetDC. (a), dimer structure. The N‐terminal, large, and C‐terminal domains of chain a are shown in blue, green, and orange, respectively. Chain B is shown in gray. The PLP molecule is shown as a sphere model. (b), monomer structure. The colors and angle of view are the same as in (a). (c), MetDC active site in ligand‐free form with the final 2mFo‐DFc (blue, contoured at 1σ level) electron density map and the mFo‐DFc (green, contoured at 3σ level) electron density omit map for the K394‐PLP. Hydrogen bonds are shown as black broken lines. The bottom panel shows the chemical structure of lysine‐PLP (internal aldimine). The asterisk denotes the adjacent monomer of the catalytic dimer
2.2. Active site of substrate‐free MetDC (K394‐PLP; internal aldimine form)
The PLP cofactor is located in the large domain in the substrate‐free form of MetDC. PLP binds to Lys394 through a Schiff base linkage (internal aldimine form). The pyridine ring of PLP is sandwiched between the methyl group of Ala338 and the imidazole group of His195 (Figure 1c) and is not parallel to the imidazole ring of His195 in the substrate‐free form but rather is at an angle of about 45° (Figure 1c). The protonated pyridine nitrogen atom (N1) interacts with the carboxyl group of Asp336 through a salt bridge, and the O3 atom of the pyridine ring interacts with the side chain of Thr283 through a hydrogen bond. The phosphate group of PLP is involved in many hydrogen bonds with Ser138, Thr139, Ser391, His393, Gly431*, and Ser432* (the asterisk denotes the adjacent monomer of the catalytic dimer). The negatively charged phosphate group interacts with the dipole of helix α5, which is positively charged at the amino terminal end. These interactions are found in most α‐family PLP‐dependent enzymes.
2.3. PLP‐MME complex (external aldimine form)
The inhibitor l ‐methionine methyl ester (MME) was soaked into the ligand‐free MetDC crystals for 60 min, then the crystals were retrieved with a nylon loop and X‐ray diffraction intensities were collected. The complex structure was determined at 1.51 Å resolution (Table 1), and the electron density map clearly shows all the atom positions in MME (Figure 2a).
TABLE 1.
Soaking condition, data collection, and refinement
| Data set | WT Ligand‐free | Q64A MME complex | WT MME complex | WT product complex | WT product complex | |
|---|---|---|---|---|---|---|
| PLP status | Pt‐SAD | Internal aldimine | Geminal diamine | External aldimine | External aldimine | Geminal diamine |
| K394‐PLP | K394‐PLP‐MME | PLP‐MME | PLP‐product | K394‐PLP‐product | ||
| Stage | – | Step 1 | Step 3 | Step 4 | Step 5 | Step 6 |
| Soaking condition | – | – | 30 mM MME, 20 min | 50 mM MME, 60 min | 50 mM, l ‐Met, 20 min | 30 mM, l ‐Met, 3 s |
| Data collection | ||||||
| Diffraction source | SPring‐8 BL44XU | SPring‐8 BL44XU | SPring‐8 BL44XU | KEK‐PF AR NE3A | KEK‐PF AR NE3A | SPring‐8 BL44XU |
| Wavelength (Å) | 1.06000 | 0.90000 | 0.90000 | 1.00000 | 1.00000 | 0.90000 |
| Camera distance (mm) | 400.0 | 220.0 | 142.1 | 172.0 | 172.0 | 280.0 |
| Rotation range per image (°) | 0.1 | 0.1 | 0.25 | 0.5 | 0.5 | 0.1 |
| Total rotation range (°) | 360 | 180 | 270 | 270 | 270 | 270 |
| Exposure time per image (s) | 0.1 | 0.1 | 0.25 | 0.5 | 0.5 | 0.1 |
| Detector | EIGER X 16 M | EIGER X 16 M | EIGER X 16 M | PILATUS 2 M | PILATUS 2 M | EIGER X 16 M |
| Space group | C2 | C2 | C2 | C2 | C2 | C2 |
| a, b, c (Å) | 125.7, 147.6, 54.4 | 124.6, 147.5, 53.9 | 125.0, 137.4, 53.8 | 125.3, 147.6, 54.0 | 125.2, 147.5, 54.1 | 125.0, 137.4, 53.8 |
| α, β, γ (°) | 90.0, 99.4, 90.0 | 90.0, 99.9, 90.0 | 90.0, 100.0, 90.0 | 90.0, 99.6, 90.0 | 90.0, 99.8, 90.0 | 90.0, 99.5, 90.0 |
| Resolution range (Å) | 50–3.0 (3.08–3.0) | 50–1.8 (1.91–1.8) | 50.0–1.45 (1.54–1.45) | 50.0–1.51 (1.60–1.51) | 50.0–1.61 (1.71–1.61) | 50.0–1.80 (1.91–1.80) |
| Total No. of reflections | 280,612 | 299,345 | 856,615 | 765,723 | 636,320 | 463,151 |
| No. of unique reflections | 38,456 | 86,707 | 166,225 | 143,471 | 122,379 | 88,135 |
| Completeness (%) | 99.6 (96.0) | 92.7 (91.6) | 98.5 (97.8) | 97.9 (96.0) | 98.2 (97.4) | 98.1 (95.9) |
| Multiplicity | 7.3 (7.0) | 3.5 (3.4) | 5.2 (4.8) | 5.3 (5.2) | 5.2 (5.1) | 5.3 (4.8) |
| I/σ(I) | 11.3 (2.6) | 8.4 (1.6) | 12.8 (1.6) | 6.5 (1.3) | 6.9 (1.3) | 8.3 (2.0) |
| CC1/2 | 0.996 (0.835) | 0.996 (0.665) | 0.999 (0.707) | 0.992 (0.623) | 0.993 (0.630) | 0.996 (0.870) |
| R r.i.m. | 0.125 (0.770) | 0.077 (0.704) | 0.059 (0.729) | 0.117 (0.885) | 0.113 (0.914) | 0.084 (0.519) |
| Refinement | ||||||
| Resolution (Å) | – | 1.80 | 1.45 | 1.51 | 1.61 | 1.80 |
| R work / R free | – | 0.190 / 0.231 | 0.175 / 0.194 | 0.173 / 0.195 | 0.176 / 0.203 | 0.203 / 0.238 |
| No of non‐hydrogen atoms | ||||||
| Protein | – | 8221 | 8236 | 8249 | 8265 | 8171 |
| Ligand | – | – | 50 | 50 | 42 | 42 |
| Solvent | – | 281 | 523 | 471 | 243 | 271 |
| Average B‐factors (Å2) | ||||||
| Protein | – | 35.7 | 22.7 | 21.1 | 25.7 | 36.3 |
| Ligand | – | – | 20.2 | 14.9 | 16.6 | 32.0 |
| Solvent | – | 32.8 | 26.0 | 23.7 | 23.0 | 32.1 |
| RMSD | ||||||
| Bond length (Å) | – | 0.012 | 0.010 | 0.010 | 0.011 | 0.010 |
| Bond angle (°) | – | 1.555 | 1.469 | 1.456 | 1.526 | 1.460 |
| Ramachandran plot (%) | ||||||
| Favored regions | – | 91.9 | 92.4 | 92.1 | 92.9 | 90.4 |
| Allowed regions | – | 8.1 | 7.6 | 7.9 | 7.1 | 9.3 |
| Outers | – | 0 | 0 | 0 | 0 | 0.3 |
| PDB code | – | 7CIF | 7CIG | 7CII | 7CIJ | 7CIM |
FIGURE 2.

PLP‐MME complex structure. (a), MetDC active site in MME complex form with the final 2mFo‐DFc (blue, contoured at 1σ level) electron density map and the mFo‐DFc (green, contoured at 3σ level) electron density omit map for the PLP‐MME. Hydrogen bonds are shown as black broken lines. The bottom panel shows the chemical structure of PLP‐MME and the schematic diagram shows the orientation of the carboxyl methyl group and the side chain of MME against the PLP plane. (b), superimposed structures of the ligand‐free form and the PLP‐MME complex of MetDC around the active site. In the ligand‐free form, the A‐chain is shown in green and the B‐chain is shown in cyan. In the MME‐complex form, the A‐chain is colored light pink and the B‐chain is colored light yellow
The rmsd value between ligand‐free form and MME complex is 0.44–0.61 Å when calculated using corresponding Cα atoms. The inhibitor MME binds to MetDC by forming a Schiff base linkage with PLP through its amino moiety, mimicking the external aldimine enzyme‐substrate intermediate. The interactions between MME‐PLP and MetDC are similar to those between PLP and MetDC in the ligand‐free form, with the carboxyl ester group of MME‐PLP interacting with the side chain of His195 through a hydrogen bond. In the substrate‐free form of MetDC, the pyridine ring of PLP is not stacked with the imidazole ring of His195, whereas in the MME‐complex, the PLP ring is stacked between the imidazole ring of His195 and the side chain of Ala338, two highly conserved residues in PLP‐dependent decarboxylases (Type I and Group II). Lys394 binds to PLP through a Schiff base linkage in ligand‐free MetDC and forms an electrostatic interaction with the phosphate moiety of PLP (Figure 2a). Gln64, Ala65, Asn85, His393, Lys394, and Ser432 surround the side chain of MME and might determine the substrate specificity of MetDC. The methyl group of MME‐PLP interacts hydrophobically with Tyr63, Thr283, Tyr421*, and Ile422* (Figure 2a). The conformations of three regions around the active site of MetDC are markedly different between the ligand‐free form and the MME‐complex. The first region is a loop conformation between Ile413* and Ser432*. The side chain conformation of Tyr421* is altered and interacts with MME in the MME‐complex (Figure 2b), and the position of Ile422* is drastically changed to hydrophobically interact with MME. The second is the side chain conformation of Tyr196, which is altered to allow its side chain to interact with the MME moiety. Tyr196 is a key residue and undergoes a drastic conformational change upon the binding of MME (Figure 2b), with its side chain rotating by about 100° around the Cα–Cβ bond in the MetDC‐MME complex. The third is the side chain conformation of His195. In the MME‐complex, stacking interaction between the pyridine ring of PLP and the imidazole ring of His195 is stronger than in the ligand‐free form of MetDC (Figure 2b). The carboxyl ester group of MME is almost perpendicular to the pyridine ring of PLP, facilitating a decarboxylation reaction according to Dunathan's hypothesis 27 and facing the re‐face of the Schiff base (imine C as the prochiral center), whereas the side chain of MME faces the si‐face (Figure 2a).
2.4. Comparison of HisDC and DOPADC with MetDC
The overall structures of HisDC and DOPADC with MetDC are not very similar due to a low sequence identity. The highest sequence identity is 22% between MetDC and HisDC (Figure 1a and Figure S1A and B). The rmsd of the monomers in the MetDC‐MME complex (chain A) and the HisDC‐l ‐histidine methyl ester (HME) complex (chain A) is 2.79 Å between the two structures for 330 Cα atoms (Figure 1b and Figure S1C and D). In contrast, the overall structures of HisDC and DOPADC are more similar, with the rmsd of the monomers in the HisDC‐HME complex (chain A) and the DOPADC‐CarbiDOPA complex (chain A) being 0.86 Å between the two structures for 453 Cα atoms (Figure S1C–E).
Figure S2 shows the sequence alignment generated using MAFFTash. 28 There are many common interactions among the three amino acid decarboxylases (Type I, Group II). In the inhibitor‐complex, the PLP ring is stacked between the imidazole ring of histidine (His195, MetDC; His194, HisDC; His192, DOPADC) and the alanine side chain (Ala338, MetDC; Ala275, HisDC; Ala273, DOPADC) (Figure S3A–D). The protonated pyridine nitrogen atoms (N1) interact with the carboxyl groups of the aspartic acid (Asp336, MetDC; Asp273, HisDC; Asp271, DOPADC) through a salt bridge. The O3′ atoms of the pyridine rings interact with the threonine side chain (Thr197, MetDC; Thr248, HisDC; Thr246, DOPADC) through hydrogen bonds. A tyrosine residue (Tyr421*, MetDC; Tyr334*, HisDC) from the neighboring subunit is located toward the re‐face of the Schiff base (Figure S3A–D), whereas in DOPADC, the corresponding residue (Tyr332*) occurs at the same position in the primary structure but is not included in the PDB coordinates.
Three regions near the active site differ between HisDC, DOPADC and MetDC (Figure S2). The first is near the side chain of the substrate. The tryptophan side chains of HisDC (Trp72) and DOPADC (Trp71) interact with the side chain of the inhibitor, but the corresponding residue is missing in MetDC (Figures S2 and S3). The second is the linker region between the N‐terminal domain and the large domain. The positions of two amino acid residues in HisDC (Tyr81 and Tyr82) and DOPADC (Tyr79 and Phe80) are similar and interact with the inhibitor. The corresponding residues in MetDC are Tyr63 and Gln64 (Figures S2 and S3), with Gln64 being the key residue determining the substrate specificity of MetDC. The third is the N‐terminal end residue of the α9 helix. The residue in HisDC and DOPADC is Ser (Ser195 in HisDC and Ser193 in DOPADC) but Tyr196 in MetDC (Figures S2 and S3). Tyr196 in MetDC is the key residue and undergoes a drastic conformational change upon the binding of MME (see below). The side chains of the inhibitor point toward the si‐face of the Schiff base. There are many hydrogen bonds between the side chains of HME and HisDC, 12 but no hydrogen bonds between the side chains of MME and MetDC. The interaction between the side chains of MME and MetDC has a more hydrophobic nature than those in the HisDC‐HME complex.
2.5. PLP‐product complex (external aldimine form)
The substrate l ‐methionine was soaked into ligand‐free MetDC crystals for 20 min, and then the crystals were retrieved with a nylon loop and X‐ray diffraction data were collected. The complex structure was determined at 1.61 Å resolution (Table 1). The electron density for the PLP‐product complex was clearly observed but there was no electron density for the carboxyl group of the PLP‐compound (Figure S4A), indicating that the enzymatic reaction (decarboxylation) occurred in the MetDC crystal. The rmsd value between ligand‐free form and PLP‐product complex is 0.51–0.60 Å when calculated using corresponding Cα atoms.
The product 3‐methylthiopropylamine binds to MetDC by forming a Schiff base linkage with PLP through its amino moiety, which is the external aldimine for the enzyme‐product intermediate (Figure S4A). Interestingly, the side chain conformations of MME‐PLP and the product‐PLP are almost the same (Figure S4B).
2.6. K394‐PLP‐product complex (geminal diamine form)
The substrate l ‐methionine was soaked into WT ligand‐free MetDC crystals for 3 s, the crystals were picked up with a nylon loop, X‐ray diffraction data were collected, and the complex structure was determined at 1.8 Å resolution (Table 1). The electron density map clearly showed the atom positions for the Lys394‐PLP‐product complex (geminal diamine form) (Figure S5). The PLP moiety binds both the product and Lys394 of MetDC, forming the geminal diamine form (the geminal diamine of the enzyme‐PLP‐product complex). The rmsd value between ligand‐free form and K394‐PLP‐product complex (GEM form) is 0.33–0.46 Å when calculated using corresponding Cα atoms. The conformation of the PLP‐complex is similar to that of the PLP‐product complex (external aldimine form) but there are two major differences. One is the conformation of His195 in the Lys394‐PLP‐product complex (Step 6 in Figure 6), which does not stack on PLP and rather resembles the conformation of His195 in the ligand‐free form (Figure 3a,b). The second is the conformation of Tyr196 in PLP‐MME and the PLP‐product, which resembles the conformation of Tyr196 in the ligand‐free form (open form: Figure 3a,d). However, the conformation of Tyr196 in PLP‐MME and the PLP‐product is in the closed form (Figure 3b,c). The side chain of Tyr196 in the Lys394‐PLP‐product complex can rotate by about 100° around the Cα–Cβ, in contrast to that of the PLP‐MME complex.
FIGURE 6.

All crystal structures obtained in this study during enzymatic reaction. The electron densities and stick models are shown. The chemical structures are shown to the left of the stick models. The Michaelis complex (K394‐PLP internal aldimine form) (Step 2) could not be captured because the process is too fast
FIGURE 3.
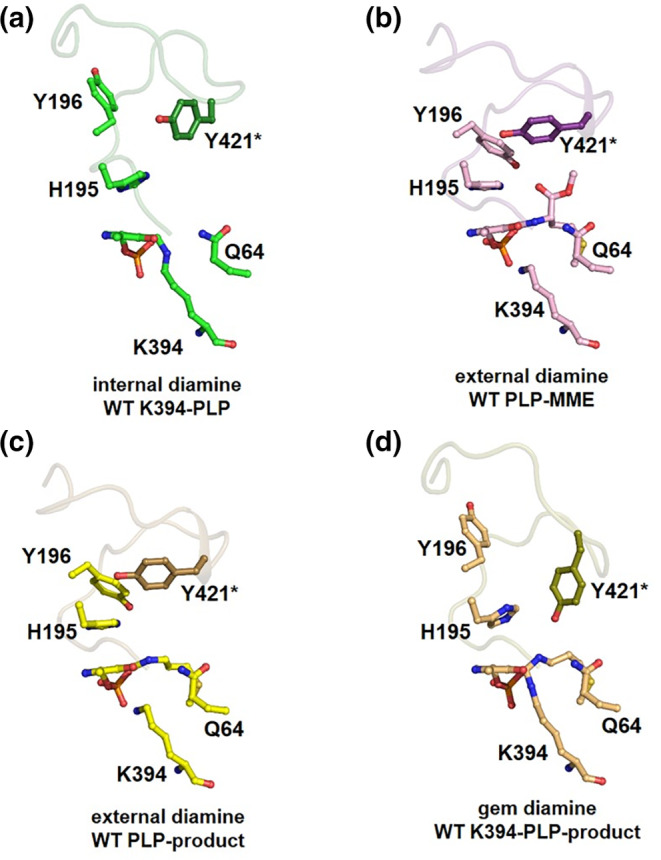
All crystal structures of MetDC obtained in this study in the vicinity of PLP during enzymatic reaction. (a), substrate‐free MetDC (K394‐PLP; internal aldimine form). (b), the PLP‐MME complex (external aldimine form). (c), the PLP‐product complex (external aldimine form). (d), the K394‐PLP‐product complex (geminal diamine)
2.7. The roles of Gln64 and Tyr421 in the MetDC active site
Gln64 is one of the active site residues in MetDC and is likely responsible for substrate recognition (Figure 4a), based on a study on plant aromatic amino acid decarboxylase showing that a tyrosine residue located on a catalytic loop proximal to the active site is primarily responsible for decarboxylase activity. 29 MetDC Tyr421 corresponds to that tyrosine residue (Figure 4a). We investigated the roles of Gln64 and Tyr421 by mutagenesis. The MetDC Q64A and Y421F mutants exhibited an absorption band at 420 nm (Figure S6), suggesting the formation of a Schiff base between PLP and the active‐site lysine 394 residue. A Schiff base is likely critical for catalysis by PLP‐dependent enzymes. However, the enzymatic activity of MetDC Q64A was much lower than that of wild type. In addition, the MetDC Q64A mutant exhibited activity for l ‐histidine whereas MetDC wild type has no activity for l ‐histidine.
FIGURE 4.

Surface model of the substrate binding site of MetDC (PLP‐MME complex) and HisDC (PLP‐HME complex). (a), the active site of the MetDC‐MME complex. The active site region of the A‐chain is shown as a gray surface model (Tyr63; purple, Gln64; orange, Ala65; cyan, His393; red) whereas residues from the B‐chain are shown as a dark green cartoon model (Tyr421* and Ile422* are shown as stick models). The PLP‐inhibitor is shown as yellow (PLP) and white (MME) stick models, respectively. (b), the active site of the HisDC‐HME complex. The active site region of the A‐chain is shown as a gray surface model (Tyr80; purple, Tyr81; orange, Trp72, Pro82 and Ala83; cyan, Ser304; red) whereas residues from the B‐chain are shown as a dark cyan cartoon model (Tyr334* and Leu335* are shown as stick models). The PLP‐inhibitor is shown as yellow (PLP) and white (HME) stick models, respectively
The results of a kinetic analysis of MetDC Q64A are shown in Table 2. When l ‐methionine was used as the substrate, the k cat of the MetDC Q64A mutant decreased by about 50‐fold compared with that of wild type, whereas the K m values for both enzymes were similar. These data indicate that Gln64 plays an important role in the catalytic reaction and substrate specificity of MetDC. The MetDC Y421F mutant was incubated with l ‐methionine, then the production of 3‐methylthiopropylamine in the reaction mixtures was measured. Little 3‐methylthiopropylamine was produced by the MetDC Y421F mutant but rather an aldehyde was generated (Table 3). The addition of l ‐methionine to a solution of MetDC Y421F caused a decrease in the absorption band at 420 nm and a concomitant increase in an absorption band at 320 nm (Figure 5).
TABLE 2.
Kinetic parameters of MetDC and MetDC Q64A mutant
| Enzyme activity a (μmol min−1 mg−1) | K m (mM) | k cat (s−1) | k cat/K m(s−1·M−1) | |
|---|---|---|---|---|
| MetDC wild type (l ‐methionine) | 45.5 ± 1.0 | 5.4 ± 0.15 | 56.2 ± 0.967 | 10407 ± 234 |
| MetDC Q64A mutant (l ‐methionine) | 0.86 ± 0.045 | 5.6 ± 0.70 | 1.1 ± 0.090 | 196 ± 17.4 |
| MetDC Q64A mutant (l ‐histidine) | 0.032 ± 0.0053 | 26.7 ± 2.4 | 0.03 ± 0.001 | 1.1 ± 0.13 |
| MetDC Y421F mutant (l ‐methionine) | 0.21 ± 0.16 | N.D. | N.D. | N.D. |
| MetDC K394A mutant (l ‐methionine) | 0.015 ± 0.014 | N.D. | N.D. | N.D. |
50 mM l ‐methionine or l ‐histidine.
TABLE 3.
Decarboxylation activity and aldehyde producing activity by MetDC and MetDC Y421F mutant
| Enzyme (substrate) | Decarboxylation activity (U/mg) a | Aldehyde producing activity (U/mg) b |
|---|---|---|
| MetDC (l ‐methionine) | 45.5 | N.D. |
| MetDC Y421F mutant (l ‐methionine) | 0.21 | 1.97 |
Activity was assayed by a coupling method with amine oxidase and peroxidase.
Activity was assayed by the MBTH method.
FIGURE 5.

Spectral changes in MetDC and MetDC Y421F in the presence of l ‐methionine. One μl of 200 nmol l ‐methionine was added to 5 μl of MetDC or MetDC Y421F mutant solution (25 mg/ml). Spectra were measured immediately after the addition of l ‐methionine and then at 30 s intervals for 10 min. (a), MetDC; the absorption band at 420 nm increased to provide the final spectrum (dashed line) at 10 min. (b), the MetDC Y421F mutant; the absorption band at 420 nm gradually decreased and that at 320 nm increased, providing the final spectrum (dashed line) at 10 min
2.8. K394‐PLP‐MME complex (geminal diamine form) in the MetDC Q64A mutant
The inhibitor MME was soaked into ligand‐free Q64A mutant MetDC crystals for 20 min, the crystals were picked up with a nylon loop, X‐ray diffraction intensities were collected and the complex structure was determined at 1.45 Å resolution (Table 1). The electron density map clearly showed the atom positions for the Lys394‐PLP‐MME complex (geminal diamine form) (Figure S7). The PLP moiety binds both MME and Lys394 in MetDC, which is the geminal diamine form (mimics the geminal diamine of the enzyme‐PLP‐substrate complex).
The rmsd value between ligand‐free form and K394‐PLP‐MME complex (GEM form) is 0.38–0.62 Å when calculated using corresponding Cα atoms. The overall structures are almost same, the differences are concentrated into the active site. The conformation around the active sites of both the Lys394‐PLP‐MME and PLP‐MME complexes are similar, with both Tyr196 residues in the closed conformation (Figure S7B). The only major difference between these structures is the side chain conformation of Lys394. In the MME complex of Wild type MetDC structure, Lys394 is free however in MME complex of the Q64A MetDC mutant, Lys394 binds to PLP through a Schiff base linkage (geminal diamine form).
3. DISCUSSION
The active sites of MetDC and HisDC are constructed by two subunits: the PLP bound region of one subunit and the activation loop from the neighboring subunit (Figure 4). Two residues in the activation loop of MetDC (Tyr421* and Ile422*) interact hydrophobically with MME. The corresponding residues in HisDC (Tyr334* and Leu335*) are in similar positions and interact with HME. The activation loop of HisDC in the HME bound form is well ordered and clearly assigned in the electron density map. 12 The corresponding loop of DOPADC (328*–339* residues) is missing in the PDB coordinates due to its flexibility. 26 However, the corresponding residue (Tyr332*) of DOPADC occurs at almost the same position in the amino acid sequence, suggesting that these tyrosine residues have the same role in MetDC, HisDC, and DOPADC. The electron density of the flexible loop (418*–425* residues) region of ligand‐free MetDC is lower than that of the MME bound form of MetDC and is exposed to the solvent. Upon binding of the inhibitor MME, the loop moves drastically into the active site and interacts with the bound MME.
We observed that when Gln64 was substituted with alanine, the turnover rate decreased 50‐fold (based on k cat values) and the enzyme acquired a new activity for l ‐histidine (Table 2), suggesting that Gln64 is critical for forming part of the substrate‐binding pocket. This large decrease in turnover rate for the MetDC Q64A mutant is likely due to the loss of the interaction between the Gln64 side chain and the hydroxyl group in PLP via a water molecule (PLP‐OH⋯Water⋯NH2[side chain]‐Gln64). Although we did not determine the kinetic parameters, the catalysis of l ‐methionine by the MetDC Y421F mutant was greatly reduced and the enzyme newly produced an aldehyde (Table 2). Moreover, the addition of l ‐methionine to a solution of MetDC Y421F caused the intensity of the 420 nm absorption band to gradually decrease and a new absorption band to appear at 320 nm (Figure 5b), suggesting that MetDC Y421F catalyzes abortive transamination, 30 in contrast to wild type MetDC (Figure 5a). We also detected H2O2 and ammonia in reaction mixtures of MetDC Y421F mutant and l ‐methionine (data not shown). This result suggests that the MetDC Y421F mutant also catalyzes a rather complicated decarboxylation‐oxidative deamination of l ‐methionine, leading to the production of an aldehyde, CO2, and ammonia, 29 , 31 with the two reactions likely occurring concurrently.
In the HisDC‐HME complex, Tyr334* is in the flexible loop and is highly conserved among Group II decarboxylases, 12 and its hydroxyl group may act as a proton donor to the negatively charged Cα atom (Figure 4). The corresponding hydroxyl group of Tyr421* in the MetDC‐MME complex can position itself close to the Cα atom of MME by rotation around the Cα–Cβ bond.
Many structural features are common between the three amino acid decarboxylases MetDC, HisDC, and DOPADC (Figure S3D). The carboxyl groups of the inhibitors are nearly perpendicular to the pyridoxal rings of PLP, facilitating the decarboxylation reaction according to Dunathan's hypothesis. 27 MetDC is believed to be capable of trapping the hydrophobic amino acid methionine because the substrate recognition pocket generates a relatively hydrophobic environment. In addition, the carboxyl side of methionine likely creates a hydrophobic environment, making methionine electrically unstable, and promoting the decarboxylation reaction. This hydrophobic environment is completed by closing the loop containing Tyr421*; thus, when the substrate binds, the loop recognizes the methionine carboxyl group through interactions with water molecules and residues such as His195 and Gln64. The methionine carboxyl group in the MetDC‐substrate complex is therefore in a more hydrophobic environment than that of HisDC, and the high k cat for MetDC is likely due to the high hydrophobicity of the active site pocket.
We previously discussed the detailed reaction mechanism for human HisDC 32 , 33 , 34 and here we suggest the snapshot of intermediate states along the catalytic cycle of MetDC shown in Figure 6. First, the enzyme is substrate‐free MetDC (Lys394‐PLP; internal aldimine form) (Step 1). The substrate then binds to the active site in the ligand‐free form of MetDC, which is the Michaelis complex (Lys394‐PLP internal aldimine form) (Step 2). This process is too fast to capture the crystal structure of the Michaelis complex form of MetDC. Next, the Lys394‐PLP‐substrate complex (geminal diamine form) is formed (Step 3), which mimics the Lys394‐PLP‐MME Q64A complex. Then, the PLP‐substrate complex (external aldimine form) (Step 4), which is mimicked by the PLP‐MME complex (external aldimine form), is generated and decarboxylation occurs to produce CO2. Next, the PLP‐product complex (external aldimine form) is formed (Step 5). Finally, the Lys394‐PLP‐product complex (geminal diamine form) (Step 6) is formed, the product (3‐methylthiopropylamine) is eliminated, and the enzyme returns to the substrate‐free form of MetDC (Lys394‐PLP; internal aldimine form) (Step 1).
4. MATERIALS AND METHODS
4.1. Cloning and expression of MetDC
The detailed cloning, expression and purification of MetDC with a C‐terminal deca‐histidine tag (His10‐Tag) was previously reported 24 and used here with modification. The gene for MetDC was amplified using PCR and then ligated into the Nco I or Sac I restriction sites of the pET‐52b vector (Merck Novagen), providing the recombinant vector pET‐52b‐MetDC. The recombinant plasmid was transformed into Escherichia coli BL21 (DE3) competent cells. Positive transformants were grown in 200 mL LB medium containing 50 μg ml−1 carbenicillin and 1% (w/w) glucose overnight at 298 K, and then sub‐cultured into 6 L LB medium containing 50 μg ml−1 carbenicillin and 1% (w/w) glucose. Protein expression was induced by the addition of 0.5 mM isopropyl β‐d‐1‐thiogalactopyranoside (IPTG) for 15 hr at 291 K when the OD600 reached 0.4–0.6.
4.2. Site‐directed mutagenesis
Mutant forms of pET52b‐MetDC Q64A and Y421F were constructed from the wild type construct pET52b‐MetDC by the QuikChange method using Primestar Max (Takara, Kyoto, Japan). The method employs double‐stranded DNA as a template. Two complementary oligonucleotide primers containing a degenerate codon at positions Q64 and Y421 were constructed by FASMAC (Kanagawa, Japan) as follows: Q64A sense primer, 5′‐GGCTACGCGGCCACCCAGGACATGCAG‐3′, Q64A antisense primer, 5′‐GGTGGCCGCGTAGCCGACCAGGTGCTT‐3′, Y421F sense primer, 5′‐CCGGACTTCATCGGCGCCCCGGACACC‐3′, Y421F antisense primer, 5′‐GCCGATGAAGTCCGGCTGGGACGGCGG‐3′. Dpn I endonucleases were used to digest the parental DNA template. The nucleotides in italics indicate the introduced mutations. The reaction mixture was used to transform competent E. coli Top10 cells.
4.3. Purification of MetDC
The cell pellet (20 g) was suspended in 120 ml of lysis buffer (50 mM HEPES‐NaOH pH 7.5, 150 mM NaCl, 100 μM PLP, 0.5 mg/ml lysozyme, 6 tablets of cOmplete Mini EDTA‐free Protease Inhibitor Cocktail [Roche]), disrupted by sonication at 277 K, and then centrifuged at 20,000 g for 30 min at 277 K to remove the cell debris. The supernatant was diluted to 120 ml with equilibrium buffer (50 mM HEPES‐NaOH pH 7.5, 500 mM NaCl, 50 mM imidazole, 100 μM PLP). The supernatant containing MetDC was applied to a 5 ml His Trap FF column (GE Healthcare) pre‐equilibrated with the equilibrium buffer. After washing the column with 150 ml of equilibrium buffer, the bound protein was eluted with elution buffer (50 mM HEPES‐NaOH pH 7.5, 500 mM NaCl, 500 mM imidazole, 100 μM PLP). The eluted MetDC was detected by measuring A280 and electrophoresis. The fractions containing MetDC were collected and concentrated using an Amicon Ultra centrifugal concentrator (50 kDa molecular weight cut off, Merck Millipore). The His10‐tag was removed by the addition of biotinated thrombin (Merck Novagen), the product was applied to a TALON (Takara Clontech) resin column, and then a streptavidin agarose (Merck Novagen) resin column, to remove biotinated thrombin and uncleaved MetDC (MetDC‐His10). The purified protein without the His10‐tag was concentrated to about 25 mg/ml using an Amicon Ultra centrifugal concentrator (50 kDa molecular weight cut off) and stored at 193 K.
4.4. Crystallization
Crystallization conditions were screened by the sitting‐drop vapor diffusion method using the reservoir solutions supplied in commercially available screening kits (Crystal Screen, Crystal Screen 2, and PEG‐ION 1, 2 and PEGRx 1, 2 SaltRx 1, 2 and Grid Screen PEG6000 from Hampton Research, and Wizard Classic 1, 2, 3, and 4 and Wizard cryo 1 and 2 from Emerald BioSystems). A droplet made by mixing 1.0 μl of purified MetDC (5, 10, and 15 mg/ml) with an equal volume of a reservoir solution was equilibrated against 100 μl of the reservoir solution at 293 K. After identifying the initial crystallization condition (Wizard Classic 4 No. 19), crystallization conditions were optimized by fine‐tuning the pH in the range 5.0–7.0 and the PEG1500 concentration in the range 20–34% (w/v) using the hanging drop vapor diffusion method at 293 K. The crystals were obtained using 0.1 M MMT buffer pH 6.0 containing 23.5% (w/v) PEG1500 as a precipitate. The crystals were grown to dimensions of 0.2 × 0.2 × 0.05 mm in 7 days in 293 K. Before being flash‐cooled in liquid nitrogen, the crystals were soaked in reservoir solution supplemented with 20% glycerol as a cryoprotectant. No homologous structures corresponding to the amino‐acid sequence of MetDC was available in the PDB (the highest homology is about 22%), and so we also prepared platinum‐derivative crystals by soaking for 2 days in 1 mM K2PtCl4 dissolved in the cryoprotectant solution.
To determine the crystal structure of the MetDC‐compound complex, substrate/product‐free form crystals were soaked in a solution containing 40% (w/v) PEG1500 and a defined concentration of complexing compounds, and then flash‐frozen in liquid nitrogen. Detailed compound soaking conditions are summarized in Table 1.
4.5. Data collection and processing
Pt‐bound crystal data were collected at a wavelength of 1.06000 Å under gaseous nitrogen (100 K) on beamline BL44XU at the SPring‐8 facility (Harima, Japan). The Pt‐soaked crystals diffracted to 3.0 Å resolution. The native data set was collected to 1.8 Å resolution at a wavelength of 0.90000 Å under gaseous nitrogen (100 K) on beamline BL44XU. All MetDC‐compound complex data were collected on beamline BL44XU and beamline AR‐NE3A of the Photon Factory facility (Tsukuba, Japan). All diffraction data were processed and scaled using XDS and XSCALE. 35 The statistics for data collection and processing are summarized in Table 1.
4.6. Structure determination
For SAD phasing, the Pt derivative dataset was collected at a wavelength of 1.06000 Å, near the wavelength of the Pt absorption edge. The resolution of the SAD data was 3.0 Å with a high multiplicity (7.3) and I/σ (11.3). We determined the six positions of the Pt atoms and obtained the initial phase (FOM = 0.185) using CRANK2 36 in CCP4. After density modification using CRANK2 (FOM = 0.512), we obtained the initial model of MetDC (645 residues; coverage 57.9%). The ligand‐free structure of MetDC (1.8 Å resolution) was determined by the molecular replacement method using the initial SAD model as the model structure. Manual model building and crystallographic refinement for the native structure of MetDC was performed using COOT 37 and REFMAC5 38 to final R work/R free values of 0.190/0.231. All crystal structures for the MetDC‐compound complex were determined using the molecular replacement method with MORLEP, 39 with the ligand‐free form of MetDC as a search model. Manual model rebuilding and crystallographic refinement of MetDC complex structures were performed using COOT 37 and REFMAC5. 38 Refinement statistics are summarized in Table 1.
4.7. Enzyme assay
The activity of MetDC was determined by detecting hydrogen peroxide using a color development method with copper amine oxidase, 25 or aldehydes formed with 3‐methyl‐2‐benzothiazolone hydrazone hydrochloride as described previously (MBTH method). 40
The assay mixture (0.9 ml) contained 50 or 100 mM l ‐methionine or l ‐histidine, 0.04 mM PLP, and enzyme in 0.1 M KPB (pH 6.0). The reaction was carried out at 45°C. The enzymatic reaction was terminated by heating the reaction mixture to 80°C for 5 min or by adding 100 μl of 50% trichloroacetic acid (MBTH method). One unit of MetDC and MetDC mutant activity was defined as the amount of enzyme that catalyzes the formation of 1 μmol of product per minute.
4.8. Spectroscopic analysis
All spectroscopic measurements were carried out at room temperature in 0.1 M MES (2‐(N‐morpholino) ethane sulfonic acid) buffer pH 7.0 and 0.1 mM PLP. The absorption spectra were measured using an Eppendorf BioSpectrophotometer kinetic (Eppendorf). The concentration of MetDC or MetDC mutant was determined by the Bradford method using a Bio‐Rad protein assay kit with bovine serum albumin as a standard. The concentration of MetDC or MetDC mutant was adjusted to 25 mg/ml for spectroscopic measurements.
ACCESSION CODES
The atomic coordinates and structure factors have been deposited in the Protein Data Bank (http://wwpdb.org/), PDB#7CIF (WT Ligand‐free), PDB #7CIG (Q64A mutant MME complex), PDB#7CII (WT MME complex), PDB#7CIJ (WT product complex, external aldimine) and PDB#7CIM (WT product complex, geminal diamine).
ACKNOWLEGMENTS
We thank all the staff members of beamline BL44XU (SPring‐8) and AR‐NE3A (KEK‐PF) for assistance with X‐ray diffraction data collection. The synchrotron radiation experiments were performed at AR‐NE3A of the Photon Factory (proposal nos. 2017G022 and 2019G007) and at BL44XU of SPring‐8 (proposal nos. 2017A6722, 2017B6722, 2018A6820, 2018B6820, 2019A6918, 2019B6918). The synchrotron beamline BL44XU at SPring‐8 was used under the Cooperative Research Program of the Institute for Protein Research, Osaka University. We are extremely grateful to Prof. Hideyuki Hayashi (Osaka Medical College) for important insights and discussions.
CONFLICT OF INTEREST
The authors declare no potential conflict of interest.
AUTHOR CONTRIBUTIONS
Atsushi Okawa: Data curation; formal analysis; investigation; writing‐original draft. Tomoo Shiba: Formal analysis; investigation; methodology; supervision; writing‐original draft; writing‐review and editing. Masaya Hayashi: Data curation; formal analysis; investigation. Yuki Onoue: Data curation; formal analysis; investigation. Masaki Murota: Data curation; formal analysis; investigation. Dan Sato: Data curation; formal analysis; investigation. Junko Inagaki: Methodology. Takashi Tamura: Methodology. Shigeharu Harada: Methodology; supervision. Kenji Inagaki: Methodology; supervision; writing‐original draft; writing‐review and editing
Supporting information
Appendix S1. Supporting Information.
Okawa A, Shiba T, Hayashi M, et al. Structural basis for substrate specificity of l‐methionine decarboxylase. Protein Science. 2021;30:663–677. 10.1002/pro.4027
Contributor Information
Tomoo Shiba, Email: tshiba@kit.ac.jp.
Kenji Inagaki, Email: kinagaki@okayama-u.ac.jp.
REFERENCES
- 1. Hagino H, Nakayama K. Amino acid metabolism in microorganisms: Part IV. l‐methionine decarboxylase produced by a Streptomyces strain. Agric Biol Chem. 1968;32:727–733. [Google Scholar]
- 2. Misono H, Kawabata Y, Toyosato M, Yamamoto T, Soda K. Purification and properties of l‐methionine decarboxylase of Streptomyces sp. Bull Inst Chem Res Kyoto Univ. 1980;58:323–333. [Google Scholar]
- 3. Hagino H, Nakayama K. Amino acid metabolism in microorganisms: Part II. Production of 3‐methylthiopropylamine from methionine by certain strains of Streptomyces . Agric Biol Chem. 1967;31:1367–1371. [Google Scholar]
- 4. Stevenson DE, Akhtar M, Gani D. Streptomyces l‐methionine decarboxylase: Purification and properties of the enzyme and stereochemical course of substrate decarboxylation. Biochemistry. 1990;29:7660–7666. [DOI] [PubMed] [Google Scholar]
- 5. Kitaguchi H, Uchida A, Ishida Y. Purification and characterization of l‐methionine decarboxylase from Crypthecodinium cohnii . Fish Sci. 1999;65:613–617. [Google Scholar]
- 6. Gut H, Pennacchietti E, John RA, et al. Escherichia coli acid resistance: pH‐sensing, activation by chloride and autoinhibition in GadB. EMBO J. 2006;25:2643–2651. [DOI] [PMC free article] [PubMed] [Google Scholar]
- 7. Sandmeier E, Hale TI, Christen P. Multiple evolutionary origin of pyridoxal‐5′‐phosphate‐dependent amino acid decarboxylases. Eur J Biochem. 1994;21:997–1002. [DOI] [PubMed] [Google Scholar]
- 8. Jansonius JN. Structure, evolution and action of vitamin B6‐dependent enzymes. Curr Opin Struc Biol. 1998;8:759–769. [DOI] [PubMed] [Google Scholar]
- 9. Eliot AC, Kirsch JF. Pyridoxal phosphate enzymes: Mechanistic, structural, and evolutionary considerations. Annu Rev Biochem. 2004;73:383–415. [DOI] [PubMed] [Google Scholar]
- 10. El‐Sayed AS, Shindia AA (2011) PLP‐dependent enzymes: A potent therapeutic approach for cancer and cardiovascular diseases. in Targets in Gene Therapy, IntechOpen. DOI: 10.5772/17449. [DOI]
- 11. Nakai T, Nakagawa N, Maoka N, Masui R, Kuramitsu S, Kamiya N. Structure of P‐protein of the glycine cleavage system: Implications for nonketotic hyperglycinemia. EMBO J. 2005;24:1523–1536. [DOI] [PMC free article] [PubMed] [Google Scholar]
- 12. Komori H, Nitta Y, Ueno H, Higuchi Y. Structural study reveals that Ser‐354 determines substrate specificity on human histidine decarboxylase. J Biol Chem. 2012;287:29175–29183. [DOI] [PMC free article] [PubMed] [Google Scholar]
- 13. Capitani G, De Biase D, Aurizi C, Gut H, Bossa F, Grütter MG. Crystal structure and functional analysis of Escherichia coli glutamate decarboxylase. EMBO J. 2003;22:4027–4037. [DOI] [PMC free article] [PubMed] [Google Scholar]
- 14. Zhu H, Xu G, Zhang K, et al. Crystal structure of tyrosine decarboxylase and identification of key residues involved in conformational swing and substrate binding. Sci Rep. 2016;6:27779. [DOI] [PMC free article] [PubMed] [Google Scholar]
- 15. Sagong H‐Y, Son HF, Kim S, Kim Y‐H, Kim I‐K, Kim K‐J. Crystal structure and pyridoxal 5‐phosphate binding property of lysine decarboxylase from Selenomonas ruminantium . PLoS One. 2016;11:e0166667. [DOI] [PMC free article] [PubMed] [Google Scholar]
- 16. Giardina G, Montioli R, Gianni S, et al. Open conformation of human DOPA decarboxylase reveals the mechanism of PLP addition to group II decarboxylases. Proc Natl Acad Sci U S A. 2011;108:20514–20519. [DOI] [PMC free article] [PubMed] [Google Scholar]
- 17. Lee J, Michael AJ, Martynowski D, Goldsmith EJ, Phillips MA. Phylogenetic diversity and the structural basis of substrate specificity in the β/α‐barrel fold basic amino acid decarboxylases. J Biol Chem. 2007;282:27115–27125. [DOI] [PubMed] [Google Scholar]
- 18. Andréll J, Hicks MG, Palmer T, Carpenter EP, Iwata S, Maher MJ. Crystal structure of the acid‐induced arginine decarboxylase from Escherichia coli: Reversible decamer assembly controls enzyme activity. Biochemistry. 2009;48:3915–3927. [DOI] [PubMed] [Google Scholar]
- 19. Almrud JJ, Oliveira MA, Kern AD, Grishin NV, Phillips MA, Hackert ML. Crystal structure of human ornithine decarboxylase at 2.1 Å resolution: Structural insights to antizyme binding. J Mol Biol. 2000;295:7–16. [DOI] [PubMed] [Google Scholar]
- 20. Tolbert WD, Graham DE, White RH, Ealick SE. Pyruvoyl‐dependent arginine decarboxylase from Methanococcus jannaschii: Crystal structures of the self‐cleaved and S53A proenzyme forms. Structure. 2003;11:285–294. [DOI] [PubMed] [Google Scholar]
- 21. Ray SS, Bonanno JB, Rajashankar K, et al. Cocrystal structures of diaminopimelate decarboxylase: Mechanism, evolution, and inhibition of an antibiotic resistance accessory factor. Structure. 2002;10:1499–1508. [DOI] [PubMed] [Google Scholar]
- 22. Schneider G, Käck H, Lindqvist Y. The manifold of vitamin B6 dependent enzymes. Structure. 2000;8:R1–R6. [DOI] [PubMed] [Google Scholar]
- 23. Capitani G, Tramonti A, Bossa F, Grütter MG, De Biase D. The critical structural role of a highly conserved histidine residue in group II amino acid decarboxylases. FEBS Lett. 2003;554:41–44. [DOI] [PubMed] [Google Scholar]
- 24. Hayashi M, Okada A, Yamamoto K, et al. Gene cloning, recombinant expression, purification and characterization of l‐methionine decarboxylase from Streptomyces sp. 590. J Biochem. 2017;161:389–398. [DOI] [PubMed] [Google Scholar]
- 25. Okawa A, Hayashi M, Inagaki J, Okajima T, Tamura T, Inagaki K. Novel method for l‐methionine determination using l‐methionine decarboxylase and application of the enzyme for l‐homocysteine determination. Biosci Biotechnol Biochem. 2020;84:927–935. [DOI] [PubMed] [Google Scholar]
- 26. Burkhard P, Dominici P, Borri‐Voltattorni C, Jansonius JN, Malashkevich VN. Structural insight into Parkinson's disease treatment from drug‐inhibited DOPA decarboxylase. Nat Struct Mol Biol. 2001;8:963–967. [DOI] [PubMed] [Google Scholar]
- 27. Dunathan HC. Conformation and reaction specificity in pyridoxal phosphate enzymes. Proc Natl Acad Sci U S A. 1966;55:712–716. [DOI] [PMC free article] [PubMed] [Google Scholar]
- 28. Katoh K, Misawa K, Kuma K‐i, Miyata T. MAFFT: A novel method for rapid multiple sequence alignment based on fast Fourier transform. Nucleic Acids Res. 2002;30:3059–3066. [DOI] [PMC free article] [PubMed] [Google Scholar]
- 29. Torrens‐Spence MP, Liu PY, Ding HZ, Harich K, Gillaspy G, Li JY. Biochemical evaluation of the decarboxylation and decarboxylation‐deamination activities of plant aromatic amino acid decarboxylases. J Biol Chem. 2013;288:2376–2387. [DOI] [PMC free article] [PubMed] [Google Scholar]
- 30. Porter TG, Spink DC, Martin SB, Martin DL. Transaminations catalyzed by brain glutamate‐decarboxylase. Biochem J. 1985;231:705–712. [DOI] [PMC free article] [PubMed] [Google Scholar]
- 31. Bertoldi M, Gonsalvi M, Contestabile R, Voltattorni CB. Mutation of tyrosine 332 to phenylalanine converts dopa decarboxylase into a decarboxylation‐dependent oxidative deaminase. J Biol Chem. 2002;277:36357–36362. [DOI] [PubMed] [Google Scholar]
- 32. Oliveira EF, Cerqueira NM, Fernandes PA, Ramos MJ. Mechanism of formation of the internal aldimine in pyridoxal 5′‐phosphate‐dependent enzymes. J Am Chem Soc. 2011;133:15496–15505. [DOI] [PubMed] [Google Scholar]
- 33. Fernandes HS, Ramos MJ, Cerqueira NM. The catalytic mechanism of the pyridoxal‐5′‐phosphate‐dependent enzyme, histidine decarboxylase: A computational study. Chem A Eur J. 2017;23:9162–9173. [DOI] [PubMed] [Google Scholar]
- 34. Olmo MT, Sanchez‐Jimenez F, Medina MA, Hayashi H. Spectroscopic analysis of recombinant rat histidine decarboxylase. J Biochem. 2002;132:433–439. [DOI] [PubMed] [Google Scholar]
- 35. Kabsch W. XDS. Acta Cryst D. 2010;66:125–132. [DOI] [PMC free article] [PubMed] [Google Scholar]
- 36. Skubák P, Pannu NS. Automatic protein structure solution from weak X‐ray data. Nat Commun. 2013;4:2777. [DOI] [PMC free article] [PubMed] [Google Scholar]
- 37. Emsley P, Cowtan K. Coot: Model‐building tools for molecular graphics. Acta Cryst D. 2004;60:2126–2132. [DOI] [PubMed] [Google Scholar]
- 38. Murshudov GN, Vagin AA, Dodson EJ. Refinement of macromolecular structures by the maximum‐likelihood method. Acta Cryst D. 1997;53:240–255. [DOI] [PubMed] [Google Scholar]
- 39. Vagin A, Teplyakov A. MOLREP: An automated program for molecular replacement. J Appl Cryst. 1997;30:1022–1025. [Google Scholar]
- 40. Soda K. Microdetermination of d‐amino acids and d‐amino acid oxidase activity with 3‐methyl‐2‐benzothiazolone hydrazone hydrochloride. Anal Biochem. 1968;25:228–235. [DOI] [PubMed] [Google Scholar]
Associated Data
This section collects any data citations, data availability statements, or supplementary materials included in this article.
Supplementary Materials
Appendix S1. Supporting Information.