PLOS ONE logoLink to PLOS ONE
. 2021 Feb 17;16(2):e0247041. doi: 10.1371/journal.pone.0247041

16S rRNA gene sequencing of rectal swab in patients affected by COVID-19

Antonio Mazzarelli 1,#, Maria Letizia Giancola 1,#, Anna Farina 1, Luisa Marchioni 1, Martina Rueca 1, Cesare Ernesto Maria Gruber 1, Barbara Bartolini 1, Tommaso Ascoli Bartoli 1, Gaetano Maffongelli 1, Maria Rosaria Capobianchi 1, Giuseppe Ippolito 1, Antonino Di Caro 1,*, Emanuele Nicastri 1,, Valerio Pazienza 2,; INMI COVID-19 study group
Editor: Jane Foster3
PMCID: PMC7888592  PMID: 33596245

Abstract

COronaVIrus Disease-2019 (COVID-19) is a pandemic respiratory infection caused by a new betacoronavirus, the Severe Acute Respiratory Syndrome-CoronaVirus-2 (SARS-CoV-2). Few data are reported on the gut microbiota in COVID-19 patients. 16S rRNA gene sequencing was performed to reveal an altered composition of the gut microbiota in patients with COVID-19 pneumonia admitted in intensive care unit (ICU) (i-COVID19), or in infectious disease wards (w-COVID19) as compared to controls (CTRL). i-COVID19 patients showed a decrease of Chao1 index as compared to CTRL and w-COVID19 patients indicating that patients in ICU displayed a lower microbial richness while no change was observed as for Shannon Index. At the phylum level, an increase of Proteobacteria was detected in w-COVID19 patients as compared to CTRL. A decrease of Fusobacteria and Spirochetes has been found, with the latter decreased in i-COVID19 patients as compared to CTRL. Significant changes in gut microbial communities in patients with COVID-19 pneumonia with different disease severity compared to CTRL have been identified. Our preliminary data may provide valuable information and promising biomarkers for the diagnosis of the disease and, when validated in larger cohort, it could facilitate the stratification of patients based on the microbial signature.

1. Introduction

COronaVIrus Disease-2019 (COVID-19) is a pandemic respiratory infection caused by a new betacoronavirus infection, the Severe Acute Respiratory Syndrome-CoronaVirus-2 (SARS-CoV-2). It may progress rapidly to acute respiratory distress syndrome with remarkable morbidity and mortality [1]. However, SARS-CoV-2 can be detected in specimens from different sites and therefore it could potentially be transmitted in other ways than respiratory droplets [2]. In this regard, recent studies reported that SARS-CoV-2 RNA has been found in anal swabs, meaning that the virus could potentially be transmitted also through oral-fecal route [3]. These findings might suggest that other organs apart from lung might be additional sites for virus entry, repository and/or replication. Gastrointestinal (GI) symptoms, such as diarrhea (2%-10.1%), nausea and vomiting (1%-3.6%), are not very common at present in COVID-19 patients [4]. Nevertheless, an important proportion of patients were observed during the global pandemic showing atypical gastrointestinal symptoms [5].

Recently, several studies have demonstrated that respiratory infections are associated with changes of the gut microbiota composition [6, 7]. Typically, Bacteroidetes and Firmicutes prevail in the gut microbiota while potentially pathogenic species, such as some of those belonging to the phylum Proteobacteria, are present in a minor percentage [8, 9]. Current studies evaluate the relationship between the lung and the GI microbiota but this connection is not completely understood [10]. Patients with respiratory infections generally have gut dysfunction, which is related to a more severe clinical course of the disease. This phenomenon can also be observed in COVID-19 patients [5].

The gut microbiota has been shown to affect pulmonary health through cross-talk between the gut microbiota and the lungs, which is referred to as the “gut-lung axis” [11]. However, the “gut-lung axis” is supposed to be bidirectional: the gut microbiota, through microbial products and immune-modulators released upon recognition of commensals and pathogens by intestinal immune cells, can regulate lung immunity, influence the lung microbiota, and vice versa [12, 13]. Previous studies have shown that the modulation of the gut microbiota can reduce the severity of enteritis and ventilator-associated pneumonia by interacting with early replication of the viruses in the pulmonary epithelium, as in the case of influenza virus [14].

Angiotensin-converting enzyme 2 (ACE2) is the main receptor of SARS-CoV [14] and of SARS-CoV-2 [15]. This receptor is highly expressed in both the respiratory tract and GI, so it is possible to consider that SARS-CoV-2 uses ACE2 receptor to get into both body districts [16, 17].

All these virus characteristics raise a remarkable possibility that the pulmonary disease caused by SARS-CoV-2 may influence the gut microbiota [5].

In this pilot study, we performed the 16S RNA sequencing of fecal samples from COVID-19 in patients admitted to the National Institute for Infectious Disease (INMI) L. Spallanzani in Rome, Italy, between April 15, 2020 and May 31, 2020.

2. Methods

2.1. Study design

All the subjects agreed to participate according to the ethical guidelines of the 2013 Declaration of Helsinki signing an informed consent under the Ethical committee of the National Institute for Infectious Diseases Lazzaro Spallanzani—IRCCS approval number (n. 9/2020; n. 3 23.12.2019) and followed the same pre-analytical and analytical procedures, including fecal samples collection and storage. Data were analyzed anonymously.

From April 15 2020 and May 31 2020, rectal swabs were collected from patients hospitalized to INMI Spallanzani in Rome with confirmed or suspected SARS-CoV-2 infections. Fifteen out of 23 patients were affected by COVID-19 while 8 patients were COVID-19 negative.

All patients had pneumonia and were classified in three groups: a) COVID-19 patients with nose-pharyngeal swab positive for SARS-CoV-2, >18 years of age admitted in infectious disease wards at the time of the rectal swab execution (w-COVID19); b) COVID-19 patients with nose-pharyngeal swab positive for SARS-CoV-2, >18 years of age admitted in ICU (i-COVID19); c) ‘controls’: patients admitted in the same time period with nose-pharyngeal swab negative for SARS-CoV-2 infections, hospitalized in ICU and/or in infectious disease ward (CTRL). We performed the rectal swab one or two days after the hospitalization.

Patient data, including laboratory test results and clinical manifestations, were obtained from Laboratory Information Systems (LIS) and clinical records.

Rectal swabs from COVID-19 patients were processed in the laboratory within 4 hours after collection or stored at -80°C until analysis.

2.2. DNA extraction

Samples were treated with 500 μl of Lysis Buffer ATL (QIAGEN, Hilden, Germany) at 56°C for 10 min with 20 μl Proteinase K (Darmstadt, Germany) before DNA extraction. Microbial DNA was extracted from 500 μl of sample using Qiasymphony automatic extractor (QIAGEN, Hilden, Germany) according to the manufacturer’s protocol.

2.3. S sequencing and analysis

DNA samples were generated from PCR amplicons targeting the hypervariable regions V2, V4, V8 and V3-6, 7–9 of the 16S gene and libraries were processed using the Ion 16S metagenomics Kit. Ion Xpress Plus Fragment Library kit was used for libraries obtainment. Sequencing was performed on Ion 530 chip by Ion S5 sequencer (Ion Torrent-ThermoFisher Scientific).

The sequencing run has generated in total 16x10^6 reads with the 77% of high quality reads (21% low quality, 2% test fragments). Finally we obtained 5.5x10^5 reads per sample (reads length were 244 bp mean, 260 bp median and 289 bp mode) and all analyzed specimens showed a suitable library’s profile. The analysis was performed by 16S Metagenomics GAIA 2.0 software and DESeq2 package software. Sequence data generated as FASTQ files, were analyzed using the 16S Metagenomics GAIA 2.0 software which performs the quality control of the reads/pairs (i.e., trimming, clipping and adapter removal steps) through FastQC and BBDuk. The reads/pairs are mapped with BWA-MEM against the 16S databases (GAIA based on NCBI). Differential expression analysis using DESeq2 package to test for differential analysis by use of negative binomial generalized linear models was used. Only changes with FDR below 0.05 were considered significant. The percent similarity used to determine species and genus calls was 93% at genus, 97% at species. PCoA analysis was obtained with GAIA software based on Bray-Curtis dissimilarities.

2.4. Statistical analysis

To evaluate if any clinical or laboratory variables are significantly different between patient cohorts, one-way ANOVA test and Kruskal-Wallis rank sum test were performed in R environment (www.cran.r-project.org) using aov and kruskal.test functions, respectively. Venn diagrams were obtained with Venny 2.1.0.

3. Results

3.1. Study population

The study population included 23 hospitalized inpatients; 15 out of 23 were patients with confirmed SARS-CoV-2 infection, 9 w-COVID19 and 6 i-COVID19, 8 were CTRL (three hospitalized in ICU and five in floor). Clinical data of the study patients are shown in Table 1. Overall, thirteen patients (56%) were male; median age was 67 (IQR 44–83). All patients presented pneumonia (for our CTRL six out of eight had bacteria pneumonia while 2 CTRL had non-COVID-19 viral pneumonia) and none of them had diarrhea when the rectal swab was performed (one or two days after the hospitalization). ANOVA and Kruskal-Wallis analysis in Table 1, showed that the p-values of the variables between our patient cohorts was not significant except for ferritin level that is significantly lower in ICU patients.

Table 1. Clinical and serologic data of the 23 enrolled patients.

Variables w-COVID19 i-COVID19 CTRL ANOVA Kruskal-Wallis p-values
p-values*
Number of patients (N = 23) 9 6 8 - -
Median age, years (IQR) 67 (IQR 44–83) 70 (64–74) 69 (51–77) 0.702 0.7165
Male, n (%) 5 (55%) 3 (50%) 5 (62%) - -
Comorbidities, n (%) 7 (78%) 6 (100%) 6 (75%) - -
Coinfections, n (%) 1 (11%) 4 (67%) 0 (0%) - -
Colonization, n (%) 2 (22%) 3 (50%) 0 (0%) - -
E. Faecium, E. Faecalis 2 E. Faecium, 1 E. Faecalis
Antibiotic therapy at swab, n (%) 5 (55%) 3 (50%) 3 (37%) - -
Lymphocytes, mm3 (IQR) 1310 (1190–1480) 810 (437–995) 1400 (950–2070) 0.201 0.1503
C-reactive protein, mg/dl (IQR) 3.25 (0.84–6.54) 10.94 (3.09–12.53) 1.45 (0.92–5.04) 0.228 0.2711
Ferritin, ng/ml (IQR) 393 (169–616) 960 (565–1121) 289 (88–251) 0.0153 0.04481
Fibrinogen, mg/dl (IQR) 529 (422–616) 469 (346–600) 470 (332–527) 0.751 0.6684
D-dimer, ng/ml (IQR) 715 (265–1760) 638 (350–865) 760 (442–1845) 0.309 0.7042

Table 1: w-COVID19: patients affected by COVID-19 hospitalized in ward for highly infectious diseases; i-COVID19: patients hospitalized in intensive care unit; CTRL: patients admitted in the same time period with nose-pharyngeal swab negative for SARS-CoV-2 infections; IQR: interquartile range.

*p-value, P <0.05 are considered statistically significant. ± Enterococcus faecium and Enterococcus faecalis.

Eleven patients (48%) were receiving antibiotic therapy one or at most two days before the rectal swab was collected: 5 w-COVID19, 3 i-COVID19 and 3 CTRL.

Nineteen patients (83%) had one or more comorbidities, mainly cardiovascular and brain disorders. A concomitant infection (5 patients) and/or colonization (5 patients, although harbor a potentially pathological bacterium in their intestines namely Enterococcus faecium and Enterococcus faecalis, without developing the disease and consequently without the need of therapies or further tests) was found in seven patients (30%), 5 of them were hospitalized in ICU.

3.2. Microbial richness and diversity indices in COVID-19 patients as compared to CTRL

To understand the gut microbiota alterations between w-COVID19 and i-COVID19 patients with CTRL, as a first step we evaluated the richness and Shannon indices among the different groups. As shown in Fig 1A, Chao1 index was significantly decreased in i-COVID19 as compared to w-COVID19 (p = 0.02) and CTRL (p = 0.006). The same trend was also observed for Shannon index without reaching the statistical significance (Fig 1B).

Fig 1.
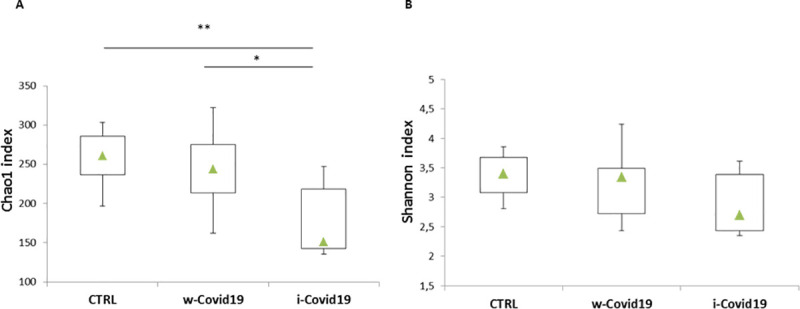
Fig 1

Box-plots of Chao1 index of species richness (A) and Shannon index of species diversity (B) in w-COVID19, i-COVID19 patients and CTRL. Triangles indicate the medians and Q1 and Q3 are reported.

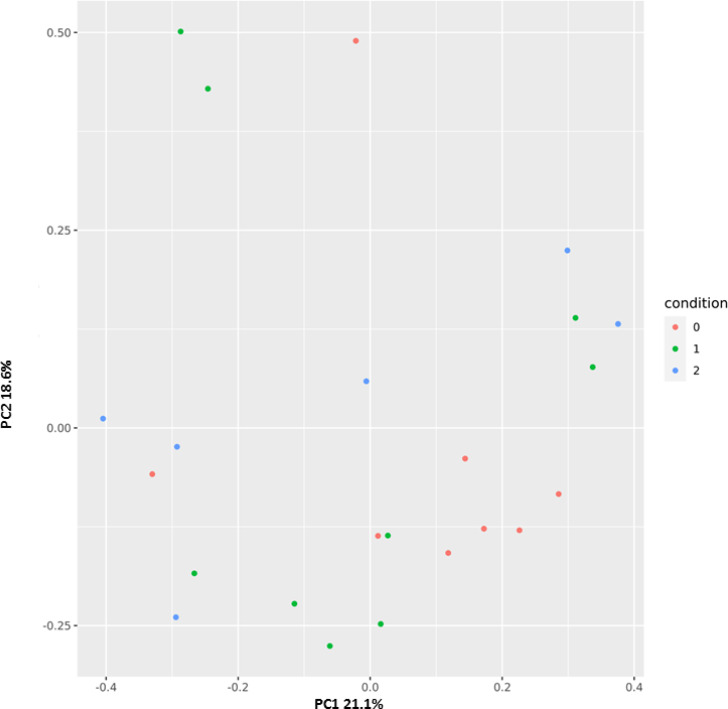
Principal coordinates analysis (PCoA) was performed to cluster the microbial communities at the Family operational taxonomic unit (OTU) level based on Bray-Curtis distances. Fig 2 displayed distinct patterns among the three groups CTRL (red) w-COVID19 (green) and i-COVID19 (blue).

Fig 2. Principal coordinates plot (PCoA) based on Bray-Curtis distances at family level showing a clustering pattern among samples obtained from controls (red), w-COVID19 (green) and i-COVID19 (blue).

Fig 2

3.3. Microbiota profiles of w-COVID19 and i-COVID19 patients as compared to CTRL

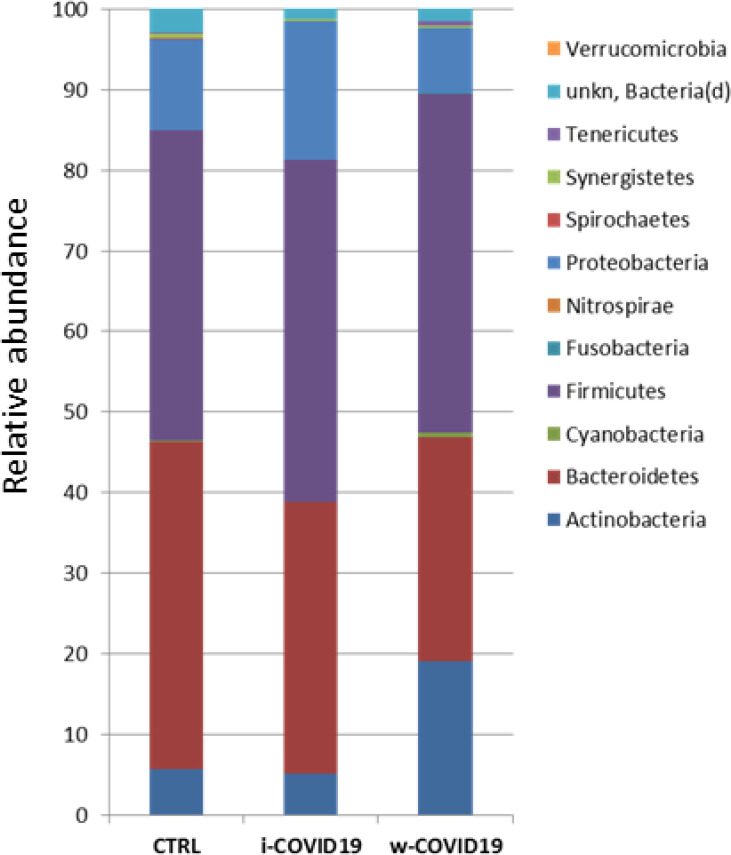
At the Phylum level, Proteobacteria were significantly increased in w-COVID19 patients as compared to CTRL (17.1% vs 11.3% respectively FDR = 0.03) while Spirochaetes and Fusobacteria were decreased (0% vs 0.08% FDR = 0.00 and 0.02% vs 0.04% FDR = 0.00 respectively). When comparing w-COVID19 and i-COVID19 patients’ microbiota no significant changes were observed at the Phylum level (Fig 3 and S1S3 Tables).

Fig 3. Microbiota composition of w-COVID19, i-COVID19 patients and CTRL, at the phylum level.

Fig 3

The mean value of all the detected taxa is represented.

At the Family level, a number of potential pathogenic bacteria such as Peptostreptococcaceae, Enterobacteriaceae, Staphylococcaceae, Vibrionaceae, Aerococcaceae, Dermabacteraceae, Actinobacteria and others were increased in w-COVID19 as compared to CTRL while Nitrospiraceae, Propionibacteriaceae, Aeromonadaceae, Moraxellaceae, Mycoplasmataceae were significantly reduced together with others reported in Fig 3 and S4 Table. When considering the i-COVID19 as compared to CTRL, in addition to some bacteria in common with w-COVID19 patients (i.e. Staphylococcaceae, Aerococcaceae, Dermabacteraceae, Actinobacteria and so on Fig 4, and Fig 8A and S5 Table) Erysipelotrichaceae, Microbacteriaceae, Mycobacteriaceae, Pseudonocardiaceae, Brevibacteriaceae, and others reported in S5 Table were significantly increased while Carnobacteriaceae, Coriobacteriaceae and Mycoplasmataceae were significantly reduced.

Fig 4. Microbiota composition of w-COVID19, i-COVID19 patients and CTRL, at the family level.
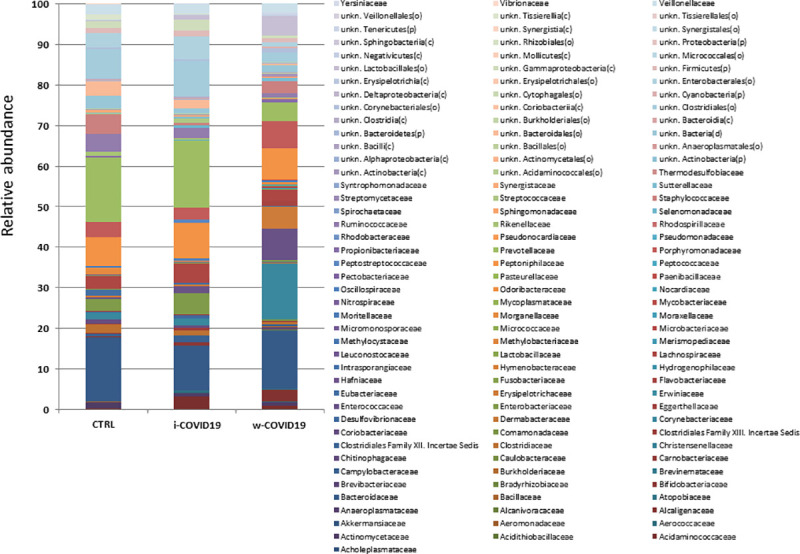
Fig 4

The mean value of all the detected taxa is represented.

Fig 8.
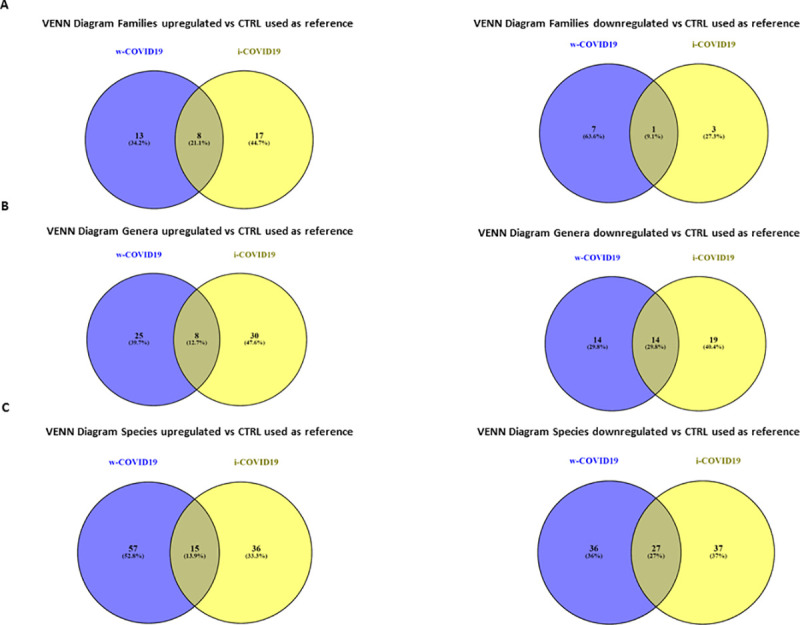
Fig 8

Venn diagrams showing the number of distinct and shared families (A), genera (B) and species (C) up and decreased between subjects grouped by w-COVID19, i-COVID19 patients as compared to CTRL used as referenced.

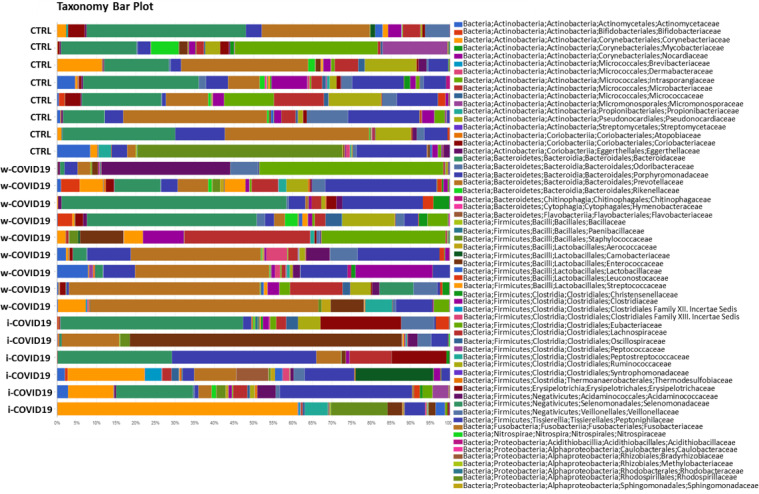
Nevertheless Staphylococcaceae, Microbacteriaceae, Micrococcaceae, Pseudonocardiaceae, Erysipelotrichales and others reported in S6 Table were significantly higher in i-COVID-19 as compared to w-COVID19. Carnobacteriaceae, Pectobacteriaceae, Moritellaceae, Selenomonadaceae, Micromonosporaceae, Coriobacteriaceae and few others were significantly decreased in i-COVID19 as compared to w-COVID19. Individual microbiota profiles are provided in Figs 5 and 6 at the Phylum and Family level.

Fig 5. Taxonomy bar plot showing the individual microbiota profile at phylum levels.

Fig 5

Fig 6. Taxonomy bar plot showing the individual microbiota profile at family levels.
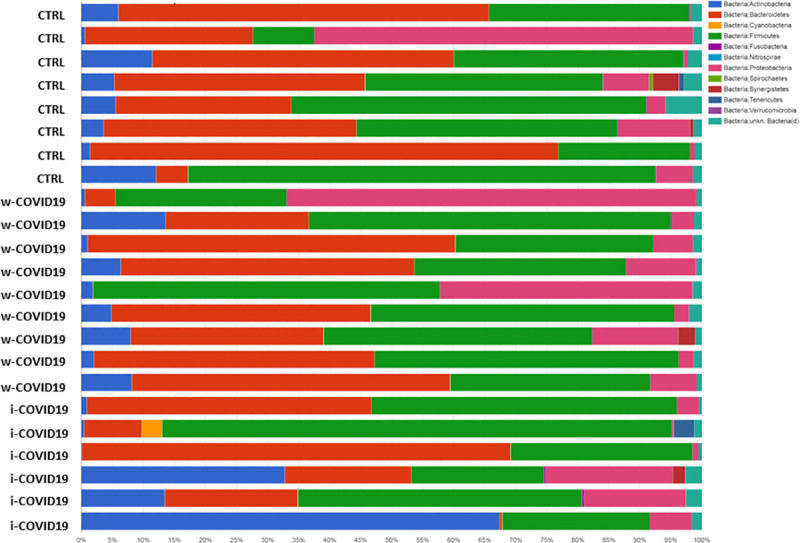
Fig 6

Moreover, unsupervised hierarchical analysis at the family level (Fig 7) revealed a characteristic microbial signature in CTRL segregated from that one of COVID-19 positive patients. Strikingly, a distinct profile can be distinguished between i-COVID19 and w-COVID19 with the latter being closer to CTRL. Microbiota analysis at lower taxonomic levels (genera and species, reported in S7S12 Tables).

Fig 7. Heatmap of one-way hierarchical clustering of differentially abundant families among the three cohorts.
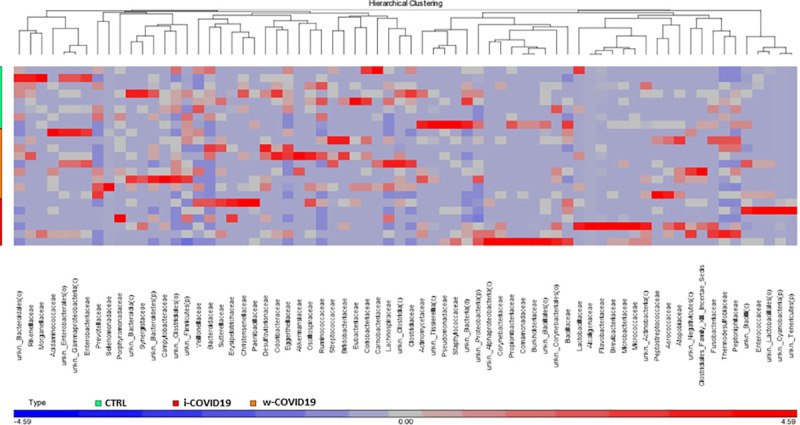
Fig 7

A dual-color code counts for species up- (red) and down-represented (blue), respectively.

3.4. Differences in microbial populations of w-COVID19 and i-COVID19 patients in comparison to CTRL

At lower taxonomic levels, many differences with CTRL group emerged in both i- and w-COVID19 patients. VENN diagrams showed the number of families (Fig 8A) genera (Fig 8B) and species (Fig 8C) shared or distinctive of the two different groups as compared to CTRL used as reference. Although w-COVID19 and i-COVID19 patients share a number of increased and decreased bacteria, a distinctive bacteria profile can be also observed when compared to CTRL (S13 Table).

4. Discussion

It is nowadays well recognized that virus infections can alter the host’s microbiota at different sites [18, 19], however is less clear whether changes of microbiota have direct or indirect effects i.e. limiting or promoting viral infections. Microbiota’s products such as short chain fatty acids, metabolites or bacteriocine may directly interact with viral particles to alter infectivity or responses to therapy [20, 21].

In our pilot study we demonstrated that SARS-CoV-2 infection is associated with major changes in gut microbiota profile of the patients. The main findings are the reduction of microbial richness in i-COVID19 as compared to CTRL and w-COVID19 indicating that patients in ICU displayed a lower microbial richness as measured by Chao1 index. For the Shannon index the same trend was also observed, but without reaching statistical significance. Our results are in line with those recently obtained by Zuo et al, in which enrichment of opportunistic pathogens and loss of beneficial bacteria was observed [22].

Moreover, ANOVA and Kruskal-Wallis analysis reveal that the variables between our patient cohorts was not noteworthy except for ferritin level that is significantly lower in ICU patients.

Ferritin is a marker of inflammation and the high levels of ferritin detected in i-COVID19 patients in comparison to w-COVID19, may be associate with a greater severity of the disease and adverse outcomes. Normally, ferritin is able to activate macrophages that when stimulated begin to secrete cytokines that at low concentrations, help to protect the body from viruses and bacteria. On the other hand, high levels of ferritin activate more macrophages that produce the so-called "cytokine storm" which can be lethal for the body [23].

As for gut microbiota, antibiotics use can obviously determine a further loss of heterogeneity and composition, leading to down regulation of beneficial symbionts and exacerbation of gut dysbiosis, and for this reason the avoidance of unnecessary antibiotics use in the treatment of viral pneumonia is strongly suggested, as antibiotics can eliminate beneficial bacteria and weaken the gut barrier [24]. Although an increase of pro-inflammatory and potential pathogenic bacteria such as Peptostreptococcaceae, Enterobacteriaceae, Staphylococcaceae, Vibrionaceae, Aerococcaceae, Dermabacteraceae, Actinobacteria [2527], is confirmed in w-COVID19 and i-COVID19 patients, with some of them found in both groups, hierarchical analysis shows a distinct profile between i- and w-COVID19 with the latter being closer to CTRL (Fig 4). Notably, a profound dysbiosis (Fig 5) was observed in one ward patient (90-year-old patient with diabetes, meningioma and osteoporosis in association with an increase of C-Reactive Protein (CRP) and lymphocytes), with a significant increase in Proteobacteria and a relevant reduction in Bacteriodetes, reflecting an important inflammatory state. Growing evidence has shown that perturbation of the gut microbial community may fuel blooms of otherwise low abundance and harmful bacteria which can further exacerbate the intestinal inflammation. Indeed, dysbiosis in the distal gut is often characterized by a decrease in the prevalence of strict anaerobes and an increased relative abundance of facultative anaerobic bacteria.

This could also contribute to the lower severity of symptoms of w-COVID19 as compared to patients admitted to ICU. This evidence is confirmed by our three CTRL patients hospitalzed in ICU that had a nasopharyngeal PCR negative for SARS-CoV2. The latter, showed an increase in Erysipelotrichaceae which are involved in inflammation-related disorders of the GI tract [28]. These data are in agreement with a previous study [29] where Erysipelotrichaceae were found associated with COVID-19 severity. Noteworthy a strong decrease of Faecalibacterium (which is associated to Crohn’s disease, colonrectal tumor, diabetes and non alcoholic steatohepatitis) [30] in i-COVID19 patients was detected together with a reduction of Ruminococcaceae, Clostridiaceae which are involved in Short Chain Fatty Acids (SCFAs) production among which butyrate presents potent antinflammatory properties [31]. Among the species (S9 Table), it is worth of note the decrease of Bacteroides dorei, Bacteroides thetaiotaomicron in w-COVID19 as compared to CTRL which are known to down-regulate ACE2 expression in the murine gut [19].

There are several limitations to this study. First, this is a pilot study conducted in a single center in urban area in central Italy with a limited number of enrolled patients. Our preliminary observations on the likely impact of SARS-CoV-2 infection on gut microbiota need to be confirmed in larger comparative trial including paucysimptomatic or asymptomatic COVID-19 patients a part from those admitted with severe or critical disease. Moreover, another limit of our work was related to our ICU patients; as reported in several papers in literature, the long stay of ICU patients can change the microbiota gut composition [32]. Definitely more patients should be included to evaluate the microbiota composition in non-COVID-19 ICU patients in comparison with w-COVID19 and i-COVID19. However, among our CTRL, three subjects were non-COVID-19 ICU patients and rectal swabs were performed one or two days after the hospitalization. Furthermore, the antibiotic treatment for ICU patients could have affected the microbiota profile, but the antibiotic therapy was administered a few days after the hospitalization in ICU, so could be assumed that this effect may not be significant. As for the link between clinical data and microbiota profiles, we are aware that age, gender and co-morbidities are factors that strongly influence the microbiota profiles, however in our study population these demographic features were not statistically significant different among the three groups.

The use of rectal swabs for gut microbiota analysis instead of standard fecal samples is not fully endorsed. Currently, feces or mucosal biopsy specimens are the biological samples most commonly used for standard 16S analysis [33]. However, as shown in several studies, stool and rectal swab are highly similar, indicating that these sampling methods could be used interchangeably to assess the community structure of the distal GI tract [34, 35]. Finally, no data on the molecular detection of SARS-CoV-2 in rectal swabs are presented in our patients. Current knowledge on whether fecal transmissibility (either orally, through fomites, or by aspiration of fecal contaminated droplets) is likely to be an important mode of COVID-19 transmission, is still limited [36]. Although out of our objective, this is an interesting research topic, particularly in health care facilities with incontinent residents.

In conclusion, significant changes in gut microbial communities in patients with COVID-19 pneumonia with different disease severity compared to CTRL have been identified. Specific microbial signatures in COVID-19 patients and roles of gut microbiota in different phase of disease and hospital setting are needed to be investigated and validated in larger cohorts.

Supporting information

S1 Table. Deseq2_phylum level_w-COVID19 vs CTRL used as reference.

(XLSX)

S2 Table. Deseq2_phylum level_i-COVID19 vs CTRL used as reference.

(XLSX)

S3 Table. Deseq2_phylum level_i-COVID19 vs w-COVID19 used as reference.

(XLSX)

S4 Table. Deseq2_family level_w-COVID19 vs CTRL used as reference.

(XLSX)

S5 Table. Deseq2_family level_i-COVID19 vs CTRL used as reference.

(XLSX)

S6 Table. Deseq2_family level_i-COVID19 vs w-COVID19 used as reference.

(XLSX)

S7 Table. Deseq2_genus level_w-COVID19 vs CTRL used as reference.

(XLSX)

S8 Table. Deseq2_genus level_i-COVID19 vs CTRL used as reference.

(XLSX)

S9 Table. Deseq2_genus level_i-COVID19 vs w-COVID19 used as reference.

(XLSX)

S10 Table. Deseq2_species level_w-COVID19 vs CTRL used as reference.

(XLSX)

S11 Table. Deseq2_species level_i-COVID19 vs CTRL used as reference.

(XLSX)

S12 Table. Deseq2_specie level_i-COVID19 vs w-COVID19 used as reference.

(XLSX)

S13 Table. Shared and distinct bacteria in w-COVID19 and i-COVID19 versus CTRL used as reference.

(XLSX)

Acknowledgments

The authors gratefully acknowledge the Collaborators Members of the National Institute for Infectious Diseases (INMI) COVID-19 study group: Maria Alessandra Abbonizio, Amina Abdeddaim, Chiara Agrati, Fabrizio Albarello, Gioia Amadei, Alessandra Amendola, Mario Antonini, Andrea Antinori, Tommaso Ascoli Bartoli, Francesco Baldini, Raffaella Barbaro, Barbara Bartolini, Rita Bellagamba, Martina Benigni, Nazario Bevilacqua, Gianlugi Biava, Michele Bibas, Licia Bordi, Veronica Bordoni, Evangelo Boumis, Marta Branca, Donatella Busso, Marta Camici, Paolo Campioni, Maria Rosaria Capobianchi, Alessandro Capone, Cinzia Caporale, Emanuela Caraffa, Ilaria Caravella, Fabrizio Carletti, Concetta Castilletti, Adriana Cataldo, Stefano Cerilli, Carlotta Cerva, Roberta Chiappini, Pierangelo Chinello, Carmine Ciaralli, Stefania Cicalini, Francesca Colavita, Angela Corpolongo, Massimo Cristofaro, Salvatore Curiale, Alessandra D’Abramo, Cristina Dantimi, Alessia De Angelis, Giada De Angelis, Maria Grazia De Palo, Federico De Zottis, Virginia Di Bari, Rachele Di Lorenzo, Federica Di Stefano, Gianpiero D’Offizi, Davide Donno, Francesca Faraglia, Federica Ferraro, Lorena Fiorentini, Andrea Frustaci, Matteo Fusetti, Vincenzo Galati, Roberta Gagliardini, Paola Gallì, Gabriele Garotto, Saba Gebremeskel Tekle, Maria Letizia Giancola, Filippo Giansante, Emanuela Giombini, Guido Granata, Maria Cristina Greci, Elisabetta Grilli, Susanna Grisetti, Gina Gualano, Fabio Iacomi, Giuseppina Iannicelli, Giuseppe Ippolito, Eleonora Lalle, Simone Lanini, Daniele Lapa, Luciana Lepore, Raffaella Libertone, Raffaella Lionetti, Giuseppina Liuzzi, Laura Loiacono, Andrea Lucia, Franco Lufrani, Manuela Macchione, Gaetano Maffongelli, Alessandra Marani, Luisa Marchioni, Andrea Mariano, Maria Cristina Marini, Micaela Maritti, Alessandra Mastrobattista, Giulia Matusali, Valentina Mazzotta, Paola Mencarini, Silvia Meschi, Francesco Messina, Annalisa Mondi, Marzia Montalbano, Chiara Montaldo, Silvia Mosti, Silvia Murachelli, Maria Musso, Emanuele Nicastri, Pasquale Noto, Roberto Noto, Alessandra Oliva, Sandrine Ottou, Claudia Palazzolo, Emanuele Pallini, Fabrizio Palmieri, Carlo Pareo, Virgilio Passeri, Federico Pelliccioni, Antonella Petrecchia, Ada Petrone, Nicola Petrosillo, Elisa Pianura, Carmela Pinnetti, Maria Pisciotta, Silvia Pittalis, Agostina Pontarelli, Costanza Proietti, Vincenzo Puro, Paolo Migliorisi Ramazzini, Alessia Rianda, Gabriele Rinonapoli, Silvia Rosati, Martina Rueca, Alessandra Sacchi, Alessandro Sampaolesi, Francesco Sanasi, Carmen Santagata, Alessandra Scarabello, Silvana Scarcia, Vincenzo Schininà, Paola Scognamiglio, Laura Scorzolini, Giulia Stazi, Fabrizio Taglietti, Chiara Taibi, Roberto Tonnarini, Simone Topino, Francesco Vaia, Francesco Vairo, Maria Beatrice Valli, Alessandra Vergori, Laura Vincenzi, Ubaldo Visco-Comandini, Serena Vita, Pietro Vittozzi, and Mauro Zaccarelli.

Data Availability

Raw 16S sequencing data are available in the NCBI Sequence Read Archive under Accession Number PRJNA681516 (https://www.ncbi.nlm.nih.gov/bioproject/PRJNA681516).

Funding Statement

This study was supported by funds to the Istituto Nazionale per le Malattie Infettive (INMI) Lazzaro Spallanzani IRCCS, Rome, Italy, from the Ministero della Salute (Ricerca Corrente, linea 1; COVID- 2020-12371817), the European Commission – Horizon 2020 (EU project 101003544 – CoNVat; EU project 101003551 – EXSCALATE4CoV; EU project 101005111 DECISION; EU project 101005075-Unità Operativa Complessa Microbiologia e Banca Biologica Direttore: Dr. Antonino Di Caro- Tel. 0655170685 Fax 065594555 KRONO) and the European Virus Archive – GLOBAL (grants no. 653316 and no. 871029). Valerio Pazienza is supported by Italian Association for Cancer Research (AIRC) under IG 2019 - ID. 23006 project – P.I. The funders had no role in study design, data collection and analysis, decision to publish, or preparation of the manuscript.

References

  • 1.Yi Ye, Philip N.P. Lagniton, Sen Ye, Enqin Li, and Ren-He Xu. COVID-19: what has been learned and to be learned about the novel coronavirus disease. Int J Biol Sci. 2020; 16(10): 1753–1766. 10.7150/ijbs.45134 [DOI] [PMC free article] [PubMed] [Google Scholar]
  • 2.Wang Wenling, Xu Yanli, Gao Ruqin, Lu Roujian, Han Kai, Wu Guizhen, et al. Detection of SARS-CoV-2 in Different Types of Clinical Specimens. JAMA 2020. March 11;323(18):1843–1844. 10.1001/jama.2020.3786 [DOI] [PMC free article] [PubMed] [Google Scholar]
  • 3.Zhang Wei, Du Rong-Hui, Li Bei, Zheng Xiao-Shuang, Yang Xing-Lou, Hu Ben, et al. Molecular and serological investigation of 2019-nCoV infected patients: implication of multiple shedding routes. Emerg Microbes Infect. 2020;9(1):386–389. 10.1080/22221751.2020.1729071 [DOI] [PMC free article] [PubMed] [Google Scholar]
  • 4.Chen Nanshan, Zhou Min, Dong Xuan, Qu Jieming, Gong Fengyun, Han Yang, et al. Epidemiological and clinical characteristics of 99 cases of 2019 novel coronavirus pneumonia in Wuhan, China: a descriptive study. Lancet. 2020;395(10223):507–513. 10.1016/S0140-6736(20)30211-7 [DOI] [PMC free article] [PubMed] [Google Scholar]
  • 5.Qin Yan Gao, Ying Xuan Chen, Jing Yuan Fang. 2019 Novel Coronavirus Infection and Gastrointestinal Tract. J Dig Dis. 2020. March;21(3):125–126. 10.1111/1751-2980.12851 [DOI] [PMC free article] [PubMed] [Google Scholar]
  • 6.Helen T Groves, Sophie L Higham, Miriam F Moffatt, Michael J Cox, John S Tregoning. Respiratory Viral Infection Alters the Gut Microbiota by Inducing Inappetence. mBio. 2020. February 18;11(1):e03236–19. 10.1128/mBio.03236-19 [DOI] [PMC free article] [PubMed] [Google Scholar]
  • 7.Zhang Dapeng, Li Sha, Wang Ning, Tan Hor-Yue, Zhang Zhimin, Feng Yibin. The cross-talk between gut microbiota and lungs in common lung diseases. Front Microbiol. 2020. February 25;11:301 10.3389/fmicb.2020.00301 [DOI] [PMC free article] [PubMed] [Google Scholar]
  • 8.Fontana A, Panebianco C, Picchianti-Diamanti A, Laganà B, Cavalieri D, Potenza A, et al. Gut Microbiota Profiles Differ among Individuals Depending on Their Region of Origin: An Italian Pilot Study. Int J Environ Res Public Health. 2019. October 23;16(21):4065 10.3390/ijerph16214065 [DOI] [PMC free article] [PubMed] [Google Scholar]
  • 9.Iebba V., Totino V., Gagliardi A., Santangelo F., Cacciotti F., Trancassini M., et al. Eubiosis and dysbiosis: The two sides of the microbiota. New Microbiol. 2016, 39, 1–12 [PubMed] [Google Scholar]
  • 10.Zuo T, Zhang F, Lui GCY, Yeoh YK, Li AYL, Zhan H, et al. Alterations in Gut Microbiota of Patients With COVID-19 During Time of Hospitalization. Gastroenterology. 2020. May 19:S0016-5085(20)34701-6. 10.1053/j.gastro.2020.05.048 [DOI] [PMC free article] [PubMed] [Google Scholar]
  • 11.Marslnd BJ, Trompette A, Gollwitzer ES. The Gut-Lung Axis in Respiratory Disease. Ann Am Thorac Soc. 2015. November;12 Suppl 2:S150–6. 10.1513/AnnalsATS.201503-133AW [DOI] [PubMed] [Google Scholar]
  • 12.Samuelson DR, Welsh DA, Shellito JE. Regulation of lung immunity and host defense by the intestinal microbiota. Front Microbiol. 2015. October 7;6:1085 10.3389/fmicb.2015.01085 [DOI] [PMC free article] [PubMed] [Google Scholar]
  • 13.Dumas Alexi, Bernard Lucie, Poquet Yannick, Geanncarlo Lugo-Villarino, Olivier Neyrolles. The Role of the Lung Microbiota and the Gut-Lung Axis in Respiratory Infectious Diseases. Cell Microbiol 2018. December;20(12):e12966 10.1111/cmi.12966 [DOI] [PubMed] [Google Scholar]
  • 14.Konrad C Bradley Katja Finsterbusch, Schnepf Daniel, Crotta Stefania, Llorian Miriam, Davidson Sophia, et al. Microbiota-driven tonic interferon signals in lung stromal cells protect from influenza virus infection. Cell Rep. 2019;28(1):245–256.e4. 10.1016/j.celrep.2019.05.105 [DOI] [PubMed] [Google Scholar]
  • 15.W. L, Moore M. J., Vasilieva N., Sui J., Wong S. K., Berne M.A., et al. , Angiotensin-converting enzyme 2 is a functional receptor for the SARS coronavirus, Nature 426 (2003) 450–454. 10.1038/nature02145 [DOI] [PMC free article] [PubMed] [Google Scholar]
  • 16.Lu Roujian, Zhao Xiang, Li Juan, Niu Peihua, Yang Bo, Wu Honglong, et al. Genomic characterization and epidemiology of 2019 novel coronavirus: implications for virus origins and receptor binding. Lancet. 2020;395(10224):565–574. 10.1016/S0140-6736(20)30251-8 [DOI] [PMC free article] [PubMed] [Google Scholar]
  • 17.Liang Weichng, Feng Zhijie, Rao Shitao, Xiao Cuicui, Xue Xingyang, Lin Zexiao, et al. Diarrhoea May Be Underestimated: A Missing Link in 2019 Novel Coronavirus. Gut. 2020. June;69(6):1141–1143. 10.1136/gutjnl-2020-320832 [DOI] [PubMed] [Google Scholar]
  • 18.John g, Barnaby Edward Young, Ong Sharon. COVID-19 in Gastroenterology: A Clinical Perspective. Gut. 2020. June;69(6):1144–1145. 10.1136/gutjnl-2020-321051 [DOI] [PubMed] [Google Scholar]
  • 19.Christopher M Robinson, Julie K Pfeiffer. Viruses and the Microbiota. Annu Rev Virol. 2014;1:55–69. 10.1146/annurev-virology-031413-085550 [DOI] [PMC free article] [PubMed] [Google Scholar]
  • 20.Zuo Tao, Zhang Fen, Grace C Y Lui, Yun Kit Yeoh, Amy Y L Li, Hui Zhan, et al. Alterations in Gut Microbiota of Patients With COVID-19 During Time of Hospitalization. Gastroenterology. 2020. May 19;S0016-5085(20)34701-6. 10.1053/j.gastro.2020.05.048 [DOI] [PMC free article] [PubMed] [Google Scholar]
  • 21.Sharon K Kuss 1, Gavin T Best, Chris A Etheredge, Andrea J Pruijssers, Johnna M Frierson, Lora V Hooper, et al. Intestinal microbiota promote enteric virus replication and systemic pathogenesis. Science. 2011. October 14;334(6053):249–52. 10.1126/science.1211057 [DOI] [PMC free article] [PubMed] [Google Scholar]
  • 22.Zuo Tao, Liu Qin, Zhang Fen, Grace Chung-Yan Lui Eugene YK Tso, Yun Kit Yeoh, et al. Depicting SARS-CoV-2 faecal viral activity in association with gut microbiota composition in patients with COVID-19. Gut. 2020. July 20;gutjnl-2020-322294. 10.1136/gutjnl-2020-322294 [DOI] [PMC free article] [PubMed] [Google Scholar]
  • 23.Corona Shoenfeld Y. (COVID-19) time musings: Our involvement in COVID-19 pathogenesis, diagnosis, treatment and vaccine planning. Autoimmun Rev. 2020. June;19(6):102538 10.1016/j.autrev.2020.102538 [DOI] [PMC free article] [PubMed] [Google Scholar]
  • 24.Lange Kathleen, Buerger Martin, Stallmach Andreas, Bruns Tony. Effects of Antibiotics on Gut Microbiota. Dig Dis. 2016;34(3):260–8. 10.1159/000443360 [DOI] [PubMed] [Google Scholar]
  • 25.Numberger Daniela, LarsGanzert Luca Zoccarato, Kristin Mühldorfer Sascha Sauer, Hans-Peter Grossart, et al. Characterization of bacterial communities in wastewater with enhanced taxonomic resolution by full-length 16S rRNA sequencing. Sci Rep. 2019. Jul 4;9(1):9673 10.1038/s41598-019-46015-z [DOI] [PMC free article] [PubMed] [Google Scholar]
  • 26.Kurtis F Budden, Shaan L Gellatly, David L A Wood, Matthew A Cooper, Mark Morrison, Philip Hugenholtz, et al. Emerging pathogenic links between microbiota and the gut-lung axis. Nat Rev Microbiol. 2017. January;15(1):55–63. 10.1038/nrmicro.2016.142 [DOI] [PubMed] [Google Scholar]
  • 27.Joseph M Pickard, Melody Y Zeng, Roberta Caruso, Gabriel Núñez. Gut microbiota: Role in pathogen colonization, immune responses, and inflammatory disease. Immunol Rev. 2017. September;279(1):70–89. 10.1111/imr.12567 [DOI] [PMC free article] [PubMed] [Google Scholar]
  • 28.Wang Jian, Li Fengqi, Sun Rui, Gao Xiang, Wei Haiming, Li Lan-Juan, et al. Bacterial colonization dampens influenza-mediated acute lung injury via induction of M2 alveolar macrophages. Nat Commun. 2013;4:2106 10.1038/ncomms3106 [DOI] [PMC free article] [PubMed] [Google Scholar]
  • 29.Nadeem O Kaakoush. Insights Into the Role of Erysipelotrichaceae in the Human Host. Front Cell Infect Microbiol. 2015. November 20;5:84 10.3389/fcimb.2015.00084 [DOI] [PMC free article] [PubMed] [Google Scholar]
  • 30.Miquel S, R Martín, Rossi O, Bermúdez-Humarán L G, Chatel J M, Sokol H, et al. Faecalibacterium prausnitzii and human intestinal health. Curr Opin Microbiol. 2013. June;16(3):255–61. 10.1016/j.mib.2013.06.003 [DOI] [PubMed] [Google Scholar]
  • 31.Esquivel-Elizondo S, Ilhan Z E, Garcia-Peña E I, Krajmalnik-Brown R. Insights into Butyrate Production in a Controlled Fermentation System via Gene Predictions. mSystems. 2017. July 18;2(4):e00051–17. 10.1128/mSystems.00051-17 [DOI] [PMC free article] [PubMed] [Google Scholar]
  • 32.Ravi Anuradha, Fenella D Halstead Amy Bamford, Casey Anna, Thomson Nicholas M., Willem van Schaik, et al. Loss of microbial diversity and pathogen domination of the gut microbiota in critically ill patients. Microb Genom. 2019. September;5(9):e000293 10.1099/mgen.0.000293 [DOI] [PMC free article] [PubMed] [Google Scholar]
  • 33.Mottawea Walid, Butcher James, Li Jennifer, Abujamel Turki, Manoogian Juliana, Mack David, et al. The mucosal-luminal interface: an ideal sample to study the mucosa-associated microbiota and the intestinal microbial biogeography. Pediatr Res. 2019. May;85(6):895–903. 10.1038/s41390-019-0326-7 [DOI] [PubMed] [Google Scholar]
  • 34.Bassis CM, Moore NM, Lolans K, Seekatz AM, Weinstein RA, Young VB, et al. ; CDC Prevention Epicenters Program. Comparison of stool versus rectal swab samples and storage conditions on bacterial community profiles. BMC Microbiol. 2017. March 31;17(1):78 10.1186/s12866-017-0983-9 [DOI] [PMC free article] [PubMed] [Google Scholar]
  • 35.Reyman Marta, Marlies A. van Houten, Kayleigh Arp, Sanders Elisabeth A. M. & Debby Bogaert. Rectal swabs are a reliable proxy for faecal samples in infant gut microbiota research based on 16S-rRNA sequencing. Sci Rep. 2019. November 5;9(1):16072 10.1038/s41598-019-52549-z [DOI] [PMC free article] [PubMed] [Google Scholar]
  • 36.Amirian ES. Potential fecal transmission of SARS-CoV-2: Current evidence and implications for public health. Int J Infect Dis. 2020; 95:363–370. 10.1016/j.ijid.2020.04.057). [DOI] [PMC free article] [PubMed] [Google Scholar]

Decision Letter 0

Jane Foster

17 Nov 2020

PONE-D-20-29220

16S rRNA Gene Sequencing of Rectal Swab in Patients Affected by COVID-19

PLOS ONE

Dear Dr. Di Caro,

Thank you for submitting your manuscript to PLOS ONE. After careful consideration, we feel that it has merit but does not fully meet PLOS ONE’s publication criteria as it currently stands. Therefore, we invite you to submit a revised version of the manuscript that addresses the points raised during the review process.

The reviewers have raised several concerns that will need to be fully addressed in your revised manuscript. 

Please submit your revised manuscript by Jan 01 2021 11:59PM. If you will need more time than this to complete your revisions, please reply to this message or contact the journal office at plosone@plos.org. When you're ready to submit your revision, log on to https://www.editorialmanager.com/pone/ and select the 'Submissions Needing Revision' folder to locate your manuscript file.

Please include the following items when submitting your revised manuscript:

  • A rebuttal letter that responds to each point raised by the academic editor and reviewer(s). You should upload this letter as a separate file labeled 'Response to Reviewers'.

  • A marked-up copy of your manuscript that highlights changes made to the original version. You should upload this as a separate file labeled 'Revised Manuscript with Track Changes'.

  • An unmarked version of your revised paper without tracked changes. You should upload this as a separate file labeled 'Manuscript'.

If you would like to make changes to your financial disclosure, please include your updated statement in your cover letter. Guidelines for resubmitting your figure files are available below the reviewer comments at the end of this letter.

If applicable, we recommend that you deposit your laboratory protocols in protocols.io to enhance the reproducibility of your results. Protocols.io assigns your protocol its own identifier (DOI) so that it can be cited independently in the future. For instructions see: http://journals.plos.org/plosone/s/submission-guidelines#loc-laboratory-protocols

We look forward to receiving your revised manuscript.

Kind regards,

Jane Foster, PhD

Academic Editor

PLOS ONE

Journal Requirements:

When submitting your revision, we need you to address these additional requirements.

1) Please ensure that your manuscript meets PLOS ONE's style requirements, including those for file naming. The PLOS ONE style templates can be found at

https://journals.plos.org/plosone/s/file?id=wjVg/PLOSOne_formatting_sample_main_body.pdf and

https://journals.plos.org/plosone/s/file?id=ba62/PLOSOne_formatting_sample_title_authors_affiliations.pdf

2)  Thank you for stating the following financial disclosure:

 [NO-The funders had no role in study design, data collection and analysis, decision to publish, or preparation of the manuscript.].

At this time, please address the following queries:

  1. Please clarify the sources of funding (financial or material support) for your study. List the grants or organizations that supported your study, including funding received from your institution.

  2. State what role the funders took in the study. If the funders had no role in your study, please state: “The funders had no role in study design, data collection and analysis, decision to publish, or preparation of the manuscript.”

  3. If any authors received a salary from any of your funders, please state which authors and which funders.

  4. If you did not receive any funding for this study, please state: “The authors received no specific funding for this work.”

Please include your amended statements within your cover letter; we will change the online submission form on your behalf.

3) Thank you for stating the following in your Competing Interests section: 

[NO-authors have competing interests].

Please complete your Competing Interests on the online submission form to state any Competing Interests. If you have no competing interests, please state "The authors have declared that no competing interests exist.", as detailed online in our guide for authors at http://journals.plos.org/plosone/s/submit-now

 This information should be included in your cover letter; we will change the online submission form on your behalf.

Please know it is PLOS ONE policy for corresponding authors to declare, on behalf of all authors, all potential competing interests for the purposes of transparency. PLOS defines a competing interest as anything that interferes with, or could reasonably be perceived as interfering with, the full and objective presentation, peer review, editorial decision-making, or publication of research or non-research articles submitted to one of the journals. Competing interests can be financial or non-financial, professional, or personal. Competing interests can arise in relationship to an organization or another person. Please follow this link to our website for more details on competing interests: http://journals.plos.org/plosone/s/competing-interests

4) In your Data Availability statement, you have not specified where the minimal data set underlying the results described in your manuscript can be found. PLOS defines a study's minimal data set as the underlying data used to reach the conclusions drawn in the manuscript and any additional data required to replicate the reported study findings in their entirety. All PLOS journals require that the minimal data set be made fully available. For more information about our data policy, please see http://journals.plos.org/plosone/s/data-availability.

Upon re-submitting your revised manuscript, please upload your study’s minimal underlying data set as either Supporting Information files or to a stable, public repository and include the relevant URLs, DOIs, or accession numbers within your revised cover letter. For a list of acceptable repositories, please see http://journals.plos.org/plosone/s/data-availability#loc-recommended-repositories. Any potentially identifying patient information must be fully anonymized.

Important: If there are ethical or legal restrictions to sharing your data publicly, please explain these restrictions in detail. Please see our guidelines for more information on what we consider unacceptable restrictions to publicly sharing data: http://journals.plos.org/plosone/s/data-availability#loc-unacceptable-data-access-restrictions. Note that it is not acceptable for the authors to be the sole named individuals responsible for ensuring data access.

We will update your Data Availability statement to reflect the information you provide in your cover letter.

5) Please upload a new copy of Figures 4 and 5 as the detail is not clear. Please follow the link for more information: https://blogs.plos.org/plos/2019/06/looking-good-tips-for-creating-your-plos-figures-graphics/

[Note: HTML markup is below. Please do not edit.]

Reviewers' comments:

Reviewer's Responses to Questions

Comments to the Author

1. Is the manuscript technically sound, and do the data support the conclusions?

The manuscript must describe a technically sound piece of scientific research with data that supports the conclusions. Experiments must have been conducted rigorously, with appropriate controls, replication, and sample sizes. The conclusions must be drawn appropriately based on the data presented.

Reviewer #1: Yes

Reviewer #2: No

**********

2. Has the statistical analysis been performed appropriately and rigorously?

Reviewer #1: I Don't Know

Reviewer #2: I Don't Know

**********

3. Have the authors made all data underlying the findings in their manuscript fully available?

The PLOS Data policy requires authors to make all data underlying the findings described in their manuscript fully available without restriction, with rare exception (please refer to the Data Availability Statement in the manuscript PDF file). The data should be provided as part of the manuscript or its supporting information, or deposited to a public repository. For example, in addition to summary statistics, the data points behind means, medians and variance measures should be available. If there are restrictions on publicly sharing data—e.g. participant privacy or use of data from a third party—those must be specified.

Reviewer #1: Yes

Reviewer #2: Yes

**********

4. Is the manuscript presented in an intelligible fashion and written in standard English?

PLOS ONE does not copyedit accepted manuscripts, so the language in submitted articles must be clear, correct, and unambiguous. Any typographical or grammatical errors should be corrected at revision, so please note any specific errors here.

Reviewer #1: Yes

Reviewer #2: Yes

**********

5. Review Comments to the Author

Please use the space provided to explain your answers to the questions above. You may also include additional comments for the author, including concerns about dual publication, research ethics, or publication ethics. (Please upload your review as an attachment if it exceeds 20,000 characters)

Reviewer #1: The authors have performed a pilot study examining the gut microbiomes of patients admitted to the ICU or infectious disease ward at their institution with or without COVID19-associated pneumonia. The data support a loss of bacterial diversity in COVID-positive patients and gain of potentially pathological species.

Revisions I think should be made before publication include:

1) The methods are too vague.

a. For example, was the PCOA performed in GAIA? What about the Venn Diagrams, etc.? It's not stated, nor for most of the other figures.

b. How were the different bacterial profiles generated by the different hypervariable regions combined? How did they differ?

c. How many reads were generated per patient? Was this sufficient to capture the long tail of the gut microbiomes?

d. What was the similarity level used to bin reads and identify OTUs? If this was all done using default settings in GAIA, it should stated.

e. One hypervariable region is listed as V-2-4-8 which does not make sense, I think they should be listed as V2, V4, V8 to differentiate these single hypervariable region amplicons from the V3-6 amplicons which actually span hypervariable regions V3 through V6.

f. which NCBI database was used?

2) The results lack quantitation. For example in lines 158-176 no fold changes in relative abundance are reported for the organisms listed. Nor is there discussion of the prevalence of these bacteria that may constitute potential biomarkers of COVID infection. For example, In supplemental table 1, Spirochaetes and Fusobacteria were found to be significantly down in ward patients relative to control, but neither Phylum is prevalent enough to even be visible in Figure S1. Are these results just noise from very rare organisms that may or may not be found at the sampling depth of the study? While the statistics are this is not the case, and the authors have adjusted for multiple testing (FDR p-values) some discussion of the low prevalence of the significantly altered organisms would make the findings more convincing.

Another way to look at my concern here is to consider why it is the ward and ICU patients have differences in their affected bacterial families in lines 158-168 (while also having similarities) when both cohorts have COVID infection, If the families listed were important to COVID infection then they should be found in both ward and ICU patients. Either there is an affect of ward versus ICU which should be discussed or these families are noise in the data despite passing statistical muster.

3) There appears to be significant variation between patients within the three main categories (ward, ICU, control). For example, in supplementary figure 1 there is one control and one ward patient with surprisingly high Proteobacteria and low Firmicutes/Bacteriodetes. In addition, one ward patient apparently has no Bacteriodetes at all - a shocking result given this is typically the major Phylum on gut microbiomes. There should be some discussion of the variation and it's potential to affect the development of potential biomarkers.

4) Some discussion of why there was a significant difference in Ferritin in the ICU patients would be helpful for a non-clinical audience.

Minor changes:

1) Figure S1 the type is difficult to read because of low resolution, try to use vector type rather than rasterized type.

2) Figure S2 the legend is cut of on the right side making it impossible, for example, to identify the Fusobacteria. The type is also nearly unreadable due to rasterization.

3)Figure 5 bacterial names are unreadable due to low resolution.

4) line 36 replace remarkably with remarkable

5) line 46 replace different with several

6) line 67 replace examined with performed

7) line 138 replace resulted with was

8) line 150, 155 insert the between At and Phylum

9) line 150,153 replace resulted with were

10) line 158 insert the between At and Family

11) line 218, 225 replace decreased with decrease

12) line 229 the phrase "it popped out" is awkward and not formal English for a publication

13) line 232 the first sentence would read better if simply changed to "There are several limitations to this study."

14) insert a between administered and few

15) line 247 replace study with studies

Reviewer #2: PONE-D-20-29220 16S rRNA Gene Sequencing of Rectal Swab in Patients Affected by COVID-19

In the current study, the Researchers investigated whether COVID infection promoted alterations in the gut microbiome diversity and profiles, as well as whether these shifts conferred severity of the disease state. While the study is limited in subject enrollment (which can be overlooked since it is a pilot study), there are some potentially novel outcomes of the data sets provided. However, due to the vast limitations of the study, further details on methodologies and additional analyses are required. Furthermore, the authors should temper their conclusions drawn from the current data set, as the study design does not allow for determination that COVID infection mediated or promoted the observed outcomes.

Major concerns/comments:

1. The major concern of this Reviewer is that there is no "pre-COVID" data on the gut microbiome profiles of these patients, so it is impossible to definitively conclude that these microbiota profiles are due to the COVID infection. These profiles could be due to variation in diets, environment, medications, and/or existing comorbidities. At the very least this limitation needs to be addressed and the conclusions that these data provide evidence for COVID mediating these outcomes needs to be tempered.

2. The individual microbiota graphs need to be provided in the main text vs. as supplementary files. Furthermore, it appears that for most statistical endpoints reported in the group averages, only 1 or 2 individuals in each group drove those changes represented in the averages. For example Proteobacteria at the Phylum level are so varied, even amongst the controls, that it appears that the averages presented in Figures 3 and 4 are not necessarily representative of the whole group.

3. In addition, information for each of the subjects should be correlated to their individual microbiome - this can be provided in a table in the supplemental files (e.g. Subject Control 1, age, sex, antibiotics, comorbidities). This is important, because it may allow for further distinction of effects of antibiotics and co-morbidities on the highly varied individual microbiome reads.

4. Further clarification on the analysis of the 16S sequencing needs to be provided. What were total reads, and were they comparable across all samples? Was the data rarefied for alpha and beta diversity analysis?

5. A more in-depth description of how samples were collected needs to be provided. One of the main concerns with microbiome analysis is minimizing contamination from other sources in your samples, which in this case would have been difficult. As such, can the authors rule out that the microbiota analyses do not include those microbiota on the surface of the skin vs. the actual GI tract? This is one of the main downfalls of using a rectal swab vs. fecal samples.

6. Were the patients that tested negative for COVID-19 (the controls) only tested 1 time?

7. Is the PCoA graph presented in Fig 2 weighted or unweighted?

8. Analysis of Molecular Variance (AMOVA) and Analysis of similarities (ANOSIM) to assess the variations and similarities among different groups would be beneficial, especially considering the PCoA graph does not show distinct clustering for most groups.

9. Additional alpha diversity analyses should be completed since only one of the chosen tests revealed statistical significance. The authors may want to consider abundance coverage-based estimator (ACE) richness and evenness analyses.

**********

6. PLOS authors have the option to publish the peer review history of their article (what does this mean?). If published, this will include your full peer review and any attached files.

If you choose “no”, your identity will remain anonymous but your review may still be made public.

Do you want your identity to be public for this peer review? For information about this choice, including consent withdrawal, please see our Privacy Policy.

Reviewer #1: No

Reviewer #2: No

[NOTE: If reviewer comments were submitted as an attachment file, they will be attached to this email and accessible via the submission site. Please log into your account, locate the manuscript record, and check for the action link "View Attachments". If this link does not appear, there are no attachment files.]

While revising your submission, please upload your figure files to the Preflight Analysis and Conversion Engine (PACE) digital diagnostic tool, https://pacev2.apexcovantage.com/. PACE helps ensure that figures meet PLOS requirements. To use PACE, you must first register as a user. Registration is free. Then, login and navigate to the UPLOAD tab, where you will find detailed instructions on how to use the tool. If you encounter any issues or have any questions when using PACE, please email PLOS at figures@plos.org. Please note that Supporting Information files do not need this step.

PLoS One. 2021 Feb 17;16(2):e0247041. doi: 10.1371/journal.pone.0247041.r002

Author response to Decision Letter 0


3 Dec 2020

Review Comments to the Author

Reviewer #1: The authors have performed a pilot study examining the gut microbiomes of patients admitted to the ICU or infectious disease ward at their institution with or without COVID19-associated pneumonia. The data support a loss of bacterial diversity in COVID-positive patients and gain of potentially pathological species.

Revisions I think should be made before publication include:

1) The methods are too vague.

a. For example, was the PCOA performed in GAIA? What about the Venn Diagrams, etc.? It's not stated, nor for most of the other figures.

RE: We thank the reviewer for this comment and we apologize for the missing information. We have now provided more details about the methods in the respective paragraph.

b. How were the different bacterial profiles generated by the different hypervariable regions combined? How did they differ?

RE: We apologize for the lack of clarity. The sequencing run has generated in total 16x10^6 reads with the 77% of high quality reads (21% low quality, 2% test fragments). Finally we obtained 5.5x10^5 reads per sample (reads length were 244 bp mean, 260 bp median and 289 bp mode) and all analyzed specimens showed a suitable library’s profile. The analysis was performed by 16S Metagenomics GAIA 2.0 software and DESeq2 package software. Sequence data generated as FASTQ files, were analysed using the 16S Metagenomics GAIA 2.0 software which performs the quality control of the reads/pairs (i.e., trimming, clipping and adapter removal steps) through FastQC and BBDuk. The reads/pairs are mapped with BWA-MEM against the 16S databases (based on NCBI). Differential expression analysis using DESeq2 package to test for differential analysis by use of negative binomial generalized linear models was used. Only changes with FDR below 0.05 were considered significant.

c. How many reads were generated per patient? Was this sufficient to capture the long tail of the gut microbiomes?

RE: We thank the reviewer for this comment. We have obtained an average of 5.5 x 10^5 reads each sample. Reads were sufficient to evaluate optimal rarefaction curves as shown in the following graphics. Graphics were plotted based on Chao index, observed species, shannon and simpson index respectively. The rarefaction curves suggest that the samples have plateaued; this means that a good representation of the microbial community was obtained for the samples analysed in this study.

d. What was the similarity level used to bin reads and identify OTUs? If this was all done using default settings in GAIA, it should stated.

RE: All analyses are executed with default settings described in https://www.biorxiv.org/content/10.1101/804690v1. The analysis is amplicon-seq, so the identity threshold for species is 97%, for genus is 93%.

e. One hypervariable region is listed as V-2-4-8 which does not make sense, I think they should be listed as V2, V4, V8 to differentiate these single hypervariable region amplicons from the V3-6 amplicons which actually span hypervariable regions V3 through V6.

RE: We agree with the reviewer. We have now added these changes within the text.

f. which NCBI database was used?

RE: RE: 16S sequences available from GenBank with meaningful taxonomic information in at least the genus level (those classified as uncultured, unidentified, etc. were excluded). In addition, 16S sequences were rescued from entire genomes that also available from GenBank using the corresponding annotation.

2) The results lack quantitation. For example in lines 158-176 no fold changes in relative abundance are reported for the organisms listed. Nor is there discussion of the prevalence of these bacteria that may constitute potential biomarkers of COVID infection. For example, In supplemental table 1, Spirochaetes and Fusobacteria were found to be significantly down in ward patients relative to control, but neither Phylum is prevalent enough to even be visible in Figure S1. Are these results just noise from very rare organisms that may or may not be found at the sampling depth of the study? While the statistics are this is not the case, and the authors have adjusted for multiple testing (FDR p-values) some discussion of the low prevalence of the significantly altered organisms would make the findings more convincing.

RE: We thank the reviewer for this comment. Since numerous changes were observed, we preferred to report p values, FDR score and fold changes in the supplementary tables instead of reporting these values within the manuscript which would have been difficult to read with all the number inserted. We have now added more sentences in order to better describe the changes observed tanking in consideration also the comment below.

Another way to look at my concern here is to consider why it is the ward and ICU patients have differences in their affected bacterial families in lines 158-168 (while also having similarities) when both cohorts have COVID infection, If the families listed were important to COVID infection then they should be found in both ward and ICU patients. Either there is an affect of ward versus ICU which should be discussed or these families are noise in the data despite passing statistical muster.

RE: We thank the reviewer for this insightful comment. As stated in our manuscript, this is a pilot study that represent preliminary data and we are aware that the patient’s number is limited. We cannot exclude that increasing the patients number to be enrolled it is possible to discover more families having similarities in both groups. Nevertheless, several families in common were linked to the virus presence independently of the ward in which the patients are hospitalized. Furthermore, the severity disease and the intestinal inflammation state were different so the variability expressed at the family level is higher in ICU patients in comparison to those observed in patients hospitalized in the ward as also reported by Ravi et al (PMID: 31526447). Our intent was to describe the common and the exclusive microorganisms belonging to the different groups. We agree that families listed due to only COVID infection (either ward or ICU) are worth of note and for this reason we reported that when considering the i-COVID19 as compared to CTRL, in addition to some bacteria in common with w-COVID19 patients (i.e. Staphylococcaceae, Aerococcaceae, Dermabacteraceae, Actinobacteria and so on Fig.4, and Fig. 6A and Supporting material S5 table) Erysipelotrichaceae, Microbacteriaceae, Mycobacteriaceae, Pseudonocardiaceae, Brevibacteriaceae, and others reported in Supporting material S5 table were significantly increased while Carnobacteriaceae, Coriobacteriaceae and Mycoplasmataceae were significantly reduced.

But we also underlined the exclusive microorganisms belonging to the two distinct groups: Staphylococcaceae, Microbacteriaceae, Micrococcaceae, Pseudonocardiaceae, Erysipelotrichales and others reported in Supporting material S6 table were significantly higher in i-COVID-19 as compared to w-COVID19. Carnobacteriaceae, Pectobacteriaceae, Moritellaceae, Selenomonadaceae, Micromonosporaceae, Coriobacteriaceae and few others were significantly decreased in i-COVID19 as compared to w-COVID19.

We then discussed all these changes considering the already known microorganisms reported within the literature.

3) There appears to be significant variation between patients within the three main categories (ward, ICU, control). For example, in supplementary figure 1 there is one control and one ward patient with surprisingly high Proteobacteria and low Firmicutes/Bacteriodetes. In addition, one ward patient apparently has no Bacteriodetes at all - a shocking result given this is typically the major Phylum on gut microbiomes. There should be some discussion of the variation and it's potential to affect the development of potential biomarkers.

RE: We thank the reviewer for this comment. We noticed also these changes and we discussed what we thought were the most important. However, in agreement with the reviewer comment we have now added some discussion on the above mentioned changes.

4) Some discussion of why there was a significant difference in Ferritin in the ICU patients would be helpful for a non-clinical audience.

RE: We thank the reviewer for this comment. We better clarified the concept with the following sentences reported in the manuscript: ‘Moreover, ANOVA and Kruskal-Wallis analysis reveal that the variables between our patient cohorts was not noteworthy except for ferritin level that is significantly lower in ICU patients.

Ferritin is a marker of inflammation and the high levels of ferritin detected in i-COVID19 patients in comparison to w-COVID19, may be associate with a greater severity of the disease and adverse outcomes. Normally, ferritin is able to activate macrophages that when stimulated begin to secrete cytokines that at low concentrations, help to protect the body from viruses and bacteria. On the other hand, high levels of ferritin activate more macrophages that produce the so-called "cytokine storm" which can be lethal for the body’ (PMID: 32268212).

Minor changes:

1) Figure S1 the type is difficult to read because of low resolution, try to use vector type rather than rasterized type.

RE: We regret that the figures are not visible, we have carefully checked all of the figures and the resolution is 300 DPI or more, as requested, we hope to the reviewer’s satisfaction. We trust that we have now resolved the issues pertaining to poor resolution, which can be also resolved by accessing the access/download high-resolution link for each image provided within the text

2) Figure S2 the legend is cut of on the right side making it impossible, for example, to identify the Fusobacteria. The type is also nearly unreadable due to rasterization.

RE: We trust that we have now resolved the issues

3) Figure 5 bacterial names are unreadable due to low resolution.

RE: We regret that the figures are not visible, we have carefully checked all of the figures and the resolution is 300 DPI or more, as requested, we hope to the reviewer’s satisfaction. We trust that we have now resolved the issues pertaining to poor resolution which can be also resolved by accessing the access/download high-resolution link for each image provided within the text

4) line 36 replace remarkably with remarkable; 5) line 46 replace different with several; 6) line 67 replace examined with performed; 7) line 138 replace resulted with was; 8) line 150, 155 insert the between At and Phylum; 9) line 150,153 replace resulted with were; 10) line 158 insert the between At and Family; 11) line 218, 225 replace decreased with decrease;12) line 229 the phrase "it popped out" is awkward and not formal English for a publication; 13) line 232 the first sentence would read better if simply changed to "There are several limitations to this study."; 14) insert a between administered and few; 15) line 247 replace study with studies.

RE: We thank the reviewer for these suggestions. We have now edited the text according to the reviewer’ comments.

Attachment

Submitted filename: Response to Reviewers.docx

Decision Letter 1

Jane Foster

5 Jan 2021

PONE-D-20-29220R1

16S rRNA Gene Sequencing of Rectal Swab in Patients Affected by COVID-19

PLOS ONE

Dear Dr. Di Caro,

Thank you for submitting your manuscript to PLOS ONE. After careful consideration, we feel that it has merit but does not fully meet PLOS ONE’s publication criteria as it currently stands. Therefore, we invite you to submit a revised version of the manuscript that addresses the points raised during the review process.

Please submit your revised manuscript by Feb 19 2021 11:59PM. If you will need more time than this to complete your revisions, please reply to this message or contact the journal office at plosone@plos.org. When you're ready to submit your revision, log on to https://www.editorialmanager.com/pone/ and select the 'Submissions Needing Revision' folder to locate your manuscript file.

Please include the following items when submitting your revised manuscript:

  • A rebuttal letter that responds to each point raised by the academic editor and reviewer(s). You should upload this letter as a separate file labeled 'Response to Reviewers'.

  • A marked-up copy of your manuscript that highlights changes made to the original version. You should upload this as a separate file labeled 'Revised Manuscript with Track Changes'.

  • An unmarked version of your revised paper without tracked changes. You should upload this as a separate file labeled 'Manuscript'.

If you would like to make changes to your financial disclosure, please include your updated statement in your cover letter. Guidelines for resubmitting your figure files are available below the reviewer comments at the end of this letter.

If applicable, we recommend that you deposit your laboratory protocols in protocols.io to enhance the reproducibility of your results. Protocols.io assigns your protocol its own identifier (DOI) so that it can be cited independently in the future. For instructions see: http://journals.plos.org/plosone/s/submission-guidelines#loc-laboratory-protocols

We look forward to receiving your revised manuscript.

Kind regards,

Jane Foster, PhD

Academic Editor

PLOS ONE

[Note: HTML markup is below. Please do not edit.]

Reviewers' comments:

Reviewer's Responses to Questions

Comments to the Author

1. If the authors have adequately addressed your comments raised in a previous round of review and you feel that this manuscript is now acceptable for publication, you may indicate that here to bypass the “Comments to the Author” section, enter your conflict of interest statement in the “Confidential to Editor” section, and submit your "Accept" recommendation.

Reviewer #1: (No Response)

Reviewer #2: (No Response)

**********

2. Is the manuscript technically sound, and do the data support the conclusions?

The manuscript must describe a technically sound piece of scientific research with data that supports the conclusions. Experiments must have been conducted rigorously, with appropriate controls, replication, and sample sizes. The conclusions must be drawn appropriately based on the data presented.

Reviewer #1: Yes

Reviewer #2: Partly

**********

3. Has the statistical analysis been performed appropriately and rigorously?

Reviewer #1: Yes

Reviewer #2: I Don't Know

**********

4. Have the authors made all data underlying the findings in their manuscript fully available?

The PLOS Data policy requires authors to make all data underlying the findings described in their manuscript fully available without restriction, with rare exception (please refer to the Data Availability Statement in the manuscript PDF file). The data should be provided as part of the manuscript or its supporting information, or deposited to a public repository. For example, in addition to summary statistics, the data points behind means, medians and variance measures should be available. If there are restrictions on publicly sharing data—e.g. participant privacy or use of data from a third party—those must be specified.

Reviewer #1: Yes

Reviewer #2: Yes

**********

5. Is the manuscript presented in an intelligible fashion and written in standard English?

PLOS ONE does not copyedit accepted manuscripts, so the language in submitted articles must be clear, correct, and unambiguous. Any typographical or grammatical errors should be corrected at revision, so please note any specific errors here.

Reviewer #1: Yes

Reviewer #2: Yes

**********

6. Review Comments to the Author

Please use the space provided to explain your answers to the questions above. You may also include additional comments for the author, including concerns about dual publication, research ethics, or publication ethics. (Please upload your review as an attachment if it exceeds 20,000 characters)

Reviewer #1: The authors have thoughtfully addressed most of the concerns of both reviewers, however, they have done so in the response to reviewers, and not in the manuscript. For example, both reviewers noted that the number of reads per sample was not reported which goes a long way to assuaging a knowledgeable reader's concerns about sequencing depth, especially when paired with the alpha diversity analysis also shown only in response to reviewers. The authors responded with the details that should be in the methods, but did not add them to the manuscript. Specifically to the point above, something like the following text:

"The sequencing run has generated in total 16x10^6 reads with the

77% of high quality reads(21% low quality, 2% test fragments). Finally we obtained 5.5x10^5 reads per sample

(reads length were 244 bp mean, 260 bp median and 289 bp mode) and all analyzed specimens showed a

suitable library’s profile. The analysis was performed by 16S Metagenomics GAIA 2.0 software and DESeq2

package software. Sequence data generated as FASTQ files, were analysed using the 16S Metagenomics GAIA

2.0 software which performs the quality control of the reads/pairs (i.e., trimming, clipping and adapter

removal steps) through FastQC and BBDuk. The reads/pairs are mapped with BWA-MEM against the 16S

databases (based on NCBI). Differential expression analysis using DESeq2 package to test for differential

analysis by use of negative binomial generalized linear models was used. Only changes with FDR below 0.05

were considered significant"

should be added to the methods, not just in the response to reviewers. Think of the reviewers as interested readers, if we both wanted this information, so will the readers. Similarly, the percent similarity used to determine species and genus calls, details on the reference sequence database used, etc. should be in the methods. In addition, it would be an improvement to include the CHAO1 alpha diversity plot in the response to reviewers in the supplemental figures. There is no word limit or figure limit in PLOS ONE, so there is no reason to leave out these details which provide the reader with key information to understand and trust the results.

In addition, it is still unclear how the analysis was performed on the reads, while the methods paragraph quoted above would suffice, later in the response to reviewers (reviewer 2, point 9) Ion Reporter is mentioned and strongly implies the reads were processed in some way on that platform. However, no mention of Ion Reporter is made in the manuscript. In addition, use of Ion Reporter would explain how the identity calls made from the multiple hypervariable regions were combined, but the authors still have not addressed this question in the response to reviewers or the manuscript (reviewer 1, point 1b).

Lastly, In response to reviewer 1, point 3 the authors state that discussion of the strikingly absence of Bacteriodetes in one patient has been added to the text, however, this reviewer cannot find it in the revised manuscript and a search of the revised manuscript for the word "Bacteriodetes" returned no results. If the text has indeed been added, the authors should refer to specific line numbers.

Reviewer #2: While the authors have addressed many of the initial concerns in the revised manuscript, there are still some issues that need to be further addressed (some of which were in the initial major concerns/comments previously):

1. The Supplemental Figures S1 and S2 need to be moved to the main body of the manuscript, instead of being placed in the Supplemental files. These are extremely important figures for transparency of the major limitations of this study (small sample size, antibiotic use, no pre- vs. post data, etc.). The reader should not have to seek this information in the Supplemental Files, since they pertain to the main findings of the study, especially since individual variation seemed to drive the significant response in some of the reported outcomes within study groups.

2. The authors should address in the Discussion (at a minimum) whether age, gender, co-morbidities, and/or antibiotic treatment (n=11 on study) altered individual 16S microbiota profiles reported.

**********

7. PLOS authors have the option to publish the peer review history of their article (what does this mean?). If published, this will include your full peer review and any attached files.

If you choose “no”, your identity will remain anonymous but your review may still be made public.

Do you want your identity to be public for this peer review? For information about this choice, including consent withdrawal, please see our Privacy Policy.

Reviewer #1: Yes: George S. Watts

Reviewer #2: No

[NOTE: If reviewer comments were submitted as an attachment file, they will be attached to this email and accessible via the submission site. Please log into your account, locate the manuscript record, and check for the action link "View Attachments". If this link does not appear, there are no attachment files.]

While revising your submission, please upload your figure files to the Preflight Analysis and Conversion Engine (PACE) digital diagnostic tool, https://pacev2.apexcovantage.com/. PACE helps ensure that figures meet PLOS requirements. To use PACE, you must first register as a user. Registration is free. Then, login and navigate to the UPLOAD tab, where you will find detailed instructions on how to use the tool. If you encounter any issues or have any questions when using PACE, please email PLOS at figures@plos.org. Please note that Supporting Information files do not need this step.

PLoS One. 2021 Feb 17;16(2):e0247041. doi: 10.1371/journal.pone.0247041.r004

Author response to Decision Letter 1


8 Jan 2021

Reviewer #1: The authors have thoughtfully addressed most of the concerns of both reviewers, however, they have done so in the response to reviewers, and not in the manuscript. For example, both reviewers noted that the number of reads per sample was not reported which goes a long way to assuaging a knowledgeable reader's concerns about sequencing depth, especially when paired with the alpha diversity analysis also shown only in response to reviewers. The authors responded with the details that should be in the methods, but did not add them to the manuscript. Specifically to the point above, something like the following text:

"The sequencing run has generated in total 16x10^6 reads with the 77% of high quality reads (21% low quality, 2% test fragments). Finally we obtained 5.5x10^5 reads per sample (reads length were 244 bp mean, 260 bp median and 289 bp mode) and all analyzed specimens showed a suitable library’s profile. The analysis was performed by 16S Metagenomics GAIA 2.0 software and DESeq2 package software. Sequence data generated as FASTQ files, were analysed using the 16S Metagenomics GAIA 2.0 software which performs the quality control of the reads/pairs (i.e., trimming, clipping and adapter removal steps) through FastQC and BBDuk. The reads/pairs are mapped with BWA-MEM against the 16S databases (based on NCBI). Differential expression analysis using DESeq2 package to test for differential analysis by use of negative binomial generalized linear models was used. Only changes with FDR below 0.05 were considered significant" should be added to the methods, not just in the response to reviewers. Think of the reviewers as interested readers, if we both wanted this information, so will the readers. Similarly, the percent similarity used to determine species and genus calls, details on the reference sequence database used, etc. should be in the methods. In addition, it would be an improvement to include the CHAO1 alpha diversity plot in the response to reviewers in the supplemental figures. There is no word limit or figure limit in PLOS ONE, so there is no reason to leave out these details which provide the reader with key information to understand and trust the results.

Re: We apologize for missing to add this information within the text. We have now reported all the information contained in our previous response within the manuscript. The percent similarity used to determine species and genus calls was 93% at genus, 97% at species as reported in the new version of the text. Chao1 index is reported in figure 1.

In addition, it is still unclear how the analysis was performed on the reads, while the methods paragraph quoted above would suffice, later in the response to reviewers (reviewer 2, point 9) Ion Reporter is mentioned and strongly implies the reads were processed in some way on that platform. However, no mention of Ion Reporter is made in the manuscript. In addition, use of Ion Reporter would explain how the identity calls made from the multiple hypervariable regions were combined, but the authors still have not addressed this question in the response to reviewers or the manuscript (reviewer 1, point 1b).

RE: We apologize for the lack of clarity. Ion Reporter is one of the software that could be used for 16S analysis. However, Ion Reporter software was not mentioned in the manuscript because it is an analysis that has not been done for our sequences. For our whole study, we utilized the 16S Metagenomics GAIA 2.0 software and DESeq2 package software. Specifically, sequence data generated as FASTQ files, were analyzed using the 16S Metagenomics GAIA 2.0 software which performs the quality control of the reads/pairs (i.e., trimming, clipping and adapter removal steps) through FastQC and BBDuk. The reads/pairs are mapped with BWA-MEM against the 16S databases (based on NCBI). Differential expression analysis using DESeq2 package to test for differential analysis by use of negative binomial generalized linear models was used.

Ion Reporter was only mentioned in response to Reviewer 2 who asked us if it was possible to calculate the abundance coverage-based estimator (ACE) richness and evenness analyses.

Lastly, In response to reviewer 1, point 3 the authors state that discussion of the strikingly absence of Bacteriodetes in one patient has been added to the text, however, this reviewer cannot find it in the revised manuscript and a search of the revised manuscript for the word "Bacteriodetes" returned no results. If the text has indeed been added, the authors should refer to specific line numbers.

RE: We thank the reviewer for this comment. We already reported (line 231-235) that growing evidence has shown that perturbation of the gut microbial community may fuel blooms of otherwise low abundance and harmful bacteria which can further exacerbate the intestinal inflammation. Indeed, dysbiosis in the distal gut is often characterized by a decrease in the prevalence of strict anaerobes and an increased relative abundance of facultative anaerobic bacteria.

For these reasons now we add thisese sentences in the revised manuscript (line 228-231):’Notably, a clear case of profound dysbiosis (Fig. 5) was observed in one ward patient (90-year-old patient with diabetes, meningioma and osteoporosis in association with an increase of C-Reactive Protein (CRP) and lymphocytes), with a significant increase in Proteobacteria and a relevant reduction in Bacteriodetes, reflecting an important inflammatory state’.

Reviewer #2: While the authors have addressed many of the initial concerns in the revised manuscript, there are still some issues that need to be further addressed (some of which were in the initial major concerns/comments previously):

1. The Supplemental Figures S1 and S2 need to be moved to the main body of the manuscript, instead of being placed in the Supplemental files. These are extremely important figures for transparency of the major limitations of this study (small sample size, antibiotic use, no pre- vs. post data, etc.). The reader should not have to seek this information in the Supplemental Files, since they pertain to the main findings of the study, especially since individual variation seemed to drive the significant response in some of the reported outcomes within study groups.

RE: We thank the reviewer for this comment and we have now moved Figure S1 and S2 (now renamed Figure 5 and Figure 6) within the manuscript as suggested.

2. The authors should address in the Discussion (at a minimum) whether age, gender, co-morbidities, and/or antibiotic treatment (n=11 on study) altered individual 16S microbiota profiles reported.

RE: As suggested we have now added few sentences in the discussion section about the link between clinical data and the microbiota profiles. As for antibiotic treatment, we reported more details in lines 257-263. We recognize the potential effect of clinical/demographic data on the changes of mirobiota profile however we wish to underline that these data were not significantly different among the three groups.

Attachment

Submitted filename: Response to Reviewers.docx

Decision Letter 2

Jane Foster

1 Feb 2021

16S rRNA Gene Sequencing of Rectal Swab in Patients Affected by COVID-19

PONE-D-20-29220R2

Dear Dr. Di Caro,

We’re pleased to inform you that your manuscript has been judged scientifically suitable for publication and will be formally accepted for publication once it meets all outstanding technical requirements.

Within one week, you’ll receive an e-mail detailing the required amendments. When these have been addressed, you’ll receive a formal acceptance letter and your manuscript will be scheduled for publication.

An invoice for payment will follow shortly after the formal acceptance. To ensure an efficient process, please log into Editorial Manager at http://www.editorialmanager.com/pone/, click the 'Update My Information' link at the top of the page, and double check that your user information is up-to-date. If you have any billing related questions, please contact our Author Billing department directly at authorbilling@plos.org.

If your institution or institutions have a press office, please notify them about your upcoming paper to help maximize its impact. If they’ll be preparing press materials, please inform our press team as soon as possible -- no later than 48 hours after receiving the formal acceptance. Your manuscript will remain under strict press embargo until 2 pm Eastern Time on the date of publication. For more information, please contact onepress@plos.org.

Kind regards,

Jane Foster, PhD

Academic Editor

PLOS ONE

Reviewers' comments:

Acceptance letter

Jane Foster

5 Feb 2021

PONE-D-20-29220R2

16S rRNA Gene Sequencing of Rectal Swab in Patients Affected by COVID-19

Dear Dr. Di Caro:

I'm pleased to inform you that your manuscript has been deemed suitable for publication in PLOS ONE. Congratulations! Your manuscript is now with our production department.

If your institution or institutions have a press office, please let them know about your upcoming paper now to help maximize its impact. If they'll be preparing press materials, please inform our press team within the next 48 hours. Your manuscript will remain under strict press embargo until 2 pm Eastern Time on the date of publication. For more information please contact onepress@plos.org.

If we can help with anything else, please email us at plosone@plos.org.

Thank you for submitting your work to PLOS ONE and supporting open access.

Kind regards,

PLOS ONE Editorial Office Staff

on behalf of

Dr. Jane Foster

Academic Editor

PLOS ONE

Associated Data

    This section collects any data citations, data availability statements, or supplementary materials included in this article.

    Supplementary Materials

    S1 Table. Deseq2_phylum level_w-COVID19 vs CTRL used as reference.

    (XLSX)

    S2 Table. Deseq2_phylum level_i-COVID19 vs CTRL used as reference.

    (XLSX)

    S3 Table. Deseq2_phylum level_i-COVID19 vs w-COVID19 used as reference.

    (XLSX)

    S4 Table. Deseq2_family level_w-COVID19 vs CTRL used as reference.

    (XLSX)

    S5 Table. Deseq2_family level_i-COVID19 vs CTRL used as reference.

    (XLSX)

    S6 Table. Deseq2_family level_i-COVID19 vs w-COVID19 used as reference.

    (XLSX)

    S7 Table. Deseq2_genus level_w-COVID19 vs CTRL used as reference.

    (XLSX)

    S8 Table. Deseq2_genus level_i-COVID19 vs CTRL used as reference.

    (XLSX)

    S9 Table. Deseq2_genus level_i-COVID19 vs w-COVID19 used as reference.

    (XLSX)

    S10 Table. Deseq2_species level_w-COVID19 vs CTRL used as reference.

    (XLSX)

    S11 Table. Deseq2_species level_i-COVID19 vs CTRL used as reference.

    (XLSX)

    S12 Table. Deseq2_specie level_i-COVID19 vs w-COVID19 used as reference.

    (XLSX)

    S13 Table. Shared and distinct bacteria in w-COVID19 and i-COVID19 versus CTRL used as reference.

    (XLSX)

    Attachment

    Submitted filename: Response to Reviewers.docx

    Attachment

    Submitted filename: Response to Reviewers.docx

    Data Availability Statement

    Raw 16S sequencing data are available in the NCBI Sequence Read Archive under Accession Number PRJNA681516 (https://www.ncbi.nlm.nih.gov/bioproject/PRJNA681516).


    Articles from PLoS ONE are provided here courtesy of PLOS

    RESOURCES