

INTRODUCTION:
Antiviral therapy (AVT) for chronic hepatitis B (CHB) can prevent liver disease progression. Because of its stringent reimbursement criteria, significant numbers of patients with untreated minimally active (UMA)-CHB exist, although they are still subject to disease progression. We thus performed a cost-effectiveness analysis to assess the rationale for AVT for UMA-CHB.
METHODS:
We compared cost and effectiveness (quality-adjusted life years, QALYs) in virtual UMA-CHB cohorts of 10,000 50-year-olds receiving AVT (scenario 1) vs no treatment (scenario 2) for 10 years. A Markov model, including 7 health states of CHB-related disease progression, was used. Values for transition probabilities and costs were mostly obtained from recent South Korean data.
RESULTS:
The simulation of AVT vs no treatment predicted $2,201 incremental costs and 0.175 incremental QALYs per patient for 10 years, with an incremental cost-effectiveness ratio (ICER) of $12,607/QALY, suggesting cost-effectiveness of AVT. In sum, if 10,000 patients received AVT, 720 incident hepatocellular carcinoma and 465 CHB-related more deaths could be averted in 10 years relative to no treatment. When the simulated analysis period was extended to 20 years, AVT was also highly cost-effective with an ICER of $2,036/QALY. Although hepatocellular carcinoma–related mortality was a major factor influencing ICER, its fluctuation can be accepted within willingness to pay of $33,000 in South Korea. According to probabilistic sensitivity analysis with the threshold of willingness to pay, the probability of AVT cost-effectiveness was 83.3%.
DISCUSSION:
Long-term AVT for patients with UMA-CHB may contribute positively toward individual clinical benefit and national health care budget.
INTRODUCTION
Chronic hepatitis B virus (HBV) infection remains a substantial global public health issue, affecting more than 250 million people, despite a universal vaccination program (1). As a persistently high level of HBV replication in patients with chronic hepatitis B (CHB) is associated with an increased risk of cirrhosis and/or hepatocellular carcinoma (HCC) development (2,3), replication-suppressing antiviral therapy (AVT) using oral nucleoside/nucleotide analogues (NUCs) is the mainstay of current practice to prevent live disease progression (4). To date, entecavir and tenofovir disoproxil fumarate (TDF), which have a high genetic barrier to resistance (4,5) and similarly excellent degree of clinical efficacy in terms of virological, biochemical, serological, and histological responses, have been favored antivirals (4–6). Nevertheless, reimbursement for oral NUCs remains limited in many countries. It is officially permitted when the following criteria are fulfilled in the absence of HCC or cirrhosis: (i) elevated serum HBV-DNA level (≥20,000 IU/mL for hepatitis B e antigen-positive CHB or ≥2,000 IU/mL for hepatitis B e antigen-negative CHB) and (ii) serum alanine aminotransferase ≥2× upper limit of normal (4–8). Accordingly, significant numbers of patients have minimally active CHB (9,10), whereby serum HBV-DNA levels are persistently >2,000 IU/mL, a threshold that is closely associated with an increased risk of liver disease progression to HCC and/or cirrhosis (2,3). Nevertheless, the aforementioned criteria for NUC therapy may not be fulfilled during follow-up; therefore, patients remain untreated, resulting in persistently higher risk of disease progression throughout their lifetimes.
Clinical outcomes of patients with progression to advanced liver disease of HCC and/or cirrhosis are unsatisfactory. The 5-year overall survival rate of patients with HCC is less than 50%, and the 1-year mortality rate from cirrhotic complications among those with decompensated cirrhosis exceeds 10%–21% (11–13). To date, cost-effectiveness analyses of AVT using oral NUCs for this subgroup beyond the definite reimbursement guidelines are lacking. Achieving a statistically significant benefit from AVT with regard to preserving liver function, reducing HCC risk, and ultimately improving overall survival generally requires long-term treatment. In this regard, prolonged use of oral NUCs would increase the total socioeconomic burden. Here, we aimed to evaluate whether long-term AVT with oral NUCs is a cost-effective approach in patients with untreated minimally active (UMA)-CHB.
METHODS
Overview of the cost-effectiveness model
In this study, we performed a cost-effectiveness analysis using a Markov model to compare the following 2 scenarios for patients with UMA-CHB who did not meet the reimbursement criteria for NUC therapy (entecavir or TDF) by the National Health Insurance Service (NHIS) in South Korea: patients with UMA-CHB undergoing NUC therapy (scenario 1) vs those not receiving NUC therapy due to ineligibility including the current practice environment (scenario 2). The current reimbursement criteria of the NHIS in South Korea are described in Supplementary Table 1 (see Supplementary Digital Content, http://links.lww.com/CTG/A493). The model constituted 7 comprehensive clinical conditions that may develop in patients with UMA-CHB until the end of life; these health states are represented as bubbles in Figure 1 to reflect the entire clinical history of the disease: (i) UMA-CHB; (ii) CHB with virological response (CHB-VR), which takes into account the transition from UMA-CHB to CHB-VR either spontaneously or from NUC therapy; (iii) compensated cirrhosis (CC); (iv) decompensated cirrhosis (DCC); (v) HCC; (vi) liver transplantation (LT); and (vii) death (Figure 1) (14).
Figure 1.

Markov model structure for cost-effectiveness analysis of the use of NUC therapy in the UMA-CHB group. CHB, chronic hepatitis B; NUC, nucleos(t)ide analogue; UMA, untreated minimally active; VR, virological response.
A hypothetical cohort of patients aged 50 years (n = 10,000) was created. The analysis began when the cohort of patients reached UMA-CHB—the first state of the disease. Each cycle period was 1 year, and the hypothetical cohort of patients was distributed to each state according to transition probabilities at the end of one cycle. An analytic period of 10 years was used in the base-case analysis, which was conducted from the perspective of the health care system. A 5% discount rate was used for the analysis.
This study was approved by Yonsei Institutional Review Board (IRB No. 7001988-201907-HR-635-01E). The need for patient consent was waived due to the use of untraceable and deidentified secondary claims data.
Transition probabilities
The transition probabilities of each cycle were crucial factors for estimating the number of the cohort of patients distributed across the 7 defined states. These transition probabilities are indicated by arrows in Figure 1. Transition probabilities were obtained from previous literature by selecting studies that involved patient groups similar to those used in this study. Considering the typical steep variations in outcomes for patients with hepatitis B for the first year after initiating NUC therapy and flattened variations in subsequent outcomes, the transition probabilities of the first cycle differed from those of subsequent cycles within the 10-year period. Thus, for scenario 1, in which patients with UMA-CHB were undergoing NUC therapy, the transition probability from UMA-CHB to CHB-VR was estimated at 0.80 for the first year and 0.53 after the first year (the cumulative VR rate reached 99.4% in year 5) (15). For predicting progression to CC state from UMA-CHB state in both scenarios 1 and 2, the probability was obtained from the cumulative incidence of liver cirrhosis, whereby the cumulative incidence of liver cirrhosis over 5 years was estimated at 10.3% for the control group (16), and then calculated at an incidence rate of 0.022. The transition probability from UMA-CHB to HCC was computed at 0.011 in both scenarios based on the study by Lee et al. (9,10), in which the cumulative risk of HCC development was estimated at 9.8% in 9 years. For scenario 2, in which patients with UMA-CHB did not undergo NUC therapy, the transition probability of the VR, which indicates the probability of natural conversion to the VR state from the UMA-CHB state, was calculated at 0.025, based on the study by Chen et al. (3), in which the level of HBV-DNA was decreased below 10,000 copies/mL in 402 of 1,619 patients with ≥10,000 copies/mL over a mean follow-up of 11.4 years).
The same probabilities were applied to both scenarios regarding transitions from CHB-VR state. The transition probability from CHB-VR state to CC state was calculated as 0.007 (cumulative incidence at 5 years was 3.36%) and as 0.002 for HCC state (cumulative incidence at 9 years was 2.2%) (10,16). The transition probability from CC to DCC state was calculated as 0.011 (17). The incidence rate of transition to HCC from CC state was calculated from 4 teaching hospitals in South Korea and the value used was as 0.043 (the weighted cumulative risk of HCC development at 5 years; 21.6% in 499 entecavir patients and 16.8% in 411 TDF patients) (18). The transition probability was 0.078 for DCC to HCC state (19), 0.211 for LT state (19), and 0.114 for death (20). From HCC to LT state, the value of 0.016 was applied (21), and the mortality rate within 1 year after HCC diagnosis was derived from the nationwide HCC registry in South Korea as 0.294 (21). The probabilities associated with the LT state were estimated using Korean Network for Organ Sharing data, and the mortality rate applied was as 0.231 (Table 1) (22).
Table 1.
Transition probabilities

| Annual transition probability | Value | Source | |
| Health states | Scenario 1 (NUC therapy) | Scenario 2 (no treatment) | |
| UMA-CHB | |||
| At the first year | |||
| To UMA-CHB | 0.167 | 0.942 | Calculationa |
| To CHB-VR | 0.800 | 0.025 | Cho et al. (15) for scenario 1; Chen et al. (3) for scenario 2 |
| After year 1 | |||
| To UMA-CHB | 0.436 | 0.942 | Calculationa |
| To CHB-VR | 0.531 | 0.025 | Cho et al. (15) for scenario 1; Chen et al. (3) for scenario 2 |
| Any year | |||
| To CC | 0.022 | 0.022 | Chang et al. (16) |
| To HCC | 0.011 | 0.011 | Lee et al. (10) |
| Both scenarios | |||
| CHB-VR | |||
| To VR | 0.991 | Calculationa | |
| To CC | 0.007 | Chang et al. (16) | |
| To HCC | 0.002 | Lee et al. (10) | |
| CC | |||
| To CC | 0.946 | Calculationa | |
| To DCC | 0.011 | Kim et al. (17) | |
| To HCC | 0.043 | Kim et al. (18) | |
| DCC | |||
| To DCC | 0.598 | Calculationa | |
| To HCC | 0.078 | Jang et al. (19) | |
| To LT | 0.211 | Jang et al. (19) | |
| To death | 0.114 | Kim et al. (20) | |
| HCC | |||
| To HCC | 0.690 | Calculationa | |
| To LT | 0.016 | Kim et al. (21) | |
| To Death | 0.294 | Kim et al. (21) | |
| LT | |||
| To LT | 0.769 | Calculationa | |
| To death | 0.231 | Data from KONOS (22) | |
| Death | |||
| To death | 1.000 | — | |
| Cumulative incidence of adverse eventsb | Scenario 1 | Scenario 2 | |
| CKD | 0.02 (after 3 yr) | — | Lim et al. (23) |
| Osteopenia | 0.025 (during 4–8 yr period) | — | Marcellin et al. (24) |
| Osteoporosis | 0.025 (during 4–8 yr period) | — | Marcellin et al. (24) |
| Ratio of NUC therapy (entecavir/TDF) | 0.92 (=0.48/0.52) | — | Data from HIRA (HIRA-NPS-2016-0164) (27,28) |
CC, compensated cirrhosis; CHB-VR, chronic hepatitis B with virological response; CKD, chronic kidney disease; DCC, decompensated cirrhosis; HCC, hepatocellular carcinoma; HIRA, health insurance review and assessment service; LT, liver transplantation; NUC, nucleos(t)ide analogue; TDF, tenofovir disoproxil fumarate; UMA-CHB, untreated minimally active chronic hepatitis B.
If health status remained the same state after 1 cycle, transition probability was calculated by 1 − all other transition probabilities.
Transition probabilities of adverse events were applied only in the use of TDF.
In cases of long-term treatment with TDF, studies have demonstrated that renal dysfunction or low bone density disease may occur (23,24). However, no cases using entecavir were reported (25). After the use of TDF, the cumulative incidence of stage 3 chronic kidney disease (CKD), which was defined as glomerular filtration ratio <60 mL/min/1.73 m2 and considered to require treatment, was applied as 2% for the starting cohort from the third year (23). In addition, the cumulative incidence of osteopenia (−2.5 < bone marrow density measured by T score < −1) and osteoporosis (T score −2.5) was estimated as 2.5%, respectively, during 4–8 years after the start of taking TDF (24).
Costs
From the health care system perspective, all estimated costs for each health state included direct and indirect costs such as transportation and caregiving. Costs for productivity loss were not included due to the possibility of overestimation and uncertainty. All costs were converted to the current value using an exchange rate of 1,200 KRW per 1 USD for 2019. Direct costs included drugs, direct health care, and out-of-pocket health care costs. Drug costs, specifically those associated with NUC therapy, were calculated by multiplying the weighted average annual consumption of entecavir and TDF by the unit prices of these drugs. The unit prices were provided by the Health Insurance Review and Assessment Service (HIRA) (26), a public organization in South Korea, and the volume of the drugs consumed was calculated using patient sample data from the HIRA (HIRA-NPS-2017-0052) (27,28).
The direct costs for CHB, VR, and CC states were estimated using the data from Severance Hospital; during follow-up, patients routinely received laboratory tests every 6 months and underwent periodic surveillance with upper abdomen ultrasonography and serum alpha-fetoprotein levels to screen for HCC and cirrhotic complications every 6 months (6,29). Outpatient costs were calculated by multiplying the unit cost of transportation according to the Korean National Health and Nutrition Examination Survey (KNHANES) in 2017 (30) by the average number of outpatient visits, i.e., twice a year. For estimating costs in the UMA-CHB, CHB-VR, and CC states, hospital visits were assumed to occur approximately twice a year for follow-up examinations; this precluded the need to calculate hospital stay and out-of-pocket hospital costs.
Health care costs specific to the DCC, HCC, and LT states were derived from an earlier study that used 2015 data provided by the Asan Medical Center for analysis from the health care system perspective (20); these data were converted to current values before use. In the study by Kim et al. (20), HCC-specific costs were categorized into 3 stages: very early, early, and advanced. The costs were multiplied by the corresponding rates obtained from the Korea liver cancer registry sample data to calculate a weighted average value for each stage, which was then applied to the model. Costs associated with LT were divided into costs for the year in which the LT occurred and the costs for subsequent years. The value of the former was obtained from the study by Kim et al. (20) and that of the latter was obtained from the study by Park et al. (31) (Table 2).
Table 2.
Cost inputs

| Health states | Annual cost (USD) | Source | |||
| Medicationa | Health care | Transportation | Overall | ||
| UMA-CHB/CHB-VR/CC | Data from HIRA (26) for drug cost; data from Severance Hospital at 2019 for health care costs; data from KNHNES (30) for transportation costs | ||||
| Scenario 1 | 861 | 562 | 17 | 1,440 | |
| Scenario 2 | 562 | 17 | 579 | ||
| DCCb | 8,820 | Kim et al. (20) | |||
| HCCb | 35,370 | Kim et al. (20,21) | |||
| LTb | 129,837 | Kim et al. (20) | |||
| Post-LTb | 13,479 | Park et al. (31) | |||
| Adverse eventsa | Medication | Health care | Transportation | Overall | |
| CKD | 545 | 213 | 38 | 796 | Data from HIRA (HIRA-NPS-2017-0052) (27,28) |
| Osteopenia | 158 | 115 | 24 | 297 | Kwon et al. (32) and data from HIRA (HIRA-NPS-2017-0052) (27,28) |
| Osteoporosis | 425 | 115 | 24 | 564 | Kwon et al. (32) and data from HIRA (HIRA-NPS-2017-0052) (27,28) |
All costs are 2019 values; 1 USD dollar is approximately equal to 1,200 Korean won.
CC, compensated cirrhosis; CHB-VR, chronic hepatitis B with virological response; CKD, chronic kidney disease; DCC, decompensated cirrhosis; HCC, hepatocellular carcinoma; HIRA, health insurance review and assessment service; KNHANES, Korean National Health and Nutrition Examination Survey; LT, liver transplantation; UMA-CHB, untreated minimally active chronic hepatitis B; USD, US dollar.
NUC costs were limited to include in scenario 1.
Including medication, health care, and transportation costs. If needed, hospitalization costs were included.
The costs associated with treating adverse drug reactions, such as CKD, drug-induced osteopenia, and osteoporosis, were included in this model and separately divided into drug costs, other health care costs, and transportation costs. CKD costs were estimated as costs incurred by patients in their 50s with stage 3 CKD (N18.3 of KCD-seventh codes) diagnosis, based on data from HIRA. Health care costs and outpatient visit costs for both drug-induced osteopenia and osteoporosis were calculated from patients in their 50s with a diagnosis of drug-induced osteoporosis (M81.4 of KCD-seventh codes), based on data from HIRA. The drug costs for osteopenia estimated the expenditure for calcium and vitamin D; for osteoporosis, the cost for bisphosphonates was added (32).
Utilities
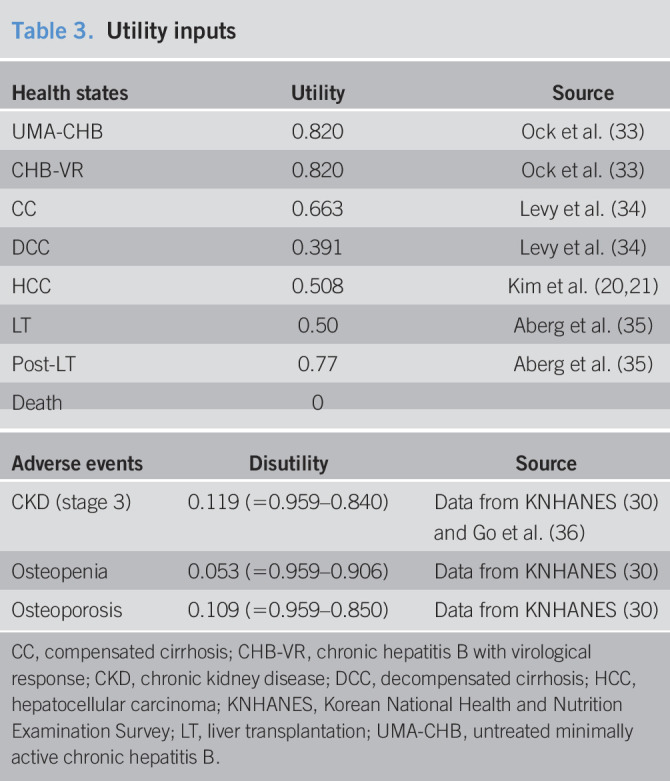
In this study, the health benefits were measured as utility, life-years gained, averted HCC, and averted deaths related to liver diseases. For measuring utility, quality-adjusted life years (QALYs) were used as the primary measure. We reviewed the utility data for Koreans to apply a local utility tailored to subjects' characteristics for each health status. A utility weight of 0.820 was applied to patients with UMA-CHB or CHB-VR (33). As the values of compensated and decompensated utilities of cirrhosis optimized for South Koreans have not been reported to date, we applied values from the work of Levy et al. (34), which was also adopted in a recent study from South Korea (20). In the HCC state, the values of 0.620, 0.577, and 0.440 were applied according to the 3 stages (very early, early, and advanced) (20) and combined as 0.508 using the prevalence of the nationwide HCC registry (6.6%, 41.0%, and 52.4% for each stage, respectively; 2011–2014) (21). The utility weight of the LT state was applied to the period within a year after transplantation and subsequently thereafter (35). To calculate disutility values, we first measured the general utility of patients in their 50s from KNHANES data and then subtracted the value of utility (30). The utilities of stage 3 CKD, osteopenia, and osteoporosis in Koreans were used as QALYs of adverse event status (30,36) (Table 3).
Table 3.
Utility inputs
| Health states | Utility | Source |
| UMA-CHB | 0.820 | Ock et al. (33) |
| CHB-VR | 0.820 | Ock et al. (33) |
| CC | 0.663 | Levy et al. (34) |
| DCC | 0.391 | Levy et al. (34) |
| HCC | 0.508 | Kim et al. (20,21) |
| LT | 0.50 | Aberg et al. (35) |
| Post-LT | 0.77 | Aberg et al. (35) |
| Death | 0 |
| Adverse events | Disutility | Source |
| CKD (stage 3) | 0.119 (=0.959–0.840) | Data from KNHANES (30) and Go et al. (36) |
| Osteopenia | 0.053 (=0.959–0.906) | Data from KNHANES (30) |
| Osteoporosis | 0.109 (=0.959–0.850) | Data from KNHANES (30) |
CC, compensated cirrhosis; CHB-VR, chronic hepatitis B with virological response; CKD, chronic kidney disease; DCC, decompensated cirrhosis; HCC, hepatocellular carcinoma; KNHANES, Korean National Health and Nutrition Examination Survey; LT, liver transplantation; UMA-CHB, untreated minimally active chronic hepatitis B.
Analysis
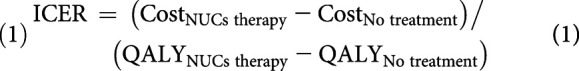
In this cost-effectiveness analysis, the values calculated in the base-case analysis are expressed as an incremental cost-effectiveness ratio (ICER) of NUC therapy vs no treatment for patients with UMA-CHB. The ICER was calculated by dividing incremental costs required to undergo NUC therapy vs no treatment by incremental effectiveness, indicating health utilities (Equation 1). Incremental heath utilities were measured as life-years (LY) gained and QALYs gained with NUC therapy. The number of averted HCC cases and costs required to avert a case of HCC after the effects of NUC therapy was calculated during the base-case analysis in comparison with no treatment.
 |
(1) |
where ICER is incremental cost-effectiveness ratio and QALY is quality adjusted life years.
Scenario 1 involves patients with UMA-CHB receiving NUC therapy, and scenario 2 involves patients with UMA-CHB not receiving NUC therapy.
Sensitivity analysis is a method used to evaluate uncertainty arising from economic valuation parameters by measuring the influence of fluctuations in each parameter on the value of ICER. We performed 1-way deterministic sensitivity analyses (DSAs) and probabilistic sensitivity analysis (PSA). One-way DSA examines fluctuations relative to variations in the range of values for each single parameter that are clinically important or extracted from other countries (Table 4), as well as their effects on results, which are displayed in a tornado diagram (Figure 2). We performed PSA on parameters listed in Table 4 with its specific distribution by running 1,000 simulations. A cost-effectiveness acceptability curve was generated to assess preference over a range of willingness-to-pay (WTP) thresholds in South Korea.
Table 4.
Variables for sensitivity analysis

| Variables | Deterministic analysis | Source | Probabilistic analysis | |
| Lower value | Upper value | Distribution | ||
| Transition probabilities | ||||
| UMA-CHB to CHB-VR at the first year at scenario 1 | 0.700 | 0.900 | Assumption | Beta (0.800, 0.400) |
| CC to HCC | 0.008 | 0.080 | Lin et al. (37) | Beta (0.043, 0.203) |
| DCC to LT | 0.000 | 0.400 | Kanwal et al. (14) | Beta (0.211, 0.408) |
| DCC to death (mortality rate) | 0.099 | 0.188 | Lin et al. (37) | Beta (0.114, 0.318) |
| HCC to LT | 0.000 | 0.050 | Kanwal et al. (14); assumption based upon data from Asan Medical Center (20) | Beta (0.016, 0.125) |
| HCC to death | 0.081 | 0.545 | Lin et al. (37) | Beta (0.294, 0.011) |
| Adverse events | 0.000 | 0.100 | Assumption | — |
| Costs | ||||
| NUC costs | −10% | +10% | Assumption | Gamma (833, 83) |
| Health care costs | −10% | +10% | Assumption | Gamma (189,242, 18,924) |
| Utilities | ||||
| CC | 0.570 | 0.700 | Ock et al. (33) and Levy et al. (34) | Beta (0.663, 0.015) |
| HCC | 0.390 | 0.670 | Levy et al. (34) | Beta (0.508, 0.016) |
| Discounted rates | 0% | 7.5% | Assumption | — |
CC, compensated cirrhosis; CHB-VR, chronic hepatitis B with virological response; DCC, decompensated cirrhosis; HCC, hepatocellular carcinoma; LT, liver transplantation; NUC, nucleos(t)ide analogue; UMA-CHB, untreated minimally active chronic hepatitis B.
Figure 2.

Tornado diagram of one-way deterministic sensitivity analysis. CC, compensated cirrhosis; CHB, chronic hepatitis B; DCC, decompensated cirrhosis; HCC, hepatocellular carcinoma; LT, liver transplantation; NUC, nucleos(t)ide analogue; UMA, untreated minimally active; VR, virological response.
RESULTS
Base-case analysis
From the health care system perspective, NUC therapy yielded higher costs and greater health benefits compared with no treatment among patients with UMA-CHB in their 50s (Table 5). The total cost per patient over the 10-year horizon was estimated at $15,349 for the NUC therapy group (scenario 1) and $13,148 for the no treatment group, yielding a difference of $2,201. Although patients in the NUC therapy group were estimated to spend $6,785 on NUC drug costs, $4,659 could be saved over 10 years for liver-related health care costs. The modeled simulation over the 10-year horizon demonstrated that a patient receiving NUC therapy gained 0.175 more QALYs (6.467 vs 6.292) than the no treatment group. Thus, ICERs for NUC therapy compared with those for no treatment were estimated at $12,607/QALY and $17,644/LY gained.
Table 5.
Results of base-case analysis per patient over the 10-year horizon

| Scenario 1 (NUC therapy) | Scenario 2 (no treatment) | Incremental value (scenario 1 − scenario 2) | |
| Total cost (USD) | 15,349 | 13,148 | 2,201 |
| Medication | 6,785 | 0 | 6,785 |
| Health care | 8,489 | 13,148 | −4,659 |
| Adverse events | 76 | 0 | 76 |
| Total effectiveness | |||
| QALY gained | 6.467 | 6.292 | 0.175 |
| LY gained | 7.976 | 7.851 | 0.125 |
| Incidence of HCC among 10,000 patients with UMA-CHB | 521 | 1,241 | −720 |
| No. of deaths related to liver diseases among 10,000 patients with UMA-CHB | 377 | 843 | −465 |
| ICER | |||
| Incremental cost per QALY (USD/QALY) | 12,607 | ||
| Incremental cost per LY (USD/LY) | 17,644 |
HCC, hepatocellular carcinoma; ICER, incremental cost-effectiveness ratio; LY, life-year; NUC, nucleos(t)ide analogue; QALY, quality-adjusted life-year; UMA-CHB, untreated minimally active chronic hepatitis B; USD, US dollar.
If 10,000 patients with UMA-CHB received NUC therapy, more episodes of incident HCC and liver disease-related deaths could be prevented. In the no treatment group, 1,241 cases of new HCC occurred out of 10,000 patients in 10 years, whereas 521 cases developed in the NUC therapy group. NUC therapy could avert approximately 60% (720 cases out of 10,000 patients) of new HCC cases over 10 years. Likewise, NUC therapy could save more than 55% of patients' lives (465 deaths out of 10,000 patients) compared with no treatment (377 deaths in the NUC therapy group vs 843 deaths in the no treatment group).
The results of additional analysis for a time horizon of 20 years are shown in Supplemental Table 2 (see Supplementary Digital Content, http://links.lww.com/CTG/A493). From the health care system perspective, ICERs for NUC therapy vs no treatment over the 20-year horizon were $2,036/QALY and $2,257/LY gained, which are highly cost-effective compared with the results of the 10-year horizon. The analysis revealed that if 10,000 patients with UMA-CHB continued NUC therapy for 20 years, 1,415 new cases of HCC and 1,257 deaths could be prevented.
One-way deterministic sensitivity analysis
One-way DSA indicated that the annual mortality rate from HCC was the most influential variable for ICER change. As the mortality rate for HCC changed from 8.1% to 54.5% (37), the ICER ranged from −$1,287 to $18,783 per QALY. If the annual mortality rate from HCC decreased to less than approximately 10%, NUC therapy yielded greater health effects and lower costs compared with no treatment, suggesting that NUC therapy is a cost-saving and superior option. The second most influential variable was NUC drug costs. When the annual NUC therapy cost varied from −10% to +10% of the base-case value ($833), ICER was calculated from −30% to +30% of the base-case ICER ($12,607/QALY). We also considered an increase in therapy cost by 10% in this DSA; however, given that drug costs are unlikely to increase due to the emergence of generic drugs and the government's policy on drug expenditure, ICER would likely not increase to 30% of the base-case ICER. All other variables including health care costs and utility weights of each health state exhibited smaller ICER changes (Figure 2).
Probabilistic sensitivity analysis
The results of PSA using 1,000 simulations are represented as a cost-effective plane and cost-effectiveness acceptability curve in Figure 3 and Figure 4. If the WTP (indicating cost-effective threshold) was set as 1 gross domestic product (GDP) per capita ($33,000) (38), NUC therapy remained the preferred option in 83.3% of simulations for patients with UMA-CHB. Assuming that the WTP was higher than $55,000 (1.7 times of 1 GDP per capita), the results from all simulations indicated that NUC therapy was an acceptable strategy.
Figure 3.

Cost-effectiveness plane. ICER, incremental cost-effectiveness ratio; QALY, quality-adjusted life year.
Figure 4.

Cost-effectiveness acceptability curve. WTP, willingness-to-pay.
DISCUSSION
This study assessed the cost-effectiveness of ongoing NUC therapy compared with that of no treatment in patients with UMA-CHB who were not eligible for the current criteria of NUC therapy under the NHIS system in South Korea. We demonstrate that NUC therapy, when provided for 10 years, was a highly cost-effective alternative option. If 10,000 patients were under NUC therapy, 720 incident HCC cases and 465 CHB-related deaths could be averted compared with no treatment over 10 years. Moreover, when the period of NUC therapy was extended to 20 years, the cost-effectiveness and clinical impact was larger.In addition, all sensitivity analyses supported the robustness of the cost-effectiveness of NUC therapy. Thus, this study provides important evidence to support scientific decision making regarding the expanded eligibility for NUC therapy among patients with UMA-CHB, who do not meet the current reimbursement criteria for NUC therapy.
Many studies have investigated the economic parameters and outcomes of interventions for patients with CHB, primarily comparing 2 NUCs (39,40) or diagnostic examination modalities (20). To the best of our knowledge, this is the first study to use the novel approach of comparing 2 scenarios with the aim of expanding eligibility criteria for patients with UMA-CHB. Although the HIRA in South Korea does not provide a fixed threshold for assessing cost-effectiveness, it is acceptable provided that new interventions have an estimated ICER of less than 1 GDP per capita in general, and 1 GDP per capita is then considered as the threshold of WTP (41). The GDP per capita of South Korea was approximately $33,000 in 2018 (38). In the base-case analysis (for a 10-year period), the estimated ICER was $12,607/QALY and fell under the CE threshold ($33,000). This suggests that NUC therapy would be a highly cost-effective option for the treatment of patients with UMA-CHB. This base-case ICER was conservatively estimated due to the limited time horizon and perspective of the analysis. In the analysis with a 20-year horizon, the ICER of NUC therapy was $2,036/QALY, implying that longer treatment could lead to better outcomes. As a health care system perspective was adopted for this study, the model did not include costs incurred from morbidity or premature death, such as lost productivity. If indirect costs were included in the analysis, the cost-effectiveness of NUC therapy would be expected to increase further.In addition, patients with UMA-CHB are estimated to comprise approximately 10% of all patients with CHB based up HIRA data (HIRA-NPS-2016-0164) (27,28) and previous literature (9,10,42,43). Considering that the prevalence of CHB in South Korea as of 2017 was reported to be 2.8% based on the KNHANES report (30), it is estimated that 130,000 to 140,000 patients with UMA-CHB exist. From a health care system perspective, the average annual NUC therapy cost over 10 years was estimated to be between 88 and 95 million US dollars and could prevent 936 to 1,008 new cases of HCC and 604 to 651 deaths annually.
A series of analyses in the present study enabled our main findings to be generalized for interpretation in real-life practice. Our study had several strengths. First, we mostly adopted epidemiological data, transition probabilities, cost, and utilities from the most recent real-world evidence in South Korea, which more practically reflects local clinical environments such as the patterns of antiviral prescription (e.g., entecavir vs TDF), HCC surveillance strategy consisting of alpha-fetoprotein and ultrasonography, distribution of tumor stages among newly developed HCC cases, and recent experiences of liver transplantation. In particular, we incorporated the potential hazards from long-term NUC therapy (e.g., CKD and osteopenia/osteoporosis by TDF use) into the cost-effective analysis. Furthermore, representative big data from South Korea (e.g., data from the HIRA) were analyzed to directly calculate health care costs. Second, we applied the transition probabilities of the first year and subsequent periods when shifting the health status from CHB to VR. This approach enabled more accurate reflection of the clinical course of patients undergoing NUC therapy, given that the proportion of VRs by NUC therapy increases steeply within the first year of starting NUCs.In addition, because the results of sensitivity analyses, including one-way DSA and PSA, exhibited small ICER changes and a high probability of acceptance, the high cost-effectiveness of NUC therapy was proven with robust estimation of ICER. Finally, our results are applicable for improving both individual health and balancing medical expenses in many countries (e.g., Japan, Taiwan, and others in the East Asia), which have a similar epidemiology of chronic HBV infection and reimbursement program to those of South Korea (7,44,45).
Our study has several limitations. There may have been under- and/or overestimation of health care costs. For example, the hospitalization and out-of-pocket health care costs in the health states of CHB, VR, and CC were excluded; therefore, the actual costs may have been underestimated. Conversely, overestimation of costs may have occurred given that costs were based on data from academic tertiary referral hospitals and patients visiting such institutions are more likely to have relatively severe disease conditions. However, out-of-pocket payment for surcharges by physicians in South Korea was abolished in 2018, and upper abdomen ultrasonography started to be reimbursed. Therefore, the gap between expected and actual costs was substantially narrowed. To overcome these shortcomings, we simultaneously evaluated the overall costs from patient sample data from the HIRA (HIRA-NPS-2016-0164) (27,28), revealing that there were only minimal differences in the costs of UMA-CHB, CHB-VR, and CC states ($579 calculated from academic tertiary referral hospitals such as Severance Hospital vs $ 570 from the HIRA patient sample data). Regarding health states such as DCC, HCC, and LT, our data may be regarded as reasonable as these patients are often hospitalized due to severe medical conditions and typically managed in large hospitals. The sensitivity analysis, which was conducted based on a previous study that assessed the robustness of study results relative to changes in costs using health insurance claim data, also confirmed the robustness of the cost-effectiveness reported in this study.
In conclusion, long-term NUC therapy is a highly cost-effective intervention for patients with UMA-CHB. Inclusion of long-term NUC therapy in the reimbursement program by the NHIS may improve individual health and reduce the overall socioeconomic burden of this disease.
CONFLICTS OF INTEREST
Guarantors of the article: Sungin Jang, MD, PhD, and Sang Hoon Ahn, MD, PhD.
Specific author contributions: Hankil Lee, PhD, and Beom Kyung Kim, MD, contributed equally to this work. H.L. and B.K.K.: acquisition of data, analysis and interpretation of data, drafting of the manuscript, and statistical analysis. B.K.K., S.J., and S.H.A.: study concept and design, analysis and interpretation of data, drafting of the manuscript, critical revision, and study supervision. B.K.K., S.J., and S.H.A.: critical revision of the manuscript.
Financial support: None to report.
Potential competing interests: None to report.
Study Highlights.
WHAT IS KNOWN
✓ AVT for CHB can prevent liver disease progression. However, because of its stringent reimbursement criteria, significant numbers of patients with UMA-CHB exist, although they are still subject to disease progression.
WHAT IS NEW HERE
✓ The simulation of AVT vs no treatment predicted $2,201 incremental costs and 0.175 incremental QALYs per patient for 10 years, with an incremental cost-effectiveness ratio of $12,607/QALY, suggesting cost-effectiveness of AVT.
TRANSLATIONAL IMPACT
✓ Long-term AVT for patients with UMA-CHB may contribute positively toward individual clinical benefit and national health care budget.
Supplementary Material
Footnotes
SUPPLEMENTARY MATERIAL accompanies this paper at http://links.lww.com/CTG/A493
Contributor Information
Hankil Lee, Email: hankil@yuhs.ac.
Beom Kyung Kim, Email: beomkkim@yuhs.ac.
Sang Hoon Ahn, Email: ahnsh@yuhs.ac.
REFERENCES
- 1.Liang LY, Wong GL. Unmet need in chronic hepatitis B management. Clin Mol Hepatol 2019;25:172–80. [DOI] [PMC free article] [PubMed] [Google Scholar]
- 2.Iloeje UH, Yang HI, Su J, et al. Predicting cirrhosis risk based on the level of circulating hepatitis B viral load. Gastroenterology 2006;130:678–86. [DOI] [PubMed] [Google Scholar]
- 3.Chen CJ, Yang HI, Su J, et al. Risk of hepatocellular carcinoma across a biological gradient of serum hepatitis B virus DNA level. JAMA 2006;295:65–73. [DOI] [PubMed] [Google Scholar]
- 4.EASL 2017 clinical practice guidelines on the management of hepatitis B virus infection. J Hepatol 2017;67:370–98. [DOI] [PubMed] [Google Scholar]
- 5.Terrault NA, Lok ASF, McMahon BJ, et al. Update on prevention, diagnosis, and treatment of chronic hepatitis B: AASLD 2018 hepatitis B guidance. Hepatology 2018;67:1560–99. [DOI] [PMC free article] [PubMed] [Google Scholar]
- 6.KASL clinical practice guidelines: Management of chronic hepatitis B. Clin Mol Hepatol 2016;22:18–75. [DOI] [PMC free article] [PubMed] [Google Scholar]
- 7.Sarin SK, Kumar M, Lau GK, et al. Asian-Pacific clinical practice guidelines on the management of hepatitis B: A 2015 update. Hepatol Int 2016;10:1–98. [DOI] [PMC free article] [PubMed] [Google Scholar]
- 8.KASL clinical practice guidelines for management of chronic hepatitis B. Clin Mol Hepatol 2019;25:93–159. [DOI] [PMC free article] [PubMed] [Google Scholar]
- 9.Lee HW, Kim SU, Baatarkhuu O, et al. Progression of untreated minimally active chronic HBV infection compared to inactive infection. Clin Gastroenterol Hepatol 2019;17:2808–10.e2. [DOI] [PubMed] [Google Scholar]
- 10.Lee HW, Kim SU, Park JY, et al. Prognosis of untreated minimally active chronic hepatitis B patients in comparison with virological responders by antivirals. Clin Transl Gastroenterol 2019;10:e00036. [DOI] [PMC free article] [PubMed] [Google Scholar]
- 11.Berzigotti A. Advances and challenges in cirrhosis and portal hypertension. BMC Med 2017;15:200. [DOI] [PMC free article] [PubMed] [Google Scholar]
- 12.D'Amico G, Pasta L, Morabito A, et al. Competing risks and prognostic stages of cirrhosis: A 25-year inception cohort study of 494 patients. Aliment Pharmacol Ther 2014;39:1180–93. [DOI] [PubMed] [Google Scholar]
- 13.KASL clinical practice guidelines for liver cirrhosis: Varices, hepatic encephalopathy, and related complications. Clin Mol Hepatol 2020;26:83–127. [DOI] [PMC free article] [PubMed] [Google Scholar]
- 14.Kanwal F, Farid M, Martin P, et al. Treatment alternatives for hepatitis B cirrhosis: A cost-effectiveness analysis. Am J Gastroenterol 2006;101:2076–89. [DOI] [PubMed] [Google Scholar]
- 15.Cho JY, Sohn W, Sinn DH, et al. Long-term real-world entecavir therapy in treatment-naive hepatitis B patients: base-line hepatitis B virus DNA and hepatitis B surface antigen levels predict virologic response. Korean J Intern Med 2017;32:636–46. [DOI] [PMC free article] [PubMed] [Google Scholar]
- 16.Chang Y, Choe WH, Sinn DH, et al. Nucleos(t)ide analogue treatment for patients with hepatitis B virus (HBV) e antigen-positive chronic HBV genotype C infection: A nationwide, multicenter, retrospective study. J Infect Dis 2017;216:1407–14. [DOI] [PubMed] [Google Scholar]
- 17.Kim BG, Park NH, Lee SB, et al. Mortality, liver transplantation and hepatic complications in patients with treatment-naive chronic hepatitis B treated with entecavir vs tenofovir. J Viral Hepat 2018;25:1565–75. [DOI] [PubMed] [Google Scholar]
- 18.Kim SU, Seo YS, Lee HA, et al. A multi-center study of entecavir vs. tenofovir on prognosis of treatment-naïve chronic hepatitis B in the Republic of Korea. J Hepatol 2019;71:456–64. [DOI] [PubMed] [Google Scholar]
- 19.Jang JW, Choi JY, Kim YS, et al. Effects of virologic response to treatment on short- and long-term outcomes of patients with chronic hepatitis B virus infection and decompensated cirrhosis. Clin Gastroenterol Hepatol 2018;16:1954–63 e1953. [DOI] [PubMed] [Google Scholar]
- 20.Kim HL, An J, Park JA, et al. Magnetic resonance imaging is cost-effective for hepatocellular carcinoma surveillance in high-risk patients with cirrhosis. Hepatology 2019;69:1599–613. [DOI] [PubMed] [Google Scholar]
- 21.Kim BK, Kim DY, Han KH, et al. Changes in real-life practice for hepatocellular carcinoma patients in the Republic of Korea over a 12-year period: A nationwide random sample study. PLoS one 2019;14:e0223678. [DOI] [PMC free article] [PubMed] [Google Scholar]
- 22.Korean Network for Organ Sharing (KONOS). Organ Transplant Annual Statistics Report. KONOS: Seoul, 2013. [Google Scholar]
- 23.Lim TS, Lee JS, Kim BK, et al. An observational study on long-term renal outcome in patients with chronic hepatitis B treated with tenofovir disoproxil fumarate. J Viral Hepat 2020;27:316–22. [DOI] [PubMed] [Google Scholar]
- 24.Marcellin P, Gane EJ, Flisiak R, et al. Long term treatment with tenofovir disoproxil fumarate for chronic hepatitis B infection is safe and well tolerated and associated with durable virologic response with no detectable resistance: 8 year results from two phase 3 trials. Hepatology 2014;60:313A. [Google Scholar]
- 25.Yang YM, Choi EJ. Renal safety of tenofovir and/or entecavir in patients with chronic HBV monoinfection. Ther Clin Risk Manag 2017;13:1273–85. [DOI] [PMC free article] [PubMed] [Google Scholar]
- 26.(http://www.hira.or.kr/bbsDummy.do?pgmid=HIRAA030014050000). Accessed July 1, 2019.
- 27.(https://opendata.hira.or.kr/op/opc/selectPatDataAplInfoView.do). Accessed July 10, 2019.
- 28.Kim L, Kim JA, Kim S. A guide for the utilization of health insurance review and assessment service national patient samples. Epidemiol Health 2014;36:e2014008. [DOI] [PMC free article] [PubMed] [Google Scholar]
- 29.Maruyama H, Kato N. Advances in ultrasound diagnosis in chronic liver diseases. Clin Mol Hepatol 2019;25:160–7. [DOI] [PMC free article] [PubMed] [Google Scholar]
- 30.(https://knhanes.cdc.go.kr/knhanes/eng/index.do). Accessed November 29, 2019.
- 31.Park JY, Heo J, Lee TJ, et al. A novel estimation of the relative economic value in terms of different chronic hepatitis B treatment options. PLoS one 2013;8:e57900. [DOI] [PMC free article] [PubMed] [Google Scholar]
- 32.Kwon JW, Park HY, Kim YJ, et al. Cost-effectiveness of pharmaceutical interventions to prevent osteoporotic fractures in postmenopausal women with osteopenia. J Bone Metab 2016;23:63–77. [DOI] [PMC free article] [PubMed] [Google Scholar]
- 33.Ock M, Han JW, Lee JY, et al. Estimating quality-adjusted life-year loss due to noncommunicable diseases in Korean adults through to the year 2040. Value Health 2015;18:61–6. [DOI] [PubMed] [Google Scholar]
- 34.Levy AR, Kowdley KV, Iloeje U, et al. The impact of chronic hepatitis B on quality of life: A multinational study of utilities from infected and uninfected persons. Value Health 2008;11:527–38. [DOI] [PubMed] [Google Scholar]
- 35.Åberg F, Mäklin S, Räsänen P, et al. Cost of a quality‐adjusted life year in liver transplantation: The influence of the indication and the model for end‐stage liver disease score. Liver Transpl 2011;17:1333–43. [DOI] [PubMed] [Google Scholar]
- 36.Go DS, Kim SH, Park J, et al. Cost-utility analysis of the National Health Screening Program for chronic kidney disease in Korea. Nephrology (Carlton) 2019;24:56–64. [DOI] [PubMed] [Google Scholar]
- 37.Lin X, Robinson NJ, Thursz M, et al. Chronic hepatitis B virus infection in the Asia-Pacific region and Africa: Review of disease progression. J Gastroenterol Hepatol 2005;20:833–43. [DOI] [PubMed] [Google Scholar]
- 38.(https://www.imf.org/external/pubs/ft/weo/2019/02/weodata/weorept.aspx?pr.x=45&pr.y=21&sy=2016&ey=2021&scsm=1&ssd=1&sort=country&ds=.&br=1&c=542&s=NGDP_RPCH%2CNGDPD%2CPPPGDP%2CNGDPDPC%2CPPPPC%2CPCPIPCH&grp=0&a=). Accessed September 14, 2019.
- 39.Dan YY, Wong JB, Hamid SS, et al. Consensus cost-effectiveness model for treatment of chronic hepatitis B in Asia Pacific countries. Hepatol Int 2014;8:382–94. [DOI] [PubMed] [Google Scholar]
- 40.Buti M, Brosa M, Casado MA, et al. Modeling the cost-effectiveness of different oral antiviral therapies in patients with chronic hepatitis B. J Hepatol 2009;51:640–6. [DOI] [PubMed] [Google Scholar]
- 41.Cole A, Marsden G, Devlin N. New age decision making in HTA: Is it applicable in Asia? Report of the HTAi 2016 Panel Session 2016, Tokyo, May 10–14, 2016.
- 42.Lee HW, Kim EH, Lee J, et al. Natural history of untreated HBeAg-positive chronic HBV infection with persistently elevated HBV DNA but normal alanine aminotransferase. Clin Transl Gastroenterol 2020;11:e00140. [DOI] [PMC free article] [PubMed] [Google Scholar]
- 43.Lee HW, Kim SU, Baatarkhuu O, et al. Comparison between chronic hepatitis B patients with untreated immune-tolerant phase vs. those with virological response by antivirals. Sci Rep 2019;9:2508. [DOI] [PMC free article] [PubMed] [Google Scholar]
- 44.Hsu YC, Yip TC, Ho HJ, et al. Development of a scoring system to predict hepatocellular carcinoma in Asians on antivirals for chronic hepatitis B. J Hepatol 2018;69:278–85. [DOI] [PubMed] [Google Scholar]
- 45.Hsu YC, Ho HJ, Lee TY, et al. Temporal trend and risk determinants of hepatocellular carcinoma in chronic hepatitis B patients on entecavir or tenofovir. J Viral Hepat 2018;25:543–51. [DOI] [PubMed] [Google Scholar]
Associated Data
This section collects any data citations, data availability statements, or supplementary materials included in this article.