

Abstract
The zebrafish (Danio rerio) is a powerful model organism for studies of the innate immune system. One apparent difference between human and zebrafish innate immunity is the cellular machinery for LPS sensing. In amniotes, the protein complex formed by Toll-like receptor 4 and myeloid differentiation factor 2 (Tlr4/Md-2) recognizes the bacterial molecule lipopolysaccharide (LPS) and triggers an inflammatory response. It is believed that zebrafish have neither Md-2 nor Tlr4: Md-2 has not been identified outside of amniotes, while the zebrafish tlr4 genes appear to be paralogs, not orthologs, of amniote TLR4s. We revisited these conclusions. We identified a zebrafish gene encoding Md-2, ly96. Using single-cell RNA-Seq, we found that ly96 is transcribed in cells that also transcribe genes diagnostic for innate immune cells, including the zebrafish tlr4-like genes. In larval zebrafish, ly96 is expressed in a small number of macrophage-like cells. In a functional assay, zebrafish Md-2 and Tlr4ba form a complex that activates NF-κB signaling in response to LPS. In larval zebrafish ly96 loss-of-function mutations perturbed LPS-induced cytokine production but gave little protection against LPS toxicity. Finally, by analyzing the genomic context of tlr4 genes in eleven jawed vertebrates, we found that tlr4 arose prior to the divergence of teleosts and tetrapods. Thus, an LPS-sensitive Tlr4/Md-2 complex is likely an ancestral feature shared by mammals and zebrafish, rather than a de novo invention on the tetrapod lineage. We hypothesize that zebrafish retain an ancestral, low-sensitivity Tlr4/Md-2 complex that confers LPS-responsiveness to a specific subset of innate immune cells.
INTRODUCTION
Amniote innate immune systems are exquisitely sensitive to lipopolysaccharide (LPS), a component of the cell wall in Gram-negative bacteria (1–3). LPS is sensed by a protein complex composed of Toll-like receptor 4 (Tlr4) and Md-2 (also known as LY96 and ESOP-1) (1, 4). LPS binds in a pocket of Md-2, triggering dimerization of the Tlr4/Md-2 complex (Fig 1) (5). This, in turn, activates a Myd88-dependent NF-κB response (6). When properly regulated, the LPS activation of Tlr4/Md-2 regulates microbiome populations (7), recruits neutrophils to sites of infection(8), and induces angiogenesis (9). When dysregulated, Tlr4/Md-2 activity induces septic shock(10, 11), plays roles in inflammatory disorders (11, 12), and is a key player in the tissue remodeling that accompanies tumorigenesis (13, 14).
Fig 1. LPS activation of amniote TLR4 requires cofactors MD-2 and CD14.

A) Schematic representation of LPS transfer from CD14 to the TLR4/MD-2 complex. LPS is brought by CD14 and loaded into MD-2, which binds to TLR4. Binding of LPS to the MD-2 co-receptor causes dimerization of the TLR4/MD-2 complex, activating a downstream inflammatory response. B) The interface between human TLR4 (white and black) and MD-2 (dark gray) is extensive. Both are required to form a productive interaction with LPS (shown as spheres). Structure shown was made from PDB 3FXI (19).
The role of Tlr4/Md-2 in LPS-sensing outside of amniotes remains poorly understood. Understanding this response in zebrafish (Danio rerio) is of particular interest, as the zebrafish is a powerful model organism for studies of vertebrate innate immunity (15). Zebrafish have mature genetic resources, rapid generation time, clear embryos, and facile germ-free derivation (16, 17). The zebrafish is increasingly popular as a model for understanding host-microbe interactions (18), as well as a tool to understand the development of the innate immune system (16).
The zebrafish response to LPS is puzzling (20, 21). In some ways, it is similar to amniotes. As in amniotes, LPS triggers the expression of Myd88-dependent genes (22–24). Further, the expression patterns of genes induced by LPS stimulation are highly similar between mouse and zebrafish (25). There are, however, several lines of evidence that suggest Tlr4/Md-2 is not involved. Most critically, the gene encoding the essential co-receptor Md-2 has not been identified in zebrafish and other ray-finned fishes (20, 21, 26). Further, zebrafish Tlr4 proteins do not activate NF-κB in response to LPS in ex vivo assays, even when complemented with a mouse or human Md-2 (20, 21). Finally, zebrafish do not have a direct ortholog to amniote tlr4. Rather, they possess three tandem tlr4-like genes—tlr4ba, tlr4bb, and tlr4al—that are thought to have arisen from an ancestral Toll-like receptor lost in tetrapods but retained in ray-finned fishes (21). These observations have led to the hypothesis that zebrafish respond to LPS by a non-Tlr4/Md-2-dependent pathway.
We set out to carefully revisit these conclusions using resources unavailable when the initial investigations of zebrafish Tlr4 were performed. Using careful bioinformatics, we found an ortholog of the gene encoding Md-2 (ly96) in zebrafish and other ray-finned fishes. When co-transfected into mammalian cells, the zebrafish ly96 and tlr4ba genes activate NF-κB signaling in response to LPS. Single-cell RNA-seq experiments on larval zebrafish revealed that the gene is expressed in a small subset of cells that express the zebrafish tlr4-like genes and the macrophage-specific gene mpeg1.1 (27, 28) Physiologically, zebrafish larvae with loss of function ly96 mutations exhibited perturbed cytokine production in response to LPS, but were not protected from LPS toxicity. Finally, we revisited the history of the tlr4 gene in zebrafish, finding that formation of an LPS-sensitive Tlr4/Md-2 complex is likely an ancestral feature shared by mammals and zebrafish, rather than a de novo invention on the tetrapod lineage. We hypothesize that zebrafish preserve an ancestral, low-sensitivity Tlr4/Md-2 complex that may play an LPS-sensing role in a small population of innate immune cells.
MATERIALS & METHODS
Phylogenetic reconstruction analysis
We constructed curated databases of Md-1, Md-2, Tlr4, and Cd180 protein sequences from across the vertebrates. Cd180 and Md-1 are paralogs of Tlr4 and Md-2, respectively(29). We obtained amino acid sequences of these proteins from NCBI, Ensembl, Fish1TK, amphibian transcriptomes (30–33), UniProt, and ZFIN. We constructed a multiple sequence alignment for Tlr4 and Cd180 and for Md-2 and Md-1 using MSAPROBS(34), followed by manual editing in MEGA (35). We manually trimmed the alignment to remove highly variable (and therefore unalignable) regions. We used PHYML (36, 37) with subtree pruning and re-grafting to construct the ML phylogeny. Pilot analyses revealed that the JTT substitution model with 8 rate categories and a floating gamma distribution parameter yielded the highest likelihood trees (38–40). An Akaike information criterion (AIC) test was used to control for overfitting (41). We rooted our trees at the duplication of these proteins in early vertebrates. Alignment figures in supplement were made with JalView (42). All sequences and alignments are available for download at https://github.com/harmslab/vertebrate-tlr4-evolution.git.
Synteny analysis
For the ly96 synteny analysis, we used the Ensembl synteny module (43) to map homologs onto the chromosomes of species of interest. For the tlr4 synteny analysis, we took the 22 genes flanking human TLR4 (11 on each side) and the 22 genes flanking zebrafish tlr4. We used tblastn with default parameters to BLAST these sequences against 11 vertebrate genomes. We discarded all hits with e-value > 0.001 and then calculated a running average of the log (e-value) along each chromosome with a sliding window of 10,000 bases. Finally, we divided this running average by the maximum observed log (e-value)/bp value across all genomes. This value occurs for the window centered on the zebrafish tlr4 gene. On the final relative scale, 0.0 indicates no hits observed in a given window and 1.0 is the maximum e-value per base pair. The complete analysis pipeline is implemented in a collection of shell scripts and jupyter notebooks (https://github.com/harmslab/vertebrate-tlr4-evolution.git).
Gene expression analysis
Whole 6 days post fertilization (dpf) zebrafish were euthanized by tricaine methane sulfonate overdose, flash frozen in 1 mL of Trizol (Ambion), thawed, and homogenized. Chloroform (200 μL) was added to each tube followed by mixing, centrifugation at 12,000 g for 10 minutes at 4°C, transfer of the aqueous phase to a separate tube, addition of 200 μL ethanol, and binding of sample to an RNeasy mini kit column (Qiagen). RNA was washed and eluted according to the manufacturer’s instructions and treated with RQ1 DNase (Promega). RNA was reverse transcribed into cDNA using Superscript II Reverse Transcriptase (Invitrogen) and an oligo dT (20) primer, then amplified by PCR using gene-specific primers for zebrafish ly96 (5’ - TGTATGGCATCTGAGAAAGCAGA - 3’ and 5’ - AAGAGCAGGGGGAAACAGTC - 3’) and the housekeeping gene b2m (5’ - ACGCTGCAGGTATATTCATC - 3’ and 5’ - TCTCCATTGAACTGCTGAAG - 3’). PCR products were separated by electrophoresis on a 6% bis-Acrylamide (19:1) gel that was stained with 1X SYBR green 1 nucleic acid gel stain (Invitrogen) and imaged using an AlphaImagerHP (Alpha Innotech). The identity of the ly96 RT-PCR product was verified by Sanger sequencing.
Single-cell RNA-Seq
Single-cell analysis of transcription patterns of ly96, tlr4ba, tlr4bb, and tlr4al was performed using the recently released Zebrafish Single-Cell Transcriptome Atlas (44). Briefly, dissociated cells were run on a 10X Chromium platform using v2 chemistry. Dissociated samples for each time point (1, 2 and 5 dpf) were submitted in duplicate to determine technical reproducibility. The resulting cDNA libraries were sequenced on either an Illumina Hi-seq or an Illumina Next-seq. The resulting sequencing data were analyzed using the 10X Cellranger pipeline, version 2.2.0 (45) and the Seurat software package for R, v3.4.4 (46, 47) using standard quality control, normalization, and analysis steps. We aligned reads to the zebrafish genome, GRCz11_93, and counted expression of protein coding reads. The resulting matrices were read into Seurat where we performed PCA and UMAP analysis on the resulting dataset with 178 dimensions and a resolution of 13.0, which produced 220 clusters and one singleton. Differential gene expression analysis was performed using the FindAllMarkers function in Seurat and Wilcoxon rank sum test.
Cell Culture and Transfection Conditions
Mammalian expression vectors containing human TLR4 and mouse Tlr4 were obtained from Addgene (https://www.addgene.org/; #13085 and #13086), originally deposited by Ruslan Medzhitov. Human CD14 and ELAM-Luc were also obtained from Addgene (https://www.addgene.org/; #13645 and #13029), originally deposited by Doug Golenbock. Human MD-2 was obtained from the DNASU Repository (https://dnasu.org/; HsCD00439889) and contains a C-terminal V5-tag. Mouse Md-2 (UniProt; https://www.uniprot.org/; #Q9JHF9) and Cd14 (UniProt; https://www.uniprot.org/; #P10810), opossum Md-2 (UniProt; https://www.uniprot.org/; #F6QBE6) and Cd14 (NCBI; https://www.ncbi.nlm.nih.gov/; #XP_007473804.1), and chicken Md-2 (UniProt; https://www.uniprot.org/; #A0A1D5NZX9) and Cd14 (UniProt; https://www.uniprot.org/; #B0BL87) were designed to be free of restriction sites, codon-optimized for human expression, and purchased as mammalian expression vector constructs in pcDNA3.1 (+) from Genscript (New Jersey, USA). Zebrafish tlr4ba (ensembl; https://ensembl.org; ENSDART00000044697.6) and ly96 (G) were also obtained from Genscript in pcDNA3.1 (+). Zebrafish tlr4bb was a gift from Carol Kim. We re-cloned this protein from its original vector into pcDNA3.1 (+) to limit variability in expression due to differences in vector size and promoter.
Human embryonic kidney cells (HEK293T/17, ATCC CRL-11268) were maintained up to 30 passages in DMEM supplemented with 10% FBS at 37° C with 5% CO2. For each transfection, a confluent 100 mm plate of HEK293T/17 cells was treated at room temperature with 0.25% Trypsin-EDTA in HBSS and resuspended with an addition of DMEM + 10% FBS. This was diluted 4-fold into fresh medium and 135 μL aliquots of resuspended cells were transferred to a 96-well cell culture treated plate. Transfection mixes were made with 10 ng of tlr4, 1 ng of cd14, 10 ng of ly96, 1 ng of Renilla, 20 ng of ELAM-Luc, and 58 ng of pcDNA3.1 (+) per well for a total of 100 ng of DNA, diluted in OptiMEM to a volume of 10 μL/well. To the DNA mix, 0.5 μL per well of PLUS reagent was added followed by a brief vortex and room temperature incubation for 10 min. Lipofectamine was diluted 0.5 μL into 9.5 μL OptiMEM per well. This was added to the DNA + PLUS mix, vortexed briefly and incubated at RT for 15 min. The transfection mix was diluted to 65 μL/well in OptiMEM and aliquoted onto a plate. Cells were incubated with transfection mix overnight (20–22 hrs) and then treated with LPS. E. coli K-12 lipopolysaccharide (LPS) (tlrl-eklps, Invivogen) was dissolved at 5 mg/mL in endotoxin-free water, and aliquots were stored at −20° C. To avoid freeze-thaw cycles, working stocks of LPS were prepared at 10 μg/mL and stored at 4° C. To prepare treatments, LPS was diluted in 25% phosphate buffered saline and 75% DMEM. Cells were incubated with treatments for 4 hr. The Dual-Glo Luciferase Assay System (Promega) was used to assay Firefly and Renilla luciferase activity of individual wells. Each NF-κB induction value shown represents the Firefly luciferase activity/Renilla luciferase activity, normalized to the buffer treated transfection control to compare fold-change in NF-κB activation for treatments.
Generation of mutant zebrafish
Zebrafish experiments were approved by the University of Oregon Institutional Animal Care and Use Committee. Chop Chop (http://chopchop.cbu.uib.no) was used to design a guide RNA (gRNA) targeting the first exon of zebrafish ly96 (si:dkey-82k12.13, GRCz11). A gRNA template was generated by a template-free Phusion polymerase (New England Biolabs) PCR reaction using a scaffold primer (5’-GATCCGCACCGACTCGGTGCCACTTTTTCAAGTTGATAACGGACTAGCCTTATTTTAACTTGCTATTTCTAGCTCTAAAAC-3’) and an ly96-specific primer (5’- AATTAATACGACTCACTATAGGGTATCAGATATGGCGCTTGTTTTAGAGCTAGAAATAGC-3’), then cleaned using the QIAquick PCR Purification Kit (Qiagen), transcribed using a MEGAscript kit (Ambion), and purified by phenol-chloroform extraction and isopropanol precipitation. Cas9 RNA was made by linearizing the pT3TS-nls-zCas9-nls plasmid (41) with XbaI, purifying it using the QIAquick Gel Extraction Kit (Qiagen), performing an in vitro transcription reaction using the T3 mMESSAGE kit (Invitrogen), and purifying the RNA using the RNeasy Mini kit (Qiagen). AB strain zebrafish embryos were microinjected at the one cell stage with 1–2 nL of a mixture containing 100 ng/μL Cas9 mRNA, 50 ng/μL gRNA, and phenol red, and raised to adulthood. Fin DNA was amplified by PCR using primers specific to the targeted region (5’- CAAATTGGATTCACAACAGAGC −3’ and 5’ - CCATGGAAAATCAATGAAAAGC - 3’). Mosaic mutants were identified based on loss of an HaeII restriction site and were outcrossed to wildtype AB zebrafish to generate heterozygotes. Fish with loss-of-function mutations were identified by Sanger sequencing and further crossed to generate three independent homozygous ly96 mutant lines (Fig S1).
LPS Injection experiments
Larval 6 day post fertilization fish were anesthetized in 168 mg/mL tricaine methane sulfonate in embryo medium and microinjected by cardiac ventricular injection with ~2 nL of 100 μg/mL LPS from Salmonella enterica serotype typhimurium (Sigma L6511) and transferred to fresh embryo medium (23, 49). Six pools of five embryos of each genotype and condition were harvested at 6 hours post-injection. Total RNA was purified using the same procedure as for gene expression analysis. qRT-PCR was used to measure il1b and mmp9 RNA levels in zebrafish tissues. RNA was treated with TURBO DNase (Ambion) according to manufacturer’s instructions then reverse transcribed with an oligo(dT)20 primer using the Superscript III cDNA First Strand Synthesis kit (Invitrogen). The qPCR reaction was set up using the KAPA SYBR FAST ABI Prism kit (KAPA Biosystems) according to manufacturer’s instructions and run on a Quant Studio 3 System (ThermoFisher) using the default settings for SYBR Green reagents and the fast run mode in the QuantStudio Design & Analysis Software v.1.4.2. The comparative CT (ΔΔCT) method was used to calculate relative mRNA levels. Each sample was run in triplicate and data were normalized to the expression of the housekeeping genes eef1a1l1 and ppiab. The primers used for qRT-PCR were published previously (50, 51). Md2 experiments were performed using AB strain fish, while myd88 experiments were on an AB × TU background.
We analyzed the outcome of these treatments on the log of the relative RNA level, using ANOVA accounting for the effects of genotype, treatment, RNA identity, and genotype:treatment cross-terms. We estimated the significance of individual factors using the Tukey Honest Significant Difference approach. Statistical analyses were done using R 4.0.2 (47).
Fish LPS survival assay
WT and homozygous ly96 mutant zebrafish embryos were grown under standard conditions in separate 10 cm petri dishes at a density of one fish per mL of embryo medium (EM), with fifty fish total per dish. At 5 dpf, lipopolysaccharides (LPS) purified from Escherichia coli 0111:B4 (Sigma L2630) was dissolved in EM and added to dishes at a final concentration of 0.6 mg/mL, and control fish were mock treated with EM alone. Dead larvae, as determined by lack of heartbeat, were counted and removed at regular intervals from 16 to 48 hours or from 16 to 72 hours after addition of LPS, at which time the experiment was terminated and surviving fish were humanely euthanized.
RESULTS
Zebrafish have a gene encoding MD-2
The strongest argument against Tlr4/Md-2 performing LPS-sensing in zebrafish is the presumed lack of Md-2. Md-2 is essential for LPS recognition by amniote Tlr4, as it contains the LPS binding pocket (Fig 1). We therefore asked whether we could find a gene encoding Md-2 in bony fishes. By convention, the gene encoding Md-2 is known as ly96; therefore, throughout this manuscript, we will refer to the protein as “Md-2” and its gene as “ly96.”
We started by using the human MD-2 protein sequence to BLAST against the zebrafish genome and transcriptome. This returned no significant hits, so we took a more phylogenetically informed strategy. Relative to humans, the earliest branching, functionally characterized Tlr4/Md-2 complex is from chicken (Gallus gallus). We therefore “walked out” from amniotes towards fishes, starting with amphibians. We BLASTed the human MD-2 protein sequence against the Xenopus laevis genome. This revealed a hit to a hypothetical protein with 30% identity (OCT74818.1). When reverse-BLASTed against the human proteome, this hit returned Md-2. To validate the amino acid sequence, we compared it to the sequences of functionally characterized Md-2 proteins from amniotes. We found that the X. laevis gene appeared to be N-terminally truncated. Using XenBase, we identified the full-length transcript in the transcriptome for X. laevis. By BLASTing against available amphibian transcriptomes (30–33), we further identified putative Md-2 proteins in Rhinella marina, Hynobius retardatus, Odorrana margaretae, and Ichthyophis bannanicus (Fig S2).
With these putative amphibian Md-2 sequences in hand, we returned to our search for a zebrafish Md-2. A BLAST against a zebrafish transcriptome using the X. laevis sequence revealed a likely transcript (si:dkey-82k12.13, ENSDARG00000105462, 23% identity). We then searched additional fish transcriptomes available from the Fish-T1K project (52) and identified a set of transcripts from three species that matched Md-2 (Fig S2). The genes we identified in bony fishes that encode putative Md-2 proteins were highly diverged. On average, they exhibited only 26% identity against human Md-2, and only ~40% identity relative to one another.
We continued to BLAST genomes and transcriptomes from species that diverged earlier than bony fishes relative to humans, including Chondrichthyes (cartilaginous fishes) and Agnatha (jawless fishes). We were unable to identify an Md-2 protein sequence or ly96 gene in either lineage. This is consistent with ly96 arising after the divergence of cartilaginous and bony fishes (~470 million years ago), but before the divergence of bony- and ray-finned fishes (~435 million years ago). The sequence resources for cartilaginous and jawless fishes remain relatively sparse, however, so we cannot exclude an earlier origin for this gene.
We next set out to assign the orthology of the putative ly96 genes from amphibians and bony fishes. In addition to returning ly96 sequences, our BLAST searches above returned sequences of ly86, a paralog of ly96 that encodes the protein Md-1. To determine if the newly identified zebrafish gene was ly86 or ly96, we constructed an alignment of 294 Md-1 and Md-2 protein sequences sampled from amniotes, amphibians, and bony fishes and then used this to infer a maximum likelihood phylogeny (Fig 2A).
Fig 2. Phylogeny and synteny of the identified zebrafish protein support classifying it as an Md-2 (the ly96 gene).

A) Maximum likelihood phylogeny of Md-2 and Md-1 proteins. Wedges are collapsed clades of orthologs, with wedge height corresponding to the number of included taxa and wedge length indicating the longest branch length with the clade. Tree includes Md-2 sequences from mammals (83 taxa), sauropsids (53 taxa), amphibians (3 taxa), and fish (4 taxa), in addition to Md-1 sequences from mammals (84 taxa), sauropsids (58 taxa), amphibians (3 taxa), and fish (6 taxa). Support values are SH-supports calculated using an approximate likelihood ratio test. The taxa included in each clade are noted on the tree by silhouettes of mammals (mouse), sauropsids (chicken), amphibians (frog), and fish (zebrafish). B) Genomic organization of genes surrounding Md-2 in representative vertebrates. Arrows for genes represent the coding strand. Lengths are to scale. The genomes are aligned to the ly96 start site.
The putative amphibian and bony fish Md-2 sequences grouped with the tetrapod MD-2 sequences with strong support (SH = 0.99). The Md-1/Md-2 protein tree largely reproduced the species tree, with the exception of amphibians. On the Md-1 lineage, amphibians form a polytomy with fishes at the base of the tree; on the Md-2 lineage, they are placed inside the amniote clade with a relatively short internal branch. This is likely an artifact of the small number of amphibian sequences, as well as the rapid evolution of the genes along these lineages.
The protein sequences of Md-1 and, particularly, Md-2 are evolving rapidly. The total branch lengths between the last common ancestor of Md-2 to its human and zebrafish descendants are 2.00 and 2.44, respectively. Put another way, the average site in the Md-2 sequence has changed its amino acid ~2 times over the last 430 million years. Only 7 of 160 positions in MD-2 are universally conserved across the clade.
The simplest scenario consistent with this tree is that an ancestral gene arose and duplicated to form ly86 and ly96 sometime before the evolution of bony vertebrates. Both genes were preserved in most descendant lineages. Another, more complicated, explanation would have the putative fish ly96 gene be an ohnolog of the tetrapod ly96 gene. In this scenario, the putative fish ly96 arose by two gene duplications prior to the divergence of bony- and ray-finned fishes: one that led to ly86 and ly96, followed by a second duplication of ly96. Tetrapods then lost one duplicate of ly96 and bony fishes lost the other.
To distinguish these possibilities, we investigated the synteny of the putative ly96 gene, comparing the location of the gene in the D. rerio and X. laevis genomes to the location of ly96 in several tetrapods (Fig 2B). In five genomes sampled from across bony vertebrates—including X. laevis and D. rerio—the ly96 gene is located between tmem70 and jph1b. This provides strong evidence that these amphibian and fish genes are, in fact, orthologous to the amniote gene encoding Md-2.
This evolutionary scenario predicts we should find sequences for ly96 in early-branching tetrapods (such as the coelacanth and lungfish) and early-branching teleosts (such as the sturgeon and reedfish). We searched through genomes and transcriptomes of these, and other related species, for evidence of ly96. As a whole, this proved difficult. For example, in the coelacanth genome (LatCha1), tmem70 and jph1 were on different contigs (ENSLACG00000011765 and ENSLACG00000013907); therefore, ly96 may or may not be present. That said, by BLASTing directly against the short-read archive, we found RNA transcripts from the South American lungfish (Lepidosiren paradoxa) that yield MD-2 when reverse-BLASTed against the G. gallus proteome (SRR2895254.17689241.2 and SRR2895254.44296697.1). This thus provides another piece of evidence that the zebrafish ly96 is indeed an ortholog to human ly96, and that this evolved prior to the divergence of tetrapods and teleosts.
Finally, we also looked for a second copy of ly96 that may have arisen through the genome duplication event that occurred along the zebrafish lineage (53). We examined the genomic location of the jph1a paralog, but we were unable to identify an additional gene with any similarity to ly96. It appears that an inversion may have occurred in this region, complicating identification by synteny alone. This said, no additional transcripts were identified within the zebrafish transcriptome with similarity to the identified zebrafish ly96 sequence. This is consistent with a loss of the duplicate copy of this gene.
Zebrafish transcribe ly96 in innate immune cells
We next asked whether zebrafish express ly96. To do so, we used the recently released Zebrafish Single-Cell Transcriptome Atlas (44). This dataset consists of single-cell RNASeq transcriptomes for 44,102 individual cells extracted from 1, 2 and 5 dpf zebrafish. The gray points in Fig 3A and 3B shows the entire Atlas: each point is a cell, plotted such that cells with similar transcription profiles appear near one another. Cluster identity can be established by examining differentially expressed transcripts and using these marker genes to assess cell type expression in vivo (44); this provides a means to assess which cell types express ly96 simply by asking which clusters possess ly96 transcripts.
Fig 3. ly96 and tlr4 genes are expressed in immune cells.

Each point in these plots is an individual cell characterized by single-cell RNA-Seq. The distance between the cells corresponds to the relative difference in their transcriptional profiles(44). A) Yellow points indicate cells expressing ly96, gray points show all 44,102 cells in the data set. The two clusters in which ly96 is expressed (c71 and c212) are highlighted with black circles. B) Colored points indicate cells expressing tlr4bb (green), tlr4al (magenta), or tlr4ba (orange); gray points and circles are identical to panel A. C) Enlarged views of clusters c212 and c71, separated by gene of interest. This includes the genes shown in panels A and B, as well the macrophage marker, mpeg1.1 (light blue)(27, 28). The number in the bottom left of each table entry is the expression level of the gene within the cluster divided by its expression level in all other cells in the dataset. If there was no expression in cells outside the cluster, expression within the cluster was divided by the detection threshold (0.001) giving a minimum estimate for the enrichment. The background cells are now colored by the developmental stage from which the cell was isolated: 1 dpf (white), 2 dpf (light gray), or 5 dpf (dark gray). The dashed lines in shown on c71 are approximate divisions between the age-dependent sub-clusters of c71.
We found that ly96 is expressed in two clusters, denoted “c71” and “c212” (Fig 3A, yellow points). Both of these clusters are annotated in the Atlas as putative macrophage cells based on their transcription profiles (44). ly96 is highly enriched in these clusters relative to other clusters. This can be measured by taking the ratio of the average expression level of ly96 for the cells in the cluster relative to the average expression level of ly96 in all other cells. This ratio is 235 for cluster c212 and ≥173 for cluster c71. For comparison, the well-established macrophage marker mpeg1.1 (27, 28, 54) has ratios of 102 and 202, respectively, for these same clusters (Fig 3C).
We next investigated the expression of the tlr4bb, tlr4al, and tlr4ba genes. We found that tlr4bb and tlr4al had quite limited expression patterns (Fig 3B, green and magenta), while tlr4ba was expressed broadly (Fig 3B, orange). All three tlr4 genes were found in cluster c212, but only tlr4bb was found in cluster c71 (Fig 3C).
The Atlas also has the potential to reveal time-course information for the expression of these genes, as it contains cells isolated from fish at 1, 2 and 5 dpf. We therefore shaded the cells within clusters c71 and c212 by their developmental time point (Fig 3C). Cluster c212, where we observed overlapping expression for ly96 and all three tlr4 genes, consists entirely of cells isolated from 5 dpf zebrafish (Fig 3C). Cluster c71 has three discrete sub-clusters corresponding to the age of the fish from which the cell was extracted. We see no ly96 in the 1 dpf sub-cluster, a small amount in the 2 dpf sub-cluster, and the highest level in the 5 dpf sub-cluster (Fig 3C). Likewise, tlr4bb is expressed in the 5 dpf sub-cluster but no others. For comparison, the macrophage marker mpeg1.1 is found in all cells within c71 and c212, regardless of the age of the fish from which the cell was extracted.
These observations suggest that ly96 and all three tlr4 genes are expressed together in a subset of macrophage cells by 5 dpf (Fig 3C, c212). Samples of later time points would be necessary to establish if these genes are at their full expression level by 5 dpf, or if their expression level and cell-type specificity continues to change as the fish develop.
Zebrafish Tlr4ba/Md-2 can activate NF-κB in response to lipopolysaccharide
Given the low sequence similarity between the zebrafish Md-2 protein and its amniote orthologs, it was not clear that the zebrafish Md-2 would be capable of mediating the Tlr4 response to Md-2. We therefore turned to an ex vivo cell culture assay to assess the ability of the zebrafish Md-2 to partner with zebrafish Tlr4ba and Tlr4bb for LPS activation. In this assay, we co-transfected genes encoding complex components into HEK293T cells and then used luciferase to quantify NF-κB output in response to exogenously applied LPS (6).
We started by co-expressing zebrafish Md-2 and Tlr4ba or Tlr4bb and then measuring NF-κB activation in response to exogenously applied LPS. We saw no activation (Fig 4A). This result was unsurprising, as this experiment attempted to activate a Tlr4/Md-2 complex without Cd14—an important peripheral protein that brings LPS to Tlr4/Md-2 complexes in amniotes, dramatically increasing the NF-κB response (Fig 1)(55–59). We thus co-transfected tlr4ba or tlr4bb with zebrafish ly96 and human CD14. In this context, we observed potent activation of NF-κB in response to LPS for tlr4ba, but not tlr4bb (Fig 4A). To verify that the activation of Tlr4ba required Md-2, rather than merely CD14, we tested the activation of Tlr4ba and CD14 without transfecting ly96—this complex did not respond to LPS (Fig 4A). We then verified that the zebrafish Tlr4ba/Md-2 complex, complemented with human CD14, exhibited a dose-dependent response to LPS (Fig 4B). The concentration of LPS needed for activation of the zebrafish Tlr4ba/Md-2 complex was much higher than that needed for activation of the human proteins in these cells, but consistent with what has been observed for other species (60).
Fig 4. LPS activates the zebrafish Tlr4ba/Md-2 in a functional assay.

A) Activation of zebrafish Tlr4ba and Tlr4bb in the presence and absence of zebrafish Md-2 and human CD14. Points are the technical replicates from three biological replicates. Bold lines are the mean of the biological replicates. Error bars are a standard error on the mean of the biological replicates. B) Dose-dependence of LPS response by zebrafish Tlr4ba/Md-2 in the presence (gray) and absence (black) of human CD14. C) Zebrafish Tlr4ba/Md-2 complemented with Cd14 proteins from amniotes (Homo sapiens (H), Mus musculus (M), Monodelphis domestica (O), Gallus gallus(C)). D) Zebrafish Tlr4ba complemented with species-matched Md-2/Cd14 pairs taken from amniotes. Statistically significant differences (single-tailed Student’s t-test) are noted on each panel (* p < 0.05)
Our results support the hypothesis that zebrafish Tlr4ba/Md-2 can activate in response to LPS; however, this could only be done with the presence of a supporting mammalian protein (human CD14). To determine if this was an artifact of the human protein, we tested the LPS activation of Tlr4ba/Md-2 in the presence of human, mouse, opossum, and chicken Cd14. We found that all but the chicken Cd14 were able to support the activation of the complex (Fig 4C). Thus, the activity of the zebrafish Tlr4ba/Md-2 complex does not depend exclusively on human CD14 but can instead be supported by diverse Cd14 molecules.
Given the importance of Cd14 in this assay, we looked for evidence of a zebrafish cd14 gene; however, we were unable to locate such a gene. The inability to detect a cd14 in fish may be due to rapid evolution of this gene since the most recent common ancestor, or, alternatively, Cd14 may have arisen as a supporting molecule for LPS-recognition after the divergence of tetrapods. The requirement for Cd14 in these experiments could be a problem with the heterologous cell line (these experiments were done in human cells) or a missing alternate secondary cofactor (such as a fish LPS binding protein).
Finally, to see if zebrafish Tlr4ba behaved similarly to amniote Tlr4, we investigated whether Md-2 from other species could act in concert with zebrafish Tlr4ba. We co-transfected tlr4ba with human, mouse, or opossum ly96 genes. We saw complementation by both mouse and opossum Md-2 for LPS activation of zebrafish Tlr4ba (Fig 4D). This suggests that, despite lineage-specific coevolution leading to incompatibility between some inter-species pairs of Tlr4 and Md-2 (61), the core biochemical features that allow assembly of an LPS-sensitive Tlr4/Md-2 complex arose over 400 million years ago—before the tetrapod/teleost split.
Larval zebrafish ly96 mutants have a perturbed transcriptional response to LPS injection
We next probed for a physiological role for Md-2 in larval zebrafish. We used CRISPR-Cas9-based mutagenesis to establish three independent zebrafish lines with mutations in the first exon of the ly96 gene. The mutations were expected to induce a loss of function through removal of the start codon (ly96A/A) or through a frame shift and premature stop codon (ly96B/B and ly96C/C) (Fig S1). Using RT-PCR primers downstream of the targeted region, we demonstrated that ly96 mRNA is expressed in mutant larval zebrafish (Fig 5A).
Fig 5. ly96 mutations perturb the transcriptional response to LPS injection in larval zebrafish.
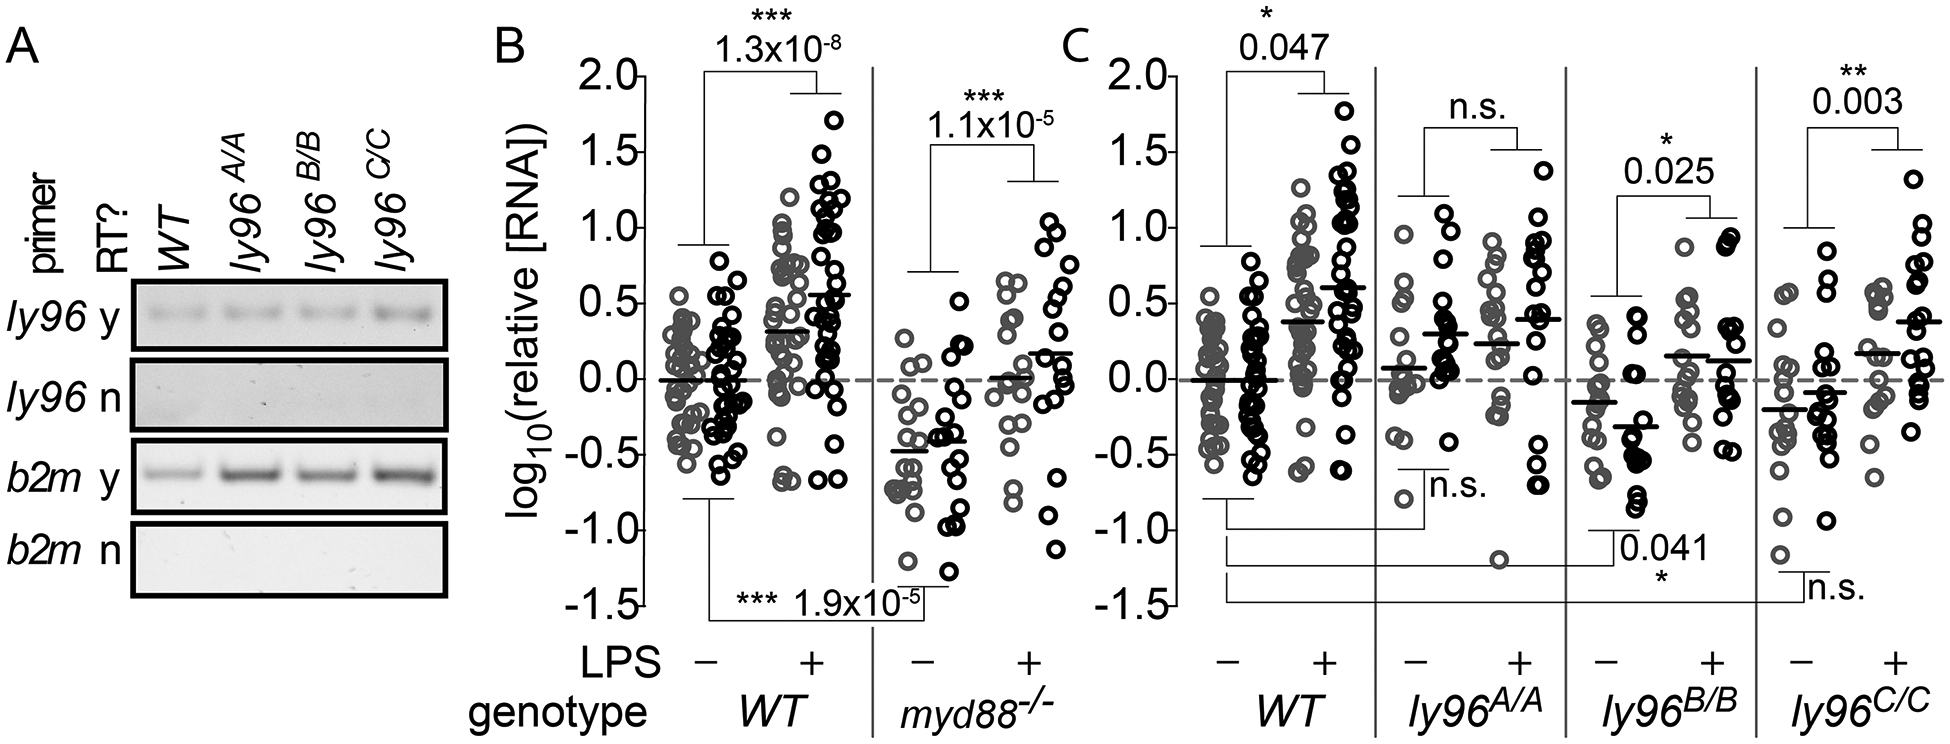
Panel A) mRNA transcript level for each ly96 mutant zebrafish. Rows show amplicons with different PCR primers (ly96 or b2m) with and without reverse transcriptase (RT). Columns show fish genotype. Panels B and C) Graphs show the relative RNA levels of mmp9 (gray) and il1b (black) for wildtype and mutant fish in the presence or absence of LPS treatment. RNA levels were normalized to the wildtype values within each panel. Points represent RNA pooled from five embryos (six pools for each treatment); solid black lines are the mean of the log10(RNA level) for each genotype/treatment. The p-values were calculated using the Tukey Honest Significant Difference method for the indicated genotype × treatment effect within the ANOVA model. Experiments in panel A were done using AB × TU fish; experiments in panel B were done using AB fish.
To determine if deletion of ly96 alters cytokine expression in response to LPS, we injected 6 dpf larval zebrafish with LPS and measured the RNA levels of the downstream genes mmp9 and il1b. As a control, we included myd88−/− fish, which should have perturbed innate immune transcriptional responses (22). Fig 5B shows the effect of the LPS treatment on the RNA levels of mmp9 (gray) and il1b (black) for WT and myd88(−/−) fish. The LPS treatment causes a roughly three-fold increase in transcript levels of both of these genes in wildtype fish. The myd88(−/−) knockout fish have depressed mmp9 and il1b RNA levels relative to wildtype in the absence of LPS treatment (p = 1.9×10⁻⁵), but still respond to LPS (p = 0.047).
We repeated these experiments for the ly96A/A, ly96B/B and ly96C/C fish (Fig 5C). We found that ly96A/A zebrafish had normal basal mmp9 and il1b RNA levels, but the RNA levels were unresponsive to LPS treatment. The ly96B/B mutant behaved similarly to the myd88(−/−) mutant, as it had significantly depressed basal mmp9 and il1b RNA levels, but it still responded to LPS. The mean basal levels of mmp9 and il1b were slightly lower for the ly96C/C mutant than for wildtype, but not significantly so. This mutant remained responsive to LPS.
Md-2 is not required for LPS-induced death in 5 dpf larval zebrafish
We next tested the role of ly96 in LPS-induced septic shock in larval 5 dpf zebrafish. We first treated 5 dpf larval WT zebrafish with LPS and followed their survival over time. None of the treated WT fish survived more than 48 hours; the median survival time was 30 hrs (Fig 6A). As a control, we also tested the LPS response for myd88−/− fish. As has been observed previously (22), these showed a modest but significant increase in survival (Fig 6A). This was consistent with LPS inducing a response that involves a myd88-dependent pathway.
Fig 6. ly96 mutations affect LPS survival only moderately in larval zebrafish.

A-D) Curves show survival of wildtype (black) and mutant (red) zebrafish in the presence of 0.6 mg/mL LPS (solid line) or mock treatment (dashed line). The genotype is indicated on each panel. The p-value was determined by comparing the matched survival curves by a log-rank Mantel-Cox test. The experiments shown in panels A-C were performed in parallel, while the experiments in panel D were performed at a later date with an LPS lot that showed lower potency, necessitating a longer treatment time. Panels A-D represent averages of one, five, five, and three experimental repeats, respectively.
We then tested the three ly96 mutant zebrafish lines for their susceptibility to LPS-induced septic shock. The results were mixed. Compared to matched WT controls, ly96A/A zebrafish survived for slightly longer (Fig 6B), ly96B/B zebrafish survived similarly (Fig 6C), and ly96C/C zebrafish survived shorter (Fig 6D). This is consistent with some pathway other than Tlr4/Md-2 being the primary route for LPS-induced death in larval zebrafish.
The zebrafish tlr4 paralog arose after the evolution of ly96
Finally, we revisited the idea that the evolutionary history of zebrafish tlr4 genes implies that they do not act as LPS-sensing molecules. Previous authors suggested that an ancestral TLR gene duplicated in the ancestor of bony vertebrates (~450 million years ago), and that the two paralogs were then differentially lost on the mammalian and bony fish lineages (21), respectively. This early divergence, before the evolution of ly96, may suggest very different functional roles for mammalian versus fish tlr4s.
We set out to better resolve when the zebrafish tlr4 paralogs arose relative to their mammalian counterparts, particularly with regard to the evolution of ly96. As with our analysis of Md-2, we started with a phylogenetic tree and then turned to synteny. For the phylogenetic tree, we constructed a multiple sequence alignment of bony vertebrate protein sequences containing 278 Tlr4 sequences and 189 Cd180 sequences as an outgroup. (Cd180 is the most closely related paralog to Tlr4)(62). In the resulting maximum likelihood tree, Tlr4 and Cd180 form distinct, well-supported clades (Fig 7A). Within the Tlr4 clade, zebrafish Tlr4ba, Tlr4bb, and Tlr4al are part of a monophyletic group with other Tlr4s from fishes. It appears that the duplication of the zebrafish tlr4-like genes occurred in the ancestor of Cypriniformes, as the duplicate is seen in species closely related to zebrafish but not in more distant species such as the catfish, pike, and gar. It also appears that tlr4al is a lineage-specific duplicate of tlr4ba, as these proteins group strongly with one another to the exclusion of other tlr4-like protein sequences within the Cypriniformes.
Fig 7. Zebrafish tlr4 paralogs evolved within the ray-finned fishes.

A) Maximum likelihood phylogeny for 467 Tlr4 and Cd180 protein sequences. SH supports are indicated on the tree. Wedges are clades, with the length indicating the maximum branch length from the ancestor of the clade. The taxonomic distribution and number of genes within each wedge are indicated on the plot. The clade containing human TLR4 is highlighted in purple; the three zebrafish tlr4 sequences are highlighted in orange. B-G) Hits for human (purple) and zebrafish (orange) gene sets on six representative chromosomes taken from five species. The species and chromosome are indicated at the top of each plot. The x-axis denotes position on the chromosome. Triangles indicate gene start positions. The green arrow indicates the location of a Tlr4 gene. The y-axis is a running average of the BLAST e-value for each gene set along the genome (see methods). The numbers on the plot indicate the number of human and zebrafish hits within the region shown. H,I) Each row shows the chromosome with the most BLAST hits from the human (panel H) or zebrafish (panel I) gene set. Columns indicate specific genes from the set, with names denoted below. A colored square indicates a gene found somewhere on the chromosome. A green square is a tlr4 gene. The species tree is shown on the left; the chromosome number is on the right. J) Schematic representation of a plausible scenario for the history of the tlr4 gene. Times are taken from Hughes et al. (63) and timetree.org (64).
We next set out to identify when the zebrafish tlr4 ohnologs evolved by investigating the genomic context for tlr4 genes in eleven genomes, each with a complete chromosome assembly. We selected a set of 22 genes flanking human tlr4 and a set of 22 genes flanking the three zebrafish tlr4 genes. Notably, there were no shared homologs between the sets, demonstrating the radical difference between the genomic contexts of human and zebrafish tlr4. We then used these sets of genes to BLAST each of the eleven genomes and calculated a running average for the BLAST e-values along each chromosome. This allowed us to assess the overall similarity of genomic regions to either the human or zebrafish tlr4 context. Fig 7B–G shows representative traces for six chromosomes taken from five species. We were able to distinguish two distinct contexts for tlr4 genes. In some organisms—human and frog, for example—tlr4 is surrounded by hits from the human gene set (Fig 7B and D). In other organisms—zebrafish and pike, for example—tlr4 is surrounded by hits from the zebrafish gene set (Fig 7C and E).
To place our results in their evolutionary context, we plotted our BLAST output against the phylogeny for our chosen species. For each species, we displayed the chromosome with the most hits from the human set (Fig 7H) and the chromosome with the most hits from the zebrafish set (Fig 7I). We made an exception for the pike, displaying the chromosome with the tlr4 gene (linkage group 5), not the chromosome with the most zebrafish hits (linkage group 6). We indicated whether a gene from the human or zebrafish set was seen somewhere on that chromosome by coloring the square corresponding to that gene.
Four species had tlr4 in a human-like context: human, chicken, frog and gar. None of these species—including the gar—had a duplicate copy of tlr4 in a zebrafish-like context. The human-like context of the gar gene is shown Fig 7F, while the lack of tlr4 in the most zebrafish-like region of the gar genome is shown in Fig 7G. The remainder of the ray-finned fishes had tlr4 in either a zebrafish-like context (catfish, zebrafish, and pike) or had no tlr4 gene at all (bonytongue, cod, and puffer).
The most parsimonious history consistent with the observed distribution across genomes is shown in Fig 7J. In this scenario, tlr4 arose in a genomic context similar to the one preserved in humans. This occurred after the divergence of bony and cartilaginous fishes (~475 million years ago), but before the divergence of ray-finned and lobe-finned fishes (~430 million years ago). The ancestral genomic context was preserved in tetrapods, including humans. It was also maintained in the ray-finned fishes for ~130 million years, as indicated by the location of the tlr4 gene in the gar genome. Then, sometime between 300 and 250 million years ago, the tlr4 gene was both duplicated into the genomic context observed in zebrafish, as well as lost from the ancestral context. Between 150 and 100 million years ago, a tandem duplication occurred within the Cypriniformes fishes, leading to the tandem copies of tlr4ba and tlr4bb observed in zebrafish, carp, and other Cypriniformes fishes. Finally, after the divergence of zebrafish and carp, a second tandem duplication of tlr4ba led to the formation of tlr4al.
This revised evolutionary history places the evolution of the zebrafish tlr4 paralogs much later than was previously hypothesized (21). Importantly, the duplication of TLR4 occurred after the evolution of Md-2, meaning that the formation of the Tlr4/Md-2 complex likely pre-dates the duplication event. Thus, the interaction with Md-2 and the ability to activate with LPS were an ancestral feature of zebrafish Tlr4 rather than something that could only be gained in parallel along the tetrapod and bony fish lineages.
DISCUSSION
Our observations led us to reevaluate the decade-old idea that Tlr4 does not participate in the LPS-induced inflammatory response in zebrafish. We have identified the zebrafish gene encoding the Tlr4 co-receptor Md-2 (ly96). The gene, like tlr4ba, tlr4bb, and tlr4al, is expressed in zebrafish cells that also express a collection of macrophage genes. In concert with zebrafish Tlr4ba, zebrafish Md-2 is capable of activating NF-κB signaling in an ex vivo functional assay. Zebrafish ly96 loss-of-function mutants have a perturbed transcriptional response to LPS challenge, suggesting that the Md-2 protein is involved in LPS sensing in vivo. Finally, a careful phylogenetic analysis suggests that the mammalian and zebrafish tlr4 genes are not as evolutionarily distinct as previously thought. While not direct orthologs, the zebrafish paralogs evolved well after ly96 and likely preserve an ancestral LPS recognition activity.
Our work demonstrates that, given the correct context, zebrafish Tlr4ba and Md-2 form a functional complex that recognizes LPS and activates NF-κB signaling. Further, the molecular basis for the interaction between the partners appears to have been conserved for the last 450 million years—zebrafish Tlr4ba is compatible with mouse and opossum Md-2 (Fig 4D). This is despite the fact that the orthologous proteins from each species have only ~20% identity at the amino acid sequence level. The simplest explanation for this observation is that the ability of Tlr4/Md-2 to activate in response to LPS is an ancestral feature of the protein complex.
This said, the overall significance of LPS signaling through Tlr4/Md-2 in zebrafish remains unclear. Both our cell culture functional assay and our studies of larval zebrafish with ly96 loss of function mutations gave mixed results. We will discuss each in turn.
LPS activation of Tlr4ba/Md-2 in human cells requires supporting molecules
In our functional assays, we had to add a mammalian Cd14 to activate NF-κB signaling through zebrafish Tlr4ba/Md-2 (Fig 4C). In amniotes, Cd14 delivers LPS directly to Md-2 (Fig 1). We could find no ortholog to Cd14 in the zebrafish genome.
One possibility is that the human cell line used for the functional assays is missing some critical component for the delivery of LPS and assembly of the active dimer. Tlr4, Md-2, and Cd14 are the necessary and sufficient set of amniote proteins that confer an LPS-dependent NF-κB response in HEK293T cells. It could be that some other non-homologous protein plays the role of Cd14 in zebrafish.
Another possibility is that LPS is not a zebrafish Tlr4ba/Md-2 agonist in vivo. We showed that we can activate the complex in a human cell line given an appropriate delivery molecule and a high enough LPS concentration. But, under physiological conditions, the Tlr4ba/Md-2 complex could respond to some other chemically similar ligand. This would not be surprising: changes in ligand specificity have been observed across Md-2 in the amniotes (65). There is also some evidence that zebrafish Tlr4ba may be antagonized by LPS in vivo (20). This would be compatible with another ligand activating the complex and LPS competing and activating at a lower level than can be achieved by the native ligand.
Finally, our observation that Tlr4ba activates NF-κB with both mouse and opossum Md-2 directly contrasts previous work that showed that the Tlr4ba/mouse Md-2 complex could not activate NF-κB (Fig 4C) (20, 21). The key difference between our experiments and those done previously is the sequence of Tlr4ba used. Previous investigators used a construct that was ~75 amino acids shorter than tetrapod Tlr4s. This construct is missing both the signal peptide required to target Tlr4ba to the cell surface and a region of the protein that is likely critical for Md-2 binding (Fig S3). In contrast, we used a full-length ORF (ENSDART00000044697.6, GRCz10). The difference in our constructs arises because the previous analysis relied on cDNA that, apparently, captured an alternate splice variant of tlr4ba.
Multiple pathways contribute to LPS-induced death in larval zebrafish
Larval zebrafish ly96 loss of function mutants did not exhibit appreciably altered death rates upon exposure to LPS compared to WT (Fig 6B–D). This is consistent with a previous morpholino study that knocked down tlr4ba and observed no change in sensitivity to LPS (20). This contrasts with mice, however, where knockout of Ly96 is protective against endotoxic shock (4) and disruption or knockout of Tlr4 leads to hypo-responsiveness to LPS (1, 66). We also found mixed results for cytokine expression in the zebrafish ly96 mutants following LPS challenge (Fig 5B,C): in ly96A/A larvae LPS-induced expression of inflammatory cytokines is ablated, in ly96B/B larvae we observe a response similar to the myd88−/− background, and in ly96C/C larvae the response is similar to wildtype.
We cannot rule out the possibility that these mild LPS responses are due to an experimental artifact. Another possible explanation for the mild LPS response is that zebrafish may have retained a second copy of the ly96 gene from the teleost genome duplication that compensates for the loss of function of the targeted copy. We were unable find any evidence of such a gene; however, the challenge of finding the original ly96 gene means that we cannot rule this out. A further possibility is that the mutants that we generated may not represent a complete loss of function. For example, use of a potential alternative start codon 17 amino acids downstream of the normal start codon could produce a truncated protein (ly96A/A). Although this would be missing N-terminal amino acids that are known to be critical for Md-2 function in other systems (Fig S1), these amino acids may not be necessary in zebrafish.
It is also important to note that we tested a single early developmental time point (5 dpf). As we and others have shown, the expression patterns for tlr4 genes in zebrafish change during larval development (44, 67, 68). It could be that Tlr4ba/Md-2, while expressed in larvae (Fig 3C), is not yet a large player in LPS sensing. Our expression analysis revealed that in larval zebrafish, ly96 is much more restricted in its expression pattern than the corresponding mammalian genes (69). There may, in fact, be specific subtypes of macrophages that express ly96 and tlr4s—and are defective in LPS sensing in the ly96 mutants—but remain invisible at the level of LPS-induced death and overall cytokine expression. Higher-resolution studies of LPS-induced inflammation at multiple developmental time points will be required to sort this out.
Given the quantities of LPS needed for in vivo studies, the use of ultrapure LPS was not possible for in vivo experiments. There are a few limitations associated with the use of non-ultrapure LPS – most notably, there has been concern that LPS-induced toxicity may be due in part to peptidoglycan (PGN) contamination in standard preparations of LPS. To address this concern, we have previously directly assessed the role of PGN in LPS-induced toxicity in zebrafish and shown that PGN does not induce toxicity in zebrafish within 24 hours (22). It is possible however, that contaminants in the preparation of LPS used could explain the inability to fully ablate LPS-induced toxicity and expression of inflammatory cytokines in response to LPS. In future studies, the use of different LPS preparations and testing for signaling with LPS from different bacterial species may further clarify the role of LPS signaling in zebrafish.
Another difficulty would be if other non-Toll-like pathway(s) are involved in LPS signaling zebrafish. If true, even if the Tlr4ba/Md-2 complex contributes to the LPS-induced inflammatory response, removing it might have a relatively small effect on cytokine production or LPS-induced toxicity. We see evidence for such a pathway, as addition of LPS dramatically increased death rate even in a myd88−/− background (Fig 6A). One possibility is that this occurs by intracellular sensing of LPS via caspases and inflammasomes (70). Various studies have shown inflammasome signaling to be widespread in zebrafish larvae (71) and Il-1r to be required to prevent cell death in response to infection in multiple cells (72). Intracellular sensing may be much more important in fish than mammals: zebrafish have 385 of these putative intracellular sensors whereas humans have 22 (73).
Snapshot of the evolutionary history of this complex
The presence of Md-2 in zebrafish indicates that both Tlr4 and Md-2 existed together in the last common ancestor of bony vertebrates. Because descendants along both the tetrapod and ray-finned fish lineages activate with LPS, the ability to respond to LPS is likely an ancestral function that has been conserved for 435 million years.
That said, these proteins have evolved significantly since this shared ancestor. Along the tetrapod lineage, a supporting collection of proteins evolved. Cd14 arose through a duplication within the Toll-like receptor family and is now an essential component of the Tlr4/Md-2 complex, delivering LPS to Md-2 in a coordinated fashion (56, 57). Tetrapods also acquired Lipid Binding Protein (LBP), improving LPS delivery (55, 74). Amniotes then further adjusted the Tlr4/Md-2 pro-inflammatory response through addition of amniote-specific Damage-Associated Molecular Pattern (DAMP) molecules such as S100A9 (61), which amplify LPS-induced inflammation (75). All the while, mutations to Md-2 changed its specificity for LPS and its chemical analogs (76). For example, humans acquired unique lipid IVa antagonism sometime after the divergence of humans and mice (77, 78).
The changes that occurred along the ray-finned fish lineages are not yet clear. Did they acquire supporting LPS delivery molecules analogous to Cd14? Has the specificity of Md-2 fluctuated in ray-finned fishes as it has along the tetrapod lineage? Further work is needed to answer these questions.
We hypothesize, however, that ray-finned fishes maintain an ancestral, low-sensitivity Tlr4/Md-2 LPS-sensing complex. Fish have previously been shown to be relatively resistant to septic shock (79, 80), with high concentrations of LPS needed to activate teleost leukocytes (25, 75–77). This parallels the observation that early diverging tetrapods, such as amphibians, also require high doses of LPS to trigger an inflammatory response (84). This could be explained if ray-finned fishes do not have specialized machinery to deliver LPS to the complex, but instead use Tlr4/Md-2 as a simple LPS sensor. Other observations consistent with a relatively primitive Tlr4/Md-2 LPS response in zebrafish are the fact that Tlr4 was lost independently along multiple fish lineages (20, 21, 73) (Fig 7J), as well as the existence of parallel LPS sensing pathways in zebrafish (71). If the Tlr4/Md-2 complex is peripheral to the LPS response in ray-finned fishes, it could be lost with minimal fitness consequences. In contrast, Tlr4/Md-2 became progressively more central to the LPS response along the mammalian lineage—and as a result has been highly conserved.
Much more work is needed to fully understand the role of LPS signaling in zebrafish. Our work gives the first evidence for the presence of Md-2 outside of amniotes. Knowledge of this essential co-factor for LPS signaling through Tlr4 opens the door for future studies of LPS sensing through Tlr4 in fish.
Supplementary Material
Fig S1: Predicted zebrafish ly96 mutant gene products
Fig S2: Alignment of Md-2 proteins from amphibians and various fishes
Fig S3: Comparison of zebrafish Tlr4a sequence used in this paper versus previous work
KEY POINTS.
We found a gene for Md-2, a key protein that senses bacterial products, in zebrafish.
Zebrafish Md-2 has functional and physiological similarities to amniote MD-2.
LPS sensing in zebrafish may be more similar to humans than previously thought.
ACKNOWLEDGMENTS
We thank Kristi Hamilton and Lila Kaye for assistance with zebrafish LPS survival assays, and Rose Sockol and the University of Oregon Aquatic Animal Care Services staff for fish husbandry. We thank Prof. Carol Kim for sharing the tlr4bb plasmid.
Funding sources:
This research was funded by grants from the American Heart Association (AHA- 15BGIA22830013, MJH) and the National Institutes of Health (NIH-T32GM007413, ANL, NIH-F32DK107318, MNH, P50GM09891, KG, NIH-R24OD026591, ACM). MJH is a Pew Scholar in the Biomedical Sciences, supported by The Pew Charitable Trusts. The funders had no role in study design, data collection and analysis, decision to publish, or preparation of the manuscript.
REFERENCES
- 1.Poltorak A 1998. Defective LPS Signaling in C3H/HeJ and C57BL/10ScCr Mice: Mutations in Tlr4 Gene. Science (80-.). 282: 2085–2088. [DOI] [PubMed] [Google Scholar]
- 2.Schletter J, Heine H, Ulmer AJ, and Rietschel ET. 1995. Molecular mechanisms of endotoxin activity. Arch. Microbiol 164: 383–389. [DOI] [PubMed] [Google Scholar]
- 3.Ulevitch RJ, and Tobias PS. 1995. Receptor-Dependent Mechanisms of Cell Stimulation by Bacterial Endotoxin. Annu. Rev. Immunol 13: 437–457. [DOI] [PubMed] [Google Scholar]
- 4.Nagai Y, Akashi S, Nagafuku M, Ogata M, Iwakura Y, Akira S, Kitamura T, Kosugi A, Kimoto M, and Miyake K. 2002. Essential role of MD-2 in LPS responsiveness and TLR4 distribution. Nat. Immunol 3: 667. [DOI] [PubMed] [Google Scholar]
- 5.Park BS, and Lee J-O. 2013. Recognition of lipopolysaccharide pattern by TLR4 complexes. Exp. Mol. Med 45: e66. [DOI] [PMC free article] [PubMed] [Google Scholar]
- 6.Chow JC, Young DW, Golenbock DT, Christ WJ, and Gusovsky F. 1999. Toll-like receptor-4 mediates lipopolysaccharide-induced signal transduction. J. Biol. Chem 274: 10689–92. [DOI] [PubMed] [Google Scholar]
- 7.Yiu JHC, Dorweiler B, and Woo CW. 2017. Interaction between gut microbiota and toll-like receptor: from immunity to metabolism. J. Mol. Med. (Berl) 95: 13–20. [DOI] [PMC free article] [PubMed] [Google Scholar]
- 8.Fan J, and Malik AB. 2003. Toll-like receptor-4 (TLR4) signaling augments chemokine-induced neutrophil migration by modulating cell surface expression of chemokine receptors. Nat. Med 9: 315–321. [DOI] [PubMed] [Google Scholar]
- 9.Murad S 2014. Toll-Like Receptor 4 in Inflammation and Angiogenesis: A Double-Edged Sword. Front. Immunol 5: 313. [DOI] [PMC free article] [PubMed] [Google Scholar]
- 10.Leon CG, Tory R, Jia J, Sivak O, and Wasan KM. 2008. Discovery and development of toll-like receptor 4 (TLR4) antagonists: a new paradigm for treating sepsis and other diseases. Pharm. Res 25: 1751–61. [DOI] [PMC free article] [PubMed] [Google Scholar]
- 11.Kuzmich NN, V Sivak K, Chubarev VN, Porozov YB, Savateeva-Lyubimova TN, and Peri F. 2017. TLR4 Signaling Pathway Modulators as Potential Therapeutics in Inflammation and Sepsis. Vaccines 5. [DOI] [PMC free article] [PubMed] [Google Scholar]
- 12.Zettel K, Korff S, Zamora R, Morelli AE, Darwiche S, Loughran PA, Elson G, Shang L, Salgado-Pires S, Scott MJ, Vodovotz Y, and Billiar TR. 2017. Toll-Like Receptor 4 on both Myeloid Cells and Dendritic Cells Is Required for Systemic Inflammation and Organ Damage after Hemorrhagic Shock with Tissue Trauma in Mice. Front. Immunol 8: 1672. [DOI] [PMC free article] [PubMed] [Google Scholar]
- 13.Gruffaz M, Vasan K, Tan B, Ramos da Silva S, and Gao S-J. 2017. TLR4-Mediated Inflammation Promotes KSHV-Induced Cellular Transformation and Tumorigenesis by Activating the STAT3 Pathway. Cancer Res. 77: 7094–7108. [DOI] [PMC free article] [PubMed] [Google Scholar]
- 14.Koliaraki V, Chalkidi N, Henriques A, Tzaferis C, Polykratis A, Waisman A, Muller W, Hackam DJ, Pasparakis M, and Kollias G. 2019. Innate Sensing through Mesenchymal TLR4/MyD88 Signals Promotes Spontaneous Intestinal Tumorigenesis. Cell Rep. 26: 536–545.e4. [DOI] [PMC free article] [PubMed] [Google Scholar]
- 15.Yoder JA, Nielsen ME, Amemiya CT, and Litman GW. 2002. Zebrafish as an immunological model system. Microbes Infect. 4: 1469–1478. [DOI] [PubMed] [Google Scholar]
- 16.Renshaw SA, and Trede NS. 2012. A model 450 million years in the making: zebrafish and vertebrate immunity. Dis. Model. Mech 5: 38–47. [DOI] [PMC free article] [PubMed] [Google Scholar]
- 17.Hall C, Flores MV, Chien A, Davidson A, Crosier K, and Crosier P. 2009. Transgenic zebrafish reporter lines reveal conserved Toll-like receptor signaling potential in embryonic myeloid leukocytes and adult immune cell lineages. J. Leukoc. Biol 85: 751–765. [DOI] [PubMed] [Google Scholar]
- 18.Burns AR, and Guillemin K. 2017. The scales of the zebrafish: host-microbiota interactions from proteins to populations. Curr. Opin. Microbiol 38: 137–141. [DOI] [PMC free article] [PubMed] [Google Scholar]
- 19.Park BS, Song DH, Kim HM, Choi B-S, Lee H, and Lee J-O. 2009. The structural basis of lipopolysaccharide recognition by the TLR4–MD-2 complex. Nature 458: 1191–1195. [DOI] [PubMed] [Google Scholar]
- 20.Sepulcre MP, Alcaraz-Pérez F, López-Muñoz A, Roca FJ, Meseguer J, Cayuela ML, and Mulero V. 2009. Evolution of lipopolysaccharide (LPS) recognition and signaling: fish TLR4 does not recognize LPS and negatively regulates NF-kappaB activation. J. Immunol 182: 1836–45. [DOI] [PubMed] [Google Scholar]
- 21.Sullivan C, Charette J, Catchen J, Lage CR, Giasson G, Postlethwait JH, Millard PJ, and Kim CH. 2009. The Gene History of Zebrafish tlr4a and tlr4b Is Predictive of Their Divergent Functions. J. Immunol 183: 5896–5908. [DOI] [PMC free article] [PubMed] [Google Scholar]
- 22.Bates JM, Akerlund J, Mittge E, and Guillemin K. 2007. Intestinal Alkaline Phosphatase Detoxifies Lipopolysaccharide and Prevents Inflammation in Zebrafish in Response to the Gut Microbiota. Cell Host Microbe 2: 371–382. [DOI] [PMC free article] [PubMed] [Google Scholar]
- 23.Van Der Vaart M, Van Soest JJ, Spaink HP, and Meijer AH. 2013. Functional analysis of a zebrafish myd88 mutant identifies key transcriptional components of the innate immune system. DMM Dis. Model. Mech 6: 841–854. [DOI] [PMC free article] [PubMed] [Google Scholar]
- 24.Van Der Vaart M, Korbee CJ, Lamers GEM, Tengeler AC, Hosseini R, Haks MC, Ottenhoff THM, Spaink HP, and Meijer AH. 2014. The DNA damage-regulated autophagy modulator DRAM1 links mycobacterial recognition via TLP-MYD88 to authophagic defense. Cell Host Microbe 15: 753–767. [DOI] [PubMed] [Google Scholar]
- 25.Forn-Cuní G, Varela M, Pereiro P, Novoa B, and Figueras A. 2017. Conserved gene regulation during acute inflammation between zebrafish and mammals. Sci. Rep 7: 41905. [DOI] [PMC free article] [PubMed] [Google Scholar]
- 26.Sepulcre MP, López-Castejón G, Meseguer J, and Mulero V. 2007. The activation of gilthead seabream professional phagocytes by different PAMPs underlines the behavioural diversity of the main innate immune cells of bony fish. Mol. Immunol 44: 2009–2016. [DOI] [PubMed] [Google Scholar]
- 27.Ellett F, Pase L, Hayman JW, Andrianopoulos A, and Lieschke GJ. 2011. mpeg1 promoter transgenes direct macrophage-lineage expression in zebrafish. Blood 117: e49–e56. [DOI] [PMC free article] [PubMed] [Google Scholar]
- 28.Ferrero G, Gomez E, Lyer S, Rovira M, Miserocchi M, Langenau DM, Bertrand JY, and Wittamer V. 2020. The macrophage‐expressed gene (mpeg) 1 identifies a subpopulation of B cells in the adult zebrafish. J. Leukoc. Biol 107: 431–443. [DOI] [PMC free article] [PubMed] [Google Scholar]
- 29.Kimoto M, Nagasawa K, and Miyake K. 2003. Role of TLR4/MD-2 and RP105/MD-1 in Innate Recognition of Lipopolysaccharide. Scand. J. Infect. Dis 35: 568–572. [DOI] [PubMed] [Google Scholar]
- 30.Qiao L, Yang W, Fu J, and Song Z. 2013. Transcriptome Profile of the Green Odorous Frog (Odorrana margaretae). PLoS One 8: e75211. [DOI] [PMC free article] [PubMed] [Google Scholar]
- 31.Matsunami M, Kitano J, Kishida O, Michimae H, Miura T, and Nishimura K. 2015. Transcriptome analysis of predator- and prey-induced phenotypic plasticity in the Hokkaido salamander (Hynobius retardatus). Mol. Ecol 24: 3064–3076. [DOI] [PubMed] [Google Scholar]
- 32.Nourisson C, Carneiro M, Vallinoto M, and Sequeira F. 2014. De novo transcriptome assembly and polymorphism detection in ecologically important widely distributed Neotropical toads from the Rhinella marina species complex (Anura: Bufonidade. Genomic Resour. Notes Accept. 1 August 2014–30 Sept 2014. [Google Scholar]
- 33.Genomic Resources Development Consortium, Arthofer W, Banbury BL, Carneiro M, Cicconardi F, Duda TF, Harris RB, Kang DS, Leaché AD, Nolte V, Nourisson C, Palmieri N, Schlick-Steiner BC, Schlötterer C, Sequeira F, Sim C, Steiner FM, Vallinoto M, and Weese DA. 2015. Genomic Resources Notes Accepted 1 August 2014–30 September 2014. Mol. Ecol. Resour 15: 228–229. [DOI] [PubMed] [Google Scholar]
- 34.Liu Y, Schmidt B, and Maskell DL. 2010. MSAProbs: multiple sequence alignment based on pair hidden Markov models and partition function posterior probabilities. Bioinformatics 26: 1958–1964. [DOI] [PubMed] [Google Scholar]
- 35.Tamura K, Stecher G, Peterson D, Filipski A, and Kumar S. 2013. MEGA6: Molecular Evolutionary Genetics Analysis Version 6.0. Mol. Biol. Evol 30: 2725–2729. [DOI] [PMC free article] [PubMed] [Google Scholar]
- 36.Guindon S, Dufayard JF, Lefort V, Anisimova M, Hordijk W, and Gascuel O. 2010. New Algorithms and Methods to Estimate Maximum-Likelihood Phylogenies: Assessing the Performance of PhyML 3.0. Syst. Biol 59: 307–321. [DOI] [PubMed] [Google Scholar]
- 37.Le SQ, and Gascuel O. 2010. Accounting for Solvent Accessibility and Secondary Structure in Protein Phylogenetics Is Clearly Beneficial. Syst. Biol 59: 277–287. [DOI] [PubMed] [Google Scholar]
- 38.Le SQ, and Gascuel O. 2008. An Improved General Amino Acid Replacement Matrix. Mol. Biol. Evol 25: 1307–1320. [DOI] [PubMed] [Google Scholar]
- 39.Hordijk W, and Gascuel O. 2005. Improving the efficiency of SPR moves in phylogenetic tree search methods based on maximum likelihood. Bioinformatics 21: 4338–4347. [DOI] [PubMed] [Google Scholar]
- 40.Anisimova M, and Gascuel O. 2006. Approximate Likelihood-Ratio Test for Branches: A Fast, Accurate, and Powerful Alternative. Syst. Biol 55: 539–552. [DOI] [PubMed] [Google Scholar]
- 41.Akaike H 1998. Information Theory and an Extension of the Maximum Likelihood Principle. In Springer; New York: 199–213. [Google Scholar]
- 42.Waterhouse AM, Procter JB, Martin DMA, Clamp M, and Barton GJ. 2009. Jalview Version 2-A multiple sequence alignment editor and analysis workbench. Bioinformatics 25: 1189–1191. [DOI] [PMC free article] [PubMed] [Google Scholar]
- 43.Herrero J, Muffato M, Beal K, Fitzgerald S, Gordon L, Pignatelli M, Vilella AJ, Searle SMJ, Amode R, Brent S, Spooner W, Kulesha E, Yates A, and Flicek P. 2016. Ensembl comparative genomics resources. Database 2016: bav096. [DOI] [PMC free article] [PubMed] [Google Scholar]
- 44.Farnsworth DR, Saunders LM, and Miller AC. 2020. A single-cell transcriptome atlas for zebrafish development. Dev. Biol 459: 100–108. [DOI] [PMC free article] [PubMed] [Google Scholar]
- 45.Zheng GXY, Terry JM, Belgrader P, Ryvkin P, Bent ZW, Wilson R, Ziraldo SB, Wheeler TD, McDermott GP, Zhu J, Gregory MT, Shuga J, Montesclaros L, Underwood JG, Masquelier DA, Nishimura SY, Schnall-Levin M, Wyatt PW, Hindson CM, Bharadwaj R, Wong A, Ness KD, Beppu LW, Deeg HJ, McFarland C, Loeb KR, Valente WJ, Ericson NG, Stevens EA, Radich JP, Mikkelsen TS, Hindson BJ, and Bielas JH. 2017. Massively parallel digital transcriptional profiling of single cells. Nat. Commun 8: 14049. [DOI] [PMC free article] [PubMed] [Google Scholar]
- 46.Satija R, Farrell JA, Gennert D, Schier AF, and Regev A. 2015. Spatial reconstruction of single-cell gene expression data. Nat. Biotechnol 33: 495–502. [DOI] [PMC free article] [PubMed] [Google Scholar]
- 47.R Core Team. 2017. R: A Language and Environment for Statistical Computing.. [Google Scholar]
- 48.Jao L-E, Wente SR, and Chen W. 2013. Efficient multiplex biallelic zebrafish genome editing using a CRISPR nuclease system. Proc. Natl. Acad. Sci. U. S. A 110: 13904–9. [DOI] [PMC free article] [PubMed] [Google Scholar]
- 49.Konantz J, and Antos CL. 2014. Reverse genetic morpholino approach using cardiac ventricular injection to transfect multiple difficult-to-target tissues in the zebrafish larva. J. Vis. Exp. [DOI] [PMC free article] [PubMed] [Google Scholar]
- 50.Vanhauwaert S, Van Peer G, Rihani A, Janssens E, Rondou P, Lefever S, De Paepe A, Coucke PJ, Speleman F, Vandesompele J, and Willaert A. 2014. Expressed repeat elements improve RT-qPCR normalization across a wide range of zebrafish gene expression studies. PLoS One 9. [DOI] [PMC free article] [PubMed] [Google Scholar]
- 51.Van Soest JJ, Stockhammer OW, Ordas A, Bloemberg GV, Spaink HP, and Meijer AH. 2011. Comparison of static immersion and intravenous injection systems for exposure of zebrafish embryos to the natural pathogen Edwardsiella tarda. BMC Immunol. 12. [DOI] [PMC free article] [PubMed] [Google Scholar]
- 52.Sun Y, Huang Y, Li X, Baldwin CC, Zhou Z, Yan Z, Crandall KA, Zhang Y, Zhao X, Wang M, Wong A, Fang C, Zhang X, Huang H, Lopez JV, Kilfoyle K, Zhang Y, Ortí G, Venkatesh B, and Shi Q. 2016. Fish-T1K (Transcriptomes of 1,000 Fishes) Project: Large-scale transcriptome data for fish evolution studies. Gigascience 5. [DOI] [PMC free article] [PubMed] [Google Scholar]
- 53.Woods IG, Wilson C, Friedlander B, Chang P, Reyes DK, Nix R, Kelly PD, Chu F, Postlethwait JH, and Talbot WS. 2005. The zebrafish gene map defines ancestral vertebrate chromosomes. Genome Res. 15: 1307–14. [DOI] [PMC free article] [PubMed] [Google Scholar]
- 54.Bernut A, Herrmann J-L, Kissa K, Dubremetz J-F, Gaillard J-L, Lutfalla G, and Kremer L. 2014. Mycobacterium abscessus cording prevents phagocytosis and promotes abscess formation. Proc. Natl. Acad. Sci 111: E943–E952. [DOI] [PMC free article] [PubMed] [Google Scholar]
- 55.Heumann D, Lauener R, and Ryffel B. 2003. The dual role of LBP and CD14 in response to Gram-negative bacteria or Gram-negative compounds. J. Endotoxin Res 9: 381–384. [DOI] [PubMed] [Google Scholar]
- 56.Triantafilou M, and Triantafilou K. 2002. Lipopolysaccharide recognition: CD14, TLRs and the LPS-activation cluster. Trends Immunol. 23: 301–304. [DOI] [PubMed] [Google Scholar]
- 57.Kim SJ, and Kim HM. 2017. Dynamic lipopolysaccharide transfer cascade to TLR4/MD2 complex via LBP and CD14. BMB Rep. 50: 55–57. [DOI] [PMC free article] [PubMed] [Google Scholar]
- 58.Shapiro RA, Cunningham MD, Ratcliffe K, Seachord C, Blake J, Bajorath J, Aruffo A, and Darveau RP. 1997. Identification of CD14 residues involved in specific lipopolysaccharide recognition. Infect. Immun 65: 293–7. [DOI] [PMC free article] [PubMed] [Google Scholar]
- 59.Juan TS-C, Hailman E, Kelley MJ, Wright SD, and Lichenstein HS. 1995. Identification of a Domain in Soluble CD14 Essential for Lipopolysaccharide (LPS) Signaling but Not LPS Binding. J. Biol. Chem 270: 17237–17242. [DOI] [PubMed] [Google Scholar]
- 60.Zhou Y, Liang Q, Li W, Gu Y, Liao X, Fang W, and Li X. 2016. Characterization and functional analysis of toll-like receptor 4 in Chinese soft-shelled turtle Pelodiscus sinensis. Dev. Comp. Immunol 63: 128–135. [DOI] [PubMed] [Google Scholar]
- 61.Loes AN, Bridgham JT, and Harms MJ. 2018. Coevolution of the toll-like receptor 4 complex with calgranulins and lipopolysaccharide. Front. Immunol 9. [DOI] [PMC free article] [PubMed] [Google Scholar]
- 62.Madan R, Golenbock D, Divanovic S, Trompette A, Atabani SF, Golenbock DT, Visintin A, Finberg RW, Tarakhovsky A, Vogel SN, Belkaid Y, Kurt-Jones EA, and Karp CL. 2005. Negative Regulation of TLR4 Signaling by RP105.. [DOI] [PMC free article] [PubMed] [Google Scholar]
- 63.Hughes LC, Ortí G, Huang Y, Sun Y, Baldwin CC, Thompson AW, Arcila D, Betancur-R R., Li C, Becker L, Bellora N, Zhao X, Li X, Wang M, Fang C, Xie B, Zhou Z, Huang H, Chen S, Venkatesh B, and Shi Q. 2018. Comprehensive phylogeny of ray-finned fishes (Actinopterygii) based on transcriptomic and genomic data. Proc. Natl. Acad. Sci 115: 6249–6254. [DOI] [PMC free article] [PubMed] [Google Scholar]
- 64.Hedges SB, Dudley J, and Kumar S. 2006. TimeTree: a public knowledge-base of divergence times among organisms. Bioinformatics 22: 2971–2972. [DOI] [PubMed] [Google Scholar]
- 65.Muroi M, Ohnishi T, and Tanamoto K-I. 2002. MD-2, a Novel Accessory Molecule, Is Involved in Species-Specific Actions of Salmonella Lipid A. Infect. Immun 70: 3546–3550. [DOI] [PMC free article] [PubMed] [Google Scholar]
- 66.Hoshino K, Takeuchi O, Kawai T, Sanjo H, Ogawa T, Takeda Y, Takeda K, and Akira S. 1999. Cutting edge: Toll-like receptor 4 (TLR4)-deficient mice are hyporesponsive to lipopolysaccharide: evidence for TLR4 as the Lps gene product. J. Immunol 162: 3749–52. [PubMed] [Google Scholar]
- 67.Meijer AH, Gabby Krens S, Medina Rodriguez IA, He S, Bitter W, Ewa Snaar-Jagalska B, and Spaink HP. 2004. Expression analysis of the Toll-like receptor and TIR domain adaptor families of zebrafish. Mol. Immunol 40: 773–783. [DOI] [PubMed] [Google Scholar]
- 68.Jault C, Pichon L, and Chluba J. 2004. Toll-like receptor gene family and TIR-domain adapters in Danio rerio. Mol. Immunol 40: 759–771. [DOI] [PubMed] [Google Scholar]
- 69.Vaure C, and Liu Y. 2014. A Comparative Review of Toll-Like Receptor 4 Expression and Functionality in Different Animal Species. Front. Immunol 5: 316. [DOI] [PMC free article] [PubMed] [Google Scholar]
- 70.Yang D, Zheng X, Chen S, Wang Z, Xu W, Tan J, Hu T, Hou M, Wang W, Gu Z, Wang Q, Zhang R, Zhang Y, and Liu Q. 2018. Sensing of cytosolic LPS through caspy2 pyrin domain mediates noncanonical inflammasome activation in zebrafish. Nat. Commun 9: 3052. [DOI] [PMC free article] [PubMed] [Google Scholar]
- 71.Forn-Cuní G, Meijer AH, and Varela M. 2019. Zebrafish in Inflammasome Research. Cells 8: 901. [DOI] [PMC free article] [PubMed] [Google Scholar]
- 72.Mazon-Moya MJ, Willis AR, Torraca V, Boucontet L, Shenoy AR, Colucci-Guyon E, and Mostowy S. 2017. Septins restrict inflammation and protect zebrafish larvae from Shigella infection. PLOS Pathog. 13: e1006467. [DOI] [PMC free article] [PubMed] [Google Scholar]
- 73.Jones JDG, Vance RE, and Dangl JL. 2016. Intracellular innate immune surveillance devices in plants and animals. Science (80-.). 354: aaf6395–aaf6395. [DOI] [PubMed] [Google Scholar]
- 74.Bernheiden M, Heinrich J-M, Minigo G, Schutt C, Stelter F, Freeman M, Golenbock D, and Jack RS. 2001. LBP, CD14, TLR4 and the murine innate immune response to a peritoneal Salmonella infection. J. Endotoxin Res 7: 447–450. [PubMed] [Google Scholar]
- 75.Ehrchen JM, Sunderkotter C, Foell D, Vogl T, and Roth J. 2009. The endogenous Toll-like receptor 4 agonist S100A8/S100A9 (calprotectin) as innate amplifier of infection, autoimmunity, and cancer. J. Leukoc. Biol 86: 557–566. [DOI] [PubMed] [Google Scholar]
- 76.Ohto U, Fukase K, Miyake K, and Shimizu T. 2012. Structural basis of species-specific endotoxin sensing by innate immune receptor TLR4/MD-2. Proc. Natl. Acad. Sci 109: 7421–7426. [DOI] [PMC free article] [PubMed] [Google Scholar]
- 77.Walsh C, Gangloff M, Monie T, Smyth T, Wei B, McKinley TJ, Maskell D, Gay N, and Bryant C. 2008. Elucidation of the MD-2/TLR4 Interface Required for Signaling by Lipid IVa. J. Immunol 181: 1245–1254. [DOI] [PMC free article] [PubMed] [Google Scholar]
- 78.Anderson JA, Loes AN, Waddell GL, and Harms MJ. 2019. Tracing the evolution of novel features of human Toll‐like receptor 4. Protein Sci. 28: pro.3644. [DOI] [PMC free article] [PubMed] [Google Scholar]
- 79.Iliev DB, Roach JC, Mackenzie S, V Planas J, and Goetz FW. 2005. Endotoxin recognition: in fish or not in fish? FEBS Lett. 579: 6519–28. [DOI] [PMC free article] [PubMed] [Google Scholar]
- 80.Berczi I, Bertók L, and Bereznai T. 1966. Comparative studies on the toxicity of Escherichia coli lipopolysaccaride endotoxin in various animal species. Can. J. Microbiol 12: 1070–1071. [DOI] [PubMed] [Google Scholar]
- 81.Stafford JL, Ellestad KK, Magor KE, Belosevic M, and Magor BG. 2003. A toll-like receptor (TLR) gene that is up-regulated in activated goldfish macrophages. Dev. Comp. Immunol 27: 685–698. [DOI] [PubMed] [Google Scholar]
- 82.MacKenzie S, Planas JV, and Goetz FW. 2003. LPS-stimulated expression of a tumor necrosis factor-alpha mRNA in primary trout monocytes and in vitro differentiated macrophages. Dev. Comp. Immunol 27: 393–400. [DOI] [PubMed] [Google Scholar]
- 83.Pelegrín P, García-Castillo J, Mulero V, and Meseguer J. 2001. Interleukin-1β isolated from a marine fish up-regulated expression in macrophages following activation with lipopolysaccharide and lymphokines. Cytokine 16: 67–72. [DOI] [PubMed] [Google Scholar]
- 84.Ishii A, Kawasaki M, Matsumoto M, Tochinai S, and Seya T. 2007. Phylogenetic and expression analysis of amphibian Xenopus Toll-like receptors. Immunogenetics 59: 281–293. [DOI] [PubMed] [Google Scholar]
Associated Data
This section collects any data citations, data availability statements, or supplementary materials included in this article.
Supplementary Materials
Fig S1: Predicted zebrafish ly96 mutant gene products
Fig S2: Alignment of Md-2 proteins from amphibians and various fishes
Fig S3: Comparison of zebrafish Tlr4a sequence used in this paper versus previous work