

Abstract
Objective
To describe relationship between cord blood (representing fetal) myo-inositol concentrations and gestational age (GA) and to determine trends of blood concentrations in enterally and parenterally fed infants from birth to 70 days of age.
Design/Methods
Samples were collected in 281 fed or unfed infants born in 2005 and 2006. Myo-inositol concentrations were displayed in scatter plots and analyzed with linear regression models of natural log-transformed values.
Results
In 441 samples obtained from 281 infants, myo-inositol concentrations varied from nondetectable to 1494 μmol/L. Cord myo-inositol concentrations decreased an estimated 11.9% per week increase in GA. Postnatal myo-inositol concentrations decreased an estimated 14.3% per week increase in postmenstrual age (PMA) and were higher for enterally fed infants compared to unfed infants (51% increase for fed vs. unfed infants).
Conclusions
Fetal myo-inositol concentrations decreased with increasing GA. Postnatal concentrations decreased with increasing PMA and were higher among enterally fed than unfed infants.
Introduction
Inositol is present throughout the body and particularly in the central nervous system as an intracellular free sugar alcohol [1]. At least 90% is myo-inositol, the major stereoisomer in the body. Myo-inositol is additionally a constituent of a number of inositol-phosphates, glycolipids, glycoproteins, and particularly phosphoinositides. The most common phosphoinositide, phosphatidylinositol, is a structural component of various membranous structures and a component of lung surfactant phospholipids. Cord blood concentrations of myo-inositol are high in the early gestation and decrease with increasing gestation [2, 3]. Postnatal blood concentrations of myo-inositol increase through day 2 and then decrease with increasing postnatal age [3].
Preterm colostrum has higher myo-inositol concentrations than mature preterm milk (average 2.24 mmol/L [40.36 mg/dL] vs. 1.34 mmol/L, respectively, in one study and 4.23 mmol/L vs. 1.86 mmol/L in another study) [4–6]. A minimum of 0.96 mg/100 kJ (4 mg/100 kcal) myo-inositol was recommended by the American Academy of Pediatrics Committee on Nutrition in 1976 for milk-based formula [7]. A maximum of 9.56 mg/100 kJ (40 mg/100 kcal) was recommended by the American Academy of Pediatrics in 2004 following a recommendation from the Life Sciences Research Organization [8]. Over the ensuing years, increasing amounts of myo-inositol have been added to formulas and to breast milk fortifiers; however, no intravenous product has been developed. Two studies conducted in the 1980s have shown higher postnatal concentrations of myo-inositol in enterally fed preterm infants than in those receiving parenteral nutrition exclusively [4, 6].
In preparation for a large multicenter trial of myo-inositol to prevent retinopathy of prematurity to be conducted by the Eunice Kennedy Shriver National Institute of Child Health and Human Development Neonatal Research Network [9], a series of pilot studies [10, 11] were planned to select an appropriate dose and increase understanding of the pharmacokinetics of this endogenous sugar alcohol in the very low birth weight infant. This preparatory observational study was designed [1] to describe the relationship between cord blood (representing fetal) concentrations and gestational age (GA) and [2] to determine trends of blood myoinositol concentrations in enterally and parenterally fed infants from birth to 70 days of age, which was the planned duration of myo-inositol administration in the trial.
Methods
This was an observational study to describe the concentrations of myo-inositol in cord and postnatal blood at various ranges of GA and postmenstrual age (PMA) without myo-inositol supplementation and how they are affected by oral feeding. Residual serum or plasma samples from infants born at GA of 24–42 weeks and postnatal age of 0–70 days were scavenged from clinical laboratories and linked to deidentified demographic (gender, GA, size for GA, postnatal age) and feeding data (formula, human milk [HM], supplements, intravenous fluids, all without myo-inositol). Characteristics of the sample were recorded (source, type of anticoagulant [none, ethylenediamine-tetra-acetic acid {EDTA}, lithium heparin], time from collection to storage), and a unique code was assigned. Samples of serum/plasma were batched, frozen, and sent to the Pediatric Pharmacology Research Unit at the University of Utah. Myo-inositol was measured by high pressure liquid chromatography in 50 μL of serum or plasma; this method analyzes total free myo-inositol. This assay is linear from 0 to 1000 μmol/L with a correlation coefficient of 0.997 and a lower limit of detection of 50 μmol/L [12]. Concentrations ranging 50–99 μmol/L were reported as below quantifiable limit (BQL). The chromatographic peak of myo-inositol immediately follows that of glucose; however, the chromatographic curve returns to baseline except for very high glucose concentrations, thereby yielding accurate and precise measurements of myo-inositol using the peak area ratio of inositol to internal standard. The day-to-day coefficient of variation was 13% for 50 μmol/L, 7% for 100 μmol/L, and <3% for 300 and 700 μmol/L. Intraday coefficient of variation was <2% for values 100–700 μmol/L. The lowest quantified reported value in this study was 100 μmol/L. Myo-inositol concentrations are stable when stored at room temperature for up to 1week and are unaffected by anticoagulation with lithium heparin, or EDTA [12].
A target of seven samples was sought for each of four GA groups, at five postnatal age ranges. In addition, for the youngest two GA groups, a similar target sample was sought in the four feeding categories explained in Table 1. Nothing per os (NPO) was defined as no enteral feeding for the previous 72 h. The half-life of myo-inositol in preterm infants has been estimated as 5.22 h for single intravenous administration data and 7.90 h for multiple intravenous administration data [10, 11]. We are not aware of any pharmacokinetic study of myo-inositol administered enterally in neonates. In adults, the serum concentration of myo-inositol after a single enteral dose peaks at 3 h and is back to baseline after 25 h [13]. Thus, after 72 h NPO (i.e., 6 half-lives beyond 25 h), the majority of myo-inositol administered enterally is likely to have been eliminated.
Table 1.
Number of blood samples in predefined gestational age and postnatal age groups obtained for inositol concentrations.
| Gestational age (weeks) | Postnatal age | Total | ||||
|---|---|---|---|---|---|---|
| Cord | 1–7 days | 8–21 days | 22–42 days | 43–70 days | ||
| 24–26 | 8 | 53 | 36 | 35 | 30 | 162 |
| 27–29 | 7 | 28 | 35 | 33 | 20 | 123 |
| 30–35 | 8 | 27 | 31 | 17 | 14 | 97 |
| 36–42 | 11 | 25 | 18 | 3 | 2 | 59 |
| Total | 34 | 133 | 120 | 88 | 66 | 441 |
A target of seven samples was sought for each of the four gestational age groups, at five postnatal age ranges. In addition, for the youngest two GA groups, a similar target sample was sought in the four feeding categories. The feeding categories were defined, based on intake in the last 72 h prior to sampling, as exclusive intravenous (IV) feeding (nothing per os, NPO), >80% formula, >80% human milk [HM], or mixed IV/HM/formula).
Data analyses included descriptive statistics for myo-inositol concentration, including frequencies of results where myo-inositol was not detected (ND), BQL and quantifiable as well as first quartile, median, and third quartile values for the quantifiable values. Nonparametric locally weighted scatter-plot smoother (LOESS) curves and associated 95% confidence intervals were plotted over scatter plots to descriptively assess the profile of myo-inositol concentrations by GA for cord samples and by PMA for postnatal samples. For cord and postnatal samples separately, the natural log-transformed concentration was modeled employing left-censoring techniques to account for values that were not quantifiable. The left censoring assumes that the nonquantified values are below 100 μmol/L but are not assumed to be a specific value. For cord samples, natural log-transformed inositol concentration was modeled as a function of GA. For postnatal samples, natural log-transformed inositol concentration was modeled as a function of GA, PMA, and feeding category (fed vs. NPO) with a random effect for infant to account for correlation between observations within infant. The final model was selected to fit available data best as determined by the Akaike information criterion (AIC). Results include the parameter estimate and its standard error (SE) and the percentage change per week or for feeding vs. NPO. Predictive curves resulting from the model were plotted over scatter plots to descriptively assess the profile of myo-inositol concentrations by GA for cord samples and by PMA for postnatal samples. Sensitivity analyses using linear regression models with imputed values of log-transformed postnatal concentrations instead of left censoring were also performed that explored quadratic and cubic terms of age and size for GA. Statistical analysis was conducted using SAS version 14.2; in particular PROC NLMIXED for the left-censoring models (SAS Institute, Inc., Cary, NC).
The study was reviewed and approved by the IRB at each participating center. Approval with waiver of consent was granted for six of the seven centers, whereas written consent was obtained in one center.
Results
Demographics
The study recruited 281 infants in calendar years 2005–2006. The range of GA at birth was 24–42 weeks with a median GA of 29 weeks. Among the infants sampled, 47% were female. Information on race and ethnicity were incomplete and thus not reported. Among the 441 samples, 1 sample was obtained in 193, 2 samples in 52, 3 samples in 18, and 4–8 samples in 18 infants. The range of PMA for sample collection extended from 22 to 45 weeks (Table 2).
Table 2.
Demographics and sample description.
| Infant characteristic | Statistic/category | All infants (N = 281) |
|---|---|---|
| Gestational age (weeks) | Mean (SD) | 30.4 (4.9) |
| Median (Q1, Q3) | 29.0 (26.3, 33.7) | |
| Size | SGA | 33 (12%) |
| AGA | 244 (87%) | |
| LGA | 4 (1%) | |
| Gender | Female | 131 (47%) |
| Male | 150 (53%) | |
| Number of samples | Median (Min, Max) | 1 [1, 8] |
| Sample characteristic | Statistic/category | All samples (N = 441) |
| Postmenstrual age (weeks) | <27 | 74 (17%) |
| 27–29 | 91 (21%) | |
| 30–35 | 177 (40%) | |
| 36–45 | 99 (22%) | |
| Anticoagulant use | Serum | 80 (18%) |
| Plasma-EDTA | 33 (7%) | |
| Plasma-heparin | 328 (74%) | |
| Sample type | Cord | 34 (8%) |
| Infant | 407 (92%) |
Q1 first quartile, Q3 third quartile, SGA small for gestational age, AGA appropriate for gestational age, LGA large for gestational age, EDTA ethylenediamine-tetraacetatic acid.
Myo-inositol concentrations
Myo-inositol was measured in serum (18% of the samples) or plasma (74% heparin, 8% EDTA) obtained from 34 cord samples and 407 infant samples (Table 2). Myo-inositol was ND in 84 (19%) samples while concentrations were BQL in 63 (14%) samples. The overall distribution of natural log-transformed myo-inositol concentrations is approximately consistent with a normal distribution that is left-censored at 100 μmol/L (Supplementary Fig. 1).
A total of 34 cord samples were obtained and analyzed with myo-inositol concentrations appearing to decrease as gestation advanced from 24 to 42 weeks; the relationship was not linear, with progressive flattening of the curve when plotted on a linear scale (Supplementary Table 1, Fig. 1). The parameter estimate for GA was −0.13 (SE = 0.04), corresponding to a 11.9% decrease in cord myo-inositol concentrations for each 1 week increase in GA (P value = 0.003) (Table 3).
Fig. 1. Cord myo-inositol concentration with prediction curves resulting linear regression models of natural log-transformed myoinositol concentration with left censoring by gestational age at birth (weeks).

Left-censored includes BQL, below quantifiable limit (<100 μmol/L), and not detected, 0–50 μmol/L.
Table 3.
Modeling results for natural log-transformed inositol concentration.
| Model by type of sample | Factor | Parameter estimate (SE) | Derived estimate | Derived estimate | Type 3 P values |
|---|---|---|---|---|---|
| Model 1: Cord | GA (Week) | −0.13 (0.04) | % Change for 1-week change in GA | −11.9% | 0.003 |
| Model 2: Postnatal | GA (Week) | 0.09 (0.02) | % Change for 1-week change in GA | 9.2% | <0.001 |
| PMA (Week) | −0.15 (0.02) | % Change for 1-week change in PMA | −14.3% | <0.001 | |
| Feeding vs. NPO | 0.41 (0.09) | % Increase in geometric mean for Feeding vs. NPO | 51.0% | <0.001 |
Feeding includes formula only, human milk only, or mixed intake. Natural log-transformed inositol concentration was modeled using linear regression models with left censoring to account for concentrations that were not detected or below quantifiable limits. Separate models were used for cord and postnatal samples. For postnatal/serial samples, a random effect for infant was included to account for correlation between observations within infant. The derived estimate converts the Parameter Estimate to a percent change per week in inositol concentration.
SE standard error, GA gestational age, PMA postmenstrual age, NPO nothing per os.
A total of 407 postnatal samples were analyzed, with a general trend of myo-inositol concentrations decreasing as PMA increased; the relationship was not linear, with progressive flattening of the curve when plotted on a linear scale (Supplementary Table 1, Fig. 2). The adjusted geometric mean for myo-inositol concentration of samples obtained from enterally fed infants are estimated to be increased by 50% compared to samples from the NPO infants.
Fig. 2. Serial myo-inositol concentration with prediction curves resulting linear regression models of natural log-transformed myoinositol concentration with left censoring by PMA (weeks) and feeding category (enterally fed, upper panel; NPO, lower panel).
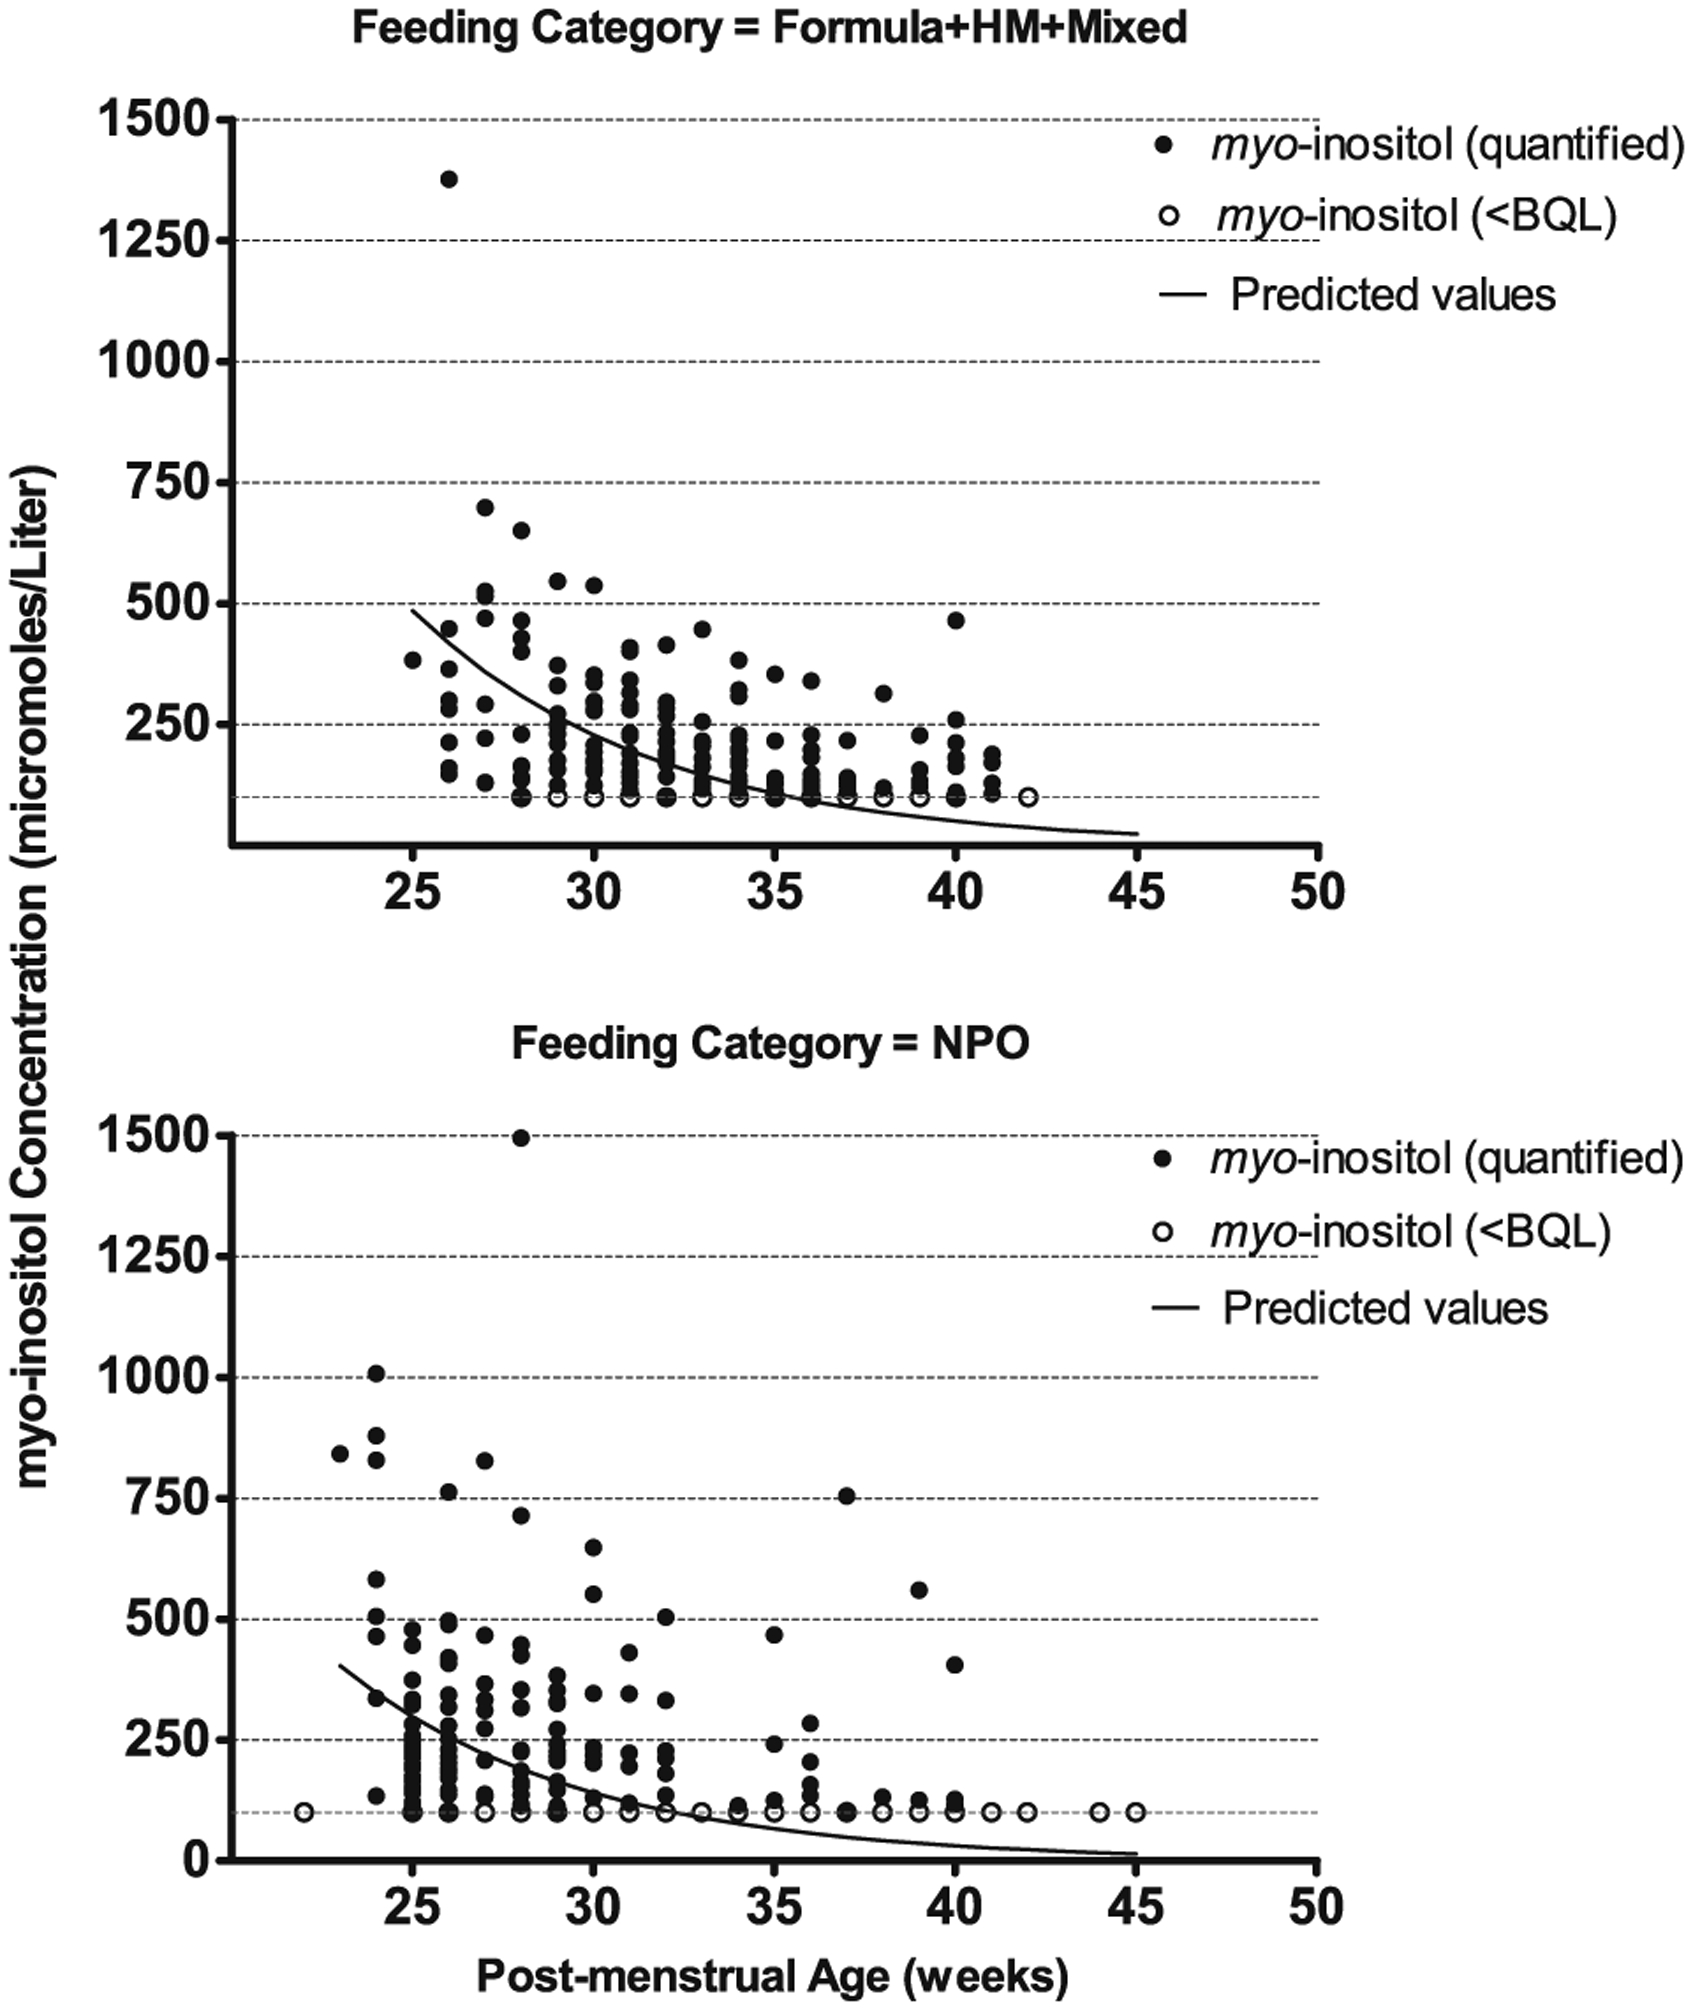
Left-censored includes BQL, below quantifiable limit (<100 μmol/L), and not detected, 0–50 μmol/L. For the linear model, a random effect for infant was included to account for correlation between observations within infant.
The parameter estimate for PMA was −0.15 (SE = 0.02) corresponding to a 14.3% decrease in postnatal myo-inositol concentrations for each 1 week increase in PMA. The adjusted geometric means for myo-inositol concentration (μmol/L) for samples obtained from fed infants were increased by ~50% compared to samples from the NPO infants.
Sensitivity analyses using imputed values of postnatal myo-inositol concentrations provided consistent results with respect to significance of parameter estimates and did not show any evidence of an effect of size for GA nor of a cubic or quadratic relationship between age and natural log-transformed myo-inositol concentration. As a note, only six samples were from small for GA infants, among which three were BQL, one was ND, and two were quantified.
Discussion
In this study, we observed a large range of mixed cord blood myo-inositol concentrations, which decreased with increasing GA. Postnatal myo-inositol concentrations decreased after 3 weeks of postnatal age. A linear model of the natural log-transformed concentration with left censoring of nonquantified values fit available data best as determined by AIC criterion (not shown). To our knowledge, this study reports results from the largest dataset of postnatal myo-inositol concentrations in newborn infants. Postnatal concentrations decreased with increasing PMA. Concentrations were higher among infants who were feeding compared to those who remained NPO. Preliminary results of this study were used in establishing the dosing of myo-inositol in the randomized controlled trial that was later conducted by the NICHD Neonatal Research Network [9].
These data are in agreement with previous publications, which showed a progressive decrease in serum myo-inositol concentration with increasing GA and postnatal age and higher concentrations in patients receiving enteral feedings compared to those receiving parenteral nutrition exclusively [2, 4, 14]. No significant relationship was found between myo-inositol cord blood concentrations and size for age, possibly due to the small sample size for growth restricted infants and the high proportion of those values that were not measurable. Intrauterine growth restriction is associated with increased myo-inositol concentrations in sheep and human placenta and neonatal human urine [15–19].
Myo-inositol is synthesized in many tissues by cyclisation of glucose-6-phosphate into myo-inositol-1-phosphate, which is dephosphorylated by inositol-1-phosphatase to produce inositol [20]. Most inositol is located intracellularly as the free myo-inositol stereoisomer. In addition, it is present as a component of myo-inositol-containing physiological molecules [20–22]. Since myo-inositol has been identified as a second messenger of insulin, it has been proposed as a dietary supplement for women with gestational diabetes [23]. A systematic review of randomized trials found that the only benefit of maternal myo-inositol supplementation was a reduced risk for neonatal hypoglycemia [23]. The Na+/myo-inositol cotransporter (SMIT1) has a critical role in developing neural control system, peripheral nerve function and osteogenesis [24–26]. Brain myo-inositol depletion in mice missing the Na+/myo-inositol cotransporter leads to central apnea that is prevented by myo-inositol supplementation [24, 27].
There is no significant correlation between fetal and maternal serum myo-inositol concentrations. Maternal concentrations are stable in pregnancy, while fetal concentrations are five times as high as maternal concentrations in the first trimester and decrease during gestation. Umbilical cord concentrations are higher in the artery than in the vein, consistent with fetal synthesis [3, 28, 29]. Quirk et al. found activity of glucose-6-phosphate: inositol-1-phosphate cyclase, a putative regulatory enzyme in myo-inositol synthesis, in human fetal liver and lung and in placenta [29]. High concentrations of fetal myo-inositol in early pregnancy may help maintain redox potential in low-oxygen environment in the first trimester and prevent neural tube defects [30, 31]. Myo-inositol affects surfactant composition by increasing phosphatidylinositol and the ratio of diphosphatidyl-choline to sphingomyelin while decreasing phosphatidyl-glycerol [32–34]. Sex-related differences in composition of surfactant, including a higher proportion of phosphatidylinositol and GA-dependent progressive increase in ratio of phosphatidyl-choline to sphingomyelin in male preterm infants, may contribute to the sex-related difference in respiratory distress syndrome [35]. Phosphatidylinositol specific phospholipase C, coupled to diacylglycerol lipase action, could provide a mechanism for the release of arachidonic acid for prostaglandin biosynthesis during parturition [36].
The rate of endogenous production of myo-inositol in 23–29 week preterm infants at 0.44 ± 1.15 weeks of age (0.36 mmol × kg−1 × d−1) is in the range of the amount ingested when receiving full enteral feeds (average in two studies 0.36 and 0.68 mmol × kg−1 × d−1 in colostrum and 0.21 and 0.30 mmol × kg−1 × d−1 in HM) [5, 6, 10]. In contrast, the rate of endogenous production of myo-inositol in term and late preterm infants (1.52 mmol × kg−1 × d−1) far exceeds the amount a breast-fed infant typically ingests [4–6, 37].
Myo-inositol clearance by the kidney involves both glomerular filtration and catabolism in the parenchyma by myo-inositol oxygenase and aldehyde reductase [38–40]. Urinary myo-inositol excretion, large at birth, decreases progressively in parallel with decreasing serum concentrations and with maturation of aldehyde reductase in the proximal tubule [14]. The premature fetus likely secretes myo-inositol-rich urine into the amniotic fluid that is swallowed and recycled back into the fetus [1]. It is not known whether prolonged rupture of the fetal membranes or some other pregnancy complication leads to myo-inositol depletion at very premature birth. In the present study, 20% of infants born before 30 weeks of gestation had cord blood concentrations that were not quantifiable (i.e., BQL μmol/L). In a randomized trial, intravenous myo-inositol supplementation starting at 4 to 12 h after birth resulted in a remarkable increase in serum myo-inositol and decrease in severity of respiratory distress [31]. Since most of the infants born with a mean gestation of 28 weeks in this early trial received neither antenatal steroids nor surfactant, these results are not replicated at present.
Previous studies have shown an inverse relationship between serum concentrations of myo-inositol and severe retinopathy of prematurity [41]. This led to a series of pilot trials and then a large randomized trial of myo-inositol supplementation, starting from a mean age of 2.8 days and continuing up to 10 weeks, which eventually did not show a benefit [9–11].
Strengths of this study include large sample size, rigorous methods designed to find the best model to fit the data, multivariate analysis including GA, PMA, and feeding category, and multiple centers.
One limitation of the study is that samples were measured in 2006 using an HPLC method with overlap between BQL threshold (100 μmol/L) and expected blood concentration (~30–250 μmol/L [3, 4]), resulting in a high proportion of values that were ND or BQL. This may have resulted in a bias with higher levels of median concentration in samples that were quantified. A more recent technique has been described, in which myo-inositol is separated from glucose and other hexose monosaccharides using a lead-form resin-based column and measurement using liquid chromatography-double mass spectrometry allows accurate and precise measurements of low myo-inositol concentrations below 50 μmol/L [42]. Additional limitations of the study include a small number of cord blood samples, a lack of separation of umbilical arterial and venous blood, lack of prospective data collection at rigorous time points, missing samples, lack of measurement of myo-inositol in HM or formula, lack of assessing changes in myo-inositol concentration over time, and lack of analysis by race/ethnicity. Thus, it is possible that we may have missed significant differences between groups.
In summary, in the absence of myo-inositol supplementation, cord myo-inositol concentrations decreased with increasing GA. Postnatal concentrations decreased with increasing PMA and were higher among infants who were feeding compared to those who remained NPO. Present and previous data [8, 31] suggest that in some cases serum concentrations of myo-inositol at birth are low.
Data availability
Data reported in this paper may be requested through a data use agreement. Further details are available at https://neonatal.rti.org/index.cfm?fuseaction=DataRequest.Home.
Supplementary Material
Acknowledgements
The National Institutes of Health and the Eunice Kennedy Shriver National Institute of Child Health and Human Development (NICHD), through the Neonatal Research Network and the Pediatric Pharmacology Research Units Network, and the National Eye Institute provided grant support for the Inositol Cross-Sectional Blood study. The study was planned in 2004; recruitment was in 2005–2006. While NICHD staff did have input into the study design, conduct, analysis, and manuscript drafting, the content is solely the responsibility of the authors and does not necessarily represent the official views of the National Institutes of Health. Data collected at participating sites of the NICHD Neonatal Research Network (NRN) were transmitted to RTI International, the data coordinating center (DCC) for the network, which stored, managed, and analyzed the data for this study. On behalf of the NRN, Dr. Abhik Das (DCC Principal Investigator) and Ms. Lisa Wrage (DCC Statistician) had full access to all the data in the study and take responsibility for the integrity of the data and accuracy of the data analysis. The NICHD Pediatric Pharmacology Research Unit (PPRU) network provided support and advice in designing the PK study (JVA, JVDA, AAV, SEK, RMW), analyzing the data (SEK), and conducting the Inositol Assay (RDL): Jacob V. Aranda, MD PhD FRCPC, Wayne State University (U10 HD37261); John van der Anker, MD, Children’s National Medical Center (U10 HD45993); Steven E. Kern, PhD, College of Pharmacy, Robert M. Ward, MD, Department of Pediatrics, University of Utah Medical Center (U10 HD45986); Alexander A. Vinks, PharmD PhD FCP, Cincinnati Children’s Hospital Medical Center, Department of Pediatrics, University of Cincinnati (U10 HD37249); Richard D. Leff, PharmD FCCP, Texas Tech University Health Sciences Center, Pediatric Pharmacology Research & Development Center (U10 HD46000). We are indebted to our medical and nursing colleagues and the infants and their parents who took part in this study.
Footnotes
Conflict of interest The authors declare that they have no conflict of interest.
Supplementary information The online version of this article (https://doi.org/10.1038/s41372-020-00799-5) contains supplementary material, which is available to authorized users.
References
- 1.Hallman M Inositol during perinatal transition. Neo Reviews. 2015;16:e84. [Google Scholar]
- 2.Carver JD, Stromquist CI, Benford VJ, Minervini G, Benford SA, Barness LA. Postnatal inositol levels in preterm infants. J Perinatol. 1997;17:389–92. [PubMed] [Google Scholar]
- 3.Brusati V, Józwik M, Józwik M, Teng C, Paolini C, Marconi AM, et al. Fetal and maternal non-glucose carbohydrates and polyols concentrations in normal human pregnancies at term. Pediatr Res. 2005;58:700–4. [DOI] [PubMed] [Google Scholar]
- 4.Pereira GR, Baker L, Egler J, Corcoran L, Chiacacci R. Serum myo-inositol concentrations in premature infants fed human milk, formula for infants, and parenteral nutrition. Am J Clin Nutr. 1990;51:589–93. [DOI] [PubMed] [Google Scholar]
- 5.Cavalli C, Teng C, Battaglia FC, Bevilacqua G. Free sugar and sugar alcohol concentrations in human breast milk. J Pediatr Gastroenterol Nutr. 2006;42:215–21. [DOI] [PubMed] [Google Scholar]
- 6.Bromberger P, Hallman M. Myoinositol in small preterm infants: relationship between intake and serum concentration. J Pediatr Gastroenterol Nutr. 1986;5:455–8. [DOI] [PubMed] [Google Scholar]
- 7.American Academy of Pediatrics. Committee on Nutrition. Commentary on breast-feeding and infant formulas, including proposed standards for formulas. Pediatrics. 1976;57:278–85. [PubMed] [Google Scholar]
- 8.Committee on Nutrition. Recommendations of the expert panel for nutrient levels in infant formulas, table D-2 In: Pediatric nutrition handbook. 5th ed. Elk Grove Village, IL: American Academy of Pediatrics; 2004. [Google Scholar]
- 9.Phelps DL, Watterberg KL, Nolen TL, Cole CA, Cotten CM, Oh W, et al. Effects of Myo-inositol on type 1 retinopathy of prematurity among preterm infants <28 weeks’ gestational age: a randomized clinical trial. JAMA. 2018;320:1649–58. [DOI] [PMC free article] [PubMed] [Google Scholar]
- 10.Phelps DL, Ward RM, Williams RL, Watterberg KL, Laptook AR, Wrage LA, et al. Pharmacokinetics and safety of a single intravenous dose of myo-inositol in preterm infants of 23–29 wk. Pediatr Res. 2013;74:721–9. Erratum in: Pediatr Res 2014;75:803. Pediatr Res 2016; 80:326. [DOI] [PMC free article] [PubMed] [Google Scholar]
- 11.Phelps DL, Ward RM, Williams RL, Nolen TL, Watterberg KL, Oh W, et al. Safety and pharmacokinetics of multiple dose myo-inositol in preterm infants. Pediatr Res. 2016;80:209–17. [DOI] [PMC free article] [PubMed] [Google Scholar]
- 12.Ward RM, Sweeley J, Lugo RA. Inositol analysis by HPLC and its stability in scavenged sample conditions. Med Chem. 2015;5:077–80. [DOI] [PMC free article] [PubMed] [Google Scholar]
- 13.Carlomagno G, De Grazia S, Unfer V, Manna F. Myo-inositol in a new pharmaceutical form: a step forward to a broader clinical use. Expert Opin Drug Deliv. 2012;9:267–71. [DOI] [PubMed] [Google Scholar]
- 14.Lewin LM, Melmed S, Passwell JH, Yannai Y, Brish M, Orda S, et al. Myoinositol in human neonates: serum concentrations and renal handling. Pediatr Res. 1978;12:3–6. [DOI] [PubMed] [Google Scholar]
- 15.Dessi A, Fanos V. Myoinositol: a new marker of intrauterine growth restriction? J Obstetr Gynaecol. 2013;33:776–80. [DOI] [PubMed] [Google Scholar]
- 16.Sanz-Cortés M, Figueras F, Bargalló N, Padilla N, Amat-Roldan I, Gratacós E. Abnormal brain microstructure and metabolism in small-for-gestational-age term fetuses with normal umbilical artery Doppler. Ultrasound Obstet Gynecol. 2010;336:159–65. [DOI] [PubMed] [Google Scholar]
- 17.Regnault TR, Teng C, de Vrijer B, Galan HL, Wilkening RB, Battaglia FC. The tissue and plasma concentration of polyols and sugars in sheep intrauterine growth retardation. Exp Biol Med. 2010;235:999–1006. [DOI] [PubMed] [Google Scholar]
- 18.Barberini L, Noto A, Fattuoni C, Grapov D, Casanova A, Fenu G, et al. Urinary metabolomics (GC-MS) reveals that low and high birth weight infants share elevated inositol concentrations at birth. J Matern-Fetal Neonatal Med. 2014;27:20–6. [DOI] [PubMed] [Google Scholar]
- 19.Story L, Damodaram MS, Supramaniam V, Allsop JM, Mcguinness A, Patel A, et al. Myo-inositol metabolism in appropriately grown and growth restricted fetuses: a proton magnetic resonance spectroscopy study. Eur J Obstet Gynecol Reprod Biol. 2013;170:77–81. [DOI] [PubMed] [Google Scholar]
- 20.Holub BJ. The nutritional importance of inositol and the phosphoinositides. N Engl J Med. 1992;326:1285–7. [DOI] [PubMed] [Google Scholar]
- 21.Kalhan SC. Nonglucose carbohydrates and infant nutrition and metabolism. J Nutr. 2009;139:1611–2. [DOI] [PubMed] [Google Scholar]
- 22.Hallman M, Saugstad OD, Porreco RP, Epstein BL, Gluck L. Role of myoinositol in regulation of surfactant phospholipids in the newborn. Early Hum Dev. 1985;10:245–54. [DOI] [PubMed] [Google Scholar]
- 23.Brown J, Crawford TJ, Alsweiler J, Crowther CA. Dietary supplementation with myo-inositol in women during pregnancy for treating gestational diabetes. Cochrane Database Syst Rev. 2016;9:CD012048. [DOI] [PMC free article] [PubMed] [Google Scholar]
- 24.Berry GT, Wu S, Buccafusca R, Ren J, Gonzales LW, Ballard PL, et al. Loss of murine Na+/myo-inositol cotransporter leads to brain myo-inositol depletion and central apnea. J Biol Chem. 2003;278:18297–302. [DOI] [PubMed] [Google Scholar]
- 25.Dai Z, Chung SK, Miao D, Lau KS, Chan AW, Kung AW. Sodium/myo-inositol cotransporter 1 and myo-inositol are essential for osteogenesis and bone formation. J Bone Min Res. 2011;26:582–90. [DOI] [PubMed] [Google Scholar]
- 26.Chau JF, Lee MK, Law JW, Chung SK, Chung SS. Sodium/myo-inositol cotransporter-1 is essential for the development and function of the peripheral nerves. FASEB J. 2005;19:1887–9. [DOI] [PubMed] [Google Scholar]
- 27.Buccafusca R, Venditti CP, Kenyon LC, Johanson RA, Van Bockstaele E, Ren J, et al. Characterization of the null murine sodium/myo-inositol cotransporter 1 (Smit1 or Slc5a3) phenotype: myo-inositol rescue is independent of expression of its cognate mitochondrial ribosomal protein subunit 6 (Mrps6) gene and of phosphatidylinositol levels in neonatal brain. Mol Genet Metab. 2008;95:81–95. [DOI] [PubMed] [Google Scholar]
- 28.Staat BC, Galan HL, Harwood JE, Lee G, Marconi AM, Paolini CL, et al. Transplacental supply of mannose and inositol in uncomplicated pregnancies using stable isotopes. J Clin Endocrinol Metab. 2012;97:2497–502. [DOI] [PMC free article] [PubMed] [Google Scholar]
- 29.Quirk JG Jr, Bleasdale JE. Myo-Inositol homeostasis in the human fetus. Obstet Gynecol. 1983;62:41–44. [PubMed] [Google Scholar]
- 30.Jauniaux E, Hempstock J, Teng C, Battaglia FC, Burton GJ. Polyol concentrations in the fluid compartments of the human conceptus during the first trimester of pregnancy: maintenance of redox potential in a low oxygen environment. J Clin Endocrinol Metab. 2005;90:1171–5. [DOI] [PubMed] [Google Scholar]
- 31.Greene ND, Leung KY, Copp AJ. Inositol, neural tube closure and the prevention of neural tube defects. Birth Defects Res A Clin Mol Teratol. 2016;109:68–80. [DOI] [PMC free article] [PubMed] [Google Scholar]
- 32.Hallman M, Bry K, Hoppu K, Lappi M, Pohjavuori M. Inositol supplementation in premature infants with respiratory distress syndrome. N Engl J Med. 1992;326:1233–9. [DOI] [PubMed] [Google Scholar]
- 33.Hallman M, Arjomaa P, Hoppu K. Inositol supplementation in respiratory distress syndrome: relationship between serum concentration, renal excretion, and lung effluent phospholipids. J Pediatr. 1987;110:604–10. [DOI] [PubMed] [Google Scholar]
- 34.Longmuir KJ, Bleasdale JE, Quirk JG, Johnston JM. Regulation of lamellar body acidic glycerophospholipid biosynthesis in fetal rabbit lung in organ culture. Biochim Biophys Acta. 1982;712:356–64. [DOI] [PubMed] [Google Scholar]
- 35.Sozo F, Ishak N, Bhatia R, Davis PG, Harding R. Surfactant phospholipid composition of gastric aspirate samples differs between male and female very preterm infants. Pediatr Res. 2017;82:839–49. [DOI] [PubMed] [Google Scholar]
- 36.Di Renzo GC, Johnston JM, Okazaki T, Okita JR, MacDonald PC, Bleasdale JE. Phosphatidylinositol-specific phospholipase C in fetal membranes and uterine decidua. J Clin Investig. 1981;67:847–56. [DOI] [PMC free article] [PubMed] [Google Scholar]
- 37.Brown LD, Cheung A, Harwood JEF, Battaglia FC. Inositol and mannose utilization rates in term and late-preterm infants exceed nutritional intakes. J Nutr. 2009;139:1648–52. [DOI] [PMC free article] [PubMed] [Google Scholar]
- 38.Holub BJ. Metabolism and function of myo-inositol and inositol phospholipids. Annu Rev Nutr. 1986;6:563–97. [DOI] [PubMed] [Google Scholar]
- 39.Troyer DA, Schwertz DW, Kreisberg JI, Venkatachalam MA. Inositol phospholipid metabolism in the kidney. Annu Rev Physiol. 1986;48:51–71. [DOI] [PubMed] [Google Scholar]
- 40.Barsk OA, Papusha VZ, Ivanova MM, Rudman DM, Finegold MJ. Developmental expression and function of aldehyde reductase in proximal tubules of the kidney. Am J Physiol Ren Physiol. 2005;289:F200–7. [DOI] [PubMed] [Google Scholar]
- 41.Friedman CA, McVey J, Borne MJ, James M, May WL, Temple DM, et al. Relationship between serum inositol concentration and development of retinopathy of prematurity: a prospective study. J Pediatr Ophthalmol Strabismus. 2000;37:79–86. [DOI] [PubMed] [Google Scholar]
- 42.Leung KY, Mills K, Burren KA, Copp AJ, Greene ND. Quantitative analysis of myo-inositol in urine, blood and nutritional supplements by high-performance liquid chromatography tandem mass spectrometry. J Chromatogr B Anal Technol Biomed Life Sci. 2011;879:2759–63. [DOI] [PMC free article] [PubMed] [Google Scholar]
Associated Data
This section collects any data citations, data availability statements, or supplementary materials included in this article.
Supplementary Materials
Data Availability Statement
Data reported in this paper may be requested through a data use agreement. Further details are available at https://neonatal.rti.org/index.cfm?fuseaction=DataRequest.Home.