Abstract
The NSD family histone methyltransferases, including NSD1, NSD2 and NSD3, play crucial roles in chromatin regulation and are implicated in oncogenesis1,2. NSD enzymes exhibit an auto-inhibitory state that is relieved by nucleosome engagement, allowing for H3K36 di-methylation catalysis3–7. However, the molecular basis underlying this mechanism is largely unknown. Here, we have solved the cryo-EM structures of NSD2 and NSD3 bound to mononucleosomes at atomic resolution. We find that NSD2/3 mononucleosome engagement causes DNA near the linker region to unwrap, which facilitates insertion of their catalytic core in-between the histone octamer and the unwrapped segment of DNA. A network of DNA- and histone-specific contacts between the nucleosome and NSD2/3 precisely define the enzymes’ position on the nucleosome, explaining the methylation specificity for H3K36. Further, NSD-nucleosome intermolecular contacts are altered by several recurrent cancer-associated NSD2/3 mutations. NSDs harboring these mutations are catalytically hyperactive in vitro and in cells, and their ectopic expression promotes cancer cell proliferation and xenograft tumor growth. Together, our research provides molecular insights into the nucleosome-based recognition and modification mechanisms of NSD2 and NSD3, which should uncover strategies for therapeutic targeting of the NSD family of proteins.
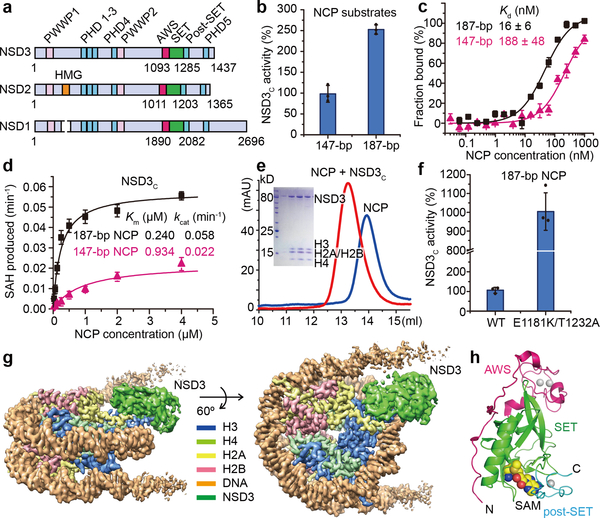
Mammalian NSD family of histone lysine methyltransferases including NSD1, NSD2 and NSD3 that share multiple conserved domains (Fig. 1a) are selective H3K36 lysine methyltransferases on nucleosome core particles (NCPs). We found that starting from the first PHD finger, the C-terminal half of NSD3 (NSD3C) methylated NCPs bearing linker DNAs much more efficiently than NCPs lacking flanking segments (Fig. 1b). Microscale thermophoresis (MST)-based binding analysis showed that NSD3C displayed a 12-fold higher binding affinity for 187 base pair (bp) NCPs relative to 147-bp NCPs (Fig. 1c). Kinetic analysis verified that NSD3C displayed a 2.6-fold higher kcat value with a much smaller Km value for 187-bp NCPs relative to 147-bp NCPs (Fig. 1d, Extended Data Table 1). Gel-filtration analysis showed that NSD3C can form stable complexes with all NCPs tested (Fig. 1e). Recurrent mutations in NSD proteins have been detected in multiple human cancers1,8–11. We evaluated several cancer-associated mutations of NSD family proteins from the COSMIC12 database and found that NSD3C harboring substitutions at both E1181K and T1232A sites exhibited higher methylation activity on NCPs than the wild-type protein (Fig. 1f). We then solved the structures of reconstituted complexes of native NSD3C or NSD3C bearing the E1181K/T1232A dual mutation with 187-bp NCPs at resolutions of 3.48 and 3.15 Å, respectively (Extended Data Figs. 1, 2, Extended Data Table 2). To further stabilize the complex for cryo-EM studies, H3K36 in the 187-bp NCPs was replaced with norleucine (Nle)13,14 (Extended Data Fig. 3a).
Fig. 1 |.
Biochemical analysis of NSD3 and the overall structure of the NSD3-E1181K/T1232A-NCP complex. a, Domain architecture of the NSD family proteins. b, Catalytic activities of NSD3C on 147-bp and 187-bp NCPs measured through an in vitro methylation method. Signals for 147-bp NCP were set as 100%. c, MST-based binding curves of NSD3C with 147-bp and 187-bp NCPs. d, Michaelis-Menten titrations of NSD3 with147-bp and 187-bp NCPs. e, Gel-filtration profiles of NCPs with or without bound NSD3C. SDS-PAGE gel is shown as an insert. For gel source data, see Supplementary Fig. 1. The experiment has been repeated at least three times with similar results. f, Catalytic activities of wild-type (WT) NSD3C and its E1181K/T1232A mutant on 187-bp NCPs measured through an in vitro methylation method. g, Side (left) and top (right) views of the sharpened cryo-EM density map of the 1:1 NSD3-NCP complex (contour at 3σ level). H3, H4, H2A, H2B, DNA and NSD3 are colored in blue, lime green, yellow, red, orange and grass green, respectively. h, Domain architecture of the AWS, SET and post-SET domains of NSD3, which are colored in magenta, green and cyan, respectively. Data in panels b, c, d and f are represented as means ± s.d. from n = 3 independent samples.
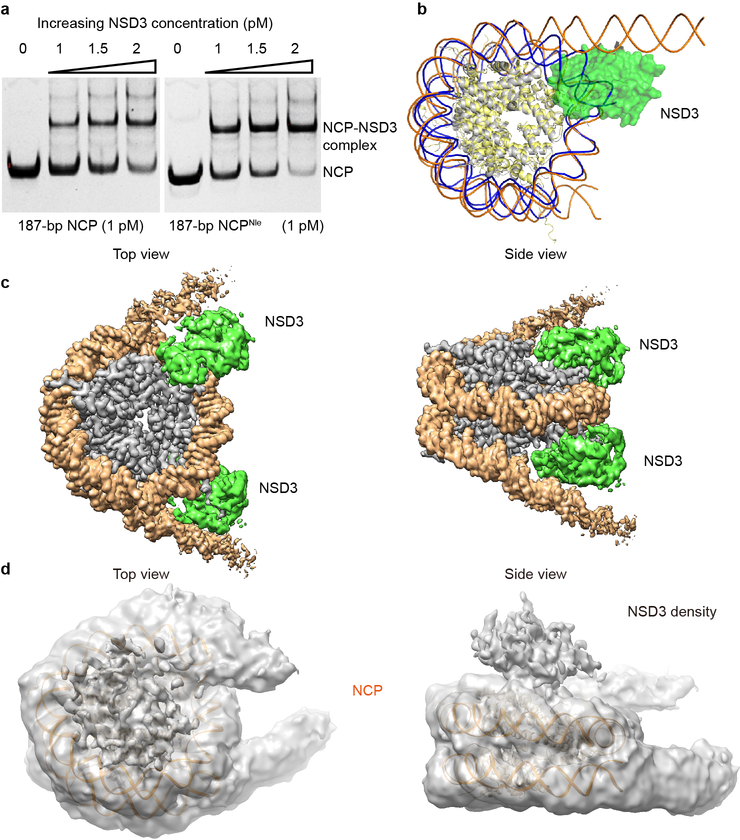
In the cryo-EM structures of both complexes, the AWS, SET, and post-SET domains along with a long N-terminal loop (residues 1066–1093) of NSD3, as well as the NCP with attached linker DNAs, could be clearly identified and built into the model (Fig. 1g). The catalytic segment of NSD3 folds into a compact structure (Fig. 1h) as reported previously5–7. In the NCP-bound NSD3C-E1181K/T1232A complex, two kinds of complex particles exhibiting NCP-NSD3 ratios of 1:1 and 1:2 were observed. For the 1:1 complex, centered at the NSD3 binding side on the NCP, we observed unwrapping of 20-bp nucleosomal DNA from the entry/exit site flanking the 11-bp linker DNA (Fig. 1g, 2a), with NSD3 inserted in-between the unwrapped DNA and the core histones. DNA unwrapping is a prerequisite for NCP to reveal its binding surfaces for NSD3 (Extended Data Fig. 3b). A similar NCP-binding mode has been observed for the yeast Set2 protein15. On the other side of the NCP in the 1:1 complex, the entry/exit DNA remained in its wrapped state (Fig. 1g). For the 1:2 complex, both ends of the entry/exit DNA were unwrapped, with two NSD3 molecules occupying symmetry-related binding sites on a single NCP, resulting in a much more loosely packed NCP (Extended Data Fig. 3c). In both the complexes, NSD3 molecules were in their active states with the substrate H3 fragments tightly bound to their catalytic SET domains. We also observed an inactive state of the NCP-bound native NSD3C, which contacts the bound NCP mainly through the top surface of the nucleosomal disk without unwrapping the DNA ends (Extended Data Fig. 3d), indicating that the NSD3-NCP complex may undergo a transition from the inactive association state to the active catalytic state.
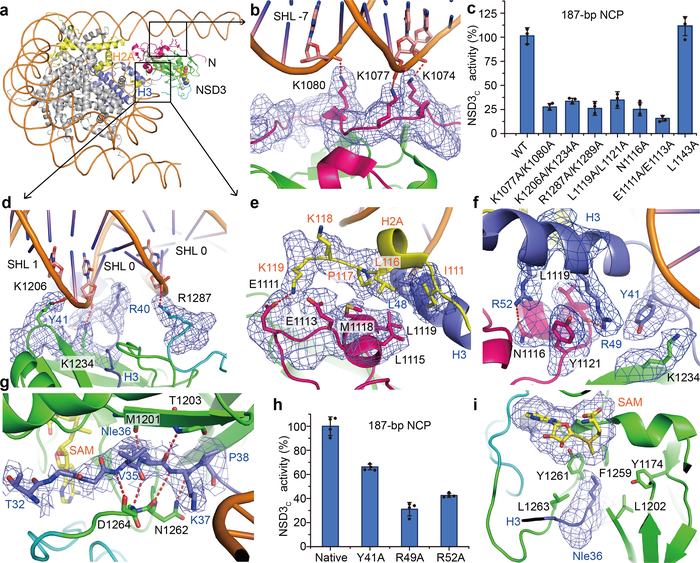
Fig. 2 |.
Details of intermolecular contacts between NSD3-E1181K/T1232A and the nucleosome. a, An overview of the contacts between NSD3 and nucleosomal DNA. NSD3 domains are colored as in Fig.1h. Histone H3 and H2A are colored in blue and yellow, respectively. b, The N-terminal loop of NSD3 interacts with the phosphate backbone of the minor groove at SHL −7. c, Relative catalytic activities of the wild-type (WT) and various mutants of NSD3 on 187-bp NCPs. Activity of the WT NSD3 was set to 100%. d, NSD3 SET and post-SET domains interact with the phosphate backbone of the DNA minor groove at SHLs 1 and 0, respectively. e, NSD3 recognizes the C-terminal region of H2A. f, NSD3 recognizes the N-terminal helix of H3. g, NSD3-SET domain recognizes the N-terminal tail of H3. h, NSD3C showed reduced activities on NCPs bearing mutations on NSD3-interacting residues of H3. i, Nle36 binding pocket in NSD3 SET domain. Data are represented as means ± s.d. from n = 3 (panel c) or n = 4 (panel h) independent samples. The cryo-EM density maps of key residues were contoured at 2σ (panels b and g) or 4σ (panels d, e, f and i) level. Red dotted lines in panels b, d, e, f and g indicate salt bridges or hydrogen bonds.
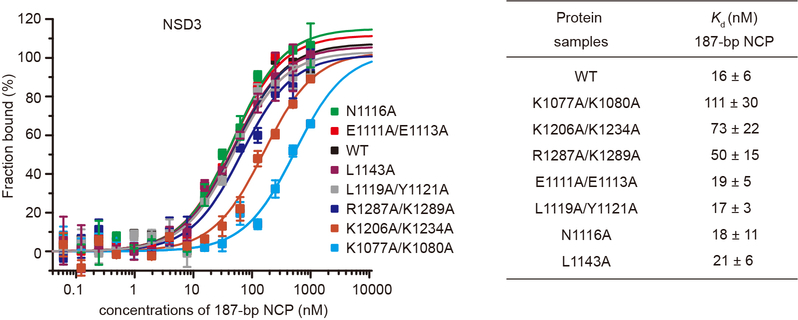
NSD3 contacts both gyres of the nucleosomal DNAs (Fig. 2a). Several basic residues projecting from the long N-terminal loop of NSD3 bind to the unwrapped segment of DNA (Fig. 2a, b). Lys1074 and Lys1077 recognize the phosphate backbone of one strand spanning the DNA minor groove at superhelix location16,17 (SHL) −7, while Lys1080 recognizes the phosphate backbone of the partner strand (Fig. 2b). The interactions between the N-terminal loop and the unwrapped DNA is required for the full activity of NSD3 on NCP, as the K1077A/K1080A dual mutant lost 86% binding affinity and showed a concomitant decrease in catalytic activity towards nucleosomal substrates (Fig. 2c, Extended Data Fig. 4).
NSD3 also binds to the minor groove of the inner gyre of DNA at the site where the histone H3 N-terminal tail enters the nucleosome core (Fig. 2a, d). Lys1206 and Lys1234 from the NSD3-SET domain form salt-bridges with the phosphate backbone of one strand of the DNA minor groove spanning SHLs 0 and 1, with the side-chain of Lys1234 further stabilized through stacking with Tyr41 of H3 (Fig. 2d). Arg1287 from the post-SET domain forms a salt-bridge with the phosphate backbone of the partner strand spanning the DNA minor groove at SHL 0 (Fig. 2d). Interactions within this region of DNA not only stabilize the binding between NSD3 and NCP, but also facilitate positioning the H3 tail into the substrate-binding groove of the NSD3-SET domain. Consistently, K1206A/K1234A and R1287A/K1289A mutants of NSD3 lost 78% and 68% binding affinity and retained 34% and 26% residual catalytic activity, respectively (Fig. 2c, Extended Data Fig. 4).
NSD3 makes extensive intermolecular contacts with a short fragment of histone H2A C-terminus (residues 111–119, Fig. 2a, e), as well as a long fragment of histone H3 that contains the first α helix (residues 44–56, Fig. 2f) and the N-terminal loop (residues 32–43, Fig. 2g). The binding surfaces on the core histones are mainly located on the side of the histone octamer within the NCP disk. The AWS domain of NSD3 reaches into the core histones and contacts H2A C-terminal fragment through both hydrophobic and electrostatic interactions. The hydrophobic side-chains of Leu1115, Met1118 and Leu1119 of NSD3 are directed towards the hydrophobic patch composed of Ile111, Leu116 and Pro117 from H2A and Leu48 from H3 (Fig. 2e). In addition, NSD3 interacts with the basic Lys118-Lys119 fragment of H2A through electrostatic interactions, with Glu1111 of NSD3 forming a salt-bridge with Lys119 of H2A (Fig. 2e). Notably, ubiquitination of H2A at Lys119 would disrupt the interactions and/or introduce steric clashes with NSD318. Consistently, the E1111A/E1113A dual mutation reduced the activity of NSD3 to around 16% (Fig. 2c). Further, the NSD3-AWS domain makes extensive contacts with the first helix of H3. Arg49 and Arg52 from the N-terminal H3 helix formed a hydrogen bond each with Leu1119 and Asn1116 of NSD3, respectively (Fig. 2f). The aromatic ring of Tyr1121 from NSD3 is wedged in-between these two arginine residues, further stabilizing the interaction through hydrophobic stacking (Fig. 2f). The N1116A and L1119A/Y1121A mutations, but not the control L1143A mutation of NSD3 that lay outside of the nucleosome binding surface, reduced the catalytic activity of NSD3 (Fig. 2c). Despite a loss of catalytic activity, mutations that disrupted the NSD3 and histone interface, such as the E1111A/E1113A, N1116A and L1119A/Y1121A mutations, did not noticeably change the binding affinities between NSD3 and NCPs (Extended Data Fig. 4). Nucleosomes containing mutations on histone H3, such as R49A, R52A or Y41A also reduced the catalytic activity of NSD3 to 29–62% (Fig. 2h).
The H3 tail fragment Thr32 to Arg40 lying outside of the nucleosome core traverses across the surface groove between the β strand containing residues 1201–1205 from the NSD3 SET domain and the loop connecting the SET and the post-SET domains (Fig. 2g). Interactions between the H3 tail and the SET domain are mainly mediated by hydrogen bonds between main-chain atoms. Hydrogen bonds between Val35 of H3 and Asp1264 of NSD3, Nle36 of H3 and residues Met1201 and Thr1203 of NSD3, and between Lys37 of H3 and Asn1262 of NSD3 (Fig. 2g), tightly position Nle36 of H3 within the catalytic pocket. The hydrophobic side-chain of Nle36 is pointed towards the methyl donor of the ligand SAM through insertion into a hydrophobic pocked composed of residues Leu1263, Tyr1261, Phe1259, Tyr1174 and Leu1202 of NSD3 (Fig. 2i).
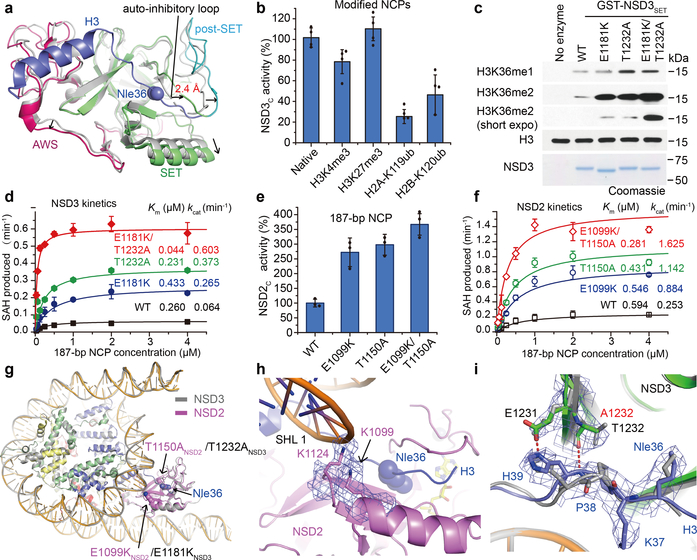
Compared with the apo structure of the compact auto-inhibited NSD3, the NCP-bound activated NSD3 catalytic segment exhibited a relatively extended conformation. When superimposed at the central β strands, the AWS and the post-SET domains, as well as the first helix that lies on the outer surface of the SET domain in the NCP-bound NSD3 shifted outwards away from their counterparts in the apo NSD3 (Fig. 3a). Of note, the loop connecting the SET and post-SET domains which inhibited substrate binding in its apo state, deviated from the H3 binding path by around 2.4 Å, thereby making room for H3 binding (Fig. 3a). Recognition of the H3 tail and the H3-H2A surface, as well as close contacts with the nucleosomal DNA all contribute to stabilizing the active NSD3 catalytic segment in an extended conformation.
Fig. 3 |.
Structural and biochemical analysis of NSD2/3 and their cancer-related mutations. a, Superimposition of the auto-inhibitory structure of the NSD3 catalytic region (PDB ID: 5UPD, colored in grey) with the active NCP-bound NSD3 (colored as described previously). Directions of shifted regions of NCP-bound NSD3 are indicated with black arrows. b, Catalytic activities of NSD3C with NCPs bearing modifications. c, In vitro methylation reactions of wild-type (WT) or mutant NSD3SET on NCPs with non-radiolabeled SAM. No enzyme is used as a negative control. Top panel, Western blots of the reaction products with the indicated antibodies. H3 is shown as a loading control. Bottom panel, Coomassie blue staining of NSD3 proteins. Three independent experiments were done with similar results. For gel source data, see Supplementary Fig. 1. d, Michaelis-Menten titrations of wild-type (WT), E1181K, T1232A, or both E1181K and T1232A mutated NSD3C with 187-bp NCPs. e, Catalytic activities of wild-type (WT) and several cancer-related mutations of NSD2 with 187-bp NCPs. f, Michaelis-Menten titrations of wild-type (WT), E1099K, T1150A, or both E1099K and T1150A mutated NSD2 with 187-bp NCPs. g, Overlapped NCP-bound structures of NSD2 (colored in pink) and NSD3 (colored in grey). Positions of E1099K and T1150A mutations in NSD2, and their corresponding E1181K and T1232A mutations in NSD3 are indicated with black arrows. h, A zoomed view of the E1099K mutation site in the NSD2-NCP complex. i, Comparison of the structural differences between the superimposed NCP-bound native NSD3 (colored in grey) and the T1232A-mutated NSD3 (colored as described above). Data are presented at means ± s.d. from n = 4 (panel b) or n = 3 (panels d, e and f) independent samples. The cryo-EM density maps of key residues in panels h and i are contoured at 4σ level.
We then tested the impact of several histone modifications on the activity of NSD3. We found that H2A ubiquitination at Lys119 resulted in a 75% loss of activity of NSD3, consistent with a previous report18 (Fig. 3b). H2B ubiquitination at Lys120 also resulted in a 54% loss of activity of NSD3 (Fig. 3b), which is different from MLL1 and Dot1L, whose activities are stimulated by H2B ubiquitination19. H2B ubiquitination may interfere with the NSD3-NCP association in their inactive state (Extended Data Fig. 3d). H3 tri-methylation at Lys4 also decreased the catalytic activity of NSD3 to 78% (Fig. 3b), which correlated with the finding that the last PHD finger of NSD3 preferred unmodified Lys4 of H320. In contrast, H3 trimethylated at Lys27 did not noticeably change the catalytic activity of NSD3 (Fig. 3b).
NSD mutations, such as the E1099K mutation in NSD2 is a recurrent gain-of-function mutation that has been implicated in the etiology of pediatric acute lymphoblastic leukemia8–11. Similarly, T1150A substitution in NSD2 and the equivalent T1232A mutation in NSD3 are also detected in cancer studies21,22. In NSD3, we found that both the E1181K and T1232A mutants individually generated more H3K36 dimethylation on NCPs than the wild-type protein did, with the E1181K/T1232A dual mutant generated even more methylation modifications (Fig. 3c). Both the E1181K and T1232A mutants of NSD3 displayed similar Km values on 187-bp NCPs as that of the wild-type protein but exhibited 4.1- and 5.8-fold higher kcat values (Fig. 3d, Extended Data Table 1), respectively, indicating that these mutations mainly enhanced the turnover rate of NSD3 on NCPs. For the E1181K/T1232A dual mutant, the Km value is reduced to 17% while the kcat value is 9.4-fold higher, indicating that the added effects of both gain-of-function mutations turned NSD3 into a much more efficient enzyme (Fig. 3d, Extended Data table 1). Similarly, NSD2 activity increased above wild-type with E1099K, T1150A and E1099K/T1150A substitutions (Fig. 3e). NSD2 (661–1365) (named NSD2C) is a much more active enzyme that displayed a 4.0-fold higher turnover rate on 187-bp NCPs relative to that of NSD3 (Fig. 3d, f). The E1099K, T1150A and E1099K/T1150A mutations of NSD2 increased the kcat values of NSD2C by 3.5-, 4.5- and 6.4-fold (Fig. 3f, Extended Data Table 1), respectively, indicating that in addition to the already known E1099K gain-of-function mutation, T1150A individually or in combination also renders NSD2 a more active enzyme.
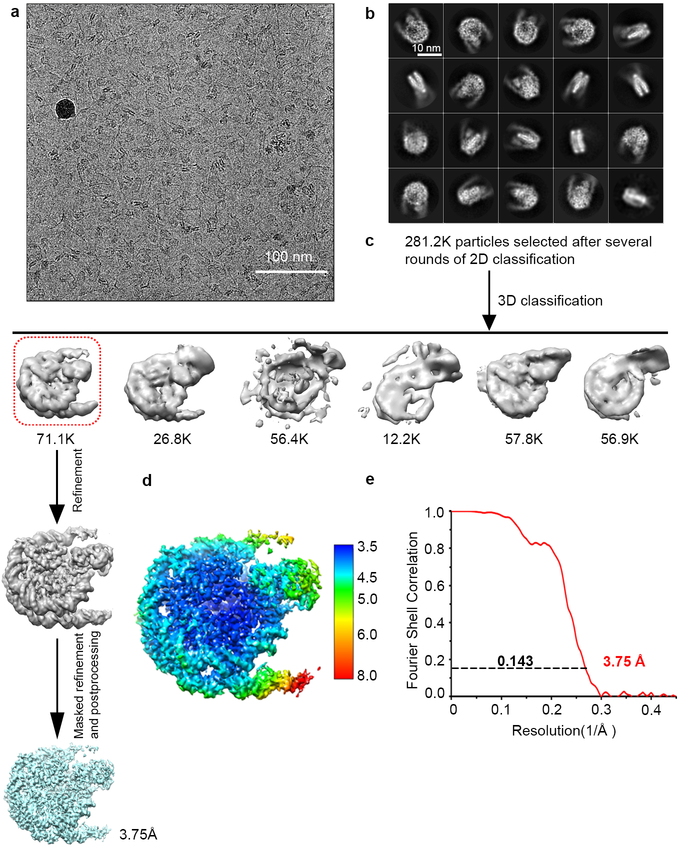
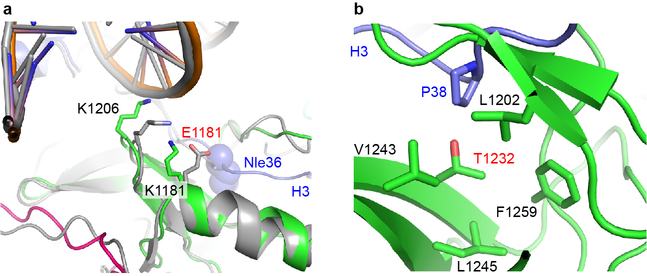
We then solved the cryo-EM structure of NSD2C bearing E1099K/T1150A dual mutation complexed with Nle-substituted 187-bp NCP at the resolution of 3.75 Å (Extended Data Fig. 5). Except for minor differences in loop regions, the NSD2-NCP complex superimposed well with the NSD3-NCP complex (Fig. 3g). In the structure of the NSD2-NCP complex, Glu1099 of NSD2 is positioned close to the nucleosome DNA at SHL 1 (Fig. 3h), with a similar position also seen for the corresponding Glu1181 of NSD3 in its NCP-bound complex (Extended Data Fig. 6a). The E1099K mutation in NSD2 reverted Glu1099 from a negatively charged residue to a positively charged counterpart, which on partnering with Lys1124, increased the electrostatic interactions between NSD2 and the nucleosome, resulting in an enhanced activity.
For Thr1232 of NSD3, in the structure of the native NSD3-NCP complex, the hydrophilic side-chain is inserted into a hydrophobic pocket composed of the side-chains of Val1243, Leu1245, Phe1259, Leu1202 of NSD3 and Pro38 of H3 (Extended Data Fig. 6b). When mutated to an alanine, possibly due to a smaller size and the hydrophobic nature of the side-chain of an alanine, the main-chains of Pro38-His39 fragment of H3 moved by around 1.4 Å closer to the mutated Ala1232-containing region of NSD3 in the NCP-bound NSD3C-E1181K/T1232A complex, resulting in formation of a pair of newly created hydrogen bonds between the main-chain atoms of the mutated Ala1232 of NSD3 and His39 of H3, and the side-chain atoms of Glu1231 of NSD3 and His39 of H3 (Fig. 3i). The newly created interactions could facilitate insertion of the adjacent H3K36 into the NSD3 catalytic pocket, thereby leading to enhanced activities. A similar mechanism may also apply to the T1150A mutation in NSD2.
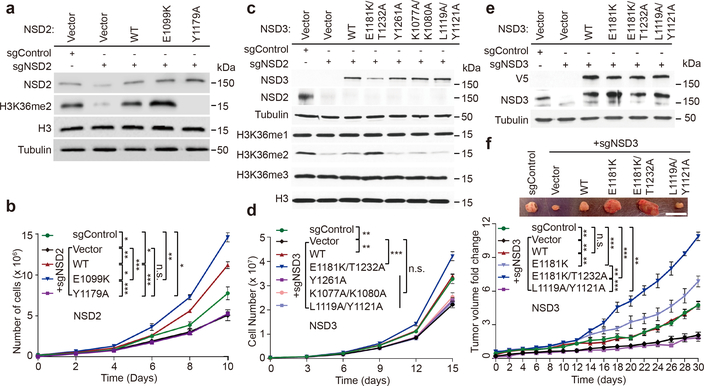
We next tested the activity of different gain-of-function and loss-of-function structure-guided and cancer-associated mutants in cells. NSD2 is the principal physiologic enzyme that generates H3K36 dimethyl marks in most cell lines1,3. Indeed, NSD2 knockdown in U2OS cells resulted in H3K36me2 depletion and reduced cellular proliferation, both of which could be restored by complementation with wild-type NSD2 and NSD2-E1099K, but not with catalytically dead NSD2 (Fig. 4a, b). Notably, NSD2-E1099K increased both the H3K36me2 levels and cell proliferation rates above those seen in control and wild-type NSD2 reconstituted cells (Fig. 4a, b).
Fig. 4 |.
Regulation of cancer cell phenotypes by NSD2/3 catalytic activity. a, b, NSD2 enzymatic activity is required for NSD2-dependent proliferation of human bone osteosarcoma cells (U2OS). (a) Western analysis and (b) cell growth rates of control or NSD2-depleted U2OS cells complemented with CRISPR-resistant wild-type NSD2 (WT), enzymatically hyperactive NSD2 (E1099K), enzymatically inactive NSD2 (Y1179A), or vector are shown. *p<0.05, **p < 0.01, ***p < 0.001, n.s., not significant, two-tailed unpaired Student’s t test. c, Structure-guided NSD3 mutations regulate H3K36me2 generation in cells. Western analysis with the indicated antibodies of whole cell lysates from NSD2-deficient HT1080 cells (to deplete endogenous global H3K36me2 levels) expressing NSD3 wild-type or mutant proteins as indicated. Whole cell lysate without NSD2 depletion is shown as a control. Vector: control transfection. d, NSD3 enzymatic activity regulates NSD3-dependent proliferation in Head and Neck Squamous Cell Carcinoma (HNSCC) cells. Cell proliferation rates of NSD3-depleted UD-SCC-2 HNSCC cells complemented with the indicated NSD3 derivatives. Vector alone and control knockdowns are shown as controls. **p < 0.01, ***p < 0.001, n.s., not significant, two-tailed unpaired Student’s t test. e, f, Hyperactive NSD3 catalytic activity promotes NSD3-dependent xenograft tumor growth in HNSCC cells. (e) Western analysis and (f) xenograft tumor growth rates of control or NSD3-depleted UD-SCC-2 cells complemented with the indicated CRISPR-resistant NSD3 constructs (n = 5 mice, for each treatment group). Top panel: Macroscopic picture of representative tumors from each of the six groups are shown. Scale bar, 1.5 cm. Bottom panel: Tumor growth measurements, analysis, **p < 0.002; ***p < 0.0001, n.s., not significant by two-way ANOVA with Tukey’s testing for multiple comparisons. Data are represented as means ± s.d. from n = 3 biological independent samples in panels b and d, or n = 5 biological independent mice. For detailed p values in panel b, d and f, see Methods section. For panels a, c and e, similar results were observed from three independent experiments. For gel source data, see Supplementary Fig. 1.
Next, to investigate NSD3 H3K36 methylation in cells, we used HT1080 cells depleted of NSD2, which results in a major decrease in total H3K36me2 (Fig. 4a, c). In these NSD2-depleted cells, we overexpressed wild-type NSD3, the E1181K/T1232A double mutant, and various loss-of-function mutants and analyzed H3K36me2 levels. NSD3-E1181K/T1232A expression caused an increase in global H3K36me2 (Fig. 4c), essentially reconstituting loss of NSD2. In contrast, expression of the structure-based mutants, K1077A/K1080A and L1119A/Y1121A, behaved like the catalytically dead mutant Y1261A and failed to increase the levels of H3K36me2 in cells3 (Fig. 4c).
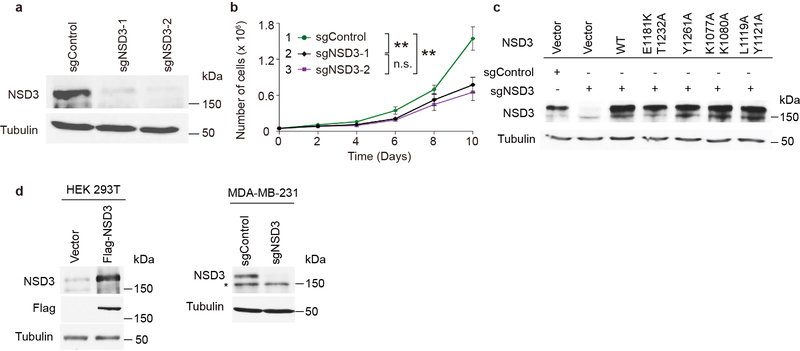
Amplification of NSD3 is frequently observed in Head and Neck Cancer23. Depletion of NSD3 by two independent sgRNAs in the Head and Neck cancer UD-SCC-2 cell line resulted in decreased proliferation of the cells (Extended Data Fig. 7a, b). Complementation of NSD3 knockdown cells with wild-type NSD3 reconstituted proliferation of the cells, whereas the catalytic-dead mutant Y1261A failed to do so (Fig. 4d, Extended Data Fig. 7c). In addition, both the K1077A/K1080A and L1119A/Y1121A mutants that exhibited a decrease in catalytic activity also failed to reconstitute cancer cell proliferation, whereas complementation with the hyperactive NSD3-E1181K/T1232A mutant reconstituted cell proliferation at a rate above that of wild-type cells (Fig. 4d). Further, the ability of UD-SCC-2 cells to form xenograft tumors was inhibited by NSD3 depletion (Fig. 4e, f), while reconstitution with wild-type NSD3, but not with catalytically deficient L1119A/Y1121A mutant, restored xenograft tumor growth to levels observed with the control cells (Fig. 4e, f). Strikingly, complementation of NSD3-depleted UD-SCC-2 cells with NSD3-E1181K and NSD3-E1181K/T1232A greatly accelerated tumor growth above control or wild-type NSD3-reconstituted tumors, with the tumors expressing the hyperactive double mutant growing the fastest (Fig. 4e, f).
Overall, the structural and biochemical analyses of NSD2 and NSD3 in their NCP contexts provide a molecular basis for the nucleosomal preference and activation mechanism of NSD proteins, as well as the enhanced activities of key cancer-associated mutants. Given activating mutations and up-regulation of NSD proteins can both drive tumor progression1,2, the NSD family of histone lysine methyltransferases are viewed as promising targets for the treatment of several cancer types. Indeed, extensive efforts have been made to identify inhibitors to target the catalytic domain of NSD proteins prior to the resolution of an NCP-bound activating complex structure5,7,24–26. The molecular mechanisms shown in this study should provide valuable information for drug design and development in treating NSD-associated neoplastic diseases.
Online content
Any methods, additional references, extended data files, supplementary information, Source Data file, Nature research reporting summaries, acknowledgements, author contributions and competing financial interests, and statements of data availability are available online.
METHODS
No statistical methods were used to predetermine sample size. The experiments were not randomized and the investigators were not blinded to allocation during experiments and outcome assessment.
Protein Expression and Purification.
Full length human NSD2/3 and its truncations or mutants were cloned into a modified pFASTbac vector with an N-terminal 6×His-MBP-TEV tag. Bacmid, virus and protein production were conducted following a standard Bac-to-Bac baculovirus expression protocol. Sf9 cells infected by p2 viruses were harvested by centrifugation (1500 g, 4 °C, 20 min), re-suspended in lysis buffer (500 mM NaCl, 20 mM Tris-pH 9.0, 20 mM imidazole-pH 9.0, 10% glycerol and 1 mM PMSF) at 4 °C and then sonicated for around 5 min. The soluble fraction of the cells was harvested by centrifugation of the cell lysate at 18,000 rpm for 1 h. Histidine-MBP-TEV-tagged target protein was isolated through a nickel-charged HiTrap Chelating FF column from GE Healthcare. The samples were diluted to half the initial salt concentration (250 mM NaCl), and then were loaded directly onto a heparin column to remove bound DNA. Target protein was separated by increasing the salt concentration from low salt buffer (20 mM Tris-pH 7.0, 200 mM NaCl, 2 mM DTT) to the same buffer containing 1 M NaCl through a linear gradient. The histidine-MBP tag was cleaved by incubating with histidine-tagged TEV proteases overnight and removed by loading the solution to a nickel column again. Target protein was further purified by a hiload 200 16/600 gel-filtration column equilibrated with the running buffer (500 mM NaCl, 20 mM HEPES-pH 9.0, 2mM DTT, 10% glycerol). Purified proteins were concentrated to around 20 mg/ml and stored in a −80 °C freezer.
Nucleosome preparation.
Expression and purification of wild-type and mutant forms of Xenopus laevis histones were conducted following the standard protocols as described27,28. In brief, histones were expressed in the E. coli strain BL21 (DE3) at 37 °C and collected as inclusion bodies. After purifications through a SP sepharose HP (GE Healthcare) column in the denaturing buffer (20 mM NaAc-pH 5.2, 7 M urea, 0.2–1 M NaCl, 1 mM EDTA and 5 mM 2-mercaptoethanol), the histone proteins were dialyzed thoroughly against distilled water containing 2 mM 2-mercaptoethanol, and were then lyophilized and stored at −80 °C. Norleucine-substituted histone H3 was prepared following the protocol as described14. In short, the norleucine-substituted histone H3 was expressed in the methionine auxotrophic strain B834 (DE3) in M9 media. When OD600 of the cells reached around 1.0, 60 mg/l norleucine was added to the media. After shaking for 1 h at 37 °C, the cells were induced with addition of 0.2 mM IPTG and shook overnight at 37 °C.
The 147-bp Widom 601 DNA sequence29 and 187-bp DNA sequence30 for nucleosome reconstitution were cloned and purified as described27.
Nucleosome core particles containing either unmodified or norleucine-substituted H3 were reconstituted as described previously27,28. In brief, histone octamer was prepared by mixing H2A, H2B, H3 and H4 in refolding buffer containing 2 M NaCl. Histone octamer was isolated from size exclusion chromatography, concentrated and stored at −80 °C. Nucleosomes were prepared by mixing histone octamers and purified Widom 601-containing DNAs (147/187-bp) at high salt buffer followed by salt gradient dilution for 36 h. Pure nucleosomes were separated by passing through a HiTrap DEAE sepharose FF anion exchange column (GE Healthcare). Purified nucleosomes were then dialyzed thoroughly against HCS buffer (20 mM HEPES 7.5, 1 mM EDTA, 1mM DTT), concentrated to around 5 mg/ml and stored at 4 °C.
Recombinant 147-bp human nucleosomes without modification (catalog: 16–0006) or with tri-methylation at Lys4 of H3 (H3K4me3, catalog: 16–0316), trimethylation at Lys27 of H3 (H3K27me3, catalog: 16–0317), mono-ubiquitination at Lys119 of H2A (H2AK119ub, catalog: 16–0363) or mono-ubiquitination at Lys120 of H2B (H2BK120ub, catalog: 16–0370) were purchased from EpiCypher company.
Electrophoretic mobility shift assay.
NSD3 (680–1437) was mixed with 1 pmol NCP or NCPNle at the molar ratio of 1:0, 1:1, 1:1.5 and 1:2 to a total volume of 10 μl. After incubation on ice for 30 min in EMSA buffer (20 mM Tris-pH 7.5, 50 mM NaCl, 2 mM DTT, 0.1% Triton, 10 μM SAM), the samples were loaded onto a 6% native TBE gel at 4 °C. Electrophoresis was performed at 4 °C for 1.5 h at a constant voltage of 120 V. The resulting gels were visualized by ethidium bromide staining.
In vitro methylation reactions.
For NSD3, radioactive in vitro methylation reactions were performed by incubating 3 μg nucleosome, 1.7 μg 6xHis-MBP-tagged NSD3 (680–1437) or its mutants at the molar ratio of 1:1 in the reaction buffer containing 50 mM Tris-pH 8.0, 20 mM KCl, 30 mM MgCl2 and 10% Glycerol. After adding 1 μCi 3H-SAM (PerkinElmer), the mixture was incubated at room temperature for 24 h. The samples were separated by SDS-PAGE and the tritium scintillation of 3H-methylation was measured by a Hidex 300 SL Automatic liquid scintillation counter. All the reactions were done in triplicate. The methylation reactions of NSD2 were done similarly as above, except that the molar ratio of 6xHis-MBP-tagged NSD2 (661–1365) or its mutants to nucleosomes was set to 1:4, with the incubation time shortened to 1–2 h due to the high activity of NSD2.
Non-radioactive in vitro methylation assays were performed as previously described31 using 2 μg of enzyme and 2 μg of recombinant nucleosomes (EpiCypher, catalog: 16–2004) in the presence of non-radiolabeled SAM.
Kinetic assays.
The MTase-Glo Methyltransferase Assay kit (Promega) was used to measure the Km and kcat values of NSD2/3 on NCPs as described14,32. In detail, for wild-type and mutant forms of NSD3 (680–1437), 100 nM protein containing 40 μM SAM was prepared in the reaction buffer containing 50 mM Tris-pH 8.0, 20 mM KCl, 30 mM MgCl2 and 10% Glycerol. Nucleosomes were serially diluted to half the concentration from 4 μM to 62.5 nM. To initiate the reaction, 10 μl NSD2/3 was mixed with 10 μl nucleosome that contained 20 μM SAM, and incubated at 32 °C. At the time points of 5, 10, 15 and 20 min, 8 μl samples were taken and quenched by adding 2 μl 5% trifluoroacetic acid (TFA, Sigma). Then 2 μl MTase-Glo Reagent (6x) was added to convert SAH to ADP and 12 μl MTase-Glo Detection solution was added to transform ADP to ATP, which was detected via a luciferase reaction. The samples were transferred to a white 384-well microplate (Corning) and the luminescence values were detected by Tecan Infinite F200. The luminescence intensities were correlated to the concentrations of SAH through a standard curve of SAH. The initial rates of the reactions were calculated through a linear regression fit of the data. Kinetic parameters (Km and kcat) were determined by fitting the initial rates to the Michaelis-Menten equation using the Origin software. All reactions were done in triplicates.
Kinetic assays of 6xHis-MBP-tagged NSD3 (680–1437) for 147-bp nucleosomes were done similarity as that for 187-bp nucleosomes, except that a higher concentration of NSD3 (200 nM) was used.
Mircoscale thermophoresis (MST) assays.
All Mircoscale thermophoresis (MST)-based experiments were performed on a Monolith NT115 machine with 80% MST power and 100% LED power. All the proteins used in this assay have a 6xHis-MBP-TEV tag at the N-terminus. Monolith His-tag Labeling Kit RED-tris-NTA (Nano Temper) was used to label the His-tagged proteins. For each reaction, 10 μM protein and 25 nM fluorescent dye were dissolved in 100 μl buffer containing 50 mM NaCl, 20 mM HEPES-pH 7.5, 1 mg/ml BSA, 0.05% Tween-20, 50 μM SAM and 2 mM DTT, and incubated at room temperature for 30 min. The nucleosomes were serially diluted in PCR tubes from 2 μM to 15.25 pM, then equal volumes of labeled-proteins were added. After incubating for another 10 min, the samples were transferred into capillaries (Monolith NT115 Standard Treated Capillaries, MO-K002) in sequence. Dissociation constants (Kd) were fitted with the MO Affinity Analysis software.
Immunoblot analysis.
The following antibodies were used in this study: NSD2 (Antibody for NSD2 was generated as previously described4; 1:1,000 dilution), NSD3 (Protein fragment corresponding to residues 1021–1320 of NSD3 (Q9BZ95) was used as the epitope to generate antiserum in Genemed Synthesis Inc., antiserum purification was performed with immortalized epitope for NSD3 specific antibody; 1:1,000 dilution), H3K36me1 (Abclonal; 1:5,000 dilution), H3K36me2 (Thermo Fisher Scientific; 1:1,000 dilution), H3K36me3 (Thermo Fisher Scientific; 1:1,000 dilution), H3 (Abcam; 1:5,000 dilution), Tubulin (Millipore; 1:5,000 dilution), Flag (Sigma Aldrich; 1:1,000 dilution), anti-rabbit and anti-mouse peroxidase-conjugated antibodies (Jackson Immunoresearch; both 1:5,000 dilutions). Western blots were visualized by chemiluminescence (GE Healthcare). NSD3 antibody validation is shown in Extended Data Fig. 7d.
Cell culture.
HEK 293T (ATCC), HT1080 (ATCC), MDA-MB-231 (ATCC) and UD-SCC-2 (Generously provided by John Sunwoo’s lab at Stanford University) cells were cultured in Dulbecco’s modified Eagle’s Medium (DMEM, Life Technologies) supplemented with 10% fetal bovine serum, 2 mM L-glutamine and penicillin–streptomycin (Life Technologies). All cells were cultured at 37 °C in a humidified incubator with 5% CO2. All above cell lines were authenticated and declared mycoplasma free by ATCC.
Transfection and Viral Transduction.
Transient expression was performed using TransIT-293 (Mirus Bio) following the manufacturer’s protocol. For CRISPR-Cas9 knockouts, virus particles were produced by co-transfection of 293T cells with the lentiCRISPRv2/puro (Addgene) construct expressing indicated sgRNAs, psPAX2 and pCMV-VSVg in a ratio of 5:3:2 by mass. After 48 h of transfection, target cells were transduced with 0.45 μm filtered viral supernatant and 8 μg/ml polybrene. Cells were selected 24 h after media replacement with 2 μg/ml puromycin. The sequences of the single guide (sg)RNAs are as follows: control sgRNA 5′-CTTCGAAATGTCCGTTCGGT-3′, NSD2 sgRNA 5′-ACTCGTTAACAAATTCTCCC-3′, NSD3 sgRNA 5′-GGATACTGATTATATGAC-3′. For NSD3 overexpression (in HT1080 cells) or reconstitution (in UD-SCC-2 cells), virus particles were produced by co-transfection of 293T cells with pLenti CMV Hygro DEST (W117–1) (Addgene) constructs, psPAX2 and pCMV-VSVg in a ratio of 5:3:2 by mass. After 48 h of transfection, target cells were transduced with 0.45 μm filtered viral supernatant and 8 μg/ml polybrene. The subsequent selection was carried out with 250 μg/ml hygromycin.
Cell Proliferation Assay.
Cells were seeded at 5 × 10⁵ cells/ml in triplicate in 6-well plates. Cell counts were acquired by Countess II FL Automated Cell Counter (Thermo Fisher Scientific) at indicated time point for 15 days. After each counting, the cells were split in a 1:2 ratio. Trypan blue was used to stain non-viable cells. To analysis the impact of NSD2 in U2OS cells, control and the NSD2-depleted cells complemented with CRISPR-resistant wild-type or mutants of NSD2, or the empty vector were generated as the following: 1. sgControl, 2. sgNSD2 + vector, 3. sgNSD2 + Wild-type NSD2, 4. sgNSD2 + NSD2 with E1099K mutation, 5. sgNSD2 + NSD2 with Y1179A mutation. The p values between cells are listed as the following: p (1 vs. 2) = 0.0118, p (1 vs. 3) = 0.012, p (1 vs. 4) = 0.001, p (1 vs. 5) = 0.0455, p (2 vs. 3) = 0.001, p (2 vs. 4) = 0, p (2 vs. 5) = 0.9797, p (3 vs. 4) = 0.018, p (3 vs. 5) = 0, p (4 vs. 5) = 0. To analyze the impact of NSD3 in UD-SCC-2 HNSCC cells, control and the NSD3-depleted cells complemented with NSD3 derivatives, or empty vector were generated as the following: 1. sgControl, 2. sgNSD3 + vector, 3. sgNSD3 + wild-type NSD3, 4. sgNSD3 + NSD3 containing E1181K/T1232A mutation, 5. sgNSD3 + NSD3 containing Y1261A mutation, 6. sgNSD3 + NSD3 containing K1077A/K1080A mutation, 7. sgNSD3 + NSD3 containing L1119A/Y1121A mutation. The p values between the cells are listed below: p (1 vs. 2) = 0.0014, p (2 vs. 3) = 0.0003, p (2 vs. 4) = 0.0001, p (2 vs. 5) = 0.1476, p (2 vs. 6) = 0.0644, p (2 vs. 7) = 0.4236.
Xenograft.
UD-SCC-2 cells-derived xenograft tumors were generated by transplanting cells (control, NSD3 depleted, and reconstituted cell lines) mixed with matrigel (1:1) into the flanks of immunocompromised nude mice. When tumors became palpable, they were calipered every 2 days to monitor growth kinetics. Tumor volume was calculated using the formula: Volume = (width)2 x length/2, where length represents the largest tumor diameter and width represents the perpendicular tumor diameter. Control and the NSD3-depleted UD-SCC-2 cells complemented with the indicated CRISPR-resistant NSD3 constructs, or empty vector are generated as below: 1. sgControl, 2. sgNSD3 + vector, 3. sgNSD3 + wild-type NSD3, 4. sgNSD3 + NSD3 containing E1181K mutation, 5. sgNSD3 + NSD3 containing E1181K/T1232A mutation, 6. sgNSD3 + NSD3 containing L1119A/Y1121A mutation. The p values between tumors are listed below: p (1 vs. 2) = 0.0001, p (1 vs. 3) = 0.7779, p (1 vs. 4) = 0, p (1 vs. 5) = 0, p (1 vs. 6) = 0.0002, p (2 vs. 3) = 0.0045, p (2 vs. 6) = 0.9879, p (3 vs. 4) = 0.0008, p (4 vs. 5) = 0.0005, p (5 vs. 6) = 0. Housing conditions for the mice: temperatures of 65–75 F (~18–23 °C) with 40–60% humidity and 12 light/12 dark cycle was maintained. All animal procedures for animals housed in Stanford were reviewed and approved by Stanford Institutional Animal Care and Use Committee (IACUC 33118, PI: Gozani). Per mouse (~25 g weight), the maximum tumor volume allowed by our IACUC is 2.46 cm3, and the maximum diameter allowed is 1.7 cm. In none of the experiments were these limits exceeded.
Cryo-EM sample preparation and data collection.
Wild-type or E1181K/T1232A-mutated NSD3 (680–1437) was mixed with nucleosomes at a molar ratio of 3:1 in the buffer containing 50 mM NaCl, 20 mM HEPES at pH 7.5, 50 μM SAM and 2 mM DTT at 4 °C for 10 min. Then glutaraldehyde (Sigma) was added into the buffer to a final concentration of 0.05%. After incubating the samples on ice for another 10 min, the cross-linking reaction was quenched by adding buffer containing 100 mM Tris at pH 7.5.
The cross-linked samples were centrifuged at 14000 rpm, 4 °C for 10 min, then loaded onto a Superose 6, 10/300 GL column (GE Healthcare) equilibrated in buffer containing 50 mM NaCl, 20 mM Tris at pH 7.5 and 2 mM DTT. Peak fractions were pooled and concentrated. For cryo-EM sample preparation, NSD3-NCP complexes were concentrated to 300 ng/μl.
Samples of the NSD2-NCP complex for cryo-EM study were prepared similarly as that for the NSD3-NCP complex, except that a 6xHis-MBP tag was attached to the N-terminus of NSD2 to stabilized the NSD2-NCP complex.
The cryo-EM grids were prepared by applying 3 μl aliquot of sample to a glow-discharged Quantifoil, R1.2/1.3 200-mesh copper holy carbon grid (Quantifoil, Micro Tools GmbH, Germany), and then blotted for 3 s before plunged into liquid ethane using FEI Mark IV Vitrobot (Thermo Fisher) operated at 8 °C and 100% humidity. Micrographs were acquired on a Titan Krios microscope, operated at 300 kV, equipped with a K2 Summit direct electron detector (Gatan), using a slit width of 20 eV on a GIF-BioQuantum energy filter. SerialEM software (Thermo Fisher) was used for automated data collection under super-resolution mode, with a nominal magnification of 130,000 X, yielding a pixel size of 1.08 Å. The defocus range was set from −1.2 μm to −2.2 μm. Each micrograph was dose-fractioned to 32 frames under a dose rate of 9.6 e-/pixel/s, with a total exposure time of 5.76 s, resulting in a total dose of about 50 e-/Å2.
Image processing.
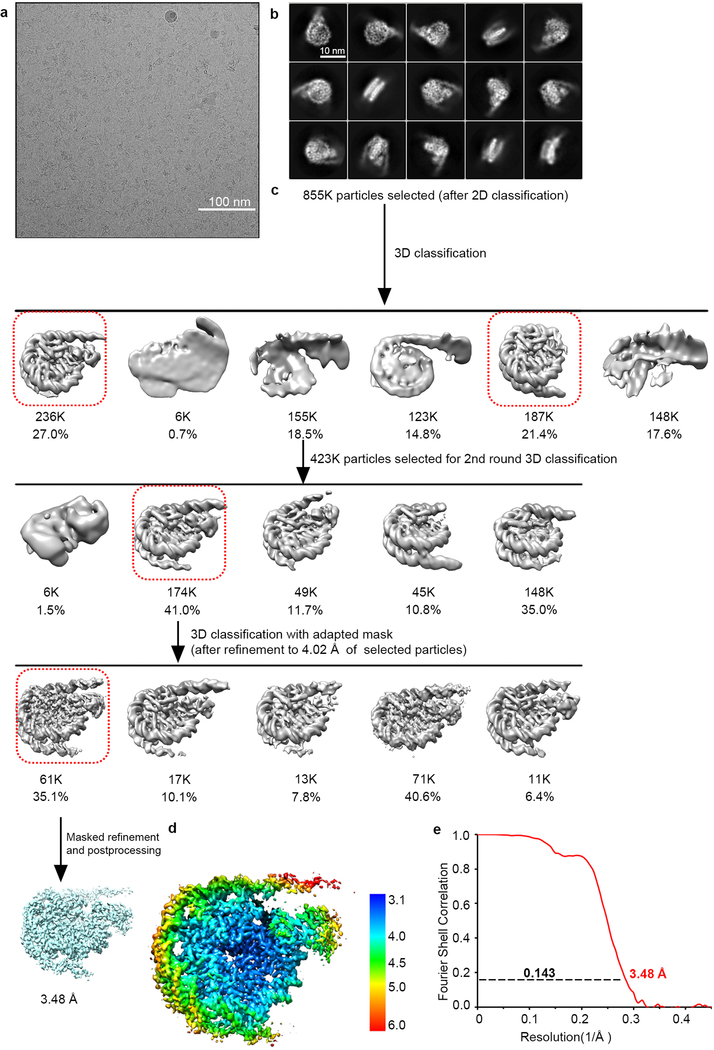
Motion correction and dose-weighted motion correction were performed using MotionCor2 program33. CTF parameters were estimated using the GCTF program34. For native NCP-NSD3C complex, 1,112,821 particles were automatically picked and binned 4 times extracted from 2511 micrographs using RELION35,36, and then subjected to a series of 2D and 3D classifications (Extended Data Fig. 1a–c). After 2 rounds of 2D classification, a total number of 855,037 apparent NCP-NSD3C particles were selected for 3D classification. The initial model was generated by RELION and low-pass-filtered to 60 Å as a 3D reference. After 2 rounds of 3D classification, particles corresponding to NCP-NSD3C complexes were selected and re-extracted into the original pixel size of 1.08 Å (box size 216) from dose-weighted images. 3D refinement was carried out from the selected 173,689 particles, resulting in an overall density map with a resolution of 4.02 Å. To improve the resolution, the refined particles with the coordinate information were subjected to another round of 3D focused classification without alignment. One class (61,058 particles) with better density in both NSD3 and NCP was selected for final 3D refinement with the application of a soft mask, yielding a density map of 3.95 Å. After correction for the modulation transfer function of K2 detector, and map sharpening using post-processing options in RELION with a B-factor of −119 Å2, the overall resolution of final density map within the region defined by the soft mask is 3.48 Å (Extended Data Fig. 1c–e).
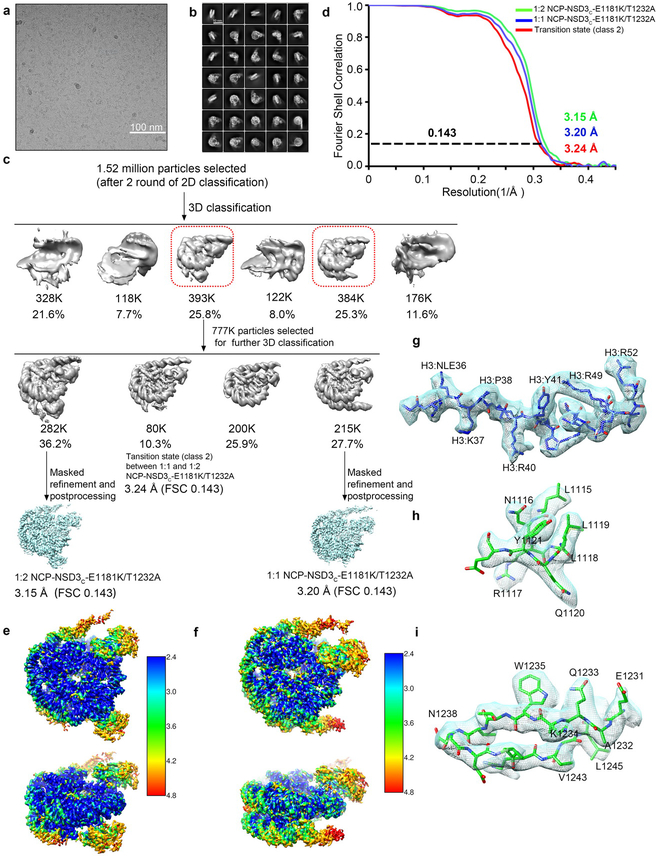
For the NCP-NSD3C-E1181K/T1232A complex dataset, a total number of 3,625 movie stacks were acquired (Extended Data Fig. 2a). Motion correction, electron-dose weighting and two-fold binning were done by MotionCor2. The motion corrected images were processed similarly (Extended Data Fig. 2a–c). 2.28 million particles were auto-picked using Relion. 1.52 million particles were selected after 2 rounds of 2D classification. Two major binding modes (1:1 and 1:2) were observed from the first round of 3D classification, while the other classes were discarded as junk particles. Each of the two binding modes cover similar ratios. The two classes were combined together (777 K particles) and subjected to another round of 3D classification. After the second round of 3D classification, the class of the 1:2 NCP-NSD3C-E1181K/T1232A complex (approximately 282 K particles) was subjected to high-resolution refinement, resulting in a final density map at a resolution of 3.15 Å. The class of the 1:1 NCP-NSD3C-E1181K/T1232A complex (approximately 215 K particles) was refined to 3.20 Å. Besides the above two classes, another class (class 2) is defined as the transition stage which lies between 1:1 and 1:2 binding states, that means, two NSD3C-E1181K/T1232A proteins bind to one NCP, but one of the NSD3C-E1181K/T1232A density is very weak. The major density of this class shows high quality and was refined to a resolution of 3.24 Å (Extended Data Fig. 2c–i).
For the NCP-NSD2C-E1099K/T1150A complex dataset, 1,388 micrographs were collected (Extended Data Fig. 5a). Motion correction and image processing were similar to the native NCP-NSD3C and NCP-NSD3C-E1181K/T1232A datasets. 910 K particles were auto-picked using Relion. After 5 rounds of 2D classification, 281.2 K particles were selected for further 3D classifications (Extended Data Fig. 5b–c). One round of 3D classification later, 71.1 K particles were selected for auto-refinement. The overall resolution of the NCP-NSD2C-E1099K/T1150A complex is 3.75 Å after refinement with an added soft mask and post-processing (Extended Data Fig. 5c–e).
The local resolution map was created using ResMap37 and represented using UCSF Chimera38. All reported resolutions are based on the gold-standard FSC 0.143. The final FSC curve was corrected for the effect of a soft mask using high-resolution noise substitution.
Model building, refinement, and validation.
Model building was performed using the map of NCP-NSD3C from NCP-NSD3C dataset, map of NCP-NSD2C-E1099K/T1150A and the density maps of 1:1 and 1:2 NCP-NSD3C-E1181K/T1232A complexes. The transition stage (class 2) density map that shows better density quality at the H3 tail and NSD3 part was also used for modeling.
The NCP model was built based on the crystal structure of the 147-bp NCP structure (PDB code 3MVD)17, while the crystal structure of NSD1 SET domain (PDB code 3OOI)6 and the apo NSD3 SET domain structures (PDB code 5UPD) were used as the NSD3 models. Each subunit was manually fitted into the density map in Chimera, followed by manual rebuilding in Coot39. The models were refined using Phenix40 with the application of secondary structure restraints, geometry restraints and DNA-specific restraints. The final models were evaluated by MolProbity41, final refinement statistics are summarized in Extended Data Table 2. Chimera and Pymol (http://pymol.org) were used for figure preparation.
Extended Data
Extended Data Fig. 1 |.
Cryo-EM structural analysis of the native NSD3C bound to 187-bp NCP. a, A representative cryo-EM micrograph from a total 2511 micrographs of the NCP-NSD3C complex (low-pass filtered to 20 Å). Scale bar, 100 nm. b, Selected 2D class averages of the NCP-NSD3C complex. Scale bar, 10 nm. Box size 216, pixel size 1.08 Å. c, Workflow of the NCP-NSD3C complex image processing procedures. It includes several rounds of 2D and 3D classification, refinement and masked refinement. The linker DNA is highly flexible, thus, it is invisible when the density map was shown in high resolution. d, Local resolution map of the NCP-NSD3C complex final density map. e, FSC curve of the NCP-NSD3C complex final density map.
Extended Data Fig. 2 |.
Cryo-EM structural analysis of the NSD3C bearing E1181K/T1232A dual mutation in complex with 187-bp NCP. a, A representative cryo-EM micrograph from a total 3625 micrographs of the NCP-NSD3C-E1181K/T1232A complex (low-pass filtered to 20 Å). Scale bar, 100 nm. b, c, Selected 2D class averages (b), scale bar 10 nm, box size 108, pixel size 2.16 Å. Workflow of the NCP-NSD3C-E1181K/T1232A complex image processing procedures (c). It includes several rounds of 2D and 3D classification, refinement and masked refinement. As the linker DNA is highly flexible, it is invisible when the density map was shown at a high contour level. d, FSC curves of the NCP-NSD3C-E1181K/T1232A complex in different binding states. e, Local resolution map of the 1:2 NCP-NSD3C-E1181K/T1232A complex final density map. f, Local resolution map of the 1:1 NCP-NSD3C-E1181K/T1232A complex final density map. g-I, Local density map of representative regions of the final cryo-EM density map, for H3 tail (g), NSD3 AWS domain (h), and NSD3 SET domain (i).
Extended Data Fig. 3 |.
EMSA and structural analysis of NSD3C with 187-bp NCPs. a, EMSA analysis of NSD3C with native or Nle-labeled187-bp NCPs. The concentrations of added NSD3C are indicated above the lanes. The results were repeated from at least three independent experiments. For gel source data, see Supplementary Fig. 1. b, Superimposition of the 1:1 NSD3-NCP complex with an apo NCP (PDB ID: 1AOI). Histone proteins and the wrapped DNA in apo NCP are colored in yellow and blue, respectively. Histone proteins and the nucleosomal DNA in the NSD3-binding NCP are colored in grey and orange, respectively. NSD3 is colored in green. c, Top (left) and side (right) views of the sharpened cryo-EM density map of the 1:2 NCP-NSD3C-E1181K/T1232A complex (contour at 3σ level). NSD3 is colored in green. NCP DNA and histone proteins are colored in orange and grey, respectively. d, Top (left) and side (right) views of the inactive state of the NSD3C-NCP complex. 146-bp NCP structure (PDB code 1AOI) was docked into the density of the 187-bp NCP. The cryo-EM density map was colored in grey and contoured at 1.5σ lever. Additional densities that lay on the top of the nucleosome disk were densities of NSD3.
Extended Data Fig. 4 |.
MST-based analysis of wild-type (WT) and mutants of NSD3 for 187-bp NCPs. Left, MST-binding curves of wild-type and mutants of NSD3 for 187-bp NCPs. Right, dissociation constants (Kd) derived from left curves. Data are represented as means ± s.d. from n = 3 biological independent samples.
Extended Data Fig. 5 |.
Cryo-EM structural analysis of NSD2 bearing E1099K/T1150A dual mutation in complex with 187-bp NCP. a, A representative cryo-EM micrograph from a total 1388 micrographs of the NCP-NSD2C-E1099K/T1150A complex (low-pass filtered to 20 Å). Scale bar, 100 nm. b, c, Selected 2D class averages (b), scale bar 10 nm, box size 216, pixel size 1.08 Å, and workflow of the NCP-NSD2C-E1099K/T1150A complex image processing procedures (c). d, Local resolution map of the NCP-NSD2C-E1099K/T1150A complex final density map. e, FSC curve of the NCP-NSD2C-E1099K/T1150A complex.
Extended Data Fig. 6 |.
E1181 and T1232 sites of NSD3 in the structure of the NSD3-NCP complex. a, Comparisons of the structural differences between the superimposed NCP-bound wild-type NSD3 (colored in grey) and E1181K-mutated (colored as described above) NSD3. b, The side-chain of Thr1232 in native NSD3 is inserted into a hydrophobic pocket composed of hydrophobic residues from both NSD3 and histone H3.
Extended Data Fig. 7 |.
Proliferation of HNSCC cell line UD-SCC-2 cells is dependent on NSD3. a, Western analysis with indicated antibodies of whole cell lysates from wild-type or NSD3 depleted UD-SCC-2 cells as indicated. All data were reproduced from three independent experiments. b, Cell proliferation rates of UD-SCC-2 cells expressing CRISPR-Cas9 and two independent NSD3 sgRNAs or a control sgRNA. Data are represented as means ± s.d. from n = 3 biological independent samples. **p < 0.01, n.s., not significant, two-tailed unpaired Student’s t test. Cell lines were numbered as the following: 1. sgControl, 2. sgNSD3–1, 3. sgNSD3–2. P values between the cells are: p (1 vs. 2) = 0.0046, p (1 vs. 3) = 0.0029, p (2 vs. 3) = 0.3249. c, Western analysis of NSD3-depleted UD-SCC-2 cells complemented with structure-guided NSD3 derivatives. All data were reproduced by three independent experiments. d, Validation of NSD3 antibody specificity. Left panel: transient expression of either vector alone or Flag-tagged NSD3 in HEK 293T cells. Right panel: CRISPR-cas9 mediated knockdown of either control or NSD3 in MDA-MB-231 cells. Whole cells lysates were blotted with indicated antibodies. *, non-specific band. All data were reproduced by three independent experiments. For gel-source data, see Supplementary Fig. 1.
Extended Data Table 1 |.
Kinetics parameters of NSD2 and NSD3
| Protein | NCP | Km (μM) | kcat (min−1) |
|---|---|---|---|
| NSD3C | 147-bp | 0.934 ± 0.222 | 0.022 ± 0.005 |
| NSD3C | 187-bp | 0.240 ± 0.035 | 0.058 ± 0.002 |
| NSD3C-E1181K | 187-bp | 0.433 ± 0.058 | 0.265 ± 0.029 |
| NSD3C-T1232A | 187-bp | 0.231 ± 0.058 | 0.373 ± 0.036 |
| NSD3C-E1181K/T1232A | 187-bp | 0.044 ± 0.002 | 0.603 ± 0.009 |
| NSD2C | 187-bp | 0.594 ± 0.069 | 0.253 ± 0.004 |
| NSD2C-E1099K | 187-bp | 0.546 ± 0.096 | 0.884 ± 0.033 |
| NSD2C-T1150A | 187-bp | 0.431 ± 0.096 | 1.142 ± 0.091 |
| NSD2C-E1099K/T1150A | 187-bp | 0.281 ± 0.049 | 1.625 ± 0.161 |
Extended Data Table 2 |.
Statistics of cryo-EM data collection, refinement and validation
| 1:2 model NCP-NSD3C-E1181K/T1232A EMDB-30456 PDB: 7CRQ |
1:1 model NCP-NSD3C-E1181K/T1232A EMDB-30455 PDB: 7CRP |
1:1 model NCP-NSD3C EMDB-30457 PDB: 7CRR |
1:1 model NCP-NSD2C-E1099K/T1150A EMDB-30453 PDB: 7CRO |
|
|---|---|---|---|---|
| Data collection and processing | ||||
| Magnification | 130,000 | 130,000 | 130,000 | 130,000 |
| Voltage (kV) | 300 | 300 | 300 | 300 |
| Electron exposure (e−/Å2) | 50 | 50 | 50 | 50 |
| Defocus range (μm) | 1.2–2.2 | 1.2–2.2 | 1.2–2.2 | 1.2–2.2 |
| Pixel size (Å) | 1.08 | 1.08 | 1.08 | 1.08 |
| Symmetry imposed | C1 | C1 | C1 | C1 |
| Initial particle image (no.) | 2.28 M | 2.28 M | 1.11 M | 910 K |
| Final particle image (no.) | 283 K | 215 K | 61 K | 71.1 K |
| Map resolution (Å) | 3.15 | 3.20 | 3.48 | 3.75 |
| FSC threshold | 0.143 | 0.143 | 0.143 | 0.143 |
| Map resolution range (Å) | 2.4–4.8 | 2.4–4.8 | 3.1–6.0 | 3.5–8.0 |
| Refinement | ||||
| Map sharpening B factor (Å2) | −114 | −119 | −119 | −160 |
| Model composition | ||||
| Protein residues | 1,226 | 1,002 | 1,002 | 999 |
| DNA residues | 336 | 336 | 336 | 336 |
| Ligands (SAM and Zn2+) | 2 SAM, 6 Zn2+ | 1 SAM, 3 Zn2+ | 1 SAM, 3 Zn2+ | 1 SAM, 3 Zn2+ |
| R.m.s. deviations | ||||
| Bond lengths (Å2) | 0.006 | 0.006 | 0.007 | 0.006 |
| Bong angles (°) | 0.689 | 0.713 | 0.703 | 0.692 |
| Validation | ||||
| MolProbity score | 1.9 | 1.81 | 2.03 | 1.97 |
| Clash score | 7.18 | 5.86 | 9.11 | 8.95 |
| Poor rotamers (%) | 0.39 | 0.24 | 0.24 | 0 |
| Ramachandran plot | ||||
| Favored (%) | 91.34 | 91.85 | 90.21 | 91.72 |
| Allowed (%) | 8.58 | 8.15 | 9.79 | 8.28 |
| Disallowed (%) | 0.08 | 0 | 0 | 0 |
Supplementary Material
Acknowledgements
We thank the staff from cryo-EM Centers of National Facility for Protein Science in Shanghai (NFPS) at Shanghai Synchrotron Radiation Facility (SSRF) and the Southern University of Science and Technology (SUSTech) in China for assistance during data collection. We thank Guohong Li for kindly providing histone-expressing plasmids, Xin Gong and Ning Gao for support on cryo-EM studies. This work was supported by the National Natural Science Foundation of China (31870725 and 31570729) and the Fundamental Research Funds for the Central Universities (2017EYT19) to Z.W., a Leukemia Lymphoma Society grant and support from a Memorial Sloan-Kettering Cancer Center Core grant P30CA008748 to D.J.P., a Presidential Postdoctoral Fellowship from the Southern University of Science and Technology and a Basic Research grant from Shenzhen government to W.L. (JCYJ20180302174213122), a grant from the NIH to O.G. (R01GM079641). D.S. was supported by a grant from Stanford Maternal and Child Health Research Institute. Research at SUSTech was supported from the Office of the President.
Footnotes
Competing financial interests
O.G. is a co-founder of Epicypher, Inc. and Athelas Therapeutics, Inc.
Data availability
The EM density maps have been deposited in the Electron Microscopy Data Bank with accession codes EMDB-30453, EMDB-30454, EMDB-30455, EMDB-30456 and EMDB-30457. The final models were submitted to the RCSB Protein Data Bank under accession codes 7CRO, 7CRP, 7CRQ and 7CRR. Other PDB codes used in this study, including 1AOI, 3MVD, 3OOI and 5UPD can also be accessed through their respective accession codes in the Protein Data Bank. Mutation resource for the E1099K and T1150A mutations in NSD2 and the T1232A mutation in NSD3 can be accessed through the COSMIC database (http://cancer.sanger.ac.uk) under the genomic mutation IDs of COSV56386422, COSV56385908 and COSV57670291, respectively. Source Data for Fig. 4f are provided in the online version of this paper. Gel source data are provided as Supplementary Fig. 1 for cropped images shown in Figs. 1e, 3c, 4a, c, e and Extended Data Figs. 3a and 7a, c, d.
REFERENCES
- 1.Husmann D & Gozani O Histone lysine methyltransferases in biology and disease. Nat Struct Mol Biol 26, 880–889, doi: 10.1038/s41594-019-0298-7 (2019). [DOI] [PMC free article] [PubMed] [Google Scholar]
- 2.Bennett RL, Swaroop A, Troche C & Licht JD The Role of Nuclear Receptor-Binding SET Domain Family Histone Lysine Methyltransferases in Cancer. Cold Spring Harb Perspect Med 7, doi: 10.1101/cshperspect.a026708 (2017). [DOI] [PMC free article] [PubMed] [Google Scholar]
- 3.Kuo AJ et al. NSD2 links dimethylation of histone H3 at lysine 36 to oncogenic programming. Mol Cell 44, 609–620, doi: 10.1016/j.molcel.2011.08.042 (2011). [DOI] [PMC free article] [PubMed] [Google Scholar]
- 4.Li Y et al. The target of the NSD family of histone lysine methyltransferases depends on the nature of the substrate. J Biol Chem 284, 34283–34295, doi: 10.1074/jbc.M109.034462 (2009). [DOI] [PMC free article] [PubMed] [Google Scholar]
- 5.Morrison MJ et al. Identification of a peptide inhibitor for the histone methyltransferase WHSC1. PLoS One 13, e0197082, doi: 10.1371/journal.pone.0197082 (2018). [DOI] [PMC free article] [PubMed] [Google Scholar]
- 6.Qiao Q et al. The structure of NSD1 reveals an autoregulatory mechanism underlying histone H3K36 methylation. J Biol Chem 286, 8361–8368, doi: 10.1074/jbc.M110.204115 (2011). [DOI] [PMC free article] [PubMed] [Google Scholar]
- 7.Tisi D et al. Structure of the Epigenetic Oncogene MMSET and Inhibition by N-Alkyl Sinefungin Derivatives. ACS Chem Biol 11, 3093–3105, doi: 10.1021/acschembio.6b00308 (2016). [DOI] [PubMed] [Google Scholar]
- 8.Ding LW et al. Mutational Landscape of Pediatric Acute Lymphoblastic Leukemia. Cancer Res 77, 390–400, doi: 10.1158/0008-5472.CAN-16-1303 (2017). [DOI] [PMC free article] [PubMed] [Google Scholar]
- 9.Jaffe JD et al. Global chromatin profiling reveals NSD2 mutations in pediatric acute lymphoblastic leukemia. Nat Genet 45, 1386–1391, doi: 10.1038/ng.2777 (2013). [DOI] [PMC free article] [PubMed] [Google Scholar]
- 10.Oyer JA et al. Point mutation E1099K in MMSET/NSD2 enhances its methyltranferase activity and leads to altered global chromatin methylation in lymphoid malignancies. Leukemia 28, 198–201, doi: 10.1038/leu.2013.204 (2014). [DOI] [PMC free article] [PubMed] [Google Scholar]
- 11.Swaroop A et al. An activating mutation of the NSD2 histone methyltransferase drives oncogenic reprogramming in acute lymphocytic leukemia. Oncogene 38, 671–686, doi: 10.1038/s41388-018-0474-y (2019). [DOI] [PMC free article] [PubMed] [Google Scholar]
- 12.Tate JG et al. COSMIC: the Catalogue Of Somatic Mutations In Cancer. Nucleic Acids Res 47, D941–D947, doi: 10.1093/nar/gky1015 (2019). [DOI] [PMC free article] [PubMed] [Google Scholar]
- 13.van Hest JCM, Kiick KL & Tirrell DA Efficient incorporation of unsaturated methionine analogues into proteins in vivo. Journal of the American Chemical Society 122, 1282–1288, doi: 10.1021/ja992749j (2000). [DOI] [Google Scholar]
- 14.Worden EJ, Hoffmann NA, Hicks CW & Wolberger C Mechanism of Cross-talk between H2B Ubiquitination and H3 Methylation by Dot1L. Cell 176, 1490–1501 e1412, doi: 10.1016/j.cell.2019.02.002 (2019). [DOI] [PMC free article] [PubMed] [Google Scholar]
- 15.Bilokapic S & Halic M Nucleosome and ubiquitin position Set2 to methylate H3K36. Nat Commun 10, 3795, doi: 10.1038/s41467-019-11726-4 (2019). [DOI] [PMC free article] [PubMed] [Google Scholar]
- 16.Luger K, Mader AW, Richmond RK, Sargent DF & Richmond TJ Crystal structure of the nucleosome core particle at 2.8 A resolution. Nature 389, 251–260, doi: 10.1038/38444 (1997). [DOI] [PubMed] [Google Scholar]
- 17.Makde RD, England JR, Yennawar HP & Tan S Structure of RCC1 chromatin factor bound to the nucleosome core particle. Nature 467, 562–566, doi: 10.1038/nature09321 (2010). [DOI] [PMC free article] [PubMed] [Google Scholar]
- 18.Yuan G et al. Histone H2A ubiquitination inhibits the enzymatic activity of H3 lysine 36 methyltransferases. J Biol Chem 288, 30832–30842, doi: 10.1074/jbc.M113.475996 (2013). [DOI] [PMC free article] [PubMed] [Google Scholar]
- 19.Worden EJ & Wolberger C Activation and regulation of H2B-Ubiquitin-dependent histone methyltransferases. Curr Opin Struct Biol 59, 98–106, doi: 10.1016/j.sbi.2019.05.009 (2019). [DOI] [PMC free article] [PubMed] [Google Scholar]
- 20.He C, Li F, Zhang J, Wu J & Shi Y The methyltransferase NSD3 has chromatin-binding motifs, PHD5-C5HCH, that are distinct from other NSD (nuclear receptor SET domain) family members in their histone H3 recognition. J Biol Chem 288, 4692–4703, doi: 10.1074/jbc.M112.426148 (2013). [DOI] [PMC free article] [PubMed] [Google Scholar]
- 21.Bea S et al. Landscape of somatic mutations and clonal evolution in mantle cell lymphoma. Proc Natl Acad Sci U S A 110, 18250–18255, doi: 10.1073/pnas.1314608110 (2013). [DOI] [PMC free article] [PubMed] [Google Scholar]
- 22.Landau DA et al. Evolution and impact of subclonal mutations in chronic lymphocytic leukemia. Cell 152, 714–726, doi: 10.1016/j.cell.2013.01.019 (2013). [DOI] [PMC free article] [PubMed] [Google Scholar]
- 23.Cancer Genome Atlas N Comprehensive genomic characterization of head and neck squamous cell carcinomas. Nature 517, 576–582, doi: 10.1038/nature14129 (2015). [DOI] [PMC free article] [PubMed] [Google Scholar]
- 24.Coussens NP et al. High-throughput screening with nucleosome substrate identifies small-molecule inhibitors of the human histone lysine methyltransferase NSD2. Journal of Biological Chemistry 293, 13750–13765, doi: 10.1074/jbc.RA118.004274 (2018). [DOI] [PMC free article] [PubMed] [Google Scholar]
- 25.Drake KM, Watson VG, Kisielewski A, Glynn R & Napper AD A Sensitive Luminescent Assay for the Histone Methyltransferase NSD1 and Other SAM-Dependent Enzymes. Assay Drug Dev Techn 12, 258–271, doi: 10.1089/adt.2014.583 (2014). [DOI] [PMC free article] [PubMed] [Google Scholar]
- 26.Shen Y et al. Identification of LEM-14 inhibitor of the oncoprotein NSD2. Biochem Bioph Res Co 508, 102–108, doi: 10.1016/j.bbrc.2018.11.037 (2019). [DOI] [PubMed] [Google Scholar]
- 27.Dyer PN et al. Reconstitution of nucleosome core particles from recombinant histones and DNA. Method Enzymol 375, 23–44 (2004). [DOI] [PubMed] [Google Scholar]
- 28.Luger K, Rechsteiner TJ & Richmond TJ Preparation of nucleosome core particle from recombinant histones. Chromatin 304, 3–19 (1999). [DOI] [PubMed] [Google Scholar]
- 29.Lowary PT & Widom J New DNA sequence rules for high affinity binding to histone octamer and sequence-directed nucleosome positioning. J Mol Biol 276, 19–42, doi: 10.1006/jmbi.1997.1494 (1998). [DOI] [PubMed] [Google Scholar]
- 30.Song F et al. Cryo-EM Study of the Chromatin Fiber Reveals a Double Helix Twisted by Tetranucleosomal Units. Science 344, 376–380, doi: 10.1126/science.1251413 (2014). [DOI] [PubMed] [Google Scholar]
- 31.Liu S et al. METTL13 Methylation of eEF1A Increases Translational Output to Promote Tumorigenesis. Cell 176, 491–504 e421, doi: 10.1016/j.cell.2018.11.038 (2019). [DOI] [PMC free article] [PubMed] [Google Scholar]
- 32.Xue H et al. Structural basis of nucleosome recognition and modification by MLL methyltransferases. Nature 573, 445–449, doi: 10.1038/s41586-019-1528-1 (2019). [DOI] [PubMed] [Google Scholar]
- 33.Zheng SQ et al. MotionCor2: anisotropic correction of beam-induced motion for improved cryo-electron microscopy. Nat Methods 14, 331–332, doi: 10.1038/nmeth.4193 (2017). [DOI] [PMC free article] [PubMed] [Google Scholar]
- 34.Zhang K Gctf: Real-time CTF determination and correction. J Struct Biol 193, 1–12, doi: 10.1016/j.jsb.2015.11.003 (2016). [DOI] [PMC free article] [PubMed] [Google Scholar]
- 35.Kimanius D, Forsberg BO, Scheres SHW & Lindahl E Accelerated cryo-EM structure determination with parallelisation using GPUs in RELION-2. Elife 5, doi: 10.7554/eLife.18722 (2016). [DOI] [PMC free article] [PubMed] [Google Scholar]
- 36.Scheres SHW A Bayesian View on Cryo-EM Structure Determination. J Mol Biol 415, 406–418, doi: 10.1016/j.jmb.2011.11.010 (2012). [DOI] [PMC free article] [PubMed] [Google Scholar]
- 37.Kucukelbir A, Sigworth FJ & Tagare HD Quantifying the local resolution of cryo-EM density maps. Nat Methods 11, 63–65, doi: 10.1038/nmeth.2727 (2014). [DOI] [PMC free article] [PubMed] [Google Scholar]
- 38.Pettersen EF et al. UCSF chimera - A visualization system for exploratory research and analysis. J Comput Chem 25, 1605–1612, doi: 10.1002/jcc.20084 (2004). [DOI] [PubMed] [Google Scholar]
- 39.Emsley P, Lohkamp B, Scott WG & Cowtan K Features and development of Coot. Acta Crystallogr D 66, 486–501, doi: 10.1107/S0907444910007493 (2010). [DOI] [PMC free article] [PubMed] [Google Scholar]
- 40.Adams PD et al. PHENIX: a comprehensive Python-based system for macromolecular structure solution. Acta Crystallographica Section D-Structural Biology 66, 213–221, doi: 10.1107/S0907444909052925 (2010). [DOI] [PMC free article] [PubMed] [Google Scholar]
- 41.Chen VB et al. MolProbity: all-atom structure validation for macromolecular crystallography. Acta Crystallographica Section D-Structural Biology 66, 12–21, doi: 10.1107/S0907444909042073 (2010). [DOI] [PMC free article] [PubMed] [Google Scholar]
Associated Data
This section collects any data citations, data availability statements, or supplementary materials included in this article.
Supplementary Materials
Data Availability Statement
The EM density maps have been deposited in the Electron Microscopy Data Bank with accession codes EMDB-30453, EMDB-30454, EMDB-30455, EMDB-30456 and EMDB-30457. The final models were submitted to the RCSB Protein Data Bank under accession codes 7CRO, 7CRP, 7CRQ and 7CRR. Other PDB codes used in this study, including 1AOI, 3MVD, 3OOI and 5UPD can also be accessed through their respective accession codes in the Protein Data Bank. Mutation resource for the E1099K and T1150A mutations in NSD2 and the T1232A mutation in NSD3 can be accessed through the COSMIC database (http://cancer.sanger.ac.uk) under the genomic mutation IDs of COSV56386422, COSV56385908 and COSV57670291, respectively. Source Data for Fig. 4f are provided in the online version of this paper. Gel source data are provided as Supplementary Fig. 1 for cropped images shown in Figs. 1e, 3c, 4a, c, e and Extended Data Figs. 3a and 7a, c, d.


