

Abstract
The dithiocarbamate fungicide maneb (MB) has attracted interest due to increasing concern of the negative health effects of pesticides, as well as its association with Parkinson’s disease (PD). Our laboratory has previously reported distinct phenotypic changes of neuroblastoma cells exposed to acute, sub-toxic levels of MB, including decreased mitochondrial respiration, altered lactate dynamics, and metabolic stress. In this study, we aimed to further define the specific molecular mechanisms of MB toxicity through the comparison of several thiol-containing compounds and their effects on cellular energy metabolism and thiol redox nodes. Extracellular flux analyses and stable isotope labeled tracer metabolomics were employed to evaluate alterations in energy metabolism of SK-N-AS human neuroblastoma cells after acute exposure of an array of compounds, including dithiocarbamates (maneb, nabam, zineb) and other thiol-containing small molecules (glutathione, N-acetylcysteine). These studies revealed MB and its methylated form (MeDTC) as unique toxicants with significant alterations to mitochondrial respiration, proliferation, and glycolysis. We observed MB to significantly impact cellular thiol redox status by oxidizing cellular glutathione and altering the thiol redox status of peroxiredoxin 3 (Prx3, mitochondrial) after acute exposure. Redox Western blotting revealed a MB-specific modification of cellular Prx3, strengthening the argument that MB can preferentially target mitochondrial enzymes containing reactive cysteine thiols. Further, stable isotope tracer metabolomics confirmed our energetics assessments, and demonstrated that MB exposure results in acute derangement of central carbon metabolism. Specifically, we observed shunting of cellular glucose into the pentose-phosphate pathway and reduction of TCA intermediates derived from glucose and glutamine. Also, we report novel lactate utilization for TCA enrichment and glutathione synthesis after MB exposure. In summary, our results further confirm that MB exerts its toxic effects via thiol modification, and significantly transforms central carbon metabolism.
Keywords: Dithiocarbamate, Fungicide, Parkinson’s disease, Redox, Protein Thiol
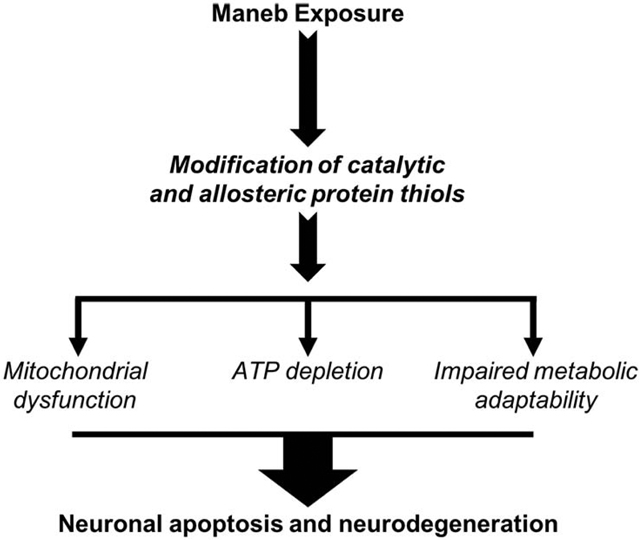
Graphical Abstract
Introduction
Dithiocarbamate (DTC) pesticides have received recent research interest due to the increasing concern over human exposures in both occupational and residential settings [1, 2]. Additionally, epidemiological studies have identified maneb (MB), a widely used dithiocarbamate fungicide, as an environmental risk factor for Parkinson’s disease [3]. These studies found an increased risk of PD in agricultural centers in which MB exposures were at their highest. Since these reports, toxicant models utilizing MB exposure have emerged in PD research, often in combination with another common herbicide, paraquat (PQ) [4]. This co-exposure model has produced Parkinson-like phenotypes in murine models, as well as cell culture [5–7]. Specifically, toxicant-mediated induction of apoptosis of dopaminergic neurons and loss of motor function are synergistically enhanced with PQ and MB co-exposure in mice [8]. However, multiple studies have shown that the mechanisms are not additive, and there are unique cellular targets for MB and PQ exposures in mice and cell culture [9, 10]. PQ’s contribution to the system has been highly defined to include redox cycling, mitochondrial ROS production, and GSH oxidation [10, 11]. Still, the exact mechanisms of MB toxicity have yet to be fully defined.
In mice, MB has been shown to alter gene expression associated with PD-relevant biomarkers such as tyrosine hydroxylase (TH), dopamine transporter (DAT), and vesicular monoamine transporter 2 (VMAT-2) [12]. Among the MB-altered pathways, major stress response and metabolic pathways, including Nrf2, unfolded protein response (UPR), and inducible nitric oxide synthase (iNOS) were highly active [10, 12]. Our group has reported drastic MB-induced alterations in the bioenergetics of SK-N-AS human neuroblastoma cells, including an acute reduction in ATP-linked mitochondrial respiration, inhibition of glycolysis, and eradication of mitochondrial fuel flexibility [13]. Transcriptional analyses have also revealed many metabolic pathways altered after MB exposure in CAD mouse catecholaminergic neurons [14]. Protein posttranslational modifications have been observed as well, as MB has been shown to increase global carbonylation of proteins within the cortex of mice [7]. Previous research has uncovered multiple direct interactions of MB in cellular systems which include disruption of the mitochondrial membrane potential (MMP), direct complex III inhibition, dehydrogenase enzyme inhibition, protein thiol alkylation, and mitochondrial iron accumulation [13, 15–17]. Further, protein thiol alkylation has been reported by our laboratory to include MB-specific adduction to recombinant thioredoxin 1 (Trx1) protein [16].
This study investigates direct dithiocarbamate interactions with central carbon metabolism and bioenergetics through evaluation and comparison to several metal-containing compounds. Additional comparison was made to the methylated ethylenebis dithiocarbamate core (MeDTC), a potentially active metabolite with methylated thiols. A common thread uncovered in these mechanisms is the involvement of redox-active thiols. With this in mind, new questions arise about the contribution of the metal component of each of these dithiocarbamate compounds, as well as potential inactivation of thiols through chemical methylation. We hypothesize that dithiocarbamate toxicity is modulated by the metal component within each structure. We further postulate that the MeDTC compound will show either blunted or eliminated toxicity in our neuroblastoma model. These observations contribute mechanistic insight into MB’s mitochondrial specificity and complex toxicity. Combined with the body of established research, we propose a new complex mechanism of MB action on proteins within the cell. Specifically, we suggest that MB acts by directly modifying the most redox sensitive protein thiols within the cell, such as peroxiredoxins and dehydrogenase enzymes involved in energy metabolism, leading to dysregulated metabolism and PD hallmarks of mitochondrial dysfunction and delayed apoptosis.
Materials and Methods
Reagents
Unless otherwise noted, reagents were purchased from Sigma-Aldrich (St. Louis, MO). Structures for Supplemental Table 1 were obtained from the Supplier’s website unless specifically cited. Nabam was obtained from Crescent Chemical Company (LG-DRE-C15400000). All stable isotope labeled reagents were purchased from Cambridge Isotope Laboratories: [U-13C]glucose (CLM-1396–0.5), [1,2,3-13C3]glucose (CLM-4673–0.25), [13C5, 15N2]L-glutamine (CNLM-1275-H-0.25), and [13C3]L-lactate (CLM-1579-N-0.1).
Chemical Synthesis of MeDTC
Nabam (1.0 equiv.) was dissolved in absolute ethanol (10 mL/mmol) to which iodomethane (2.2 equiv.) was added (FIG 1A). The reaction mixture was stirred at RT for 1 h before being evaporated to dryness at ambient temperature and the resultant residue purified via silica gel chromatography (4:1 Hexanes:EtOAc) and the obtained material was triturated with hexanes to afford the target compound as an off-white solid (88% yield). Due to insolubility in ethanol, maneb or zineb was dissolved in dry DMSO (20 mL/mmol) to which iodomethane (2.2 equiv.) was added. The reaction mixture was stirred at RT for 2 hours before being quenched on water (30 mL/mmol) and extracted with diethyl ether (Et2O, 2 × 30 mL/mmol). The combined organic extracts were washed with cold water (3 × 30 mL/mmol) and brine (20 mL/mmol) before being dried (MgSO4) and evaporated to dryness at ambient temperature. The crude residue was purified via silica gel chromatography (4:1 Hexanes:EtOAc) followed by trituration with hexanes to afford the target compound as an off-white solid (68–75% yield). Chemical analyses of the synthesized MeDTC compound are below.
Rf 0.26 (4:1 Hexanes:EtOAc); M.p. 95–98 °C; IR (cm−1) 3207, 2993, 2921, 2857, 1731, 1574, 1510; 1H NMR (400 MHz, CDCl3) 2.63 (6H, s, (SCH3)2), 4.07 (4H, br, (CH2)2), 7.77 (2H, s, (NH)2); 13C NMR (100 MHz, CDCl3) 18.5 (SCH3), 46.3 (CH2), 201.2 (C=S).
All melting points were determined using a Stuart Scientific SMP40 melting point apparatus and are uncorrected. 1H and 13C nuclear magnetic resonance (NMR) spectra were obtained as solutions in deuterated chloroform (CDCl3) on a Bruker Avance III 400 spectrometer recording at 400 MHz. Chemical shifts (δ) are reported in parts per million (ppm) and the spin-multiplicity abbreviated as: s (singlet), d (doublet), t (triplet), q (quartet), m (multiplet), or br (broad), with coupling constants (J) given in Hertz (Hz). Fourier Transform Infrared (FTIR) spectra were obtained using a Bruker Alpha Platinum-ATR as a neat sample.
FIGURE 1: Chemical methylation of DTC fungicides to yield the MeDTC compound which displays variable toxicity in neuroblastoma.
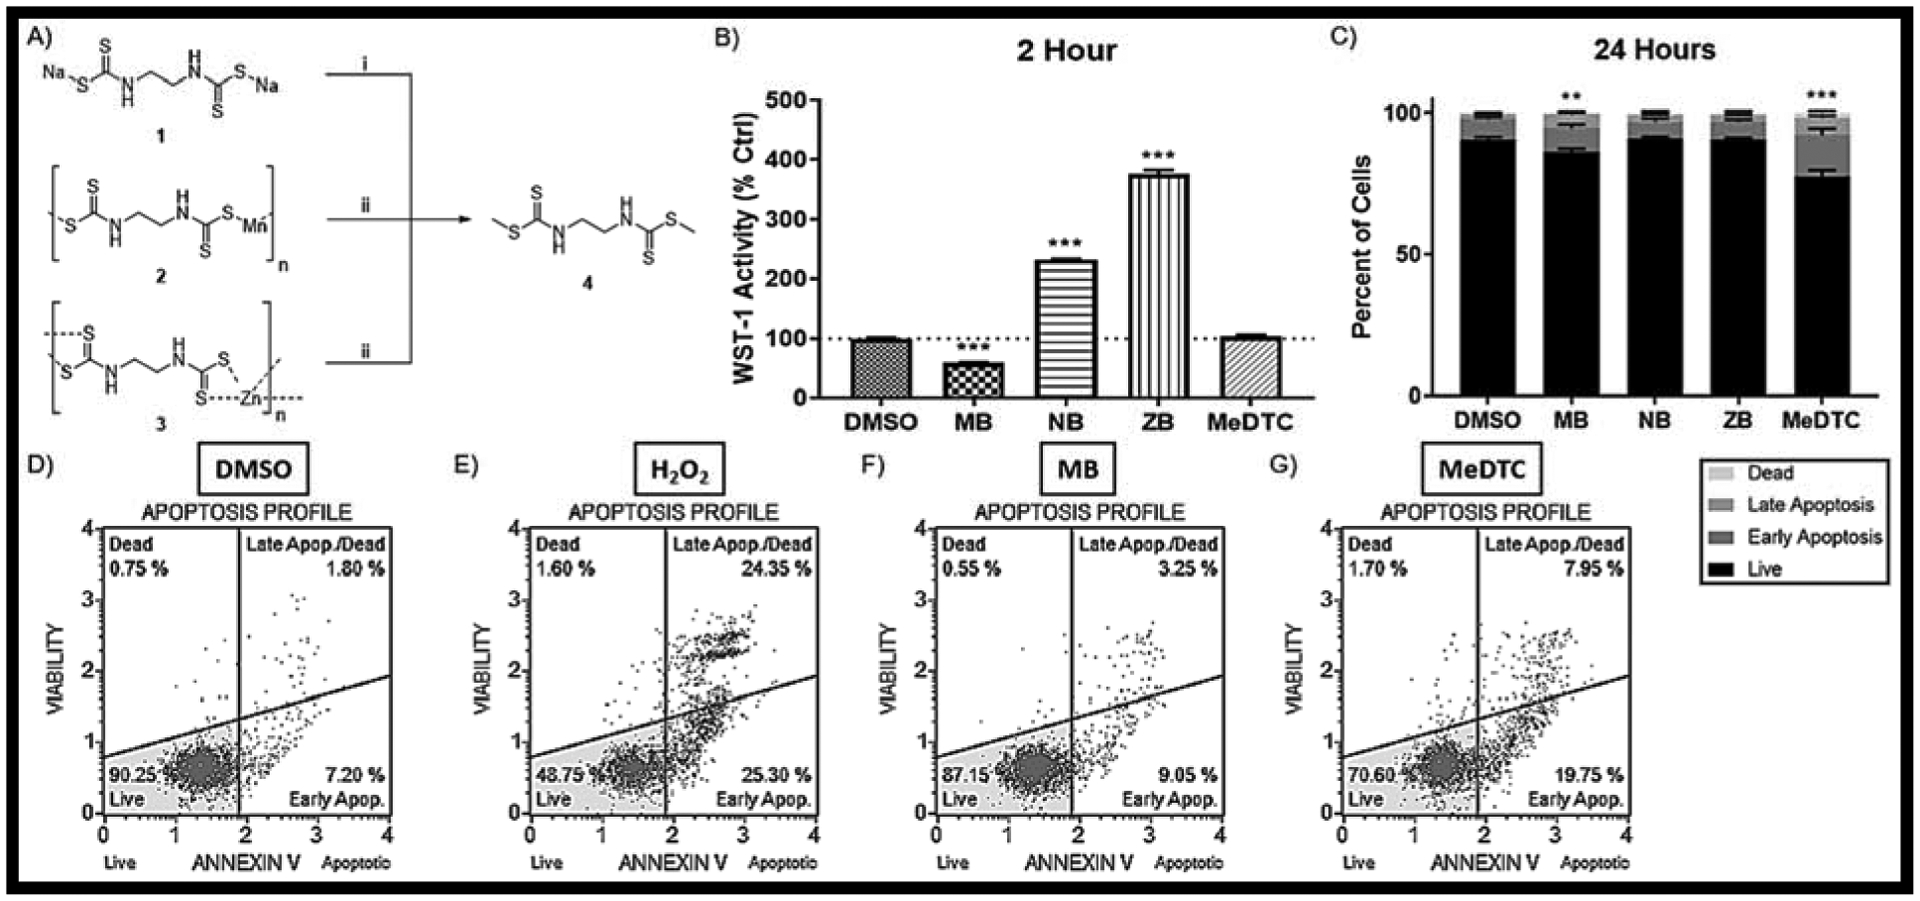
A) Chemical Reaction scheme in which NB(1), MB(2), and ZB(3) are converted to MeDTC(4). i) MeI + EtOH @ RT for 1 HR; ii) MeI + DMSO @ RT for 2 HR. B) WST-1 activity assay after a 2 hr exposure to DTC compounds (N = 10, mean ± SEM). C) Flow Cytometry using the Annexin V / Dead Cell Assay after a 24 hr exposure to DTC compounds (N = 9–10, mean ± SEM) with representative plots for D) DMSO, E) H202 Positive Control, F) 50μM MB, and G) 50μM MeDTC.
Cell Culture of SK-N-AS Cells
Human SK-N-AS cells were obtained from American Type Culture Collection (ATCC) (Rockville, MD). They were cultured in Dulbecco’s modified Eagle Minimal essential medium (DMEM, Life Technologies, Inc., Grand Island, NY) containing 10% Fetal bovine serum (Product number A316040, Gibco, Gaithersburg, MD) and 1% non-essential amino acids (Invitrogen) at 37°C under 5% CO2. Cells used for all assays were between passage 5 and 12.
Cell Viability
For the evaluation of cell viability, SK-N-AS cells were plated in a 96-well plate (50,000 cells/well) and allowed to recover and adhere overnight. The next day, cells were exposed to freshly made 50μM of MB, NB, ZB, MeDTC or DMSO (0.5%) followed by a WST-1 colorimetric assay (Roche, Product number 05015944001) used to assess cell viability as per the manufacturer’s protocol. According to the manufacturer, WST-1 is a stable tetrazolium salt (similar to other viability assays such as MTT) that is converted to a soluble formazan by the succinate-tetrazolium reductase system within the respiratory chain of the mitochondria. Generally speaking, the conversion of the dye is proportional to the number of viable cells within a sample yet can also be a reporter of mitochondrial activity. In toxicological studies, reductions in WST-1 activity could represent fewer viable cells, or a reduction of NAD(P)H available for the transformation pathway. A SpectraMax 190 microplate reader (Molecular devices, Sunnyvale, CA) was used to read the absorbance at 450 nm. Results are reported in percent DMSO control. Additionally, flow cytometry was performed on the Muse® Analyzer (Millipore Sigma, Carlsbad, CA) using the Annexin V / Dead Cell Assay kit (Millipore, product # MCH100105). Cells were plated in a 12-well plate at 150,000 cells per well in 1 mL culture medium. Cells were grown to ~80% confluence and treated with 50μM of DTC compounds, DMSO, or 10mM H2O2 for 24 hours. After the treatment period, cells were prepared and >2,000 total events per sample were measured according to manufacturer’s protocol. Briefly, cells were harvested and reconstituted in 1 mL fresh culture media. 100 μL of cells were aliquoted into 1.5 mL tubes in triplicate and combined with 100 μL of reagent for analysis. Results are reported as a percent of all cells. N = 5 – 6
Incucyte S3 Live Cell Analysis
Cells were plated in a 96-well plate at 50,000 cells per well and grown to ~80% confluence followed by treatment with 0.5% DMSO, 50μM DTC compound, or 10mM H2O2 for 48 hours. Images of SK-N-AS cells were captured before and after treatment at 10x magnification with the IncuCyte S3 Live Cell Analyzer (Sartorius, Ann Arbor, Michigan). Fluorescent probes for Caspase 3/7 activity (red, Cat. No. 4704) and dead cell stain (green, Cat. No. 4633) were added prior to analysis and measured as red fluorescent objects (red object count/image) or total integrated green fluorescence (GFU × μm2 / image). Results are reported as raw data in tracers or percent basal (0 hr) at 2 and 24 hours. N = 10
Seahorse XF Analysis
Live cell analyses of oxygen consumption rate (OCR) and extracellular acidification rate (ECAR) were measured with the Seahorse XFe96 system (Agilent, Santa Clara, CA). This XF system allows for spontaneous measurement of OCR and ECAR while injecting and mixing up to four test compounds. Aside from the acute injections of our study compounds, the specific reagents for each test have been validated by the manufacturer using this cartridge system. The acute injections were made up similarly in assay media, and changes after exposure can be monitored live after establishing a control baseline for each well. New cell characterization was performed on SK-N-AS cells according to manufacturer’s protocol, yielding an FCCP concentration of 2.0μM. Cells were plated at 30,000 cells per well and allowed to seed overnight in a cell culture incubator at 37°C with an XF cartridge hydrating overnight in a non-CO2 incubator at 37°C. On the day of the analysis, the DMEM based assay media (Agilent, 10375–100) was prepared similar to culture media (25mM glucose, 1mM sodium pyruvate, and 4mM L-glutamine). The only component lacking in the assay media compared to growth media is the supplemented serum. The XF plate was washed twice with AM and a final volume of 180 μL AM was added to cells. Then, the XF plate was allowed to equilibrate in non-CO2 incubator at 37°C for 30–60 minutes prior to assay initiation. N = 8
Acute Injections
Port A on the XF cartridge was designated for acute treatment of control (0.5% DMSO) or experimental compound at 20 μL per well. Ports B-D were assigned for each stress test at varying volumes to account for injection into each well (B = 22 μL, C = 25 μL, D = 27 μL). Port A reagents were prepared fresh in assay media at 10X concentration prior to each day’s experiments, giving a final well concentration of 50μM.
Cell Mito Stress
Manufacturer’s protocol was followed for the Cell Mito Stress Test kit with port B containing oligomycin (ATP-Synthase inhibitor) at 2.0μM, port C with 2.0μM FCCP (mitochondrial membrane depolarizer), and port D with a mixture of 0.5μM of each rotenone (complex I inhibitor) and antimycin A (complex III inhibitor) (final well concentration).
Glycolysis Stress
Manufacturer’s protocol was followed for the Glycolysis Stress Test kit with port B containing 10mM glucose, port C with 2.0μM oligomycin, and port D with 50mM 2-deoxyglucose (2-DG) (competitive hexokinase inhibitor) (final well concentration). NOTE: Assay media for this test does not include glucose or sodium pyruvate.
Fuel Flex
Manufacturer’ protocol was followed for the Mitochondrial Fuel Flex Test kit with the following reagents at the final well concentration: UK5099 at 20 uM (Mitochondrial Pyruvate Carrier inhibitor), BPTES at 30 uM (Glutaminase or GLS1 inhibitor), and Etoxomir at 40 uM (carnitine palmitoyltransferase-1 or CPT-1 inhibitor). Inhibitors were injected in sequence to obtain measurements of dependency and capacity for each fuel.
Normalization and Calculations
Aside from a normalized plating protocol, each run is normalized to basal ECAR or OCR to account for between-run variation [18, 19]. Figures represent parameters calculated using normalized percentage values. All calculations were made within each individual well. N = 8 represents 2 separate analyses in which significant outlier wells are removed from data analysis using ROUT test.
Quantification of GSH and GSSG by HPLC
SK-N-AS cells were plated in 6-well plates and allowed to adhere and grow to ~80% confluence, followed by exposure to DMSO control or 50μM DTC for 2 hours. Cells were then extracted, derivatized with dansyl chloride, separated by HPLC, detected by fluorescence, and redox potential (EhGSSG) was calculated using the Nernst equation [20]. Results are reported as percent DMSO control. N = 6
Western Blot
Cell lysates were collected from 6-well plates using 60 μL RIPA buffer. Approximately 20μg of protein from cell lysate was loaded onto a 12% SDS-PAGE gel with β-mercaptoethanol (BME) to reduce proteins after quantitation via a BCA protein assay (Thermo Scientific). Proteins were then transferred to a nitrocellulose membrane using a Bio-Rad TransBlot Turbo (Hercules, CA). Prx1 (Proteintech, 15816–1-AP), Prx3 (Proteintech, 10664–1-AP) and β-actin (Sigma, A5441) primary antibodies were diluted in TBS-Tween containing 10% Super Block (Thermo Scientific, 37536) at a 1:1000 dilution. Clarity Western ECL Substrate (Bio-Rad, 1705060) was used for imaging of the HRP secondary antibody on the ChemiDoc MP imaging system and Image Lab software (Bio-Rad). Samples were analyzed across three separate blots and actin normalized values were averaged. Images presented are representative samples of the imaged membranes. Results are reported in percent DMSO control. N = 6.
Redox Western Blot
Cell lysates were collected from 6-well plates using 75 μL of an alkylation buffer @ pH=8.0, containing 40mM HEPES buffer, 1mM EDTA, and 50mM NaCl. Additionally, 100mM N-ethylmaleimide (NEM) was added to certain samples to lock cellular thiols in their reduced state [21]. After 15 minutes, 7.5 μL of 10% SDS was added to cells and scraped for collection. Samples were prepared for gel electrophoresis without BME to create non-reducing conditions but were still denatured @ 90°C for 5 minutes. Proteins were transferred and visualized as previously described. Some blots were run with 100μM H2O2 to artificially oxidize proteins. Results are reported in percent DMSO control. N = 6
S-adenosylmethionine (SAM) ELISA
Cell lysate was collected from 6-well plates using 120 μL ice cold PBS and scraping. The SAM ELISA assay was purchased and run according to manufacturer’s protocol (Cell Biolabs, PN STA-672, San Diego, CA). Results are reported as percent DMSO control. N = 3
LC/MS/MS Analysis of MeDTC
Liquid Chromatography Mass Spectrometry (LC-MS) analysis was performed on an Agilent Technologies (Santa Clara, CA) 6520 Quadruple Time of Flight (Q-TOF) mass spectrometer coupled to an Agilent Technologies 1290 liquid chromatography system. Chromatographic separation was performed on an Agilent Technologies ZORBAX SB-C18 column (100×2.1mm, 1.7μm) using a gradient previously described [22]. The mass spectrometer positive electrospray ionization (ESI) source parameters were as follows: Gas Temperature 325°C; Gas Flow 12L/min; Nebulizer: 30psi; VCap 4000V; Fragmentor 100V; skimmer 60V. Mass correction was performed using the Agilent Technologies Reference mass kit (121.050873 and 922.009798 reference ions) with a Dual ESI source at a flow rate of 5μL/minute and a nebulizer gas pressure of 15psi.
Our synthesized MeDTC standard was used to determine the compound’s retention time. Tandem mass spectrometry was performed on both the standard and a biological sample at 10V, 20V, and 40V to confirm identification. This is consistent with a metabolomics standards initiative level 1 ID (https://pubmed.ncbi.nlm.nih.gov/24039616/).
Data Extraction
Data extraction was performed using Agilent technologies MassHunter Profinder 10 using the Find by Formula algorithm (Agilent MassHunter Profinder Software: Attain Superior Feature Extraction. Agilent Application Note. 2016; 5991–6984EN.). In brief the algorithm uses the theoretical mass ±10ppm, isotopic distribution, and retention time to extract a compound from the raw mass spectral data. The extracted compound data was exported as volume for statistical analysis.
UHPLC/HRMS Stable-Isotope Labeled (SIL) Metabolomics
SIL metabolomics was performed by the University of Colorado School of Medicine Metabolomics Core using a method previously published by this group [23, 24]. Briefly, SK-N-AS were plated in 6-well plates and grown to >80% confluence. Culture media was replaced with Seahorse DMEM base assay media supplemented similarly as before with glucose, pyruvate, and glutamine, using specific SIL reagents for the desired analysis. Next, DMSO and 50 μM MB treatments were prepared using the SIL supplemented media and exposed to cells for 2 hours before collection. 100 μL of media was collected before cells were harvested with 0.25% trypsin solution, washed with PBS, counted, and pelleted. Both media and cells were frozen and stored at −80°C until submission to the core lab for analysis. Each group was processed in biological triplicate. Briefly, samples were extracted in ice cold methanol:acetonitrile:water (5:3:2 v/v/v) at an adjusted ratio of 1 million cell/ml solution, as previously described [23, 24]. Ten microliters of extracts were then analyzed via ultra-high-pressure liquid chromatography coupled to high resolution quadrupole orbitrap mass spectrometry (UHPLC-HRMS - Vanquish – Q Exactive, Thermo Fisher, San Jose, CA, USA), as previously described in methodological work. Isotopologue distributions (upon correction for natural abundance of C and N isotopes) and peak area integration for quantitative analyses were performed with the software Maven, as described. Heat maps were generated using Gene-E (Broad Institute).
Statistics
All data sets were analyzed using GraphPad v7 with either student’s t-test (with Welch’s correction where applicable) or either one-way or two-way ANOVA with Bonferroni post-hoc testing (unless otherwise noted). All Seahorse XF experiments were conducted in duplicate. * p < 0.05, ** p < 0.01, *** p < 0.001
Results
Structurally similar dithiocarbamate compounds show varied toxicity to SK-N-AS cells
To evaluate a varied group of DTC compounds, methylated forms of the dithiocarbamate compounds were synthesized using methyl iodide as described in Figure 1A. Due to solubility differences, MB and ZB had to be methylated in DMSO, whereas NB was able to be transformed in ethanol. TLC and NMR were used to confirm the structure and purity (> 98%) of MeDTC. We hypothesize that the methylation of the core DTC structure will eliminate toxicity as compared to MB.
To assess acute mitochondrial toxicity, a WST-1 activity assay that uses formazan generation as a readout for mitochondrial dehydrogenase activity was performed after 2 hours exposure to 50μM of DTC compound (FIG 1B). Our study confirms previously published results that MB acutely decreases WST-1 activity compared to the vehicle control (MB = 59.2 ± 0.4%) [13]. Interestingly, NB and ZB show a marked increase in WST-1 activity, indicating divergent mechanisms of action within 2 hours of exposure in neuroblastoma cells (NB = 231.2 ± 1.5%; ZB = 375.4 ± 6.0%). Acute exposure to MeDTC did not alter WST-1 activity, showing that our hypothesis of eliminated toxicity is still viable. Next, flow cytometry was employed to compare apoptosis and necrosis after 24 hours exposure to 50μM of each of these compounds (FIG 1C–G). As seen previously, MB caused a slight, but statistically significant, decrease in live cells compared to the DMSO control (DMSO = 90.6 ± 0.7%, MB = 86.3 ± 1.1%). Surprisingly, MeDTC also caused a significant decrease in live cells after 24 hour exposure, revealing that the mechanisms of dithiocarbamate compounds and MeDTC are unique and result in significant cell loss (MeDTC = 77.7 ± 2.0%). From these results, we hypothesize that the metal component directly alters the reactivity of the dithiocarbamate backbone, and that MeDTC is a unique toxicant.
To further evaluate whole-cell effects of these dithiocarbamate compounds on SK-N-AS cells, we utilized the IncuCyte S3 live cell analyzer to provide measurements for proliferation (confluence), apoptosis, and dead cells over 48 hours. Confluency was measured every 30 minutes over the 24 hour exposure period (FIG 2A–C). At 2 hours, 50μM MB was the only exposure that altered confluency, which was confirmed through morphology changes previously reported (DMSO = 99.9 ± 0.5%, MB = 83.6 ± 1.6%) [13]. At 24 hours, all compounds had significant reduction in confluence compared to the DMSO control (DMSO = 146.9 ± 2.5%, MB = 84.1 ± 3.4%, NB = 132.1 ± 3.8%, ZB = 126.0 ± 4.5%, MeDTC = 97.4 ± 0.8%); however, MeDTC inhibited proliferation over 24 hours, whereas NB and ZB both maintained proliferation. Simultaneously, Cytotox green fluorescence was measured to represent a signal for dead/necrotic cells (FIG 2D–F). Acutely, MB and ZB increased the dead cell signal compared to the DMSO control (DMSO = 383.9 ± 31.9%, MB = 694.3 ± 26.3%, ZB = 693.2 ± 55.2%). This trend continued for 24h and beyond, with MeDTC showing potential delayed toxicity (DMSO = 571.0 ± 44.7%, MB = 4484 ± 421%, ZB = 1897 ± 130%). Additionally, red fluorescence measurements for caspase 3/7 activity were recorded over this time period (FIG 2G–I). All dithiocarbamate treatments resulted in increased caspase-3/7 activity at 24h (DMSO = 26.4 ± 2.3%, MB = 290.3 ± 16.5%, NB = 81.6 ± 4.3%, ZB = 195.7 ± 11.8%), with only MB showing a significant increase compared to control at the 2 hour time-point (DMSO = 89.5 ± 4.2%, MB = 421.5 ± 40.3%). Interestingly, MeDTC and MB were the only compounds with increasing apoptotic activity beyond 24 hours. To expand on the anti-proliferative nature of the MeDTC compound in neuroblastoma, we titrated the concentration of MeDTC down to 5μM and compared to our model 50μM dose of MB (SUPP FIG 1). These experiments showed that MeDTC maintained its anti-proliferative activity down to 10μM, with no accompanying significant increases in dead or apoptotic cells (DMSO = 172.4 ± 7.6%, 10μM MeDTC = 111.6 ± 2.0%). These results confirm our hypothesis that the metal component of the DTC compounds is modulating the toxicity in this cell model. Moreover, the MeDTC compound is behaving as a unique toxicant within these neuroblastoma cells, contrary to our prediction that chemical methylation of the reactive thiols would completely eliminate cytotoxic effects.
FIGURE 2: Maneb shows unique toxicity compared to similar DTC compounds in neuroblastoma.
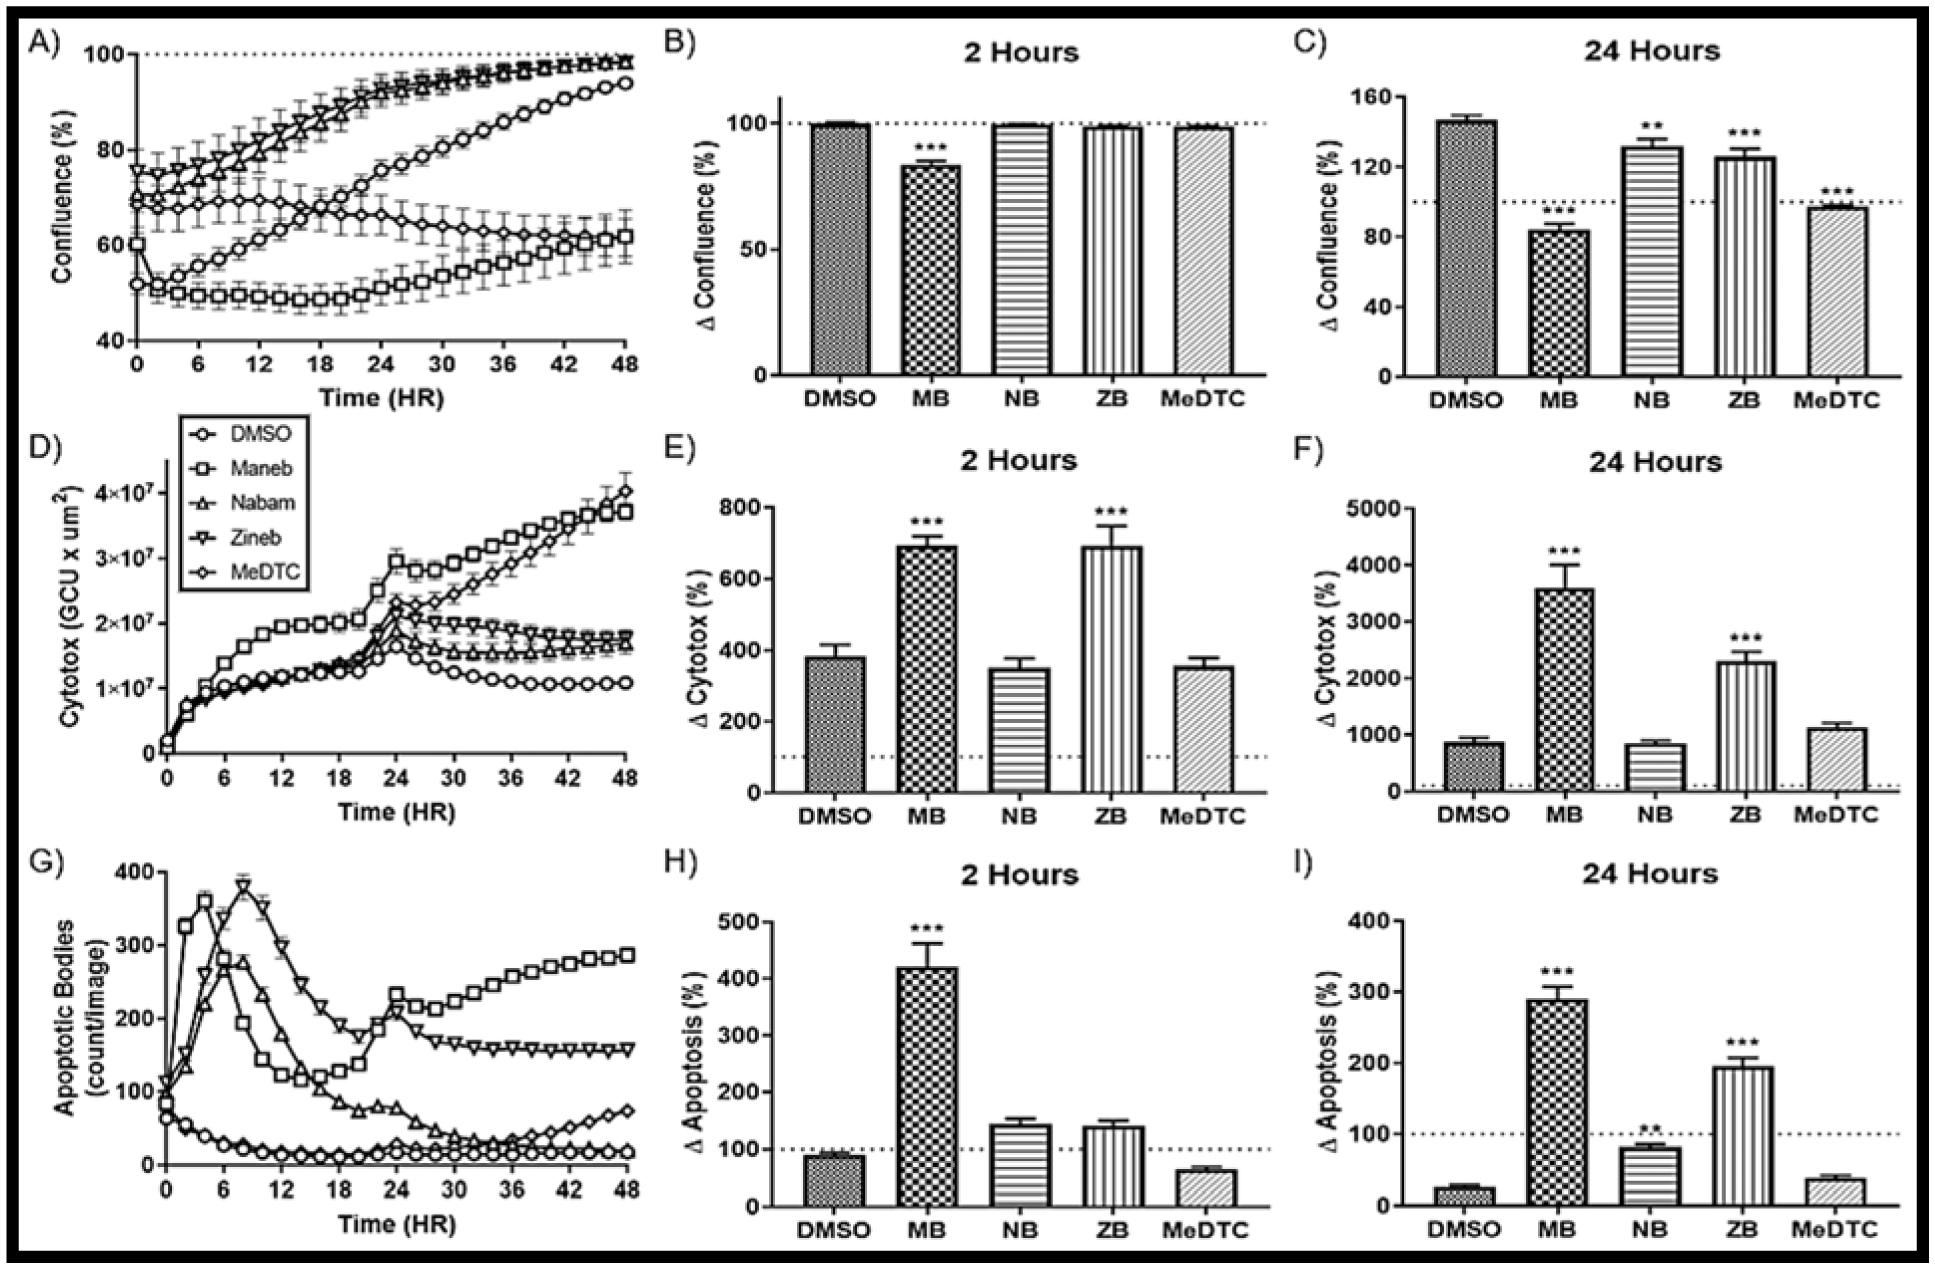
A) Confluence as measured by the Incucyte Live Cell Analyzer over a 48 Hour exposure of DTC compounds using phase microscopy at 10X (N = 12, mean ± SEM). Percent change from basal is represented at B) 2 hours and C) 24 hours. D) Cytotoxicity as measured by green fluorescence over a 48 hour exposure to DTC compounds (N = 12, mean ± SEM) with percent change at E) 2 hours and F) 24 hours. G) Apoptosis as measured by red fluorescence over a 48 hour exposure to DTC compounds (N = 12, mean ± SEM) with percent change at H) 2 hours and I) 24 hours.
Dithiocarbamate compounds alter cellular thiol redox state, with MB showing specific modification of mitochondrial protein thiols
As our proposed mechanism of toxicity for these dithiocarbamate compounds centers around thiol chemistry, we next evaluated acute exposures on the thiol-centric antioxidant cellular defenses: 1) GSH, and 2) peroxiredoxin (Prx)/thioredoxin (Trx)/thioredoxin reductase (TrxR) axis. First, GSH and oxidized glutathione (GSSG) were measured using HPLC and fluorescence detection, and intracellular GSH redox potential (EhGSSG) was calculated using the Nernst equation (FIG 3A). At 2 hours, MB was the only exposure that caused an oxidation of EhGSSG (DMSO = −251.5 ± 1.3 mV, MB = −234.4 ± 3.3 mV). Second, we used traditional and redox Western blots to investigate the redox status of Prx1 (cytosolic) and Prx3 (mitochondrial). Conventional reducing Western blots to assess overall abundance show slight decreases in Prx1 across the 2h exposures, and an unexpected, significant increase of Prx3 after MeDTC exposure (MeDTC = 145.0 ± 18.0%, FIG 3B–C). Redox Western blots, in which N-ethylmaleimide (NEM) alkylates free protein thiols, are the perfect tool for evaluating the redox state peroxiredoxins due to the monomer/dimer dynamics of the oxidized thiols in which a disulfide bond is formed between active-site cysteines between two monomers [25] (FIG 3D). After two hours exposure, only slight reductions of Prx1 protein was observed, with MB only showing a slight reduction in Prx3 thiols (FIG 3E–F). To further investigate this phenomenon, we removed NEM from the sample preparation and allowed protein thiols to be open to modification or artifactual oxidation (FIG 3G). When the two core bands were measured similarly to before, dithiocarbamate alteration of Prx1 is more defined and returns to the common trend of MB having the most drastic affect, NB and ZB show slightly altered Prx1, and MeDTC tracking with the DMSO control (MB = 54.8 ± 2.4%, FIG 3H). Prx3 oxidation, however, switched to show oxidation of Prx3 thiols with acute MB exposure (MB = 222.3 ± 46.8%, FIG 3I). Furthermore, a new band appeared below the previously identified 25 kDa band which, when normalized to the combined oxidized and reduced bands, was MB specific (MB = 247.8 ± 42.7%, FIG 3J). In attempt to modify the experimental system further, we added 100μM H2O2 to the SDS-PAGE samples prior to separation to chemically oxidize reduced Prx3 thiols (FIG 3K). This oxidant exposure greatly enhanced the MB-mediated oxidation of Prx3 protein (MB = 747.4 ± 186.2%). Finally, we titrated the concentration of MB to further illustrate the MB specific oxidation of Prx3 protein thiols (FIG 3L).
FIGURE 3: MB directly alters the mitochondrial Peroxiredoxin (Prx3) in neuroblastoma.
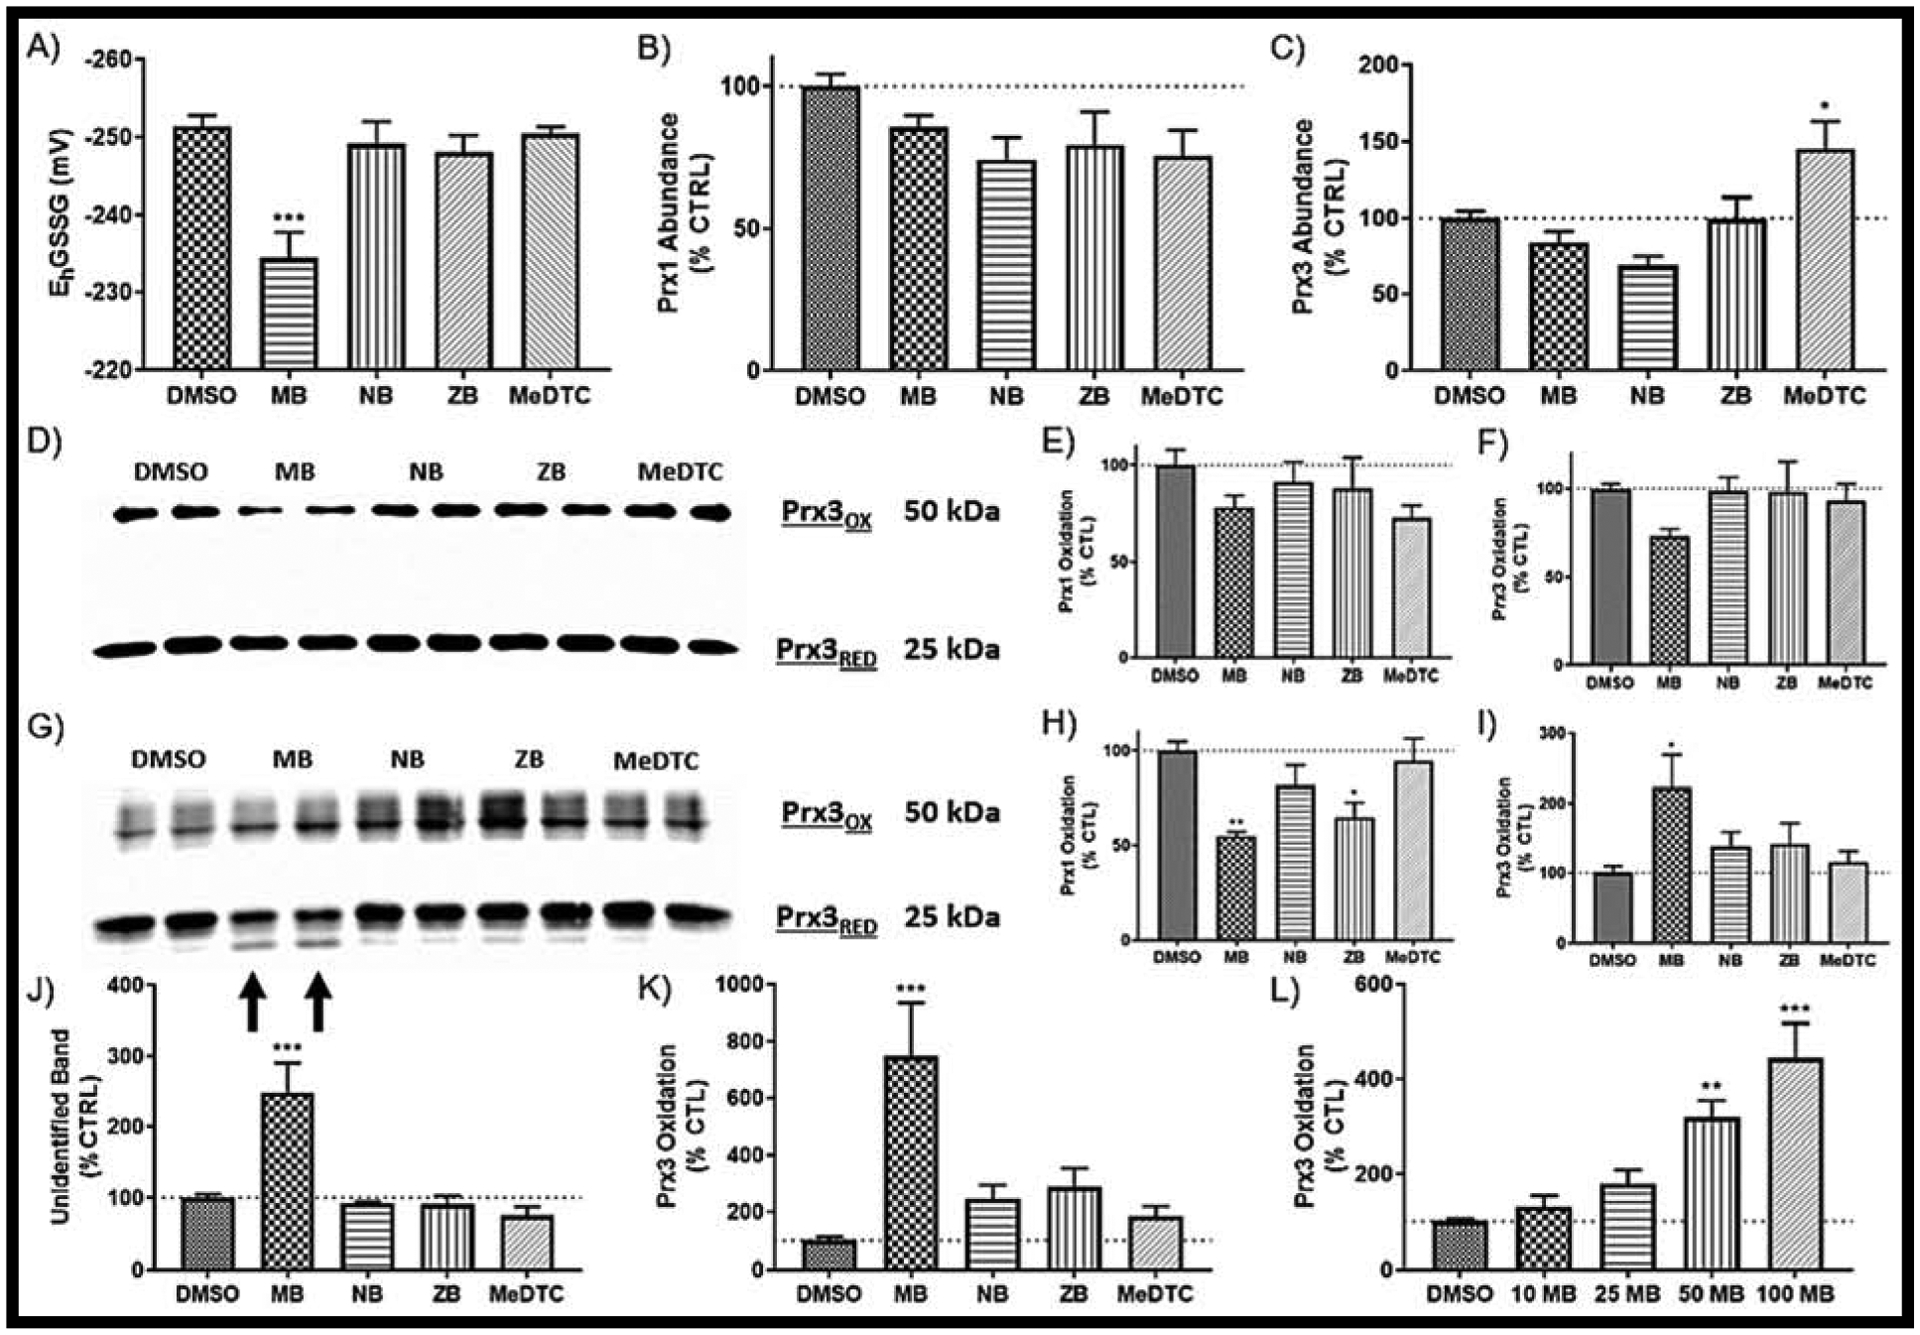
A) Glutathione redox state as measured by HPLC after a 2 hr exposure to DTC compounds (N = 6, mean ± SEM). Western blot of protein abundance for both B) Prx1 (cytosolic) and C) Prx3 (mitochondrial) (N = 6, mean ± SEM). D) Representative redox Western blot of E) Prx1 and F) Prx3 (N = 6, mean ± SEM). G) Representative redox Western blot without NEM for H) Prx1 and I) Prx3 (N = 6, mean ± SEM). J) Relative quantification of the unidentified band (arrows to G). K) Prx3 Oxidation after addition of 100 μM H2O2 to cell lysates (N = 6, mean ± SEM). L) Prx3 Oxidation with varied concentrations of MB (N = 6, mean ± SEM). Blots not shown here can be found in SUPP FIG 5.
These data show varied alterations of the thiol-based antioxidant defense systems within the cell after exposure to metal-containing dithiocarbamate compounds. Specifically, MB appears to have specificity in altering Prx3 redox status potentially through direct adduction via disulfide chemistry.
Dithiocarbamate compounds cause drastic alterations in cellular energetics, with MB and MeDTC showing varied effects in neuroblastoma cells
Next, we continued our evaluation of these compounds by determining their impact on cellular energetics using the Seahorse XFe96 platform. First, the cell mitochondrial stress test was performed as described by the manufacturer’s protocol and optimized parameters (FIG 4A). The initial change in oxygen consumption rate (OCR) after acute injections are represented in the acute response calculations, and often represent changes in the mitochondrial membrane potential (DMSO = 1.2 ± 0.7%, MB = 17.6 ± 2.2%, NB = 13.5 ± 2.0%, ZB = 25.5 ± 2.7%, FIG 4G). To this end, the data indicate that non-methylated dithiocarbamate compounds induce acute depolarization of the mitochondrial membrane potential in neuroblastoma, whereas MeDTC does not (MeDTC = −3.7 ± 0.4%). Respiratory parameters calculated from the live cell analyses all showed a general trend of MB displaying the most drastic impairment of mitochondrial measurements, NB and ZB tracking between MB and the DMSO control, and no change due to MeDTC exposure (FIG 4B–F). Non-mitochondrial oxygen consumption was increased across all metal-containing DTC compounds compared to control (DMSO = 25.8 ± 4.1%, MB = 63.3 ± 2.5%, NB = 47.1 ± 1.3%, ZB = 48.5 ± 2.2%, FIG 4B). When this parameter is accounted for, basal respiration (DMSO = 75.9 ± 4.5%, MB = 52.9 ± 2.2%, FIG 4C), maximal respiration (DMSO = 106.3 ± 7.6%, MB = 70.0 ± 3.0%, FIG 4D), and ATP synthesis (DMSO = 60.5 ± 3.6%, MB = 35.3 ± 1.5%, FIG 4E) were all significantly decreased after MB exposure. As maximal respiration was only significantly decreased after MB exposure, spare respiratory capacity reflects this with only MB showing reduced capacity (DMSO = 30.4 ± 3.4%, MB = 17.1 ± 1.7%, FIG 4F).
FIGURE 4: MeDTC does not act as other DTC compounds, with maneb showing most drastic effects on both mitochondrial function and glycolysis in neuroblastoma.
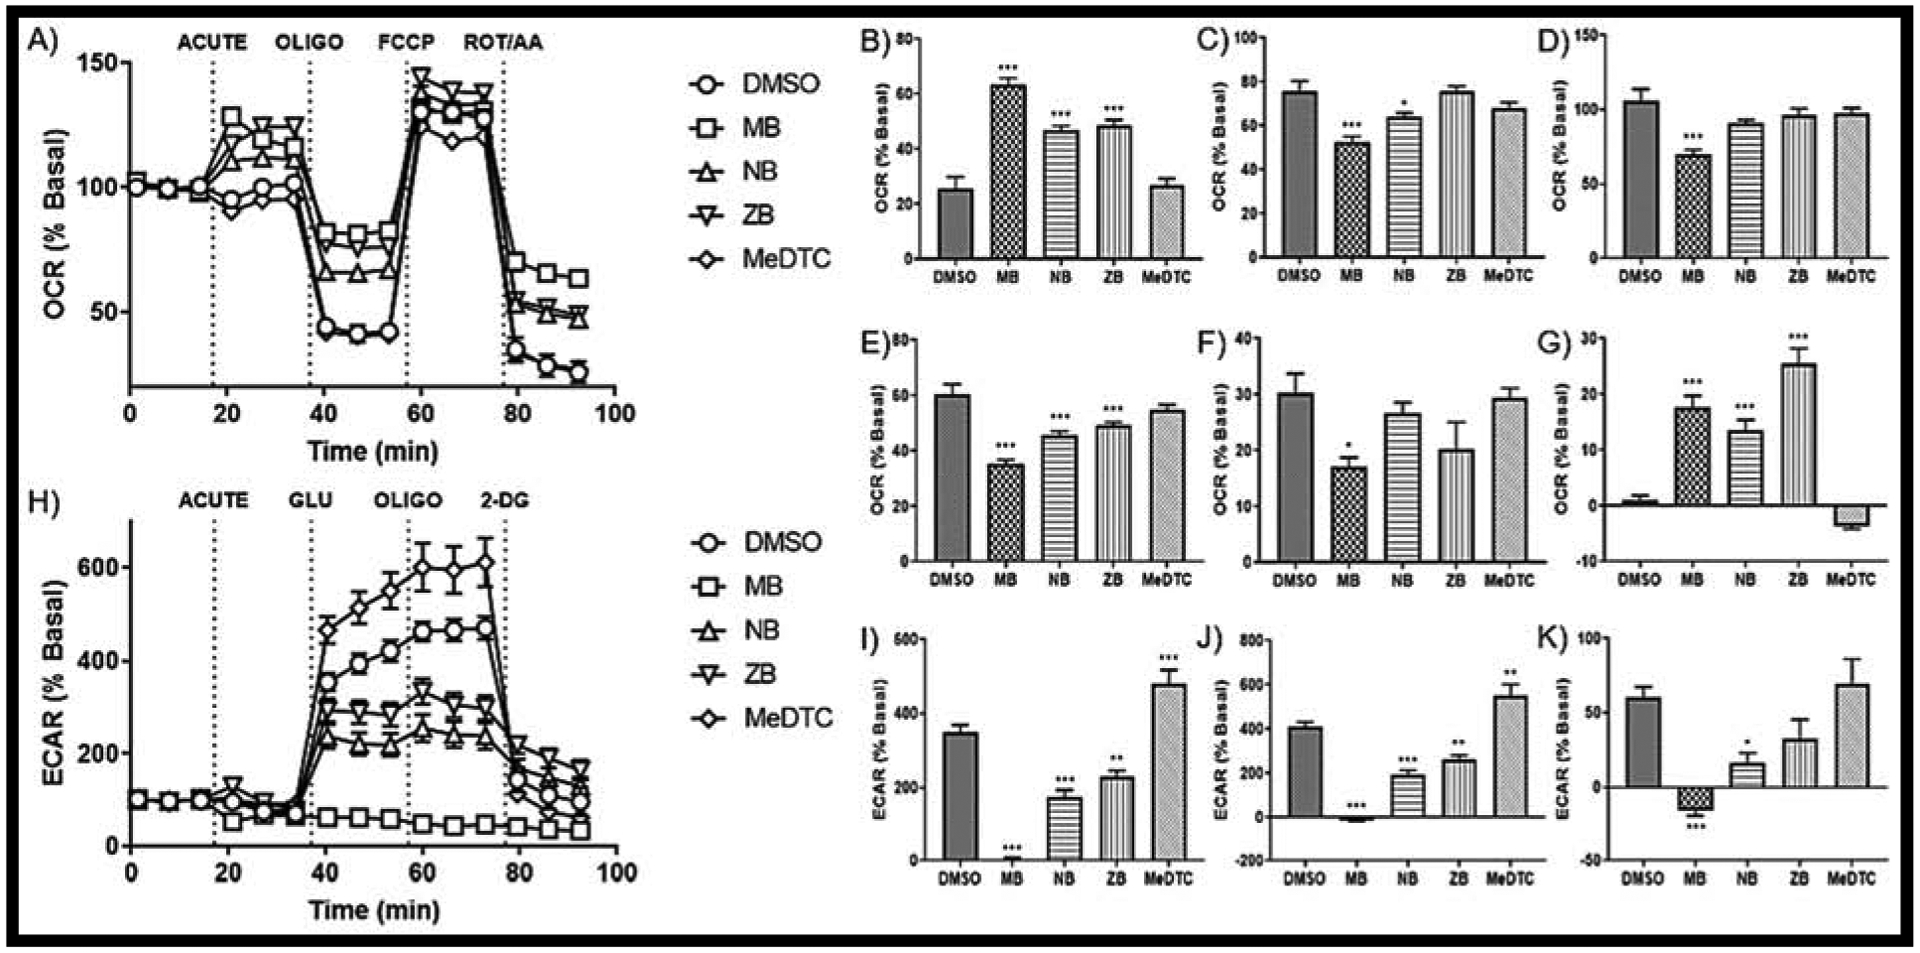
A) Seahorse XF tracer for the cell mitochondrial stress test with an acute injection of 50 μM of each compound or DMSO (0.5%) (N = 15–18, mean ± SEM). Parameters for B) Non-mitochondrial Oxygen Consumption, C) Basal Respiration, D) Maximal Respiration, E) ATP Synthesis, F) Spare Respiratory Capacity, and G) Acute Response were calculated per Agilent. H) Seahorse XF tracer for the glycolysis stress test with an acute injection yielding parameters for I) Glycolysis, J) Glycolytic Capacity, and K) Glycolytic Reserve (N = 15 – 18, mean ± SEM).
The impact of these compounds on glycolysis was also evaluated using the Seahorse technology. The glycolysis stress test uses an assay media that is not supplemented with glucose, which acts as the first test reagent (FIG 4H). As previously reported, MB exposure eliminates the ECAR signal acutely in these SK-N-AS cells (DMSO = 350.0 ± 19.6%, MB = 5.3 ± 3.2%, FIG 4I) [13]. NB and ZB exposure resulted in impaired, but still traceable, glucose utilization, while MeDTC significantly enhanced glucose utilization (NB = 175.4 ± 18.2%, ZB = 228.4 ± 17.7%, MeDTC = 480.8 ± 36.8%, FIG 4I). Additionally, all compounds altered the glycolytic capacity of these neuroblastoma cells (DMSO = 410.3 ± 20.9%, MB = −10.6 ± 4.9%, NB = 192.0 ± 21.8%, ZB = 261.6 ± 19.6%, MeDTC = 550.6 ± 50.9%, FIG 4J). Normalizing glycolytic capacity to glycolysis, the glycolytic reserve represents decreased metabolic flexibility with MB and NB exposure (DMSO = 60.5 ± 7.0%, MB = −15.9 ± 3.3%, NB = 16.6 ± 6.5%, FIG 4K). While slightly higher, MeDTC did not significantly increase glycolytic reserve compared to control (MeDTC = 69.9 ± 16.3%, FIG 4K). With such drastic differences in energetic alterations observed between MB and the methylated DTC, we used a co-exposure, acute injection with titrated concentrations of MB and 50μM MeDTC (SUPP FIG2). Interestingly, MeDTC was unable to prevent neither MB-mediated toxicity nor alterations in lactic acid export. From this study, MB has emerged as the most potent metabolic modulator of the metal-containing dithiocarbamate compounds, as it caused the most drastic alterations in energetics of these SK-N-AS cells. However, these analyses revealed no apparent alterations from the MeDTC compound, further strengthening the hypothesis that DTC compounds impact reactive thiols thereby altering energy metabolism.
To rigorously determine the impact of reactive thiols in our system, we next compared MB and MeDTC to pairs of structurally similar small molecules (SUPP TABLE 1 [26]). These pairs included: reduced glutathione (GSH) and S-methylated glutathione (MeGSH), N-acetylcysteine (NAC) and S-methylated NAC (MeNAC), and N-oxalylglycine (NOG) and dimethyloxalylglycine (DMOG) (SUPP FIG 3). Interestingly, NOG and DMOG are structurally similar to DTC compounds with carboxyl instead of thiocarbamate moiety. No significant differences were observed between the un-methylated and methylated forms of these compounds. All compounds trended towards increased glycolysis with NAC showing significant enhancement from control, with differential results in glycolytic reserve that were not significantly different than control. With similar thiol containing compounds not showing similar toxicity patterns as observed in the MB/MeDTC pair, the contribution of polymer/monomer dynamics is potentially greater than once thought.
MB is only DTC compound to significantly alter mitochondrial fuel utilization in neuroblastoma
Previously published data revealed a strain on all three major mitochondrial fuel sources (glucose, glutamine and fatty acids) after acute MB exposure in these neuroblastoma cells [13]. When comparing MB to the other dithiocarbamate compounds in this study, we were not able to fully recapitulate previous results (FIG 5). Although glutamine oxidation was similar to our previous report and replicated the increase in dependency and capacity we had observed, fatty acid and glucose oxidation not only did not have a significant MB effect, the capacity is reading below the dependency even with our vehicle control. Due to these inconsistencies, we next employed stable isotope labeled tracer metabolomics to further examine these fuel pathways.
FIGURE 5: MB and NB acute exposure cause an increase in glutamine dependency in neuroblastoma.
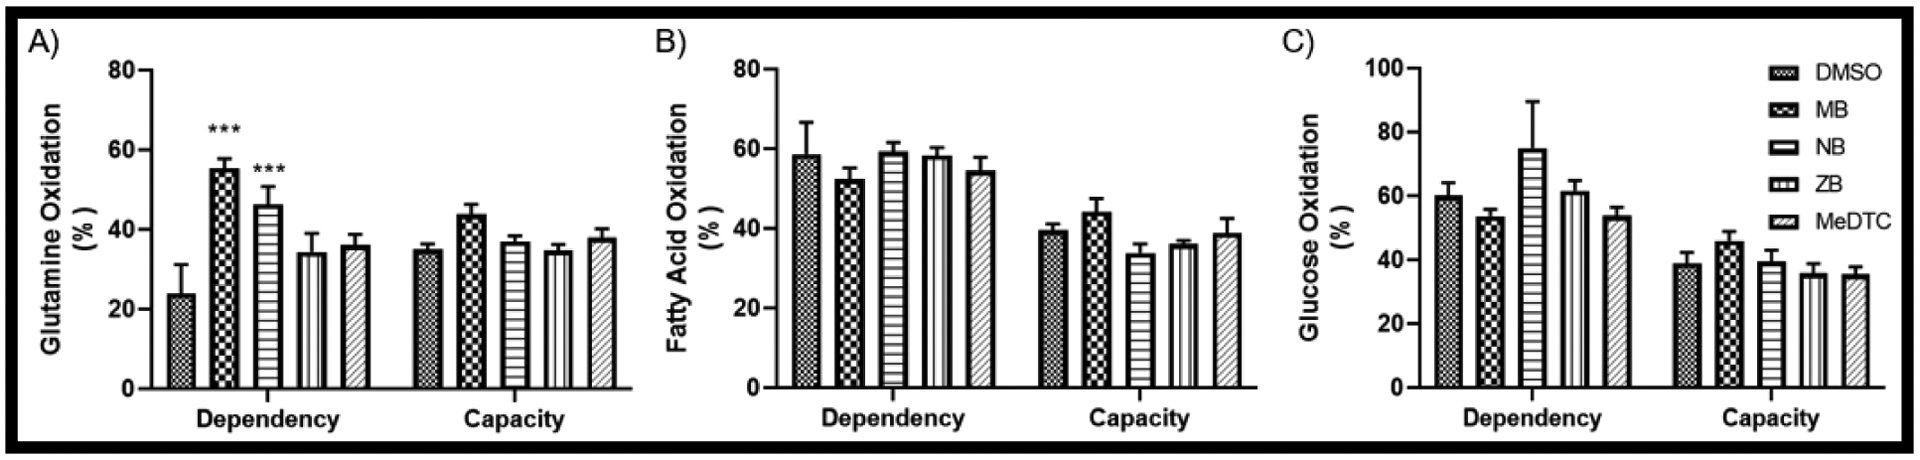
An acute Mitochondrial Fuel Flex Test was utilized on the Seahorse XF analyzer, yielding dependency and capacity measures for A) Glutamine, B) Fatty Acids, and C) Glucose (N = 5 – 6, mean ± SEM).
MB modifies central carbon metabolism in SK-N-AS cells
Stable isotope-labeled (SIL) tracers have been utilized to track metabolic flux within biological models, giving a snapshot of a nutrient’s metabolism and compartmentalization after an exposure [23, 27]. Here we employed four SIL tracers to expand on previous results showing alterations in mitochondrial respiration, glycolysis, lactate dynamics, and glutamine oxidation (SUPP FIG 4). Uniformly labeled glucose (U-13C glucose) and glucose with the first three carbons labeled ([1,2,3]-13C glucose) enriches traditional glycolysis and pyruvate oxidation pathways, as well as glucose shunting into the pentose phosphate pathway (PPP) (FIG 6A). Our analyses show that MB treatment results in rapid glucose uptake (FIG 6B–D), which is then diverted into the PPP, as evidenced by the MB-mediated increases in PPP metabolites (FIG 6E–F) and potential inhibition of GAPDH, as evidenced by increased glyceraldehyde 3-phosphate, decreased 1,3-bisphosphoglycerate. Consequently, we see a decrease in ATP synthesis (FIG 6G), as well as oxidative metabolites in the TCA cycle from glucose across both SIL tracers.
Figure 6: [1,2,3-13C]- and [U-13C]-Glucose SIL metabolomics.
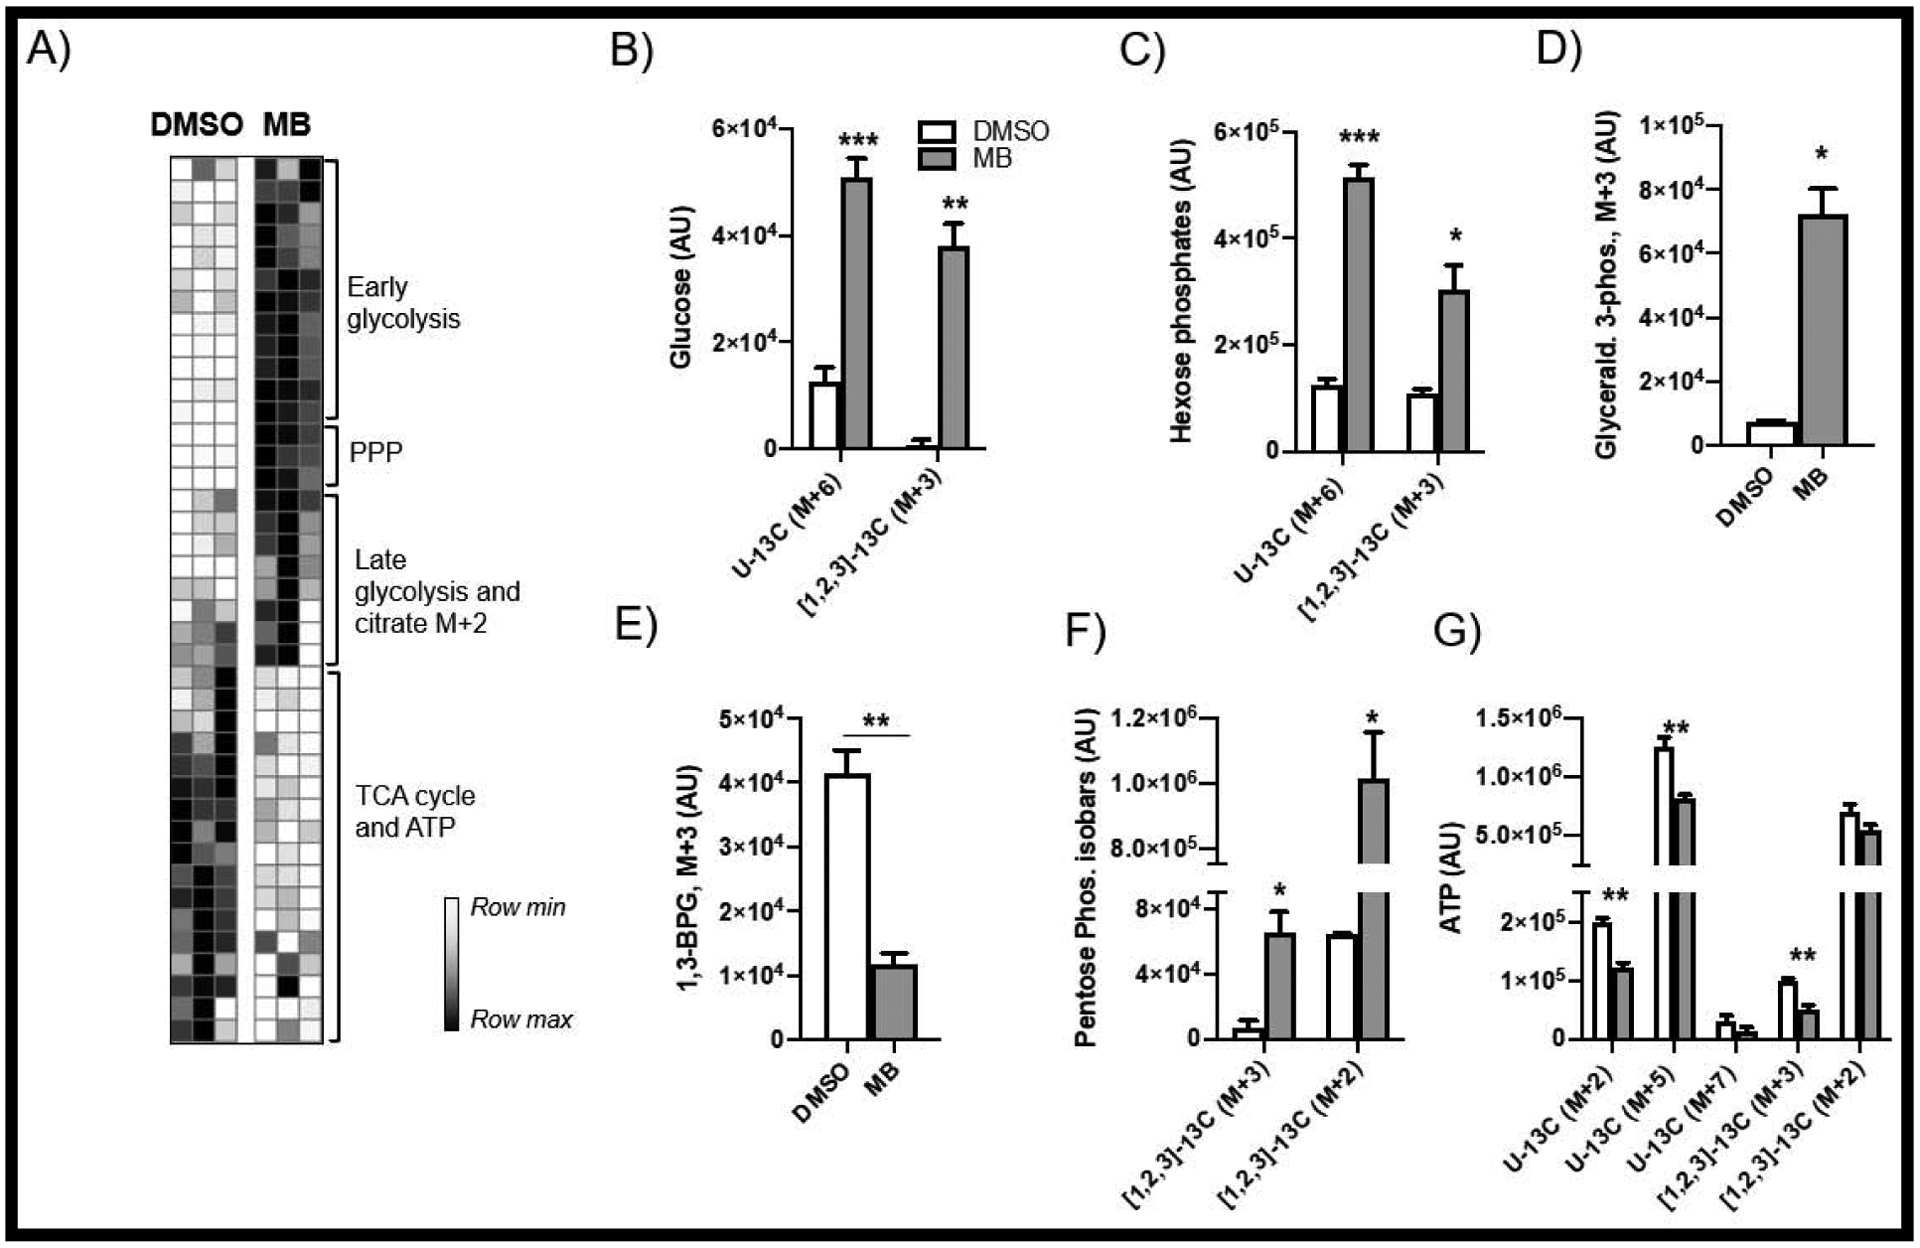
(A) demonstrates redox regulation of glycolysis (B-E) resulting in increased usage of the pentose phosphate pathway (F) and decreased ATP production (G). (H) A schematic of altered glycolytic pathways.
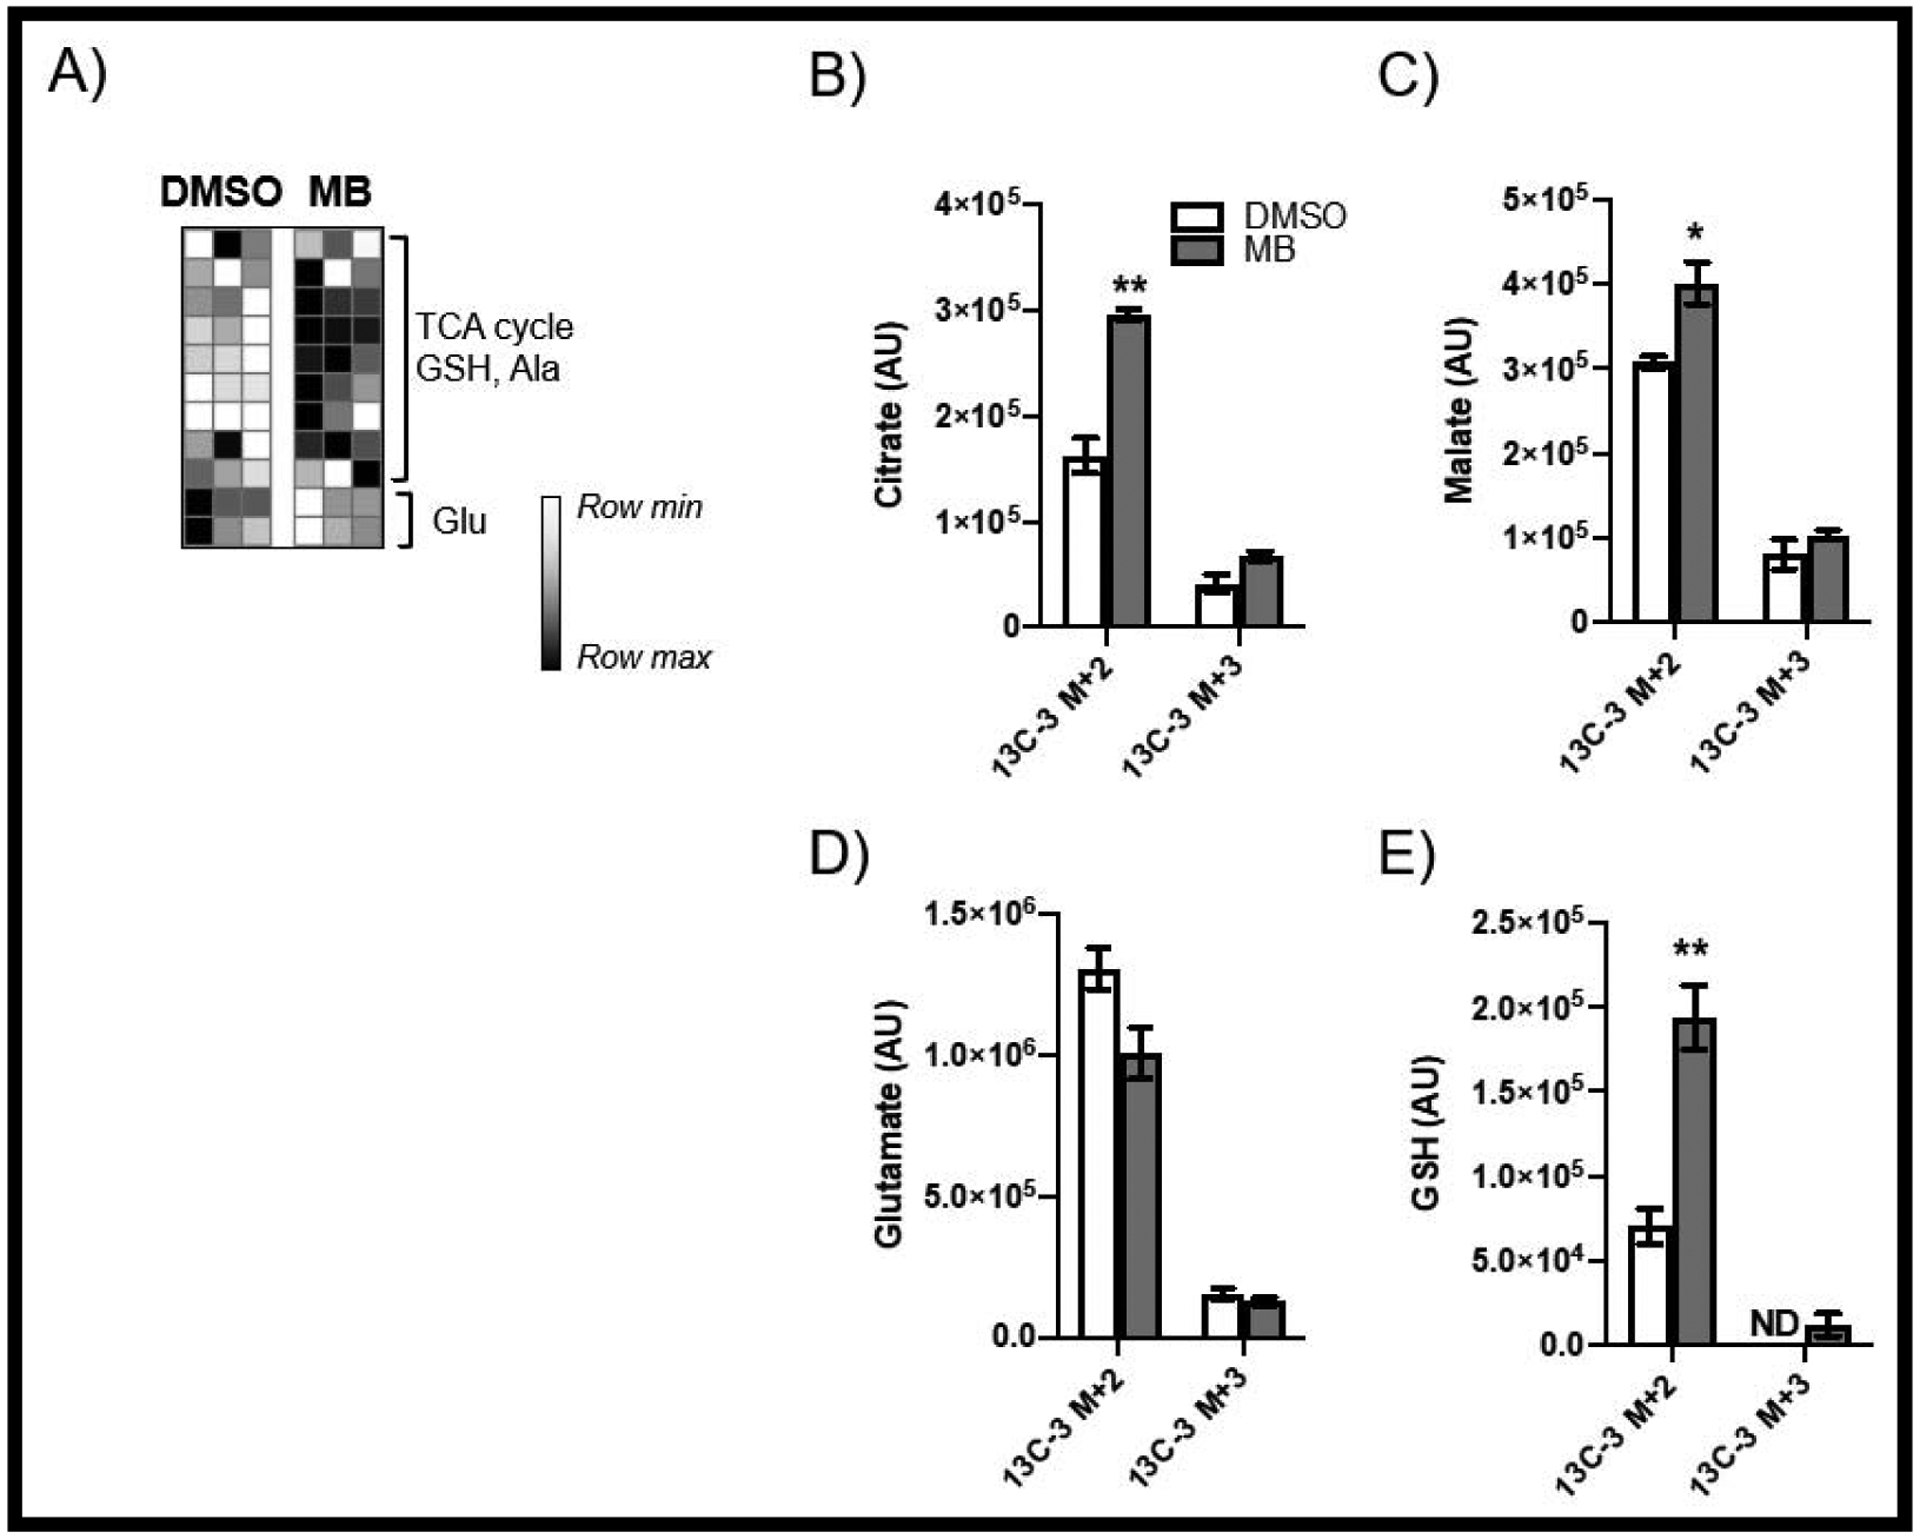
Labeled glutamine (13C5,15N2) enriches for glutamine oxidation, as well as glutamate transformation and glutathione synthesis (FIG 7A). Uptake of glutamine was not significantly impacted by MB treatment, yet newly synthesized glutamate was sharply decreased (FIG 7B–C) along with labeled GSH (FIG 7D). We observed a slight accumulation of labeled citrate (FIG 7E), and significantly decreased levels of key TCA substrate and transamination by-product alpha-ketoglutarate (FIG 7F). Interestingly, MB-mediated decreases of alanine and aspartate were detected, potentially indicating an upregulation of alanine metabolism in the context of gluconeogenesis (FIG 7G–H). These data are in agreement with the fuel flexibility assays in that MB treatment results in significant dependence on glutamine oxidation for energy production.
FIGURE 7: Metabolism of [13C5,15N2] Glutamine.
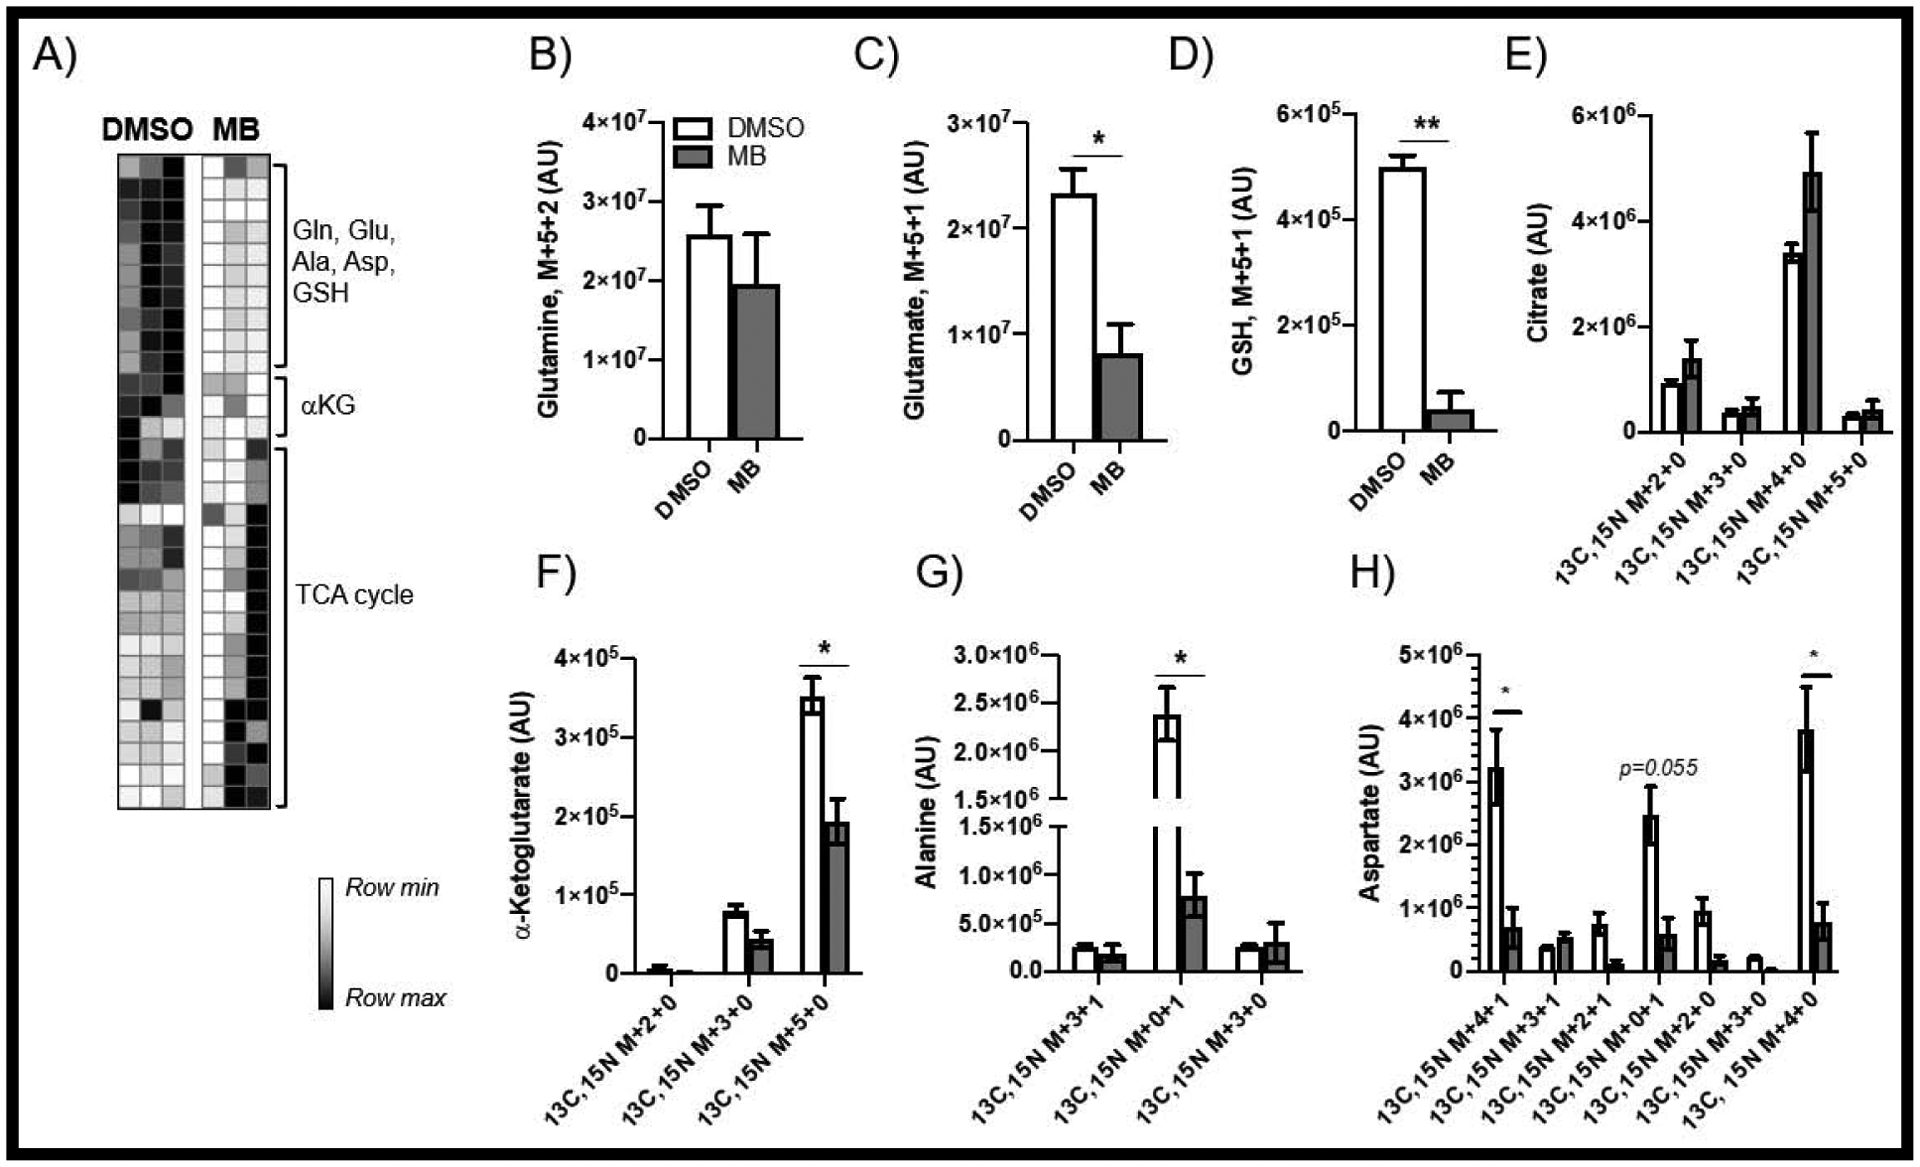
(A) shows decreased incorporation of labeled glutamine (B) into GSH (D) and increased TCA cycle usage (C,E,F) and possible transamination (G,H).
With the glucose SIL tracers revealing that glucose utilization and oxidation is not decreased in MB exposed neuroblastoma cells and Seahorse results showing eliminated glucose-associated acidification, these results may indicate a possible modification of lactate dynamics. Thus, we investigated lactate usage by increasing extracellular lactate during MB exposure, simulating nutrient support from astrocytes [28, 29] (FIG 8A). As we hypothesized, after 2 hours metabolizing 13C3-labeled lactate, enriched TCA intermediates were increased after MB exposure (FIG 8B–C), demonstrating that MB-exposed cells use lactate as an alternative fuel source under metabolic stress. Of particular interest, we also observed that lactate is a preferred substrate to be incorporated into newly synthesized GSH (FIG 8D–E). Together, these data indicate that, under MB-mediated stress, cells will take up lactate from the external environment and utilize this carbon source for ATP production and anabolic processes such as protein and GSH synthesis.
FIGURE 8: Assessment of [13C3] Lactate Metabolism.
(A) demonstrates that MB-treatment results in uptake and usage of exogenous lactate in the TCA cycle (B-D), as well as incorporation into GSH (E).
MB does not appear to be methylated in neuroblastoma cells
Due to the varied toxicity among dithiocarbamate fungicide compounds and the seemingly divergent mechanism observed in MeDTC exposure, we next assessed whether cellular enzymes methylate these exogenous chemicals. S-Adenosylmethionine (SAM) is the primary methyl donor for enzymatic methylation, yielding the metabolite S-adenosylhomocysteine (SAH). A commercial ELISA kit was used to quantify cellular SAM abundance after 2 hours of exposure to the dithiocarbamate compounds (FIG 9A). Results of these assays showed that MB significantly decreased cellular SAM levels compared to control (MB = 82.1 ± 3.6%). NB and ZB treatment resulted in minor, non-significant decreases in SAM, while MeDTC had no impact on SAM levels. Next, we utilized LC/MS/MS to evaluate if MeDTC could be detected within cells treated with MB. Controls were made in culture media and injected to establish a concentration curve, followed by cell lysates after 2h exposure to the DTC compounds (FIG 9B). No significant amount of MeDTC was created in cells exposed to DTC compounds for 2 hours (FIG 9C). These data clearly indicate that MeDTC is not a significant metabolite in dithiocarbamate treated SK-N-AS cells.
FIGURE 9: MB is not methylated in neuroblastoma.
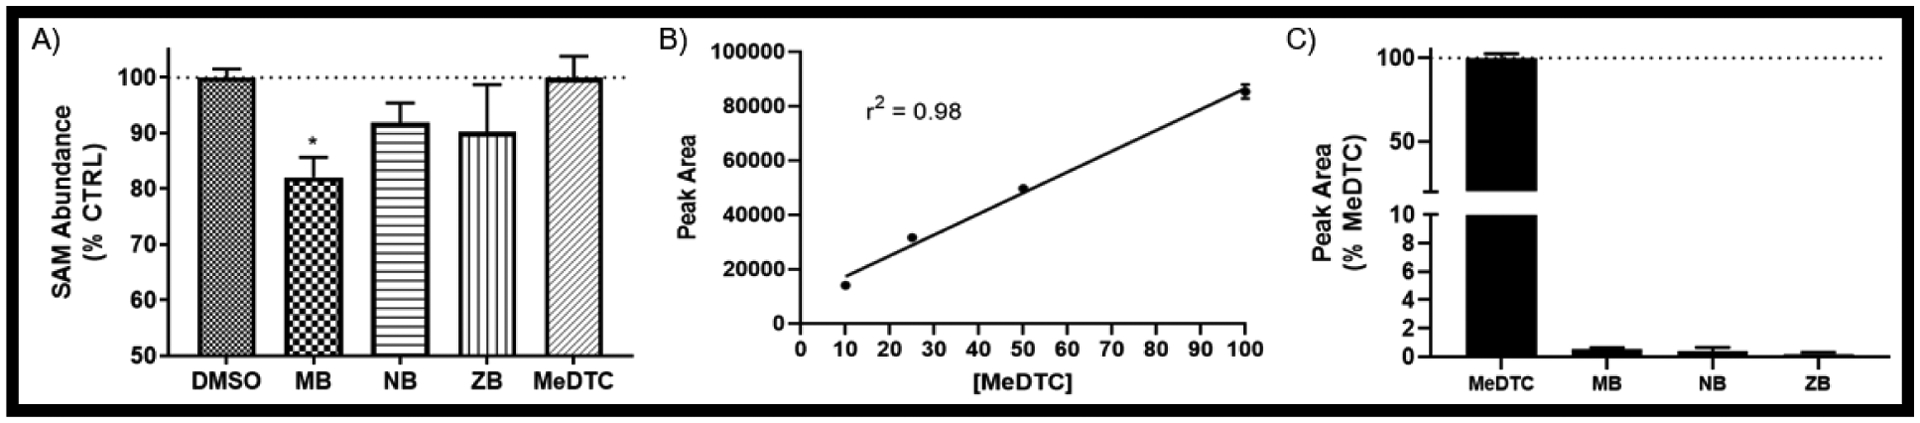
A) ELISA on cell lysates for S-Adenosyl Methionine (SAM) after a 2 hr exposure to DTC compounds (N = 3 – 6, mean ± SEM). B) Peak area and line-of-best-fit for linear regression of spiked MeDTC standards in SK-N-AS cells for 2 hours by LC/MS/MS (N = 3, mean ± SEM). C) Peak area of 50 μM equivalents of each DTC compounds after a 2 hour exposure in SK-N-AS (N = 3, mean ± SEM).
Discussion
The data gathered from this investigation have furthered our ability to gain insight into PD-associated mechanisms, as well as define the MB contribution to the experimental co-exposure model for PD research. Previous research on MB has identified many global and targeted effects seen in both in vitro and in vivo models, yet researchers have struggled to produce targets for therapeutic intervention. Our observations here provide critical new pathways disrupted with MB exposure that may play a role in the associated PD mechanisms. For instance, the acute disruption of glycolysis after MB exposure reveals alterations in glucose utilization, having both direct and global effects on cell health and viability. Glycolysis disruptions have been observed in PD, with therapeutic enhancement showing promising results of PD attenuation in both clinical models and databases [30–32]. The direct MB-mediated alterations in glucose utilization, as well as changes in glutamine oxidation, are currently being investigated by our group in both neuroblastoma and differentiated human dopaminergic-like neurons.
Here, we separated the toxicities of four different dithiocarbamate compounds, establishing that MB represents the model dithiocarbamate compound, with the highest measured affects among the metal-containing chemicals. However, S-methylation did not eliminate toxicity, but rather presented a divergent and novel mechanism of action. This observation led us to postulate that dithiocarbamate toxicity may be either modulated through monomer/polymer properties and/or via enzymatic biotransformation. Several observations presented here support the idea that both mechanisms are in play. First, we showed that methylation of the dithiocarbamate core leads to energetic modulations not seen with any of the three metal-containing molecules. Yet, co-exposure of MB and MeDTC followed the toxicity profile of MB, with no modification with the presence of MeDTC (SUPP FIG 2). The methylated dithiocarbamate had a distinct toxicity profile from the other dithiocarbamate compounds and should be studied further for its potential anti-proliferative effect in neuroblastoma. Second, cellular SAM abundance was decreased following MB exposure (FIG 9A), yet MeDTC was not detected by mass spectrometry in cells after exposure to the dithiocarbamate compounds (FIG 9C). Finally, the WST-1 results (FIG 1B) may provide further insight into the fate of these compounds once inside the cell, as the differences observed may be representative of the dissociation of the metal component of each of the three dithiocarbamate compounds. It is reasonable to believe that ZB and NB would have a smaller reduction in WST-1 activity compared to MB, as the dye transformation is mainly dependent on glycolysis-derived NAD(P)H and these compounds did still have a reduction in glycolysis compared to control. However, an increase in WST-1 activity was observed and the effects of these compounds on NAD(P)H need to be further studied. If they do dissociate from their metal component, supplementation with free zinc has been shown to increase mitochondrial energy turnover in similar cellular concentrations (50μM ZnSO4) as our study [33–35]. Similarly, an increase in free cytosolic sodium would modify the activity of sodium/calcium transporters such as the Mitochondrial Sodium Calcium Exchanger (NCLX), increasing mitochondrial Ca2+ and subsequently increasing mitochondrial energy turnover [36–38]. However, it is difficult to estimate how our concentration of Na (50μM) added to the system would affect the expansive whole-cell balance of Na and Ca. Manganese has been shown to reduce mitochondrial parameters in similar neuronal systems, yet in our system with SK-N-AS cells, we have previously reported no alterations of these cells with 50μM MnCl2 [13, 39, 40]. However, both reviews by Harischandra et al. and Smith et al. outline the many PD-relevant pathways disrupted by Mn exposure, and we cannot discard the potential contribution to this model. If we had observed a decrease in mitochondrial parameters in our MnCl2 exposure, it would be easy to surmise that all three compounds lose their metal components within the cell allowing for the reactive thiols to interact with cytosolic and mitochondrial proteins. Another possible explanation is a change in electronegativity caused by the metal component, making the free sulfur more reactive. We propose that MB maintains the Mn component, consequently maintaining its polymer configuration. Within our system, we were not able to delineate any MeDTC effect on MB-mediated alterations in energetics or viability, yet others have reported S-methylation of DTC pesticides as bioactivation necessary to fulfill their role as ALDH inhibitors [41]. Of interest is the observation of increased glycolysis and increased Prx3 abundance after MeDTC exposure, as other groups have shown increased glycolysis after knockdown of Prx3 in certain cellular systems [42]. This phenotype is currently being investigated to elucidate the mechanism by which MeDTC impacts glycolysis.
We must consider the implications of direct adduction of MB onto protein thiols. We have previously reported on MB-specific alterations in protein abundance and expression of Trx/Prx proteins 24 hours after exposure in SH-SY5Y neuroblastoma cells [10]. Additionally, we have reported region-specific carbonylation of proteins within the brains of mice exposed to MB [7]. This was followed up by proteomics of an in situ model of recombinant Trx1 protein in which a MB-specific shift represented direct thiol adduction of the ethylene bis-dithiocarbamate (EBDTC) structure [16]. In combination with our data showing a MB-specific modification of Prx3 protein within neuroblastoma cells (FIG 3G), direct MB adduction onto protein thiols presents a major mechanism of toxicity for both MB exposure as well as PD. First, “manebylation” of catalytic and/or allosteric thiols may have global affects through extensive pathway modulation. For instance, MB adduction could be the direct mechanism in which dehydrogenase enzymes are inhibited [43, 44]. These oxidoreductase enzymes rely on catalytic cysteine thiols to use NAD+, NADP+, or FAD as electron acceptors for the removal of water. Many biological pathways observed to be disrupted after MB exposure have dehydrogenase enzymes at critical points within the system for metabolite synthesis, such as TCA cycle (succinate/malate dehydrogenase, SDH/MDH), glycolysis (glucose 6-phosphate dehydrogenase, G6PDH, glyceraldehyde 3-phosphate dehydrogenase, GAPDH), and mitochondrial signaling (pyruvate dehydrogenase, PDH) [45–47]. Our metabolomics data supports the inhibition of GAPDH as well as other critical enzymes leading to the shunting of glucose to gluconeogenesis (FIG 10). Modification of the protein thiols on GAPDH by MB would inhibit activity and cause the shunting of glucose into the PPP as observed for NADPH production (FIG 6). This lack of glucose-derived ATP would require the cells to upregulate alternative fuel sources, such as glutamine and lactate, as observed after MB exposure (FIG 7 & 8). Similar phenomena have been observed by D’Alessandro’s group in red blood cells, hinting at a highly conserved link between glucose utilization and the redox state of the cell [48]. Furthermore, the decrease in cellular alanine and aspartate support the induction of gluconeogenesis and glycogen production (FIG 7). Recently, dithiocarbamates have been shown to inhibit the critical reactive thiols of brain glycogen phosphorylase leading to accumulation of glycogen and contributing to toxicity [49]. Studies have shown that increased glucose metabolism in cancer cells eventually leads to lipogenesis from glucose and glutamine through citrate [50]. With acute MB exposure showing similar enhancement, our toxicant model potentially recapitulates the accumulation of lipid-laden cells observed in aging and neurodegeneration [51]. This change in energetic phenotype of MB-exposed cells stimulates a starvation state resulting in respiratory arrest, glucose storage, and eventual apoptosis.
FIGURE 10:
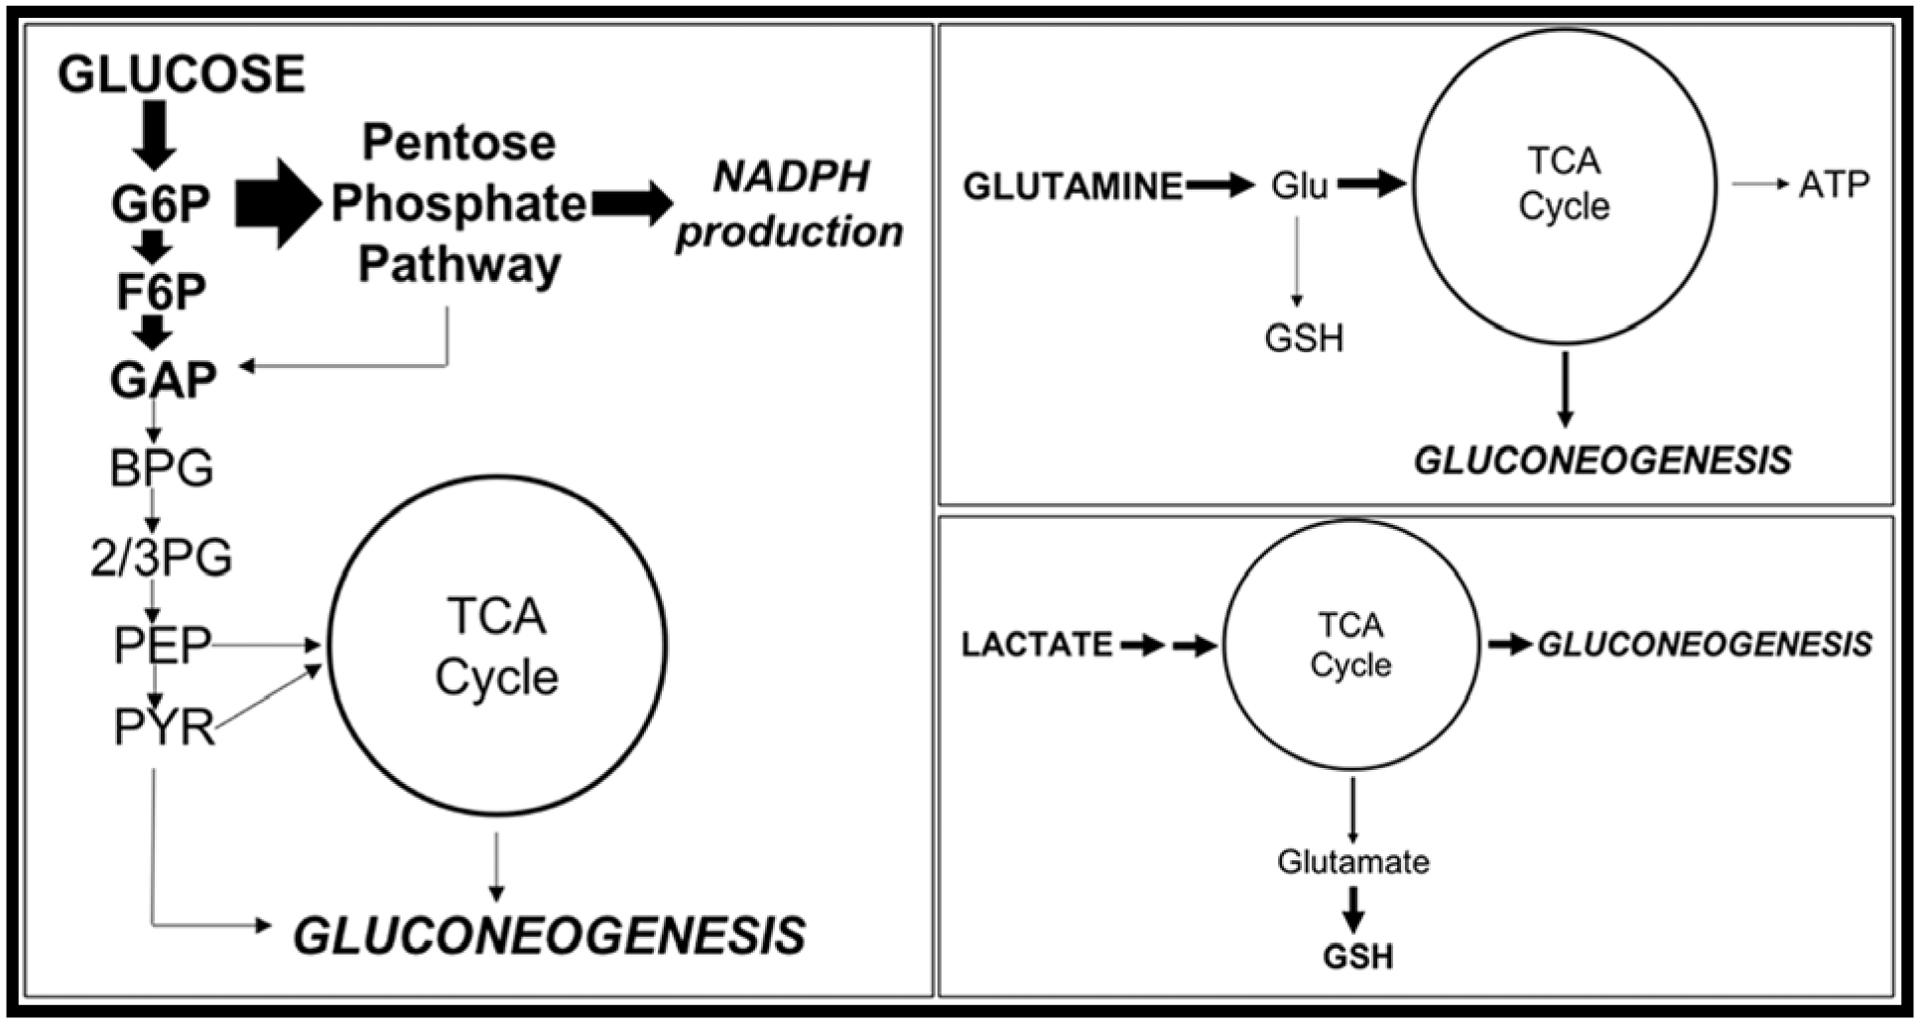
Acute MB exposure causes a diversion of energy substrates to gluconeogenesis in neuroblastoma cells.
Although currently we cannot separate phenotypic changes in neuroblastoma cells exposed to MB from direct MB action on energetic proteins, it is plausible that both play an important role in the induction of stress pathways such as the pentose phosphate pathway as well as iNOS and Nrf2 [10, 52]. Cellular mechanisms utilized for the S-glutathionylation of proteins (i.e. glutathione S-transferase, GST) may not be able to resolve manebylation of protein thiols. In typical stress scenarios, GST proteins will utilize the high concentrations of GSH within the cell to protect protein thiols from a highly oxidative event [53, 54]. When the redox state of the cell is resolved, GST proteins will then remove GSH from protein thiols to return their function. In this instance, it is possible that these enzymes may use MB as a GSH mimic, enzymatically adducted onto protein thiols. Due to structural and chemical differences from GSH, transferases may not be able to resolve the manebylation to restore cysteine function. Interestingly, GST enzymes have recently become an interest in both cancer and neurodegenerative disease [55]. Contribution of PQ to the co-exposure model of PD provides a unique interaction if GST proteins are involved. As previously mentioned, PQ has been thoroughly defined as a redox cycler and ROS generator. Adding the ROS signal to the model, initiating GST-mediated glutathionylation (or manebylation) of protein thiols would greatly enhance this toxic effect. Furthermore, the co-exposure model will contain enhanced DOPAL synthesis concurrent with ALDH2 inhibition. Investigation into the involvement of GST and the possible enzymatic manebylation of protein thiols is currently underway.
In conclusion, the MB/PQ co-exposure model of PD contains a complex interaction of toxicities of the individual components, ultimately leading to the apoptosis of dopaminergic neurons. PQ contributes ROS generation and GSH oxidation, yet MB’s full mechanism has yet to be reported. Our data suggest a complex mechanism of action that leads to dysfunctional mitochondria via direct interaction with highly sensitive protein thiols and Fe-S clusters within a variety of critical metabolic enzymes. This proposed mechanism is supported by SIL tracer metabolomics showing pathway alterations at critically affected dehydrogenase enzymes across multiple intermediates. As mechanisms within our model are described, we see multiple avenues for apoptosis induction in these cells from mitochondrial signaling, GSH oxidation, glycogen accumulation, and mitochondrial iron accumulation. Also, the polymer configuration of MB may provide spatial proximity to mitochondrial protein thiols for interaction, contributing to its mitochondrial targeting. Lastly, this specific toxicant model can continue to provide novel insight into the cellular redox environment and interactions involved in PD.
Supplementary Material
Maneb displays greater cytotoxicity in SK-N-AS cells compared to similar dithiocarbamates compounds zineb and nabam.
Acute exposure to maneb results in significant alterations in glycolytic and mitochondrial function.
Stable isotope labeled tracer metabolomics confirm maneb-mediated metabolic dysfunction and significantly modulated central carbon metabolism.
Maneb is a thiol reactive substance that mediates metabolic and toxic effects via protein thiol modification.
Acknowledgements
The research was supported by funds provided by grants from the Skaggs School of Pharmacy and Pharmaceutical Sciences Associate Dean for Research seed grant program, and the National Institutes of Health (R01 ES027593 (JRR) and T32 ES029074 (CCA)). Additionally, we would like to acknowledge Dr. Nichole Reisdorph and Dr. Kevin Quinn of the UC Denver School of Pharmacy MS Core for their aid in LC/MS/MS analyses and Sarah Gehrke and Eric Bohrnsen from the UC Denver School of Medicine MS Core for their technical support with SIL experiments.
Footnotes
Publisher's Disclaimer: This is a PDF file of an unedited manuscript that has been accepted for publication. As a service to our customers we are providing this early version of the manuscript. The manuscript will undergo copyediting, typesetting, and review of the resulting proof before it is published in its final form. Please note that during the production process errors may be discovered which could affect the content, and all legal disclaimers that apply to the journal pertain.
References
- 1.Nicolopoulou-Stamati P, et al. , Chemical Pesticides and Human Health: The Urgent Need for a New Concept in Agriculture. Front Public Health, 2016. 4: p. 148. [DOI] [PMC free article] [PubMed] [Google Scholar]
- 2.Mesnage R and Seralini GE, Editorial: Toxicity of Pesticides on Health and Environment. Front Public Health, 2018. 6: p. 268. [DOI] [PMC free article] [PubMed] [Google Scholar]
- 3.Olanow CW and Tatton WG, Etiology and pathogenesis of Parkinson’s disease. Annu Rev Neurosci, 1999. 22: p. 123–44. [DOI] [PubMed] [Google Scholar]
- 4.Thiruchelvam M, et al. , The nigrostriatal dopaminergic system as a preferential target of repeated exposures to combined paraquat and maneb: implications for Parkinson’s disease. J Neurosci, 2000. 20(24): p. 9207–14. [DOI] [PMC free article] [PubMed] [Google Scholar]
- 5.Morato GS, Lemos T, and Takahashi RN, Acute exposure to maneb alters some behavioral functions in the mouse. Neurotoxicol Teratol, 1989. 11(5): p. 421–5. [DOI] [PubMed] [Google Scholar]
- 6.Takahashi RN, Rogerio R, and Zanin M, Maneb enhances MPTP neurotoxicity in mice. Res Commun Chem Pathol Pharmacol, 1989. 66(1): p. 167–70. [PubMed] [Google Scholar]
- 7.Coughlan C, et al. , Comparative Proteomic Analysis of Carbonylated Proteins from the Striatum and Cortex of Pesticide-Treated Mice. Parkinsons Dis, 2015. 2015: p. 812532. [DOI] [PMC free article] [PubMed] [Google Scholar]
- 8.Fei Q and Ethell DW, Maneb potentiates paraquat neurotoxicity by inducing key Bcl-2 family members. J Neurochem, 2008. 105(6): p. 2091–7. [DOI] [PubMed] [Google Scholar]
- 9.Patel S, et al. , Status of antioxidant defense system and expression of toxicant responsive genes in striatum of maneb- and paraquat-induced Parkinson’s disease phenotype in mouse: mechanism of neurodegeneration. Brain Res, 2006. 1081(1): p. 9–18. [DOI] [PubMed] [Google Scholar]
- 10.Roede JR, et al. , Maneb and paraquat-mediated neurotoxicity: involvement of peroxiredoxin/thioredoxin system. Toxicol Sci, 2011. 121(2): p. 368–75. [DOI] [PMC free article] [PubMed] [Google Scholar]
- 11.Castello PR, Drechsel DA, and Patel M, Mitochondria are a major source of paraquat-induced reactive oxygen species production in the brain. J Biol Chem, 2007. 282(19): p. 14186–93. [DOI] [PMC free article] [PubMed] [Google Scholar]
- 12.Patel S, et al. , Gene expression profiles of mouse striatum in control and maneb + paraquat-induced Parkinson’s disease phenotype: validation of differentially expressed energy metabolizing transcripts. Mol Biotechnol, 2008. 40(1): p. 59–68. [DOI] [PubMed] [Google Scholar]
- 13.Anderson CC, et al. , Acute maneb exposure significantly alters both glycolysis and mitochondrial function in neuroblastoma cells. Toxicol Sci, 2018. [DOI] [PMC free article] [PubMed] [Google Scholar]
- 14.Roede JR, et al. , Transcriptome-metabolome wide association study (TMWAS) of maneb and paraquat neurotoxicity reveals network level interactions in toxicologic mechanism. Toxicol Rep, 2014. 1: p. 435–444. [DOI] [PMC free article] [PubMed] [Google Scholar]
- 15.Zhang J, et al. , Manganese ethylene-bis-dithiocarbamate and selective dopaminergic neurodegeneration in rat: a link through mitochondrial dysfunction. Journal of Neurochemistry, 2003. 84(2): p. 336–346. [DOI] [PubMed] [Google Scholar]
- 16.Roede JR and Jones DP, Thiol-reactivity of the fungicide maneb. Redox Biol, 2014. 2: p. 651–5. [DOI] [PMC free article] [PubMed] [Google Scholar]
- 17.Domico LM, et al. , Acute neurotoxic effects of mancozeb and maneb in mesencephalic neuronal cultures are associated with mitochondrial dysfunction. Neurotoxicology, 2006. 27(5): p. 816–25. [DOI] [PubMed] [Google Scholar]
- 18.Mdaki KS, et al. , Age Related Bioenergetics Profiles in Isolated Rat Cardiomyocytes Using Extracellular Flux Analyses. PLoS One, 2016. 11(2): p. e0149002. [DOI] [PMC free article] [PubMed] [Google Scholar]
- 19.Eakins J, et al. , A combined in vitro approach to improve the prediction of mitochondrial toxicants. Toxicol In Vitro, 2016. 34: p. 161–70. [DOI] [PubMed] [Google Scholar]
- 20.Jones DP and Liang Y, Measuring the poise of thiol/disulfide couples in vivo. Free Radic Biol Med, 2009. 47(10): p. 1329–38. [DOI] [PMC free article] [PubMed] [Google Scholar]
- 21.Cox AG, et al. , Redox potential and peroxide reactivity of human peroxiredoxin 3. Biochemistry, 2009. 48(27): p. 6495–501. [DOI] [PubMed] [Google Scholar]
- 22.Kakitani A, et al. , A rapid and sensitive analysis of dithiocarbamate fungicides using modified QuEChERS method and liquid chromatography-tandem mass spectrometry. J Pestic Sci, 2017. 42(4): p. 145–150. [DOI] [PMC free article] [PubMed] [Google Scholar]
- 23.Nemkov T, Hansen KC, and D’Alessandro A, A three-minute method for high-throughput quantitative metabolomics and quantitative tracing experiments of central carbon and nitrogen pathways. Rapid Commun Mass Spectrom, 2017. 31(8): p. 663–673. [DOI] [PMC free article] [PubMed] [Google Scholar]
- 24.Nemkov T, D’Alessandro A, and Hansen KC, Three-minute method for amino acid analysis by UHPLC and high-resolution quadrupole orbitrap mass spectrometry. Amino Acids, 2015. 47(11): p. 2345–57. [DOI] [PMC free article] [PubMed] [Google Scholar]
- 25.Winterbourn CC and Hampton MB, Redox biology: signaling via a peroxiredoxin sensor. Nat Chem Biol, 2015. 11(1): p. 5–6. [DOI] [PubMed] [Google Scholar]
- 26.Pizzorno J, Glutathione! Integr Med (Encinitas), 2014. 13(1): p. 8–12. [PMC free article] [PubMed] [Google Scholar]
- 27.Reisz JA and D’Alessandro A, Measurement of metabolic fluxes using stable isotope tracers in whole animals and human patients. Curr Opin Clin Nutr Metab Care, 2017. 20(5): p. 366–374. [DOI] [PMC free article] [PubMed] [Google Scholar]
- 28.Yamada A, et al. , Lactate is an alternative energy fuel to glucose in neurons under anesthesia. Neuroreport, 2009. 20(17): p. 1538–42. [DOI] [PubMed] [Google Scholar]
- 29.Tabernero A, Vicario C, and Medina JM, Lactate spares glucose as a metabolic fuel in neurons and astrocytes from primary culture. Neurosci Res, 1996. 26(4): p. 369–76. [DOI] [PubMed] [Google Scholar]
- 30.Requejo-Aguilar R and Bolanos JP, Mitochondrial control of cell bioenergetics in Parkinson’s disease. Free Radic Biol Med, 2016. 100: p. 123–137. [DOI] [PMC free article] [PubMed] [Google Scholar]
- 31.Cai R, et al. , Enhancing glycolysis attenuates Parkinson’s disease progression in models and clinical databases. J Clin Invest, 2019. 129(10): p. 4539–4549. [DOI] [PMC free article] [PubMed] [Google Scholar]
- 32.Foltynie T, Glycolysis as a therapeutic target for Parkinson’s disease. Lancet Neurol, 2019. 18(12): p. 1072–1074. [DOI] [PubMed] [Google Scholar]
- 33.Yang X, et al. , Zinc enhances the cellular energy supply to improve cell motility and restore impaired energetic metabolism in a toxic environment induced by OTA. Sci Rep, 2017. 7(1): p. 14669. [DOI] [PMC free article] [PubMed] [Google Scholar]
- 34.Yamaguchi M, Kura M, and Okada S, Role of zinc as an activator of mitochondrial function in rat liver. Biochem Pharmacol, 1982. 31(7): p. 1289–93. [DOI] [PubMed] [Google Scholar]
- 35.Pivovarova NB, et al. , The interactive roles of zinc and calcium in mitochondrial dysfunction and neurodegeneration. J Neurochem, 2014. 128(4): p. 592–602. [DOI] [PMC free article] [PubMed] [Google Scholar]
- 36.Boyman L, et al. , NCLX: the mitochondrial sodium calcium exchanger. J Mol Cell Cardiol, 2013. 59: p. 205–13. [DOI] [PMC free article] [PubMed] [Google Scholar]
- 37.Baron S, et al. , Role of mitochondrial Na+ concentration, measured by CoroNa red, in the protection of metabolically inhibited MDCK cells. J Am Soc Nephrol, 2005. 16(12): p. 3490–7. [DOI] [PubMed] [Google Scholar]
- 38.Murphy E and Eisner DA, Regulation of intracellular and mitochondrial sodium in health and disease. Circ Res, 2009. 104(3): p. 292–303. [DOI] [PMC free article] [PubMed] [Google Scholar]
- 39.Smith MR, et al. , Redox dynamics of manganese as a mitochondrial life-death switch. Biochem Biophys Res Commun, 2017. 482(3): p. 388–398. [DOI] [PMC free article] [PubMed] [Google Scholar]
- 40.Harischandra DS, et al. , Manganese-Induced Neurotoxicity: New Insights Into the Triad of Protein Misfolding, Mitochondrial Impairment, and Neuroinflammation. Front Neurosci, 2019. 13: p. 654. [DOI] [PMC free article] [PubMed] [Google Scholar]
- 41.Staub RE, et al. , S-methylation as a bioactivation mechanism for mono- and dithiocarbamate pesticides as aldehyde dehydrogenase inhibitors. Chem Res Toxicol, 1995. 8(8): p. 1063–9. [DOI] [PubMed] [Google Scholar]
- 42.Cunniff B, et al. , Peroxiredoxin 3 levels regulate a mitochondrial redox setpoint in malignant mesothelioma cells. Redox Biol, 2014. 3: p. 79–87. [DOI] [PMC free article] [PubMed] [Google Scholar]
- 43.Dubois KP, Raymund AB, and Hietbrink BE, Inhibitory action of dithiocarbamates on enzymes of animal tissues. Tech Doc Rep SAMTDR USAF Sch Aerosp Med, 1961. 61–75: p. 1–13. [PubMed] [Google Scholar]
- 44.Atanasov AG, et al. , Inhibition of 11 beta-hydroxysteroid dehydrogenase type 2 by dithiocarbamates. Biochem Biophys Res Commun, 2003. 308(2): p. 257–62. [DOI] [PubMed] [Google Scholar]
- 45.Masato A, et al. , Impaired dopamine metabolism in Parkinson’s disease pathogenesis. Mol Neurodegener, 2019. 14(1): p. 35. [DOI] [PMC free article] [PubMed] [Google Scholar]
- 46.Li H and Dryhurst G, Oxidative metabolites of 5-S-cysteinyldopamine inhibit the pyruvate dehydrogenase complex. J Neural Transm (Vienna), 2001. 108(12): p. 1363–74. [DOI] [PubMed] [Google Scholar]
- 47.Dunn L, et al. , Dysregulation of glucose metabolism is an early event in sporadic Parkinson’s disease. Neurobiol Aging, 2014. 35(5): p. 1111–5. [DOI] [PMC free article] [PubMed] [Google Scholar]
- 48.Reisz JA, et al. , Oxidative modifications of glyceraldehyde 3-phosphate dehydrogenase regulate metabolic reprogramming of stored red blood cells. Blood, 2016. 128(12): p. e32–42. [DOI] [PubMed] [Google Scholar]
- 49.Mathieu C, et al. , Molecular Mechanisms of Allosteric Inhibition of Brain Glycogen Phosphorylase by Neurotoxic Dithiocarbamate Chemicals. J Biol Chem, 2017. 292(5): p. 1603–1612. [DOI] [PMC free article] [PubMed] [Google Scholar]
- 50.Costello LC and Franklin RB, ‘Why do tumour cells glycolyse?’: from glycolysis through citrate to lipogenesis. Mol Cell Biochem, 2005. 280(1–2): p. 1–8. [DOI] [PMC free article] [PubMed] [Google Scholar]
- 51.Shimabukuro MK, et al. , Lipid-laden cells differentially distributed in the aging brain are functionally active and correspond to distinct phenotypes. Sci Rep, 2016. 6: p. 23795. [DOI] [PMC free article] [PubMed] [Google Scholar]
- 52.Gupta SP, et al. , Involvement of nitric oxide in maneb- and paraquat-induced Parkinson’s disease phenotype in mouse: is there any link with lipid peroxidation? Neurochem Res, 2010. 35(8): p. 1206–13. [DOI] [PubMed] [Google Scholar]
- 53.Tew KD and Townsend DM, Glutathione-s-transferases as determinants of cell survival and death. Antioxid Redox Signal, 2012. 17(12): p. 1728–37. [DOI] [PMC free article] [PubMed] [Google Scholar]
- 54.Veal EA, et al. , Distinct roles for glutathione S-transferases in the oxidative stress response in Schizosaccharomyces pombe. J Biol Chem, 2002. 277(38): p. 35523–31. [DOI] [PubMed] [Google Scholar]
- 55.Allocati N, et al. , Glutathione transferases: substrates, inihibitors and pro-drugs in cancer and neurodegenerative diseases. Oncogenesis, 2018. 7(1): p. 8. [DOI] [PMC free article] [PubMed] [Google Scholar]
Associated Data
This section collects any data citations, data availability statements, or supplementary materials included in this article.