

Abstract
Objectives:
This pilot study assessed whether frontal lobe tDCS combined with complex walking rehabilitation is feasible, safe, and shows preliminary efficacy for improving walking and executive function.
Materials and Methods:
Participants were randomized to one of the following 18-session interventions: active tDCS and rehabilitation with complex walking tasks (Active/Complex); sham tDCS and rehabilitation with complex walking tasks (Sham/Complex); or sham tDCS and rehabilitation with typical walking (Sham/Typical). Active tDCS was delivered over F3 and F4 scalp locations for 20 minutes at 2 milliamp intensity. Outcome measures included tests of walking function, executive function, and prefrontal activity measured by functional near infrared spectroscopy.
Results:
Ninety percent of participants completed the intervention protocol successfully. tDCS side effects of tingling or burning sensations were low (average rating less than 2 out of 10). All groups demonstrated gains in walking performance based on within-group effect sizes (d ≥ 0.50) for one or more assessments. The Sham/Typical group showed the greatest gains for walking based on between-group effect sizes. For executive function, the Active/Complex group showed the greatest gains based on moderate to large between-group effect sizes (d=0.52–1.11). fNIRS findings suggest improved prefrontal cortical activity during walking.
Conclusions:
Eighteen sessions of walking rehabilitation combined with tDCS is a feasible and safe intervention for older adults. Preliminary effects size data indicate a potential improvement in executive function by adding frontal tDCS to walking rehabilitation. This study justifies future larger clinical trials to better understand the benefits of combining tDCS with walking rehabilitation.
Keywords: walking, rehabilitation, cognition, transcranial direct current stimulation, aging
Introduction
Frontal lobe brain networks are important to both walking and executive function. The prefrontal cortex is a critical component of executive function networks (1) and is also recruited during complex walking tasks (2–6). Furthermore, impairment of executive function is strongly associated with deficient walking function and fall risk in older adults (7). Age-related deterioration of frontal networks is therefore a probable shared mechanism contributing to decline of walking and executive function (8). There is a need for therapeutic interventions that target this important brain region.
A possible approach for augmenting the effect of walking rehabilitation is transcranial direct current stimulation (tDCS). tDCS is a noninvasive neuromodulation technique where a relatively weak electrical current is delivered through electrodes placed on the scalp (9,10). The electrical current does not cause discharge of action potentials, but rather the principal mechanism of action is subthreshold modulation of neuronal membrane potentials (11). This alters neural excitability either positively or negatively, depending on the electrode placement and stimulation parameters. tDCS is considered to be particularly effective when delivered over multiple sessions, and when paired with task-specific practice such that the same brain networks are engaged by both tDCS and the task of interest (12). tDCS may also enhance offline consolidation to “lock in” learning effects (13–15). Several prior studies have reported a possible benefit of frontal tDCS to walking function, although most delivered only a single session and/or delivered tDCS while participants were at rest (16–23).
The present pilot study tests the feasibility, safety, and preliminary efficacy of a novel therapeutic intervention to enhance both walking and executive function through neuroplasticity of frontal brain networks. The primary hypotheses were: 1) eighteen sessions of frontal lobe tDCS combined with walking rehabilitation will be safe and well tolerated by older adults; and 2) preliminary evidence of performance gains on complex walking tasks and executive function tasks will be observed for active tDCS combined with complex walking rehabilitation, as compared to control interventions with sham tDCS and/or rehabilitation that includes only typical walking.
Materials and Methods
Participants
Inclusion criteria for this study included age 65 years or older, ability to walk independently (or with just a single point cane), absence of diagnosed neurological disorders, and absence of serious medical conditions affecting walking ability or safety (e.g., recent musculoskeletal injury, heart or lung disease, or severe pain). This study sought to enroll participants who had both relatively low mobility function and executive function. Mobility screening included 10-meter walk speed, with an inclusion threshold of <1.1 meters/second. Qualifying participants also answered affirmatively to the screening statement of “You have some difficulty with walking tasks, such as becoming tired when walking a quarter mile, or when climbing two flights of stairs, or when performing household chores.” The inclusion threshold for executive function was age-adjusted percentile <40 on NIH Toolbox assessments of Dimensional Change Card Sort Test or Flanker Test (24). People with contraindications to tDCS (metal screws or plates in skull, prior brain injury, prior history of recurrent headaches) or use of neuromodulatory medications were excluded (25). The study was approved by the local institutional review board and all participants provided written informed consent.
Study Design
Participants were enrolled to a 6-week, 18-session walking rehabilitation intervention led by a licensed physical therapist. Three sessions were conducted each week, and at least one session was on a non-consecutive day. Participants were assigned to one of three groups: 1) active tDCS with complex walking rehabilitation (‘Active/Complex’ group), 2) sham tDCS with complex walking rehabilitation (‘Sham/Complex’ group), or 3) sham tDCS with typical walking rehabilitation (‘Sham/Typical’ group). Group assignment was based on stratified randomization by sex, and block randomization with groups of three were used to keep sample sizes across groups approximately consistent throughout the study. Study participants, assessors, and therapist were blinded to assignment of active or sham tDCS (see details below). tDCS was delivered concurrently with walking at every session by having the participant wear the tDCS unit in a small transparent plastic backpack, which was lightweight and did not hinder walking. This study took place in a university research setting.
Walking Intervention
Each walking rehabilitation session included 30 minutes of walking. Walking was conducted on an indoor oval-shaped walking track about 40 meters long. For consistency, all participants were prescribed a five minute rest break after 15 minutes of walking, but some participants also took additional rest breaks as needed. The typical walking intervention involved standard walking exercise. To help control for the intensity of exercise across participants and groups, all were instructed to maintain a rating of perceived exertion of 4 (moderate to strong) on the Borg Category/Ratio Scale. Exertion could be modified to meet this criterion by adjusting walking speed. The physical therapist leading the intervention encouraged lateral weight shifting, limb loading, and hip extension which promote afferent inputs to locomotor control, robust forward propulsion, and contribute to the timing of stance and swing phases (26,27).
The complex walking intervention incorporated challenges that were intended to engage motor-cognitive resources, including tasks that have been shown to recruit prefrontal cortex. These tasks including stepping over obstacles, navigating around obstacles, changing speeds, transitioning between hard and compliant surfaces (foam mats), and walking in dim lighting. Also included were cognitive distractor tasks such as spelling words backwards and performing serial subtractions. To allow for progression of task complexity, the intervention began with blocked practice (sessions 1–3; isolated complex tasks), then moved to random practice (sessions 4–9; switching between complex tasks), then combined practice (sessions 10–18; combining complex tasks) (28). This tiered approach helps participants to understanding and master each component before moving to more challenging conditions.
tDCS Intervention
Active or sham tDCS was delivered during walking rehabilitation using a commercially available tDCS unit (1×1 tES Clinical Trials Stimulator, Soterix Medical Systems, New York, NY). This stimulator is activated by a keypad code, which allows for both the participant and the therapist to remain blinded to group assignment. tDCS was delivered through two carbon rubber electrodes, each embedded within a thin 5×7cm sponge (EasyPad, Soterix Medical Systems, New York, NY). Using a syringe, the sponges were evenly moistened with 4mL of 0.9% saline solution on each side of each sponge (8mL total per sponge). The participant’s head was carefully measured according to the International 10–20 system to locate the F3 and F4 electrode sites. Current inflow occurred through the anode electrode/sponge that was centered over F4, and current outflow occurred through the cathode over F3. Each electrode was held securely and comfortably in place by specialized plastic headgear (EasyStrap, Soterix Medical Systems, New York, NY). The active tDCS setting delivered 20 minutes of 2.0mA direct current including ramping up and back down during the initial and final 30 seconds, respectively. Based on current density models, F3-F4 electrode placement delivers broad and roughly symmetrical current flow to the anterior frontal lobe of older adults (29). The intensity and duration settings are believed to produce net excitation under both the anode and cathode electrodes based on findings from motor evoked potentials with transcranial magnetic stimulation (30,31) and MRI-based connectivity analysis in prefrontal cortex (18,32). Sham tDCS followed all of the same procedures as active tDCS, but with a very short duration of stimulation. Current was ramped up to 2.0mA over the initial 30 seconds, then held constant for 30 seconds, then ramped back down to zero over the subsequent 30 seconds. The current remained at zero through the remaining 18.5 minutes. This type of short duration stimulation is considered to be an effective sham procedure because participants typically habituate to the sensation of tDCS after approximately one minute of stimulation (33,34). Therefore, the sensation is similar but in the absence of any meaningful dose. The stimulator was placed in a backpack made of clear plastic, which allowed the therapist to view the stimulator and confirm acceptable readings on the electrode contact quality indicator. The tDCS unit completed the 20 minute run time prior to the end of the walking session, which is acceptable because tDCS has been shown to elicit a sustained after-effect for at least 60 minutes following stimulation (11,35).
Assessments
Intervention Assessments
During each intervention session, total step count was measured with a pedometer (3DFitBud, 3DActive, United Kingdom) as a general measure of exercise volume. A questionnaire was also administered to assess sensory “side effects” of exercise and/or tDCS in order to gauge safety and tolerability of the intervention. This questionnaire was administered three times within each visit: before starting the tDCS/rehab session (sensations felt at that moment or since the prior visit), immediately after the session (sensations felt during the session), and 10 minutes after finishing the session (sensations felt at that moment). The sensations included fatigue, bodily pain, and tDCS-related burning, tingling, itching, headache, other head pain, nervousness, and visual changes (e.g., flashes, blurring, spots). Participants were instructed to rate their sensation on a scale from 0 (none) to 10 (strongest/worse possible).
Performance Outcome Measures
Walking and executive function assessments were conducted at three time points by examiners who were blinded to group assignment: baseline (within 2 weeks prior to starting the intervention), post-intervention (within one week after completing the intervention) and follow-up (3 months after completing the intervention). The follow up visit was an abbreviated version of our full assessment battery, with only a subset of the tests administered. Multiple tests of walking were included to adequately capture performance on tasks that required different skills. These included preferred and fast walking speed over a straight 10 meter course, preferred speed on a figure-8 walk test (36), and walking over obstacles at preferred speed on a straight 7-meter course. Preferred speed was described to each participant as “your normal and comfortable speed” and fast speed was described as “your fastest safe speed”. The obstacles consisted of foam blocks with dimensions of 61cm × 10.2cm × 10.2cm (length × width × height), which were evenly spaced over the course.
The primary executive function assessment was NIH EXAMINER, which tests the executive domains of planning, set shifting, working memory, inhibition, and fluency. It calculates separate factor scores for each domain as well as a composite executive score. Validity and reliability of this assessment has been rigorously established, and the test performance has been linked to the integrity of prefrontal cortex (1,37,38). Participants were also assessed with the Trail Making Test Part B, which assesses visual attention and task switching. It has previously been shown to be associated with walking performance in several studies of older adults (39–41).
Prefrontal activity assessed with fNIRS
Prefrontal recruitment was measured during typical walking and during walking over obstacles at baseline and post-intervention sessions with continuous-wave functional near infrared spectroscopy (fNIRS; OctaMon, Artinis Medical Systems, Nijmegen, Netherlands) to assess potential changes in executive control of walking. Participants wore a headband with eight embedded light sources that emitted near infrared light at continuous wavelengths of 760 nm and 850 nm, along with two near infrared light detectors. Separate recording channels were distinguished by time division multiplexing. The bottom of the headband was positioned approximately 1.5 cm above the nasion and the middle of the headband was aligned with the midsagittal plane of the head. All of the source-detector optode distances were 3.5 cm. Four channels of fNIRS were recorded at 10 Hz from the prefrontal cortex of each hemisphere, predominantly from Brodmann area 10. Participants performed two walking tasks: typical walking at preferred speed and walking over obstacles. For each task, fNIRS was measured using a block design where two active periods of walking were alternated with three reference periods. The active periods consisted of two laps around a 28-meter course. During the reference periods, participants stood still while counting slowly from one to thirty (approximately at the rate of one number per second) (6,42). Having all participants perform the same low-demand task during the reference period may help to prevent mind wandering to enhance consistency across participants (43). Prefrontal oxygenated hemoglobin (O2Hb) concentrations were calculated according to the modified Beer-Lambert law with differential pathlength factor of 6, then analyzed with custom programs in Matlab (Mathworks, Natick, MA, USA). Preprocessing of the raw fNIRS signals included detrending the signal and using a low-pass filter with cutoff frequency at 0.14 Hz to reduce the physiological noise (44,45). A wavelet filter was applied to reduce the influence of motion artifacts (43). Within each block (active walking or reference block), the mean value for O2Hb was calculated after excluding the initial seven seconds of data to allow for stabilization of the hemodynamic response (46). Task-related change in prefrontal O2Hb (ΔO2Hb) was calculated using the formula: ΔO2Hb = Active O2Hb – Reference O2Hb.
Data Analysis and Statistics
The primary objective of this pilot study was to establish feasibility and safety of the intervention. The secondary objective was to examine preliminary evidence of efficacy. Given the small sample size in each group, effect sizes were calculated but were not tested for statistical significance. For between-group comparisons of side effects and step count, values from all sessions were first averaged within each participant. Effect sizes were then calculated as the difference between group means divided by the standard deviation across all groups (Cohen’s d). For within-group comparisons of performance outcomes between time points (e.g., baseline versus post-intervention assessments for a single group), the change score was first calculated for each participant. Effect size was then calculated as the group mean change score divided by the standard deviation of the change scores (Cohen’s dz). For between-group comparisons of performance changes between time points (e.g., assessing how two groups differ in their change score for baseline versus post-intervention assessments), the change score was first calculated for each participant. These change scores were then averaged within each group, and the pooled standard deviation of change scores was calculated across the combined groups. Effect size was then calculated as the difference in group mean change scores divided by the pooled standard deviation (Cohen’s dz). For discussion purposes we only acknowledge effect sizes for performance outcomes that are moderate (0.50 – 0.79) or large (≥0.80).
Results
Participants
A CONSORT diagram explaining flow of participants through the study is shown in Figure 1. Demographic and mobility function data for the final cohort of eighteen participants are presented in Table 1. Each of these participants completed the full intervention protocol. Enrollment was open between November 2017 and November 2019.
Figure 1. CONSORT Flow Diagram.
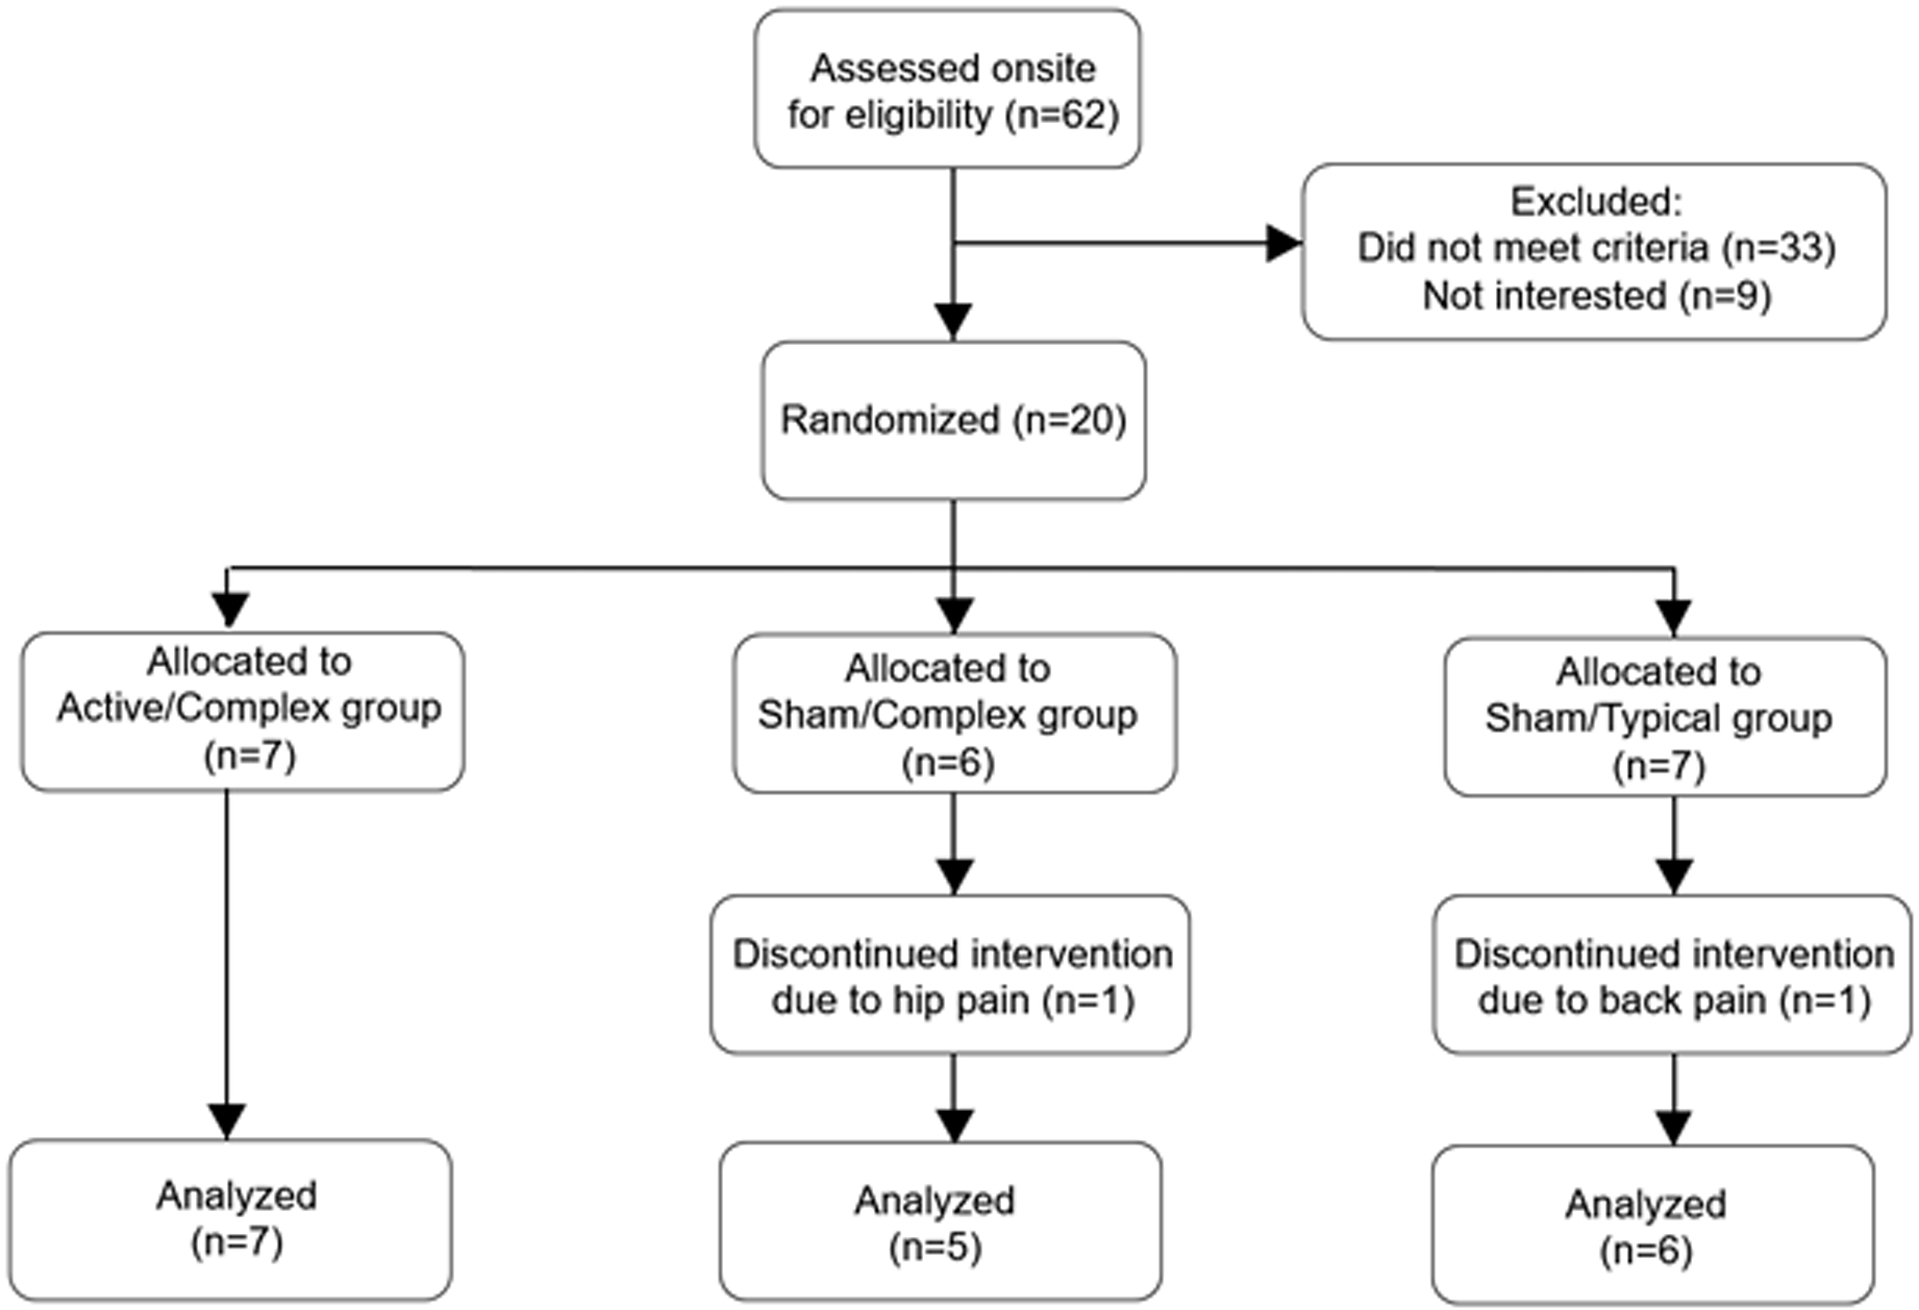
CONSORT Flow Diagram
Table 1:
Demographic Information and Mobility Function by Group
| Active tDCS and Complex Walking | Sham tDCS and Complex Walking | Sham tDCS and Typical Walking | |
|---|---|---|---|
| Age (years) | 75.4 ± 5.8 | 70.6 ± 5.2 | 73.7 ± 7.6 |
| Sex (female/male) | 5/2 | 4/1 | 4/2 |
| BMI (kg/meter2) | 31.5 ± 3.0 | 31.6 ± 5.7 | 31.1 ± 8.4 |
| Preferred Walk Speed (m/s) | 0.94 ± 0.18 | 0.95 ± 0.15 | 0.97 ± 0.12 |
| ABC Scale (out of 100%) | 81.5 ± 9.8 | 77.1 ± 16.8 | 77.1 ± 12.9 |
| BBS Score (out of 56 points) | 46.6 ± 5.4 | 48.8 ± 6.4 | 47.1 ± 3.4 |
BMI: body mass index; ABC Scale: Activities Specific Balance Confidence Scale
BBS: Berg Balance Scale
tDCS side effect questionnaire and walking step count
Results for sensory side effects reported during the intervention session are shown in Figure 2. Data from before the session and at 10 minutes after concluding the session are not shown, because the group mean values were nearly zero. Any notable exceptions are reported here in the text. Fatigue during the session (averaged across all sessions) was rated at about a level of 2 during and after each session, and predominantly refers to the effect of walking. There was no substantial difference between groups, either during or after the intervention sessions. Pain in the limbs or body (averaged across all sessions) before, during, and after the session was rated as less than 1 for each group, and was comparable across groups. Burning sensation from the tDCS (averaged across all sessions) was rated as less than 1 for each group. Although mild, there was some evidence of a more notable burning sensation in Active/Complex compared to Sham/Complex (d=0.40) and Sham/Typical (d=0.49). Tingling sensation from the tDCS (averaged across all sessions) was rated as less than 1.5 for each group. Although mild, there was some evidence of a more notable tingling sensation in Sham/Complex compared to Active/Complex (d=0.45) and Sham/Typical (d=0.61). There was only negligible reporting of other side effects on the sensory questionnaire.
Figure 2. Side effect questionnaire for combined walking/tDCS interventions.
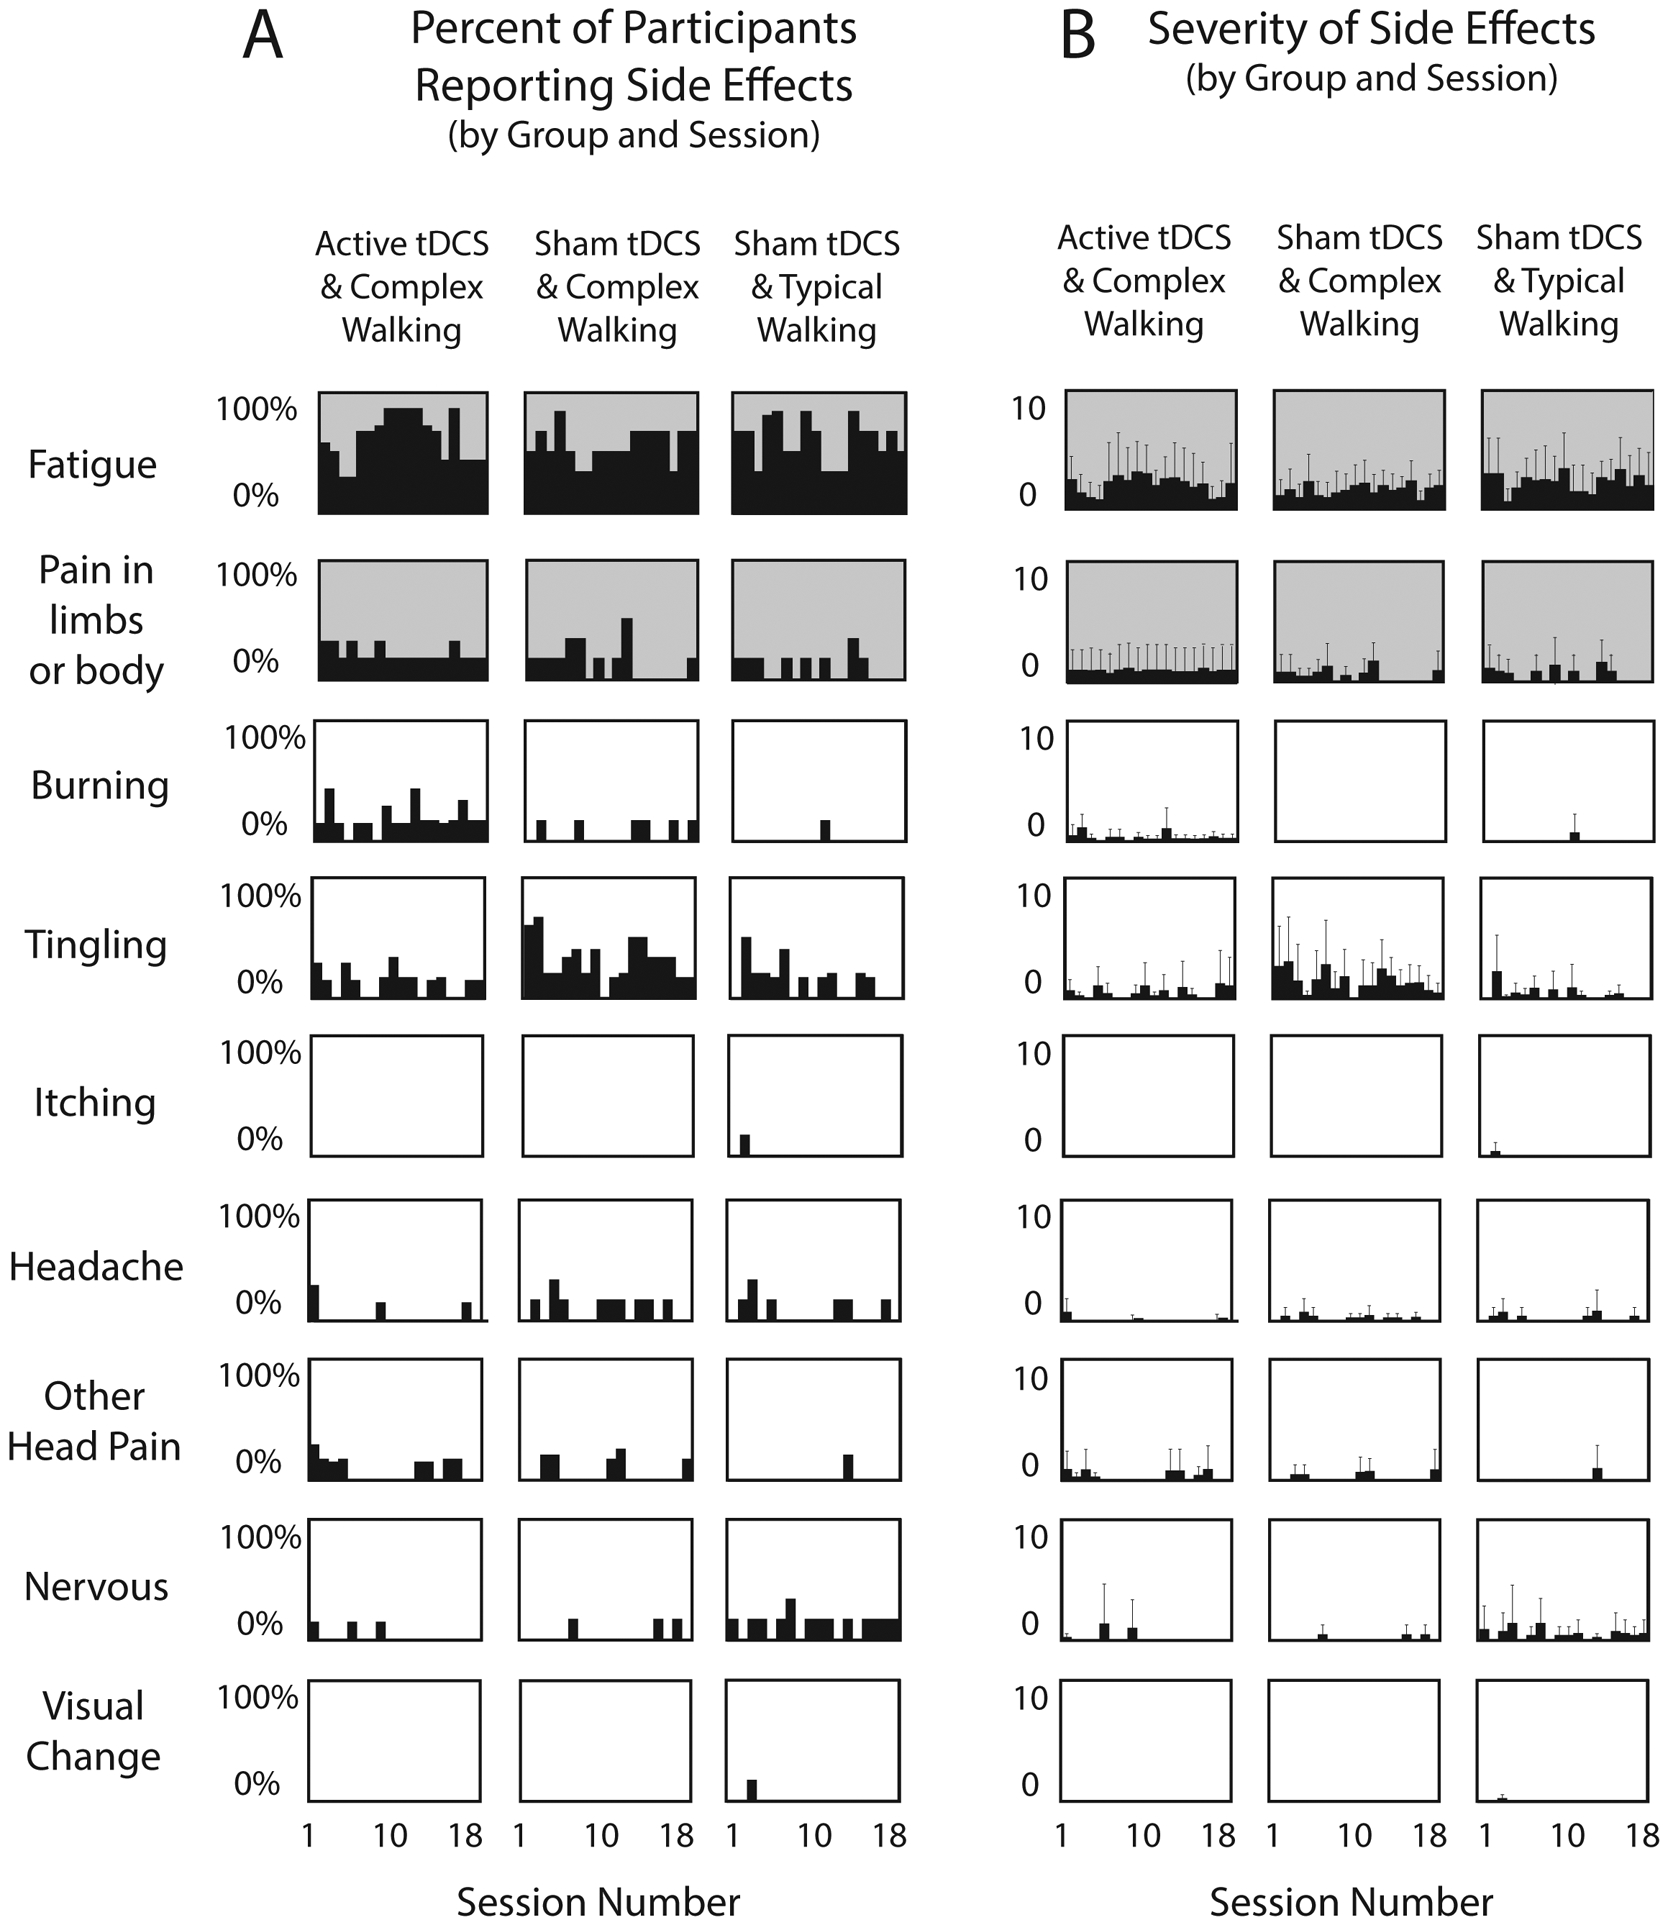
(A) For each side effect and each group, the percentage of participants who reported a side effect is plotted against the session number. (B) For each side effect and each group, the mean severity rating from all participants in the group is plotted against the session number. For both Panels A and B, shaded graphs (fatigue and bodily pain) pertain mainly to effects of walking, and white graphs pertain mainly to effects of tDCS. Error bars are standard deviation.
Step count data are shown in Figure 3. Effect sizes indicated a greater mean step count across the intervention for Sham/Typical compared to Active/Complex (38% higher, d=1.20) and compared to Sham/Complex (17% higher, d=0.62).
Figure 3. Intervention Step Count.
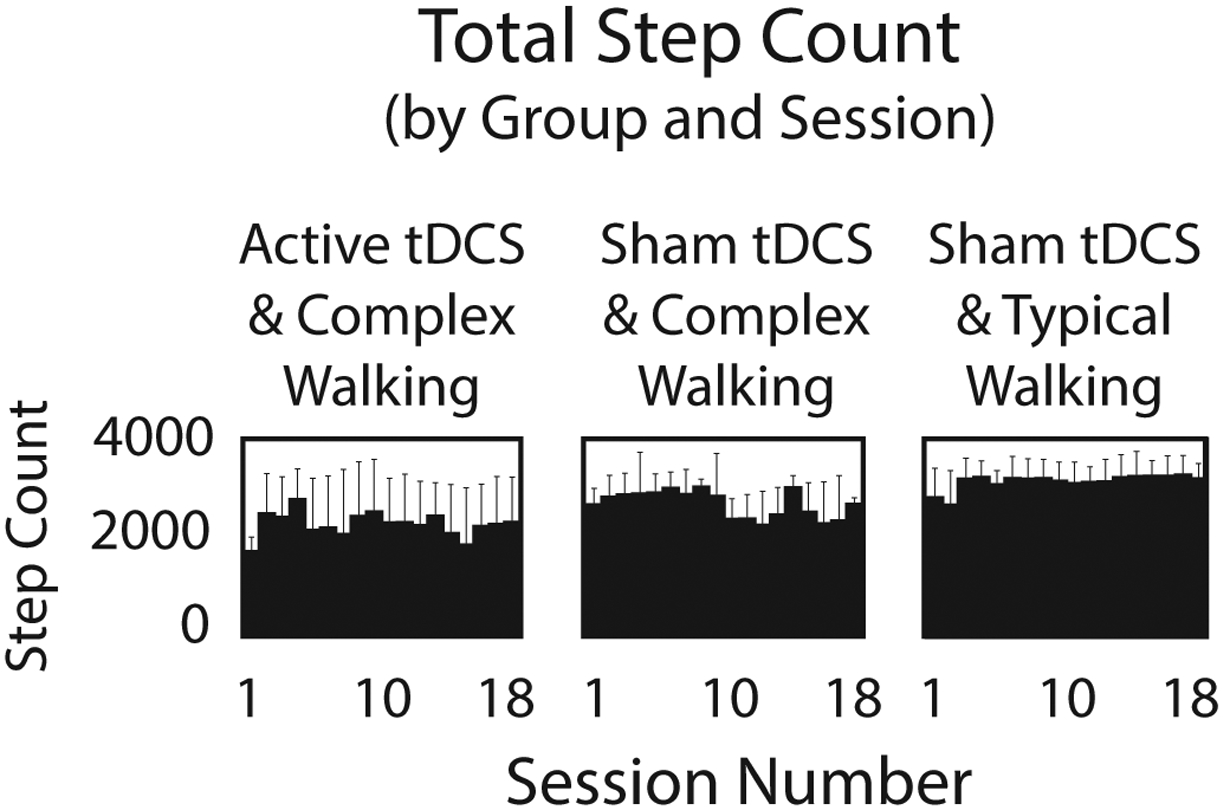
The average number of steps taken during each intervention session is shown for each group. When averaged across all session, the step count for Sham/Typical was 38% higher than Active/Complex (d=1.20) and 17% higher than Sham/Complex (d=0.62).
Performance Outcome Measures for Walking and Executive Function
Performance on the walking tasks and executive function assessments are shown in Table 2. All groups achieved gains in preferred walking speed post-intervention that approximately reached or exceeded the threshold of 0.10 m/s that indicates “substantial” clinically meaningful change (47). For each outcome measure we calculated effect sizes for within-group and between-group comparisons, which are shown in Table 3. In this section we summarize only the between-group effect sizes that were moderate or large. When comparing Active/Complex to Sham/Complex, there were moderate effect sizes for gains at post-intervention favoring the Active/Complex group for obstacle walking speed, Trailmaking Test, and EXAMINER working memory score. When comparing Active/Complex to Sham/Typical, there was a large effect for gains at post-intervention favoring Active/Complex for EXAMINER working memory score. However, at the 3-month follow up there were moderate effects favoring Sham/Typical for preferred and fast walking speed. When comparing Sham/Complex to Sham/Typical, there were moderate to large effects favoring Sham/Typical for gains in all walking speed tasks at post and/or 3-month follow up time points. Sham/Typical also showed a moderate effect for better Trailmaking Test at 3-month follow up, but Sham/Complex had a large effect for better EXAMINER working memory score post-intervention.
Table 2.
Walking and cognitive performance by group at baseline, post-intervention, and 3 month follow-up. Data shown are group means with standard deviations, and group mean change scores (first calculated by participant)
| Baseline | Post | Follow Up | Difference | Difference | ||
|---|---|---|---|---|---|---|
| Post- | Follow Up- | |||||
| Baseline | Baseline | |||||
| Typical Walk Speed (meters/second) | ||||||
| Active/Complex | 0.94 ± 0.18 | 1.03 ± 0.20 | 0.91 ± 0.19 | 0.09 ± 0.24 | −0.03 ± 0.23 | |
| Sham/Complex | 0.95 ± 0.15 | 1.10 ± 0.09 | 0.97 ± 0.22 | 0.15 ± 0.14 | 0.02 ± 0.17 | |
| Sham/Typical | 0.97 ± 0.12 | 1.12 ± 0.10 | 1.09 ± 0.07 | 0.15 ± 0.06 | 0.12 ± 0.12 | |
| Fastest Walk Speed (meters/second) | ||||||
| Active/Complex | 1.25 ± 0.21 | 1.42 ± 0.21 | 1.25 ± 0.28 | 0.17 ± 0.20 | 0.00 ± 0.23 | |
| Sham/Complex | 1.41 ± 0.32 | 1.49 ± 0.15 | 1.41 ± 0.28 | 0.07 ± 0.25 | −0.01 ± 0.16 | |
| Sham/Typical | 1.23 ± 0.24 | 1.47 ± 0.19 | 1.43 ± 0.23 | 0.24 ± 0.16 | 0.20 ± 0.29 | |
| Obstacle Walk Speed (meters/second) | ||||||
| Active/Complex | 0.77 ± 0.12 | 0.82 ± 0.17 | - | 0.056 ± 0.093 | - | |
| Sham/Complex | 0.87 ± 0.20 | 0.87 ± 0.12 | - | 0.005 ± 0.105 | - | |
| Sham/Typical | 0.77 ± 0.22 | 0.85 ± 0.11 | - | 0.076 ± 0.180 | - | |
| Figure-8 Walk Time (seconds) | ||||||
| Active/Complex | 10.57 ± 1.93 | 10.4 ± 1.41 | 10.48 ± 2.82 | −0.20 ± 2.30 | −0.09 ± 2.62 | |
| Sham/Complex | 9.58 ± 1.42 | 9.6 ± 1.80 | 9.95 ± 2.19 | 0.03 ± 0.75 | 0.37 ± 1.75 | |
| Sham/Typical | 11.00 ± 2.00 | 10.2 ± 1.03 | 9.81 ± 1.80 | −0.83 ± 1.44 | −1.20 ± 2.69 | |
| Trailmaking Test B Time (seconds) | ||||||
| Active/Complex | 146.3 ± 87.2 | 115.3 ± 57.2 | 122.9 ± 87.1 | −31.0 ± 59.7 | −23.4 ± 23.7 | |
| Sham/Complex | 69.3 ± 27.5 | 64.0 ± 19.5 | 66.3 ± 31.1 | −5.3 ± 10.4 | −3.0 ± 12.4 | |
| Sham/Typical | 100.8 ± 48.6 | 85.81 ± 34.4 | 80.5 ± 32.0 | −15.0 ± 34.8 | −20.3 ± 39.9 | |
| EXAMINER Composite Score | ||||||
| Active/Complex | −0.19 ± 0.74 | 0.13 ± 0.86 | - | 0.32 ± 0.32 | - | |
| Sham/Complex | 0.29 ± 0.22 | 0.46 ± 0.38 | - | 0.17 ± 0.34 | - | |
| Sham/Typical | 0.03 ± 0.96 | 0.34 ± 0.61 | - | 0.31 ± 0.65 | - | |
| EXAMINER Working Memory Score | ||||||
| Active/Complex | −0.89 ± 0.90 | −0.36 ± 0.99 | - | 0.53 ± 0.64 | - | |
| Sham/Complex | −0.21 ± 0.96 | 0.02 ± 0.90 | - | 0.22 ± 0.55 | - | |
| Sham/Typical | −0.12 ± 0.64 | −0.37 ± 0.62 | - | −0.25 ± 0.56 | - | |
Active/Complex: Active tDCS with complex walking training;
Sham/Complex: Sham tDCS with complex walking training;
Sham/Typical: Sham tDCS with typical walking training
Table 3.
Effect size data for each performance outcome measure, calculated within group and between groups
| Within Group | Between Group | ||||||
|---|---|---|---|---|---|---|---|
| Effect Size | Effect Size | Effect Size | Effect Size | ||||
| Post- | Follow Up- | Post- | Follow Up- | ||||
| Baseline | Baseline | Baseline | Baseline | ||||
| Typical Walk Speed (meters/second) | Typical Walk Speed (meters/second) | ||||||
| Active/Complex | 0.39 | −0.13 | Active/Complex vs. Sham/Complex | −0.27 | −0.23 | ||
| Sham/Complex | 1.03 | 0.10 | Active/Complex vs. Sham/Typical | −0.30 | −0.77 | ||
| Sham/Typical | 2.49 | 1.03 | Sham/Complex vs. Sham/Typical | 0.00 | −0.69 | ||
| Fastest Walk Speed (meters/second) | Fastest Walk Speed (meters/second) | ||||||
| Active/Complex | 0.83 | 0.00 | Active/Complex vs. Sham/Complex | 0.44 | 0.03 | ||
| Sham/Complex | 0.29 | −0.03 | Active/Complex vs. Sham/Typical | −0.40 | −0.75 | ||
| Sham/Typical | 1.55 | 0.69 | Sham/Complex vs. Sham/Typical | −0.79 | −0.81 | ||
| Obstacle Walk Speed (meters/second) | Obstacle Walk Speed (meters/second) | ||||||
| Active/Complex | 0.60 | - | Active/Complex vs. Sham/Complex | 0.53 | - | ||
| Sham/Complex | 0.04 | - | Active/Complex vs. Sham/Typical | −0.15 | - | ||
| Sham/Typical | 0.42 | - | Sham/Complex vs. Sham/Typical | −1.64 | - | ||
| Figure-8 Walk Time (seconds) | Figure-8 Walk Time (seconds) | ||||||
| Active/Complex | 0.09 | 0.03 | Active/Complex vs. Sham/Complex | 0.13 | 0.21 | ||
| Sham/Complex | −0.04 | −0.21 | Active/Complex vs. Sham/Typical | −0.33 | −0.43 | ||
| Sham/Typical | 0.57 | 0.44 | Sham/Complex vs. Sham/Typical | −0.71 | −0.67 | ||
| Trailmaking Test B Time (seconds) | Trailmaking Test B Time (seconds) | ||||||
| Active/Complex | 0.52 | 0.99 | Active/Complex vs. Sham/Complex | 0.55 | 0.94 | ||
| Sham/Complex | 0.51 | 0.24 | Active/Complex vs. Sham/Typical | 0.33 | 0.10 | ||
| Sham/Typical | 0.43 | 0.51 | Sham/Complex vs. Sham/Typical | −0.37 | −0.57 | ||
| EXAMINER Composite Score | EXAMINER Composite Score | ||||||
| Active/Complex | 1.01 | - | Active/Complex vs. Sham/Complex | 0.46 | - | ||
| Sham/Complex | 0.51 | - | Active/Complex vs. Sham/Typical | 0.02 | - | ||
| Sham/Typical | 0.48 | - | Sham/Complex vs. Sham/Typical | −0.27 | - | ||
| EXAMINER Working Memory Score | EXAMINER Working Memory Score | ||||||
| Active/Complex | 0.84 | - | Active/Complex vs. Sham/Complex | 0.52 | - | ||
| Sham/Complex | 0.41 | - | Active/Complex vs. Sham/Typical | 1.11 | - | ||
| Sham/Typical | −0.45 | - | Sham/Complex vs. Sham/Typical | 0.82 | - | ||
Sham/Typical: Sham tDCS with typical walking training
Prefrontal activity
Prefrontal activity measured by fNIRS is shown in Figure 4. For each participant, prefrontal activity was calculated for each of the eight channels and then averaged. Based on prior research related to cognitive models of brain aging (see Discussion section), the fNIRS analysis focused on between-task differences in prefrontal activity (ΔO2Hb) for typical walking versus obstacles walking. For the Active/Complex group, the mean between-task difference increased by 0.46 ± 1.15 μM from baseline to post-intervention (from 0.45 to 0.91). For the Sham/Complex group, the mean between-task difference increased by 0.08 ± 1.37 μM (from 0.70 to 0.78). For the Sham/Typical group, the mean between-task difference increased by 0.28 ± 0.70 μM (from 0.01 to 0.29). Formal statistical comparisons between groups were not feasible due to the small sample sizes, but between-group effect sizes were calculated and were inconsequential (d < 0.35).
Figure 4. Prefrontal activity during walking.
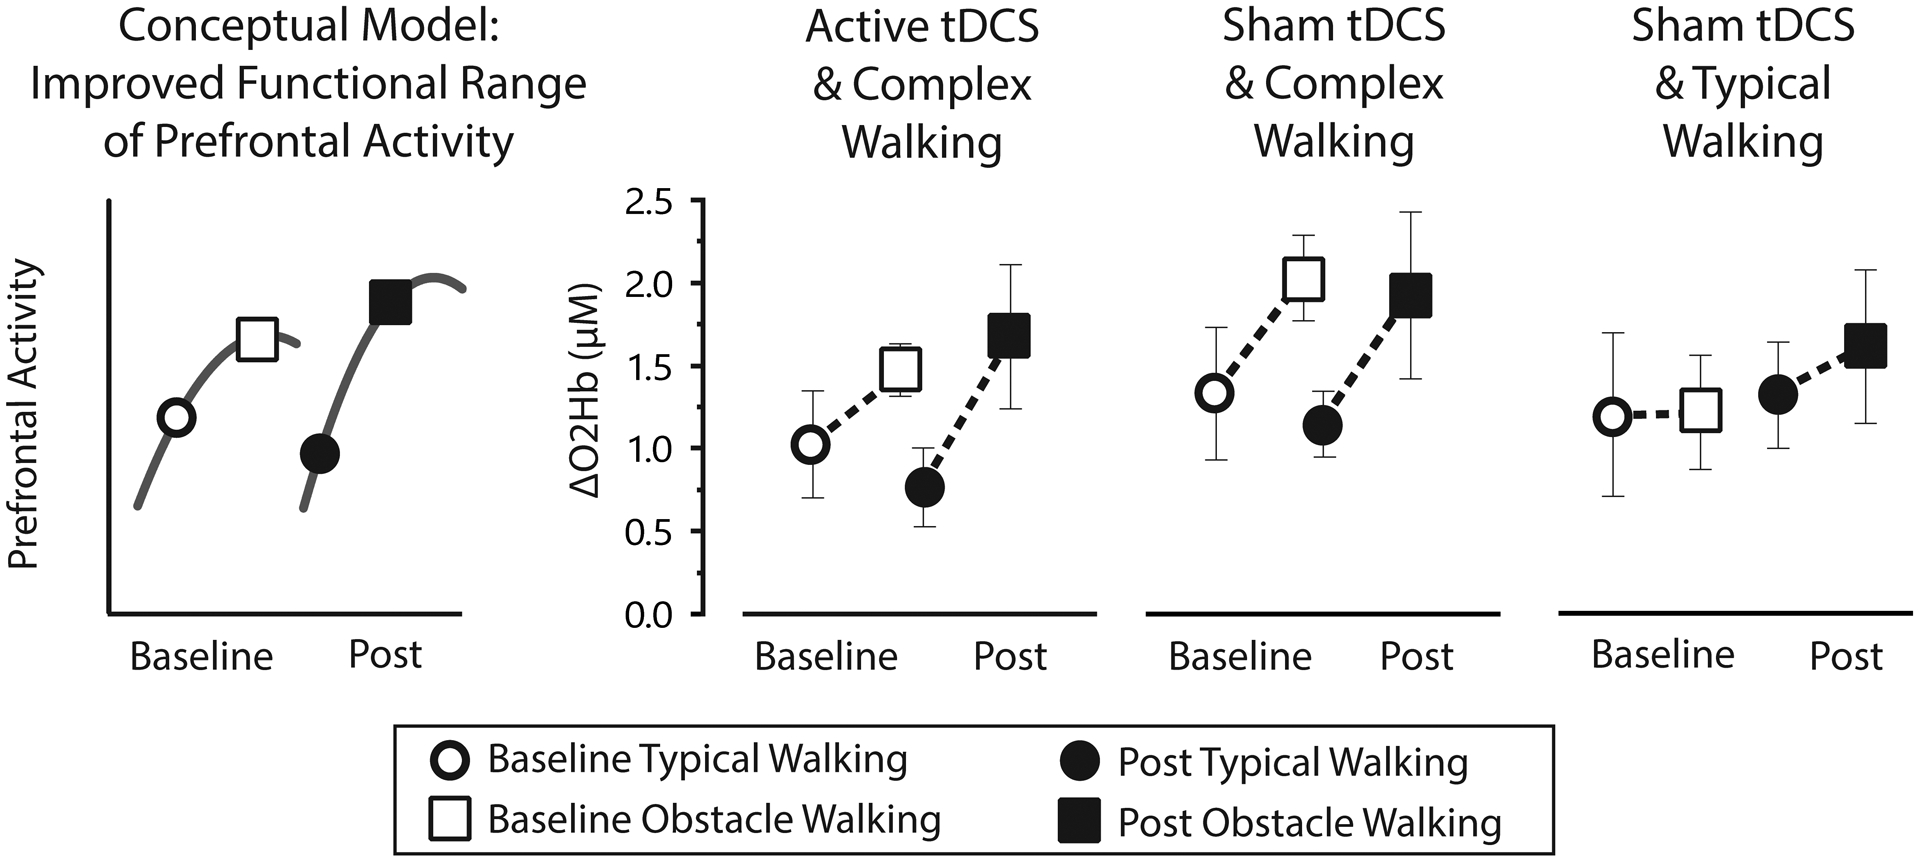
According to conceptual models such as CRUNCH (left panel), improvements in task-related prefrontal activity might be characterized by less overactivation during low complexity tasks (e.g., typical walking) and a higher resource ceiling to support performance of more complex tasks (e.g., obstacle walking). The result would be an increased “functional range” of brain activity. For the present experimental groups, this functional range increased from baseline to post-intervention (indicated by dashed lines representing a segment of the CRUNCH curve). The range of prefrontal activity (measured by fNIRS as changes in oxygenated hemoglobin concentration) was increased 0.46μM for Active/Complex, 0.08 for Sham/Complex, and 0.28 for Sham/Typical. However, this study is underpowered for formal statistical analysis.
Discussion
Feasibility and Safety
This study shows that a combined intervention of tDCS and walking is feasible based on 90% of participants completing the protocol successfully. The participants who did not complete the protocol withdrew due to medical conditions unrelated to the study. A very mild burning or tingling sensation on the scalp was reported with active and sham tDCS, which is a common sensation with tDCS and not injurious when delivered in short bouts (e.g., 20 minutes). The Sham/Complex group tended to report a tingling sensation instead of burning, likely owing to the very short duration of the tDCS stimulus in this group. These findings may be inconsequential given the very low severity rating (about 1.5 rating on average) in all groups. Likewise, ratings on headache, other head pain, and nervousness were negligible. Overall, tDCS was safe and well tolerated.
Complex walking rehabilitation paired with active tDCS versus sham tDCS
The Active/Complex group showed preliminary evidence of larger gains compared to Sham/Complex based on moderate effect sizes for obstacle walking speed, Trailmaking Test, and EXAMINER working memory score. A possible explanation is that a synergistic interaction between frontal tDCS and complex walking training enhanced neuroplasticity in frontal networks. This could have contributed to the gains in control of complex walking, which is known to rely in part on frontal/executive resources. Similarly, and even more compelling, is the finding of substantially improved executive function for Active/Complex with large within-group effect sizes. This occurred despite any explicit training in the domain of executive function, other than engagement of frontal networks via complex walking and tDCS. Again, the synergistic effect of these two intervention components may have elicited neuroplasticity in frontal networks that generalized to better performance on untrained tests of executive function.
An interesting question that was not tested is whether tDCS would have been effective if combined with typical walking training (i.e., an Active/Typical group). Our hypothesis is that this combination would have been less effective than Active/Complex since complex walking is known to elicit stronger recruitment of frontal networks compared to typical walking. This is important because tDCS is thought to be particularly effective when paired with a complementary intervention that engages the same neural circuits. However, it should be noted that another recent pilot tDCS study in older adults demonstrated gains in executive function and dual-task walking function (but not single task walking) following ten sessions of frontal tDCS delivered while the participants were at rest (16). This positive effect of tDCS in isolation suggests that gains in executive function are possible even without a combinatorial intervention approach. Given the preliminary nature of both studies it is too early to draw definitive conclusions. Overall, the consistent demonstration of enhanced executive function and complex walking is encouraging and warrants further investigation.
Complex walking rehabilitation versus typical walking rehabilitation
An unexpected finding was that the Typical/Sham group demonstrated the largest effects for walking performance measures, particularly compared to the Sham/Complex group. A possible explanation is that Typical/Sham simply received a larger and possibly more intense dose of exercise. The step count data strongly support the assertion of a larger dose, as over the course of the intervention Typical/Sham took 38% more steps than Active/Complex and 17% more steps than Sham/Complex. Given that all participants were prescribed 30 minutes of walking per session, more steps likely translates to faster walking speed during training. The finding of fewer steps and the assertion of slower training speeds in the complex walking groups is consistent with the known slowing that occurs under such conditions (e.g., stepping over obstacles and dual-task costs). Faster walking during rehabilitation may also translate to better performance on speed-based outcome measures (specificity of training). In future studies additional care should be taken to match (and maximize) the volume and intensity of walking training across groups. Despite the larger gains on the walking assessments demonstrated by Sham/Typical, this advantage did not transfer to the executive function tasks. Rather, Active/Complex and Sham/Complex demonstrated large effect size gains for EXAMINER working memory score when compared to Sham/Typical. This finding might suggest that complex walking training is somewhat more successful than typical walking training at engaging frontal networks and promoting neuroplasticity that generalizes to untrained tasks of executive function.
Prefrontal activity measured by fNIRS
Consistent with cognitive models of brain aging and the application of these models to walking (48,49), we interpret prefrontal activity in the context of the Compensation Related Utilization of Neural Circuits Hypothesis, or CRUNCH (50,51). CRUNCH explains that poorly functioning brain networks can lead to compensatory overactivation during tasks of low complexity. Poorly functioning networks may also cause a lowering of the activation ceiling (underactivation) which limits resources during tasks of higher complexity. For the task of typical walking (low complexity) we interpret a post-intervention reduction in prefrontal activity to be consistent with beneficial reduction in compensatory overactivation. For the task of obstacle walking (high complexity) we interpret a post-intervention increase of prefrontal activity to be consistent with beneficial increase in the resource ceiling. Descriptively, one or both of these outcomes was observed in each of the experimental groups (Figure 4), which suggests changes in prefrontal activity that were moving in the desired direction. However, formal statistical comparisons between groups were not feasible due to the small sample sizes and inherently high inter-individual variability of neurophysiological recordings. Future investigations can use these fNIRS data to assist with study design and power analysis.
Study Limitations
These study results pertain to older adults without diagnosed neurological conditions, and may not generalize to other populations. This study had a small sample size in each group, and was not designed to establish the efficacy of each intervention. A further complication for group comparisons is that the study was not designed to balance the groups for walking function and executive function at baseline. Our study also is not able to discern the specific neural mechanism(s) that may be responsible for gains in walking performance or executive function. We also cannot be sure that the tDCS parameters (timing, duration, intensity, etc.) were ideal for our purpose. Larger studies with additional experimental measures and groups will be needed to make definitive conclusions about these topics. The results shown here serve to demonstrate the feasibility of pursuing such trials.
Conclusion
The findings of this study are that 18 sessions of tDCS combined with complex walking rehabilitation in older adults is feasible, safe, and well tolerated. Preliminary data suggest that gains in executive function for the Active/Complex group may have exceeded the gains in the other groups. Walking function improved in all groups, but preliminary evidence suggests the greatest effect was in Sham/Typical. The potential benefit of active tDCS combined with complex walking rehabilitation for inducing adaptive neuroplasticity is supported both by the performance outcomes and by fNIRS data suggesting increased functional range of prefrontal activity post-intervention.
Sources of financial support:
This work was supported by the National Institutes of Health (1R21AG053736), Claude D. Pepper Older Americans Independence Center at the University of Florida Institute on Aging (5P30AG028740), North Florida/South Georgia Veterans Health System (Brain Rehabilitation Research Center), and the University of Florida Center for Cognitive Aging and Memory.
Footnotes
Conflict of interest statement: The authors disclose no conflicts of interest.
References
- 1.Possin KL, LaMarre AK, Wood KA, Mungas DM, Kramer JH. Ecological validity and neuroanatomical correlates of the NIH EXAMINER executive composite score. Journal of the International Neuropsychological Society: JINS. 2014;20:20–28. [DOI] [PMC free article] [PubMed] [Google Scholar]
- 2.Hawkins KA, Fox EJ, Daly JJ, Rose DK, Christou EA, McGuirk TE, Otzel DM, Butera KA, Chatterjee SA, Clark DJ. Prefrontal over-activation during walking in people with mobility deficits: Interpretation and functional implications. Hum Mov Sci. 2018;59:46–55. [DOI] [PMC free article] [PubMed] [Google Scholar]
- 3.Wagshul ME, Lucas M, Ye K, Izzetoglu M, Holtzer R. Multi-modal neuroimaging of dual-task walking: Structural MRI and fNIRS analysis reveals prefrontal grey matter volume moderation of brain activation in older adults. Neuroimage. 2019. [DOI] [PMC free article] [PubMed] [Google Scholar]
- 4.Clark DJ, Rose DK, Ring SA, Porges EC. Utilization of central nervous system resources for preparation and performance of complex walking tasks in older adults. Front Aging Neurosci. 2014;6:217. [DOI] [PMC free article] [PubMed] [Google Scholar]
- 5.Maidan I, Nieuwhof F, Bernad-Elazari H, Reelick MF, Bloem BR, Giladi N, Deutsch JE, Hausdorff JM, Claassen JA, Mirelman A. The Role of the Frontal Lobe in Complex Walking Among Patients With Parkinson’s Disease and Healthy Older Adults: An fNIRS Study. Neurorehabilitation and Neural Repair. 2016. [DOI] [PubMed] [Google Scholar]
- 6.Holtzer R, Mahoney JR, Izzetoglu M, Wang C, England S, Verghese J. Online fronto-cortical control of simple and attention-demanding locomotion in humans. Neuroimage. 2015;112:152–159. [DOI] [PMC free article] [PubMed] [Google Scholar]
- 7.Yogev-Seligmann G, Hausdorff JM, Giladi N. The role of executive function and attention in gait. Mov Disord. 2008;23:329–342. [DOI] [PMC free article] [PubMed] [Google Scholar]
- 8.Nutt JG. Higher-level gait disorders: an open frontier. Movement Disorders. 2013;28:1560–1565. [DOI] [PubMed] [Google Scholar]
- 9.Priori A, Berardelli A, Rona S, Accornero N, Manfredi M. Polarization of the human motor cortex through the scalp. Neuroreport. 1998;9:2257–2260. [DOI] [PubMed] [Google Scholar]
- 10.Nitsche MA, Paulus W. Excitability changes induced in the human motor cortex by weak transcranial direct current stimulation. The Journal of physiology. 2000;527 Pt 3:633–639. [DOI] [PMC free article] [PubMed] [Google Scholar]
- 11.Woods AJ, Antal A, Bikson M, Boggio PS, Brunoni AR, Celnik P, Cohen LG, Fregni F, Herrmann CS, Kappenman ES, Knotkova H, Liebetanz D, Miniussi C, Miranda PC, Paulus W, Priori A, Reato D, Stagg C, Wenderoth N, Nitsche MA. A technical guide to tDCS, and related non-invasive brain stimulation tools. Clinical Neurophysiology. 2016;127:1031–1048. [DOI] [PMC free article] [PubMed] [Google Scholar]
- 12.Hsu WY, Ku Y, Zanto TP, Gazzaley A. Effects of noninvasive brain stimulation on cognitive function in healthy aging and Alzheimer’s disease: a systematic review and meta-analysis. Neurobiology of Aging. 2015;36:2348–2359. [DOI] [PMC free article] [PubMed] [Google Scholar]
- 13.Reis J, Fischer JT, Prichard G, Weiller C, Cohen LG, Fritsch B. Time- but not sleep-dependent consolidation of tDCS-enhanced visuomotor skills. Cerebral cortex. 2015;25:109–117. [DOI] [PMC free article] [PubMed] [Google Scholar]
- 14.Reis J, Schambra HM, Cohen LG, Buch ER, Fritsch B, Zarahn E, Celnik PA, Krakauer JW. Noninvasive cortical stimulation enhances motor skill acquisition over multiple days through an effect on consolidation. Proceedings of the National Academy of Sciences of the United States of America. 2009;106:1590–1595. [DOI] [PMC free article] [PubMed] [Google Scholar]
- 15.Au J, Katz B, Buschkuehl M, Bunarjo K, Senger T, Zabel C, Jaeggi SM, Jonides J. Enhancing Working Memory Training with Transcranial Direct Current Stimulation. Journal of cognitive neuroscience. 2016;28:1419–1432. [DOI] [PubMed] [Google Scholar]
- 16.Manor B, Zhou J, Harrison R, Lo OY, Travison TG, Hausdorff JM, Pascual-Leone A, Lipsitz L. Transcranial Direct Current Stimulation May Improve Cognitive-Motor Function in Functionally Limited Older Adults. Neurorehabil Neural Repair. 2018;32:788–798. [DOI] [PMC free article] [PubMed] [Google Scholar]
- 17.Manor B, Zhou J, Jor’dan A, Zhang J, Fang J, Pascual-Leone A. Reduction of Dual-task Costs by Noninvasive Modulation of Prefrontal Activity in Healthy Elders. J Cogn Neurosci. 2016;28:275–281. [DOI] [PMC free article] [PubMed] [Google Scholar]
- 18.Nissim NR, O’Shea A, Indahlastari A, Kraft JN, Von Mering O, Aksu S, Porges E, Cohen R, Woods AJ. Effects of Transcranial Direct Current Stimulation Paired With Cognitive Training on Functional Connectivity of the Working Memory Network in Older Adults. Frontiers in aging neuroscience. 2019;11. [DOI] [PMC free article] [PubMed] [Google Scholar]
- 19.Zhou J, Hao Y, Wang Y, Jor’dan A, Pascual-Leone A, Zhang J, Fang J, Manor B. Transcranial direct current stimulation reduces the cost of performing a cognitive task on gait and postural control. Eur J Neurosci. 2014;39:1343–1348. [DOI] [PMC free article] [PubMed] [Google Scholar]
- 20.Tahtis V, Kaski D, Seemungal BM. The effect of single session bi-cephalic transcranial direct current stimulation on gait performance in sub-acute stroke: A pilot study. Restor Neurol Neurosci. 2014;32:527–532. [DOI] [PubMed] [Google Scholar]
- 21.Zhou J, Hao Y, Wang Y, Jor’dan A, Pascual-Leone A, Zhang J, Fang J, Manor B. Transcranial direct current stimulation reduces the cost of performing a cognitive task on gait and postural control. The European journal of neuroscience. 2014;39:1343–1348. [DOI] [PMC free article] [PubMed] [Google Scholar]
- 22.Manenti R, Brambilla M, Rosini S, Orizio I, Ferrari C, Borroni B, Cotelli M. Time up and go task performance improves after transcranial direct current stimulation in patient affected by Parkinson’s disease. Neuroscience Letters. 2014;580:74–77. [DOI] [PubMed] [Google Scholar]
- 23.Wrightson JG, Twomey R, Ross EZ, Smeeton NJ. The effect of transcranial direct current stimulation on task processing and prioritisation during dual-task gait. Experimental Brain Research. 2015;233:1575–1583. [DOI] [PubMed] [Google Scholar]
- 24.Weintraub S, Dikmen SS, Heaton RK, Tulsky DS, Zelazo PD, Bauer PJ, Carlozzi NE, Slotkin J, Blitz D, Wallner-Allen K, Fox NA, Beaumont JL, Mungas D, Nowinski CJ, Richler J, Deocampo JA, Anderson JE, Manly JJ, Borosh B, Havlik R, Conway K, Edwards E, Freund L, King JW, Moy C, Witt E, Gershon RC. Cognition assessment using the NIH Toolbox. Neurology. 2013;80:S54–S64. [DOI] [PMC free article] [PubMed] [Google Scholar]
- 25.McLaren ME, Nissim NR, Woods AJ. The effects of medication use in transcranial direct current stimulation: A brief review. Brain stimulation. 2018;11:52–58. [DOI] [PMC free article] [PubMed] [Google Scholar]
- 26.Dietz V Interaction between central programs and afferent input in the control of posture and locomotion. J Biomech. 1996;29:841–844. [DOI] [PubMed] [Google Scholar]
- 27.Pearson KG. Role of sensory feedback in the control of stance duration in walking cats. Brain Res Rev. 2008;57:222–227. [DOI] [PubMed] [Google Scholar]
- 28.Merbah S, Meulemans T. Learning a motor skill: effects of blocked versus random practice. Psychologica Belgica. 2011;51:15–48. [Google Scholar]
- 29.Indahlastari A, Albizu A, O’Shea A, Forbes MA, Nissim NR, Kraft JN, Evangelista ND, Hausman HK, Woods AJ. Modeling transcranial electrical stimulation in the aging brain. Brain stimulation. 2020;13:664–674. [DOI] [PMC free article] [PubMed] [Google Scholar]
- 30.Batsikadze G, Moliadze V, Paulus W, Kuo MF, Nitsche MA. Partially non-linear stimulation intensity-dependent effects of direct current stimulation on motor cortex excitability in humans. The Journal of physiology. 2013;591:1987–2000. [DOI] [PMC free article] [PubMed] [Google Scholar]
- 31.Mosayebi Samani M, Agboada D, Jamil A, Kuo MF, Nitsche MA. Titrating the neuroplastic effects of cathodal transcranial direct current stimulation (tDCS) over the primary motor cortex. Cortex. 2019;119:350–361. [DOI] [PubMed] [Google Scholar]
- 32.Nissim NR, O’Shea A, Indahlastari A, Telles R, Richards L, Porges E, Cohen R, Woods AJ. Effects of in-Scanner Bilateral Frontal tDCS on Functional Connectivity of the Working Memory Network in Older Adults. Front Aging Neurosci. 2019;11:51. [DOI] [PMC free article] [PubMed] [Google Scholar]
- 33.Gandiga PC, Hummel FC, Cohen LG. Transcranial DC stimulation (tDCS): a tool for double-blind sham-controlled clinical studies in brain stimulation. Clinical Neurophysiology. 2006;117:845–850. [DOI] [PubMed] [Google Scholar]
- 34.Ambrus GG, Al-Moyed H, Chaieb L, Sarp L, Antal A, Paulus W. The fade-in--short stimulation--fade out approach to sham tDCS--reliable at 1 mA for naive and experienced subjects, but not investigators. Brain stimulation. 2012;5:499–504. [DOI] [PubMed] [Google Scholar]
- 35.Nitsche MA, Nitsche MS, Klein CC, Tergau F, Rothwell JC, Paulus W. Level of action of cathodal DC polarisation induced inhibition of the human motor cortex. Clin Neurophysiol. 2003;114:600–604. [DOI] [PubMed] [Google Scholar]
- 36.Hess RJ, Brach JS, Piva SR, VanSwearingen JM. Walking skill can be assessed in older adults: validity of the Figure-of-8 Walk Test. Physical Therapy. 2010;90:89–99. [DOI] [PMC free article] [PubMed] [Google Scholar]
- 37.Kramer JH, Mungas D, Possin KL, Rankin KP, Boxer AL, Rosen HJ, Bostrom A, Sinha L, Berhel A, Widmeyer M. NIH EXAMINER: conceptualization and development of an executive function battery. Journal of the International Neuropsychological Society: JINS. 2014;20:11–19. [DOI] [PMC free article] [PubMed] [Google Scholar]
- 38.Kramer JH. Special series introduction: NIH EXAMINER and the assessment of executive functioning. Journal of the International Neuropsychological Society: JINS. 2014;20:8–10. [DOI] [PubMed] [Google Scholar]
- 39.Ble A, Volpato S, Zuliani G, Guralnik JM, Bandinelli S, Lauretani F, Bartali B, Maraldi C, Fellin R, Ferrucci L. Executive function correlates with walking speed in older persons: the InCHIANTI study. Journal of the American Geriatrics Society. 2005;53:410–415. [DOI] [PubMed] [Google Scholar]
- 40.Vazzana R, Bandinelli S, Lauretani F, Volpato S, Lauretani F, Di Iorio A, Abate M, Corsi AM, Milaneschi Y, Guralnik JM, Ferrucci L. Trail Making Test predicts physical impairment and mortality in older persons. J Am Geriatr Soc. 2010;58:719–723. [DOI] [PMC free article] [PubMed] [Google Scholar]
- 41.Caetano MJD, Lord SR, Brodie MA, Schoene D, Pelicioni PHS, Sturnieks DL, Menant JC. Executive functioning, concern about falling and quadriceps strength mediate the relationship between impaired gait adaptability and fall risk in older people. Gait and Posture. 2018;59:188–192. [DOI] [PubMed] [Google Scholar]
- 42.Chen M, Pillemer S, England S, Izzetoglu M, Mahoney JR, Holtzer R. Neural correlates of obstacle negotiation in older adults: An fNIRS study. Gait and Posture. 2017;58:130–135. [DOI] [PMC free article] [PubMed] [Google Scholar]
- 43.Herold F, Wiegel P, Scholkmann F, Muller NG. Applications of Functional Near-Infrared Spectroscopy (fNIRS) Neuroimaging in Exercise(−)Cognition Science: A Systematic, Methodology-Focused Review. J Clin Med. 2018;7. [DOI] [PMC free article] [PubMed] [Google Scholar]
- 44.Holtzer R, Mahoney JR, Izzetoglu M, Izzetoglu K, Onaral B, Verghese J. fNIRS study of walking and walking while talking in young and old individuals. Journals of Gerontology Series A, Biological Sciences and Medical Sciences. 2011;66:879–887. [DOI] [PMC free article] [PubMed] [Google Scholar]
- 45.Huppert TJ, Diamond SG, Franceschini MA, Boas DA. HomER: a review of time-series analysis methods for near-infrared spectroscopy of the brain. Applied optics. 2009;48:D280–298. [DOI] [PMC free article] [PubMed] [Google Scholar]
- 46.Vitorio R, Stuart S, Rochester L, Alcock L, Pantall A. fNIRS response during walking - Artefact or cortical activity? A systematic review. Neuroscience and biobehavioral reviews. 2017;83:160–172. [DOI] [PubMed] [Google Scholar]
- 47.Perera S, Mody SH, Woodman RC, Studenski SA. Meaningful change and responsiveness in common physical performance measures in older adults. Journal of the American Geriatrics Society. 2006;54:743–749. [DOI] [PubMed] [Google Scholar]
- 48.Clark DJ, Manini TM, Ferris DP, Hass CJ, Brumback BA, Cruz-Almeida Y, Pahor M, Reuter-Lorenz PA, Seidler RD. Multimodal Imaging of Brain Activity to Investigate Walking and Mobility Decline in Older Adults (Mind in Motion Study): Hypothesis, Theory, and Methods. Front Aging Neurosci. 2019;11:358. [DOI] [PMC free article] [PubMed] [Google Scholar]
- 49.Chatterjee SA, Fox EJ, Daly JJ, Rose DK, Wu SS, Christou EA, Hawkins KA, Otzel DM, Butera KA, Skinner JW, Clark DJ. Interpreting Prefrontal Recruitment During Walking After Stroke: Influence of Individual Differences in Mobility and Cognitive Function. Front Hum Neurosci. 2019;13:194. [DOI] [PMC free article] [PubMed] [Google Scholar]
- 50.Reuter-Lorenz PA, Cappell KA. Neurocognitive Aging and the Compensation Hypothesis. Current Directions in Psychological Science. 2008;17:177–182. [Google Scholar]
- 51.Reuter-Lorenz PA, Park DC. Human neuroscience and the aging mind: a new look at old problems. Journals of Gerontology Series B, Psychological Sciences and Social Sciences. 2010;65:405–415. [DOI] [PMC free article] [PubMed] [Google Scholar]