

Abstract
Quantification of the blood-brain barrier (BBB) permeability and transport in brain tissue is crucial in understanding brain disorders and developing systemic and non-systemic drug delivery strategies to the brain. This chapter summarizes BBB permeability measurement in vitro (Part I) and the in vivo non-invasive methods for quantifying the BBB permeability to solutes and brain tissue transport in rat brain by employing intravital multiphoton microscopy and a curving fitting method by using an unsteady mass transfer mathematical model (Part II).
Keywords: Cerebral microvessel, BBB permeability, BBB transport, Effective diffusion coefficient, Non-invasive, Rat brain, Multiphoton microscopy, Intravital fluorescence microscopy, Unsteady mass transfer model
1. Introduction
The wall of the cerebral microvessels in the brain is specified as the blood-brain barrier (BBB) due to its unique anatomic features and its protective role in maintaining the microenvironment within our brain. The BBB is composed of an endothelial layer with embedment of pericytes at irregular intervals with the complete wrapping of the basement membrane, which is ensheathed by astrocyte foot processes [1-3]. Due to this special anatomical structure, the BBB strictly regulates the exchange of substances between blood and the cerebral parenchyma. The permeability of the BBB to these substances is thus maintained to a very low level. This is good for protecting the central nervous system (CNS) from the blood-borne harmful toxins; however, it also impedes the passage of pharmacological substances across the BBB that otherwise could be useful for treatment of CNS diseases.
To investigate the mechanisms by which the BBB maintains and regulates its permeability in health and disease, various invasive and non-invasive in vivo models have been used to study the transport across the BBB [4]. These methods include pharmacokinetic methods [5, 6], intracerebral microdialysis [7], positron emission tomography (PET) [8], magnetic resonance imaging (MRI) [9], the intravital microscopy study [10], occluding single microvessel measurement [11], and single microvessel fluorescence imaging method [12-16].
There are various indicators for the permeability of the BBB. The BBB can be viewed as a permeable membrane, whose transport properties are described by Kedem-Katchalsky equations derived from the theory of irreversible thermodynamics:
where Js and Jv are the solute and volumetric fluxes and ΔC and Δp are the concentration and pressure differences across the membrane. Lp, the hydraulic conductivity, describes the membrane permeability to water. Thus the definition of Lp is the water flux over the driving force (hydrostatic pressure difference minus the osmotic pressure difference across the membrane). P, the diffusive permeability, describes the permeability to solutes. The definition of P is thus the solute flux over driving force (concentration difference across the membrane when no water flux). σf is the solvent drag or ultrafiltration coefficient that describes the retardation of solutes due to membrane restriction, and σd, the reflection coefficient, describes the selectivity of a membrane to solutes. In many transport processes, σf is equal to σd, and thus we often use σ, the reflection coefficient, to represent both of them. These three coefficients can be determined experimentally and theoretically. The transmembrane electric resistance (TER) describes the resistance of a membrane to ions [17]. The reverse of the TER reflects the membrane permeability to ions. In addition to these quantitative coefficients, there are other less quantitative permeability indicators for the BBB, e.g., brain uptake index (BUI) and brain efflux index (BEI) [18].
Transport in brain tissue is often quantified by solute effective diffusion coefficient Deff which can be determined by radiotracer technique through ventriculo-cisternal perfusion [19], real-time iontophoresis [20], integrative optical imaging [21], and point-source method [22]. Most recently, Shi et al. [14] developed a non-invasive method to determine Deff from the spatial-temporal tissue solute spreading profile around a cerebral microvessel in rat brain by using multiphoton microscopy.
The following presents the detailed methods for quantifying the solute permeability (P) of the BBB both in vitro and in vivo, as well as the effective brain tissue diffusion coefficient in rat brain Deff [14]. For P measurement in vivo, two experimental settings are presented, one is for P of the pial microvessels at the brain surface by using generic fluorescence microscopy [16] and another for P of the cerebral microvessels in the brain parenchyma 100–200 μm below pia mater by using multiphoton microscopy [12, 13, 15].
2. Materials
2.1. Materials for BBB Permeability Measurement In Vitro
In vitro model of the BBB: A single monolayer of fully confluent (>97%) primary brain endothelial cells (BECs) is produced by plating 5 × 10⁵ cells/cm2 in the upper chamber of a 24-well tissue culture inserts (BD BioCoat, Catalog # 356408) pre-coated with rat tail collagen I and fibronectin. BECs are >98% pure, as measured by staining for the endothelial cell specific markers von Willebrand Factor (vWF) and CD105, and negative immunostaining for the glial fibrillar acidic protein (astrocytes), CD11b (macrophage/microglia), smooth muscle cell α-actin (SMA), and platelet-derived growth factor receptor β and CD13 (pericytes). Early passage P2-P5 cells and TER value of >200 Ω cm2 are generally recommended.
Endothelial complete medium: BECs are maintained in endothelial medium with supplements (ScienCell, complete kit, Catalog #1001).
Isothiocyanate (FITC) labeled dextran (e.g., 40 kDa; Invitrogen, Catalog D1845).
96-well microplates for fluorescence-based assays (Invitrogen, Catalog M33089).
Phosphate-buffered saline (PBS), for cell culture, without calcium and magnesium (Invitrogen, Catalog 10010023).
2.2. Materials for BBB Permeability and Transport Measurement In Vivo
Buffers. Mammalian Ringer’s solution is used as the solvent for making the solution with the fluorescently labeled solutes (perfusate). All the solutions additionally contain 10 mg/mL bovine serum albumin (BSA) or 1%BSA to simulate the normal oncotic pressure in the blood. The solutions are made at the room temperature 25 °C and warmed up to 37 °C before perfusion into the rat brain through the carotid artery. The following quantity of the solution for each solute is made for the control experiments using one to two rats. Artificial cerebrospinal fluid (ACSF) is used to superfuse the surface of the rat scalp to remove the heat generated during the grinding.
Mammalian Ringer solution: Dissolve 7.714 g NaCl, 0.3432 KCl, 0.294 CaCl2·2H2O, 0.2957 g MgSO4·7H2O, 0.99 g glucose, 0.42 g NaHCO3, 2.37 g Hepes (salt), and 2.6 g Hepes (acid) in 1 L double-distilled water (13). Store at 4 °C for a week.
1% BSA solution: Dissolve 500 mg BSA in 50 mL Mammalian Ringer to make 50 mL 10 mg/mL BSA (1% BSA) solution. The solution is buffered to pH 7.4–7.5 [16].
Fluorescently labeled solute solutions: FITC or TRITC or other fluorescently labeled solutes, e.g., dextrans with various molecular weights, sodium fluorescein, TAMRA, are often used to represent solutes with a range of sizes. We use sodium fluorescein (NaFl, MW 376) and FITC-dextran 70k as a typical small and a large-sized solute to demonstrate the permeability measurement method. For sodium fluorescein and FITC-labeled solutes, the excitation/emission wavelengths are set to 485/520 nm in the generic fluorescence microscopy (13) and 820 nm for the excitation in the multiphoton microscopy [12-15].
50 mL sodium fluorescein (NaFl) at 0.1 mg/mL: Dissolve 5 mg NaFl in 50 mL 1%BSA solution, and filter the solution through a 0.2 μm syringe filter (0.1 mg/mL sodium fluorescein is in the linear range of the concentration vs. intensity curve for our experimental settings).
50 mL FITC-dextran 70k at 1 mg/mL: Dissolve 50 mg dextran 70k in into 50 mL 1% BSA and filter the solution through a 0.2 μm syringe filter (1 mg/mL FITC-dextran is in the linear range of the concentration vs. intensity curve for our experimental settings).
ACSF solution: Dissolve 6.4576 g NaCl, 0.3507 KCl, 0.3675 CaCl2·2H2O, 0.308 g MgSO4·7H2O, 2.1 g NaHCO3, 0.1497 g KH2PO4, 1.7775 g Hepes (salt), and 1.95 g Hepes (acid) in 1 L double-distilled water [11]. The solution is buffered to 7.4 ± 0.5. Store at 4 °C for a week.
3. Methods
Part I: BBB Permeability Measurement In Vitro:
Carry out all procedures in biosafety hood at room temperature, unless otherwise specified (see Note 1). Prepare all solutions using ultrapure water and analytical grade reagents. Prepare fresh work solutions, and follow all disposal regulations when disposing waste.
3.1. Apply Experimental Treatments
Starvation with low serum (endothelial basal medium with 0.1–0.5% serum), or addition of cyclic adenosine monophosphate (cAMP) [23] or retinoic acid [24], or coculture with astrocytes [25] or pericytes [26, 27], has been shown to reliably increase the barrier functions of in vitro BBB. Either replace the growth medium in the bottom chamber or transfer the insert to a receiver well with pre-seeded coculture cells, and then cover the plate and incubate the cells (see Note 2).
3.2. Dextran Permeability Measurement
Prepare FITC-dextran in growth medium to a final concentration of 0.1 mg/mL. 200 μL of volume is needed for each insert.
Prepare a 96-well fluorescence-based microplate, and add 100 μL PBS in 8 wells for every insert need to be tested (including a cell-free filter insert). If necessary, label the wells in two sets of four wells, one for samples collected from upper chamber at different time points and one for samples from lower chamber.
Add 5 μL of FITC-dextran medium from Subheading 3.2 step 1 to the 96-well fluorescence microplate as first time point of upper chamber for each insert need to be tested.
Transfer the plate with inserts to the biosafety hood, and add 5 μL of the medium from the bottom chamber of each inserts (including a cell-free filter insert) to the 96-well fluorescence microplate as first time point of bottom chamber. Carefully remove the medium from the insert, without the pipette tip touching the membrane or drying the membrane.
Add 200 μL of FITC-dextran medium to the insert gently, without the pipette tip touching the membrane. Move the plate back to the incubator. Start the timer.
Every 10 min collect 5 μL of medium from both the upper chamber inside the insert and the bottom chamber, and transfer to the designated wells in 96-well fluorescence microplate. Collect for the first 30 min (4 time points total including first time point collected in Subheadings 3.2, steps 3 and 4).
Keep the inserts in PBS for phase-contrast imaging or immunofluorescent staining of vascular and tight junction markers if needed.
3.3. Calculating the Permeability of the Endothelial Barrier
The BBB permeability to dextran is expressed as a permeability coefficient in cm/s [27].
Read the 96-well fluorescence microplate using a plate reader with filter setting at 488 nm for excitation and 525 nm for emission or compatible settings recommended by the manufacturer (see Note 3).
For each time point, calculate the ratio of fluorescence between upper chamber and lower chamber (Fupper/Flower).
- The volume cleared (ΔVc) of each time point is calculated using Eq. 1 [26, 27]:
where Cupper and Clower are FITC-labeled dextran concentrations in upper and lower chambers, respectively, Vlower is the volume in lower chamber (~500 μL), and Cupper/Clower is equivalent to the Fupper/Flower measured from fluorescence reading in Subheading 3.3, step 2. - Plot the ΔVc against time (0–30 min) over time in Excel, and the permeability surface area (PS) product can be obtained from the slope by linear regression. The permeability coefficient (P) of the insert (cell and filter) can then be calculated by Eq. 2 [26, 27]:
where s is the surface area of the filter (0.3 cm2 for 24-well inserts).
Part II: BBB Permeability Measurement In Vivo:
The method for quantification of the solute permeability (P) is from [13, 15, 16], and that for quantification of the effective brain tissue diffusion coefficient (Deff) is from [14].
3.4. Calibration of Optical Settings of Microscope for Linear Range of Concentration vs. Intensity of Fluorescence Probe Solutions
The premise for using the fluorescence intensity as an indicator of the solute concentration is that the intensity changes linearly with the concentration measured by the instrument (e.g., intravital microscope) for the range of concentrations in the experiment. We use here either a Nikon TE2000-E inverted fluorescence microscope (objective lens 20x/NA0.75, spatial resolution ~0.5 μm/pixel and temporal resolution three frame/s for image size 1024 × 1376) with a 12-bit CCD camera (Sensicam QE, Cooke, MI) for measuring the solute permeability P of pial microvessels or an Ultima multiphoton microscopy system (Prairie Tech. Inc. WI) with an objective lens 40x/NA0.8 (spatial resolution ~0.5 μm/pixel and temporal resolution ~1 frame/s for image size 512 × 512) for measuring P of cerebral microvessels 100–200 μm below pia mater.
Make sodium fluorescein (NaFl) solution 0.5 mL each at 0.2, 0.1, 0.05, 0.025, and 0.0125 mg/mL, respectively, or FITC-dextran 70k 0.5 mL each at 2, 1, 0.5, 0.25, and 0.125 mg/mL, respectively.
Make a chamber with a gap of 170 μm by using four 170 μm thick glass cover slips. Two large ones (24 × 50 mm) for the top and bottom and two small ones (22 × 22 mm) sandwiched between the large ones, ~1 cm apart (see Note 5). Solutions of fluorescence probe (NaFl or FITC-dextran-70k) are applied to fill the gap by capillarity.
The chamber filled with the fluorescence probe solution is put under the microscope and the intensity is measured. The measuring window is ~250 × 300 μm for the Nikon microscope and ~250 × 250 μm for the multiphoton microscope, similar size to that in the in vivo experiment. Adjust the optical settings of the microscope to be sure that the measured intensity of the fluorescence probe solution is linearly correlated with its concentration in the range shown in step 1. This setting and the concentration in the linear range will be used in the in vivo experiment (see Note 6).
3.5. Determination of the Depth of Light Collection for the Imaging System
Since the measurements of fluorescence intensity for cerebral microvessels are performed on thick tissue, collection of the light from out of focus region would contribute to the measured value of intensity. To determine the depth of light collection of our system, in vitro experiments similar to [28] are performed but using an imaging system to determine the fluorescence intensity.
Four chambers with different gap depths, 50 μm from Intracellular Imaging Inc. (Cincinnati, OH), 100 μm (hemocytometer), 170 μm chamber formed by cover slips (described in the previous Subheading 3.1), and 340 μm chamber with two cover slips stacked, are used to measure fluorescence intensity of sodium fluorescein solutions, which are filled in the chambers by capillarity.
The experiment instrument settings are the same as in in vitro linear calibration experiments as well as in in vivo permeability measurement (objective lens 20x/NA = 0.75 for the Nikon TE2000-E microscope and 40x/NA0.8 for the multiphoton microscope). With the concentration-depth product kept constant, the solutions of fluorescent probes are diluted according to the different depth of the chambers [28]. The intensity is measured for a window area ~250 × 300 μm for the Nikon microscope and ~250 × 250 μm for the multiphoton microscope, and the focus is on the top surface of the solution. Results are shown in Fig. 1. Intensities for 50 and 100 μm deep chambers remain almost the same. However, for the chambers with depths larger than 100 μm, i.e., 170 and 340 μm chambers, the intensity decreased with increase of the depth of the chambers. The reason is that our experiment system can only collect the light from the solution in a smaller thickness region for the 170 and 340 μm chambers. Using a light collection index function defined in [28], the curve fitting is done for the measured total intensity in the chambers of different depths. We find that for the Nikon microscope system with objective lens 20x/NA0.75, the depth of light collection is 95 μm (z0 = 95 μm in their index function), with this depth the imaging system can collect all the light. Beyond this depth, the system can collect the light either partially or none. Similarly, the depth of light collection is 67 μm for our multiphoton microscope with objective lens 40x/NA0.8 (see Note 7).
Fig. 1.
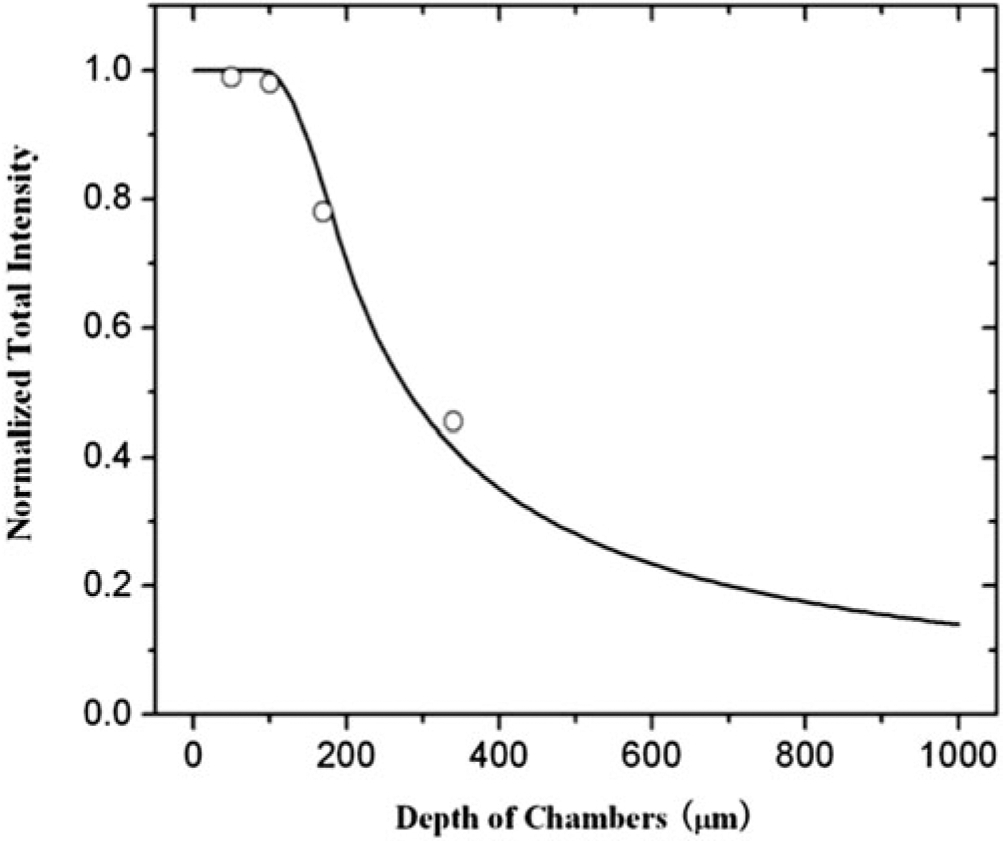
Depth of light collection. Samples of sodium fluorescein solution are prepared such that concentration-depth product is maintained constant. The total fluorescence intensity, which is normalized by the value for the 50 μm depth chamber, is plotted for the chambers with the depth 50, 100, 170, and 340 μm. The continuous line is the curve fitting for the total intensity using a light collection index function in Yuan et al. [16]. (Reprint with the permission from ref. [16], Copyright 2009, Elsevier Inc.)
3.6. Animal Preparation
Adult Sprague-Dawley rats (250–300 g, 3–4 months) are used.
After anesthesia, the rat is kept warm on a heating pad. The skull in the region of interest is exposed by shaving off the hair and cutting away the skin and connective tissue. A section of left or right frontoparietal bone, approximately ~5 mm ×~5 mm, is carefully ground with a high-speed micro-grinder (0–50,000 rpm, DLT 50KBU; Brasseler USA, GA) until a part of it (~2 mm × ~2 mm) becomes soft and translucent (~100 μm thickness). During the process, artificial cerebrospinal fluid (ACSF) with the room temperature is applied to the surface of the skull to remove the heat due to grinding. After grinding, the right or left carotid artery (on the same side of the thinned scalp) is cannulated with PE50 tubing.
If use the Nikon TE2000-E inverted fluorescence microscope, after grinding and cannulating, the rat is laid face up on a tray with its thinned section of the head placed in a shallow chamber formed by a glass cover slip. The thinned section is observed under the microscope, and the pial microvessels are focused by carefully adjusting the focusing knob. If use the upright Ultima multiphoton microscopy system, the rat is placed on a stereotaxic alignment system (SAS 597; David Kopf Instruments, Tujunga, CA), and its head is fixed with two ear bars and a mouth clamp. The thinned part of the scalp is placed underneath the water immerging objective lens.
3.7. Image Acquisition
3.7.1. 2-D Image Collection for the Measurement of Solute Permeability of the BBB
The microvessels (post-capillary venules of diameter 20–40 μm, see Note 8) are observed by the above microscope system through the thinned part of the rat scalp; the fluorescent solution is introduced into the cerebral circulation via the left or right carotid artery (on the same side of the thinned part) by a syringe pump at a constant rate of 3 mL/min (see Note 9), while the images of the fluorescent solution-filled microvessels and nearby brain tissue are simultaneously collected by the imaging systems. The Nikon system collects the images (~512 × 688 μm, ~0.5 μm/pixel and ~3 frame/s) of the pial microvessels, while the multiphoton system collects the images (~250 × 250 μm, ~0.5 μm/pixel and ~1 frame/s) of the cerebral microvessels ~100–200 μm below the pia mater (Fig. 2).
Fig. 2.

Determination of the BBB solute permeability P from 2-D images. (a) Illustration of a 2-D image comprising several microvessels. The measuring window (yellow framed area) is drawn on top of a chosen microvessel for determining the P of that vessel. (b) Total fluorescence intensity in the measuring window as a function of the perfusion time. Fluorescence intensity in the figure is proportional to the total amount of the solutes accumulated in the measuring region surrounding the microvessel. The slope of the regression line over the initial linear accumulation (dI/dt)0 (red line) is used to determine the solute permeability P = 1/Δ I0 × (dI/dt)0 × r/2, where ΔI0 (black line with arrowheads) is the step intensity increase when the dye just fills up the vessel lumen and r is the radius of the vessel (Reprint with the permission from ref. [15], Copyright 2020, Springer Link)
3.7.2. 3-D Image Collection for Determination of Solute Permeability and Effective Diffusion Coefficient in Brain Tissue
The 3-D images are collected by the multiphoton microscope for a region of interest (ROI) with a volume of ~200 μm × 8 μm × 100 μm (x, y, z) (Fig. 3) at a rate of 5–15 s per image (see Note 10). The corresponding pixel sizes were ~428 pixel × 17 pixel × 100 pixels, resulting a spatial resolution of ~0.47 μm × 0.47 μm × 1 μm in x, y, and z directions. The collected images of the ROI are then transferred to an image acquisition and analysis workstation for determining the P and Deff (Fig. 4).
Fig. 3.
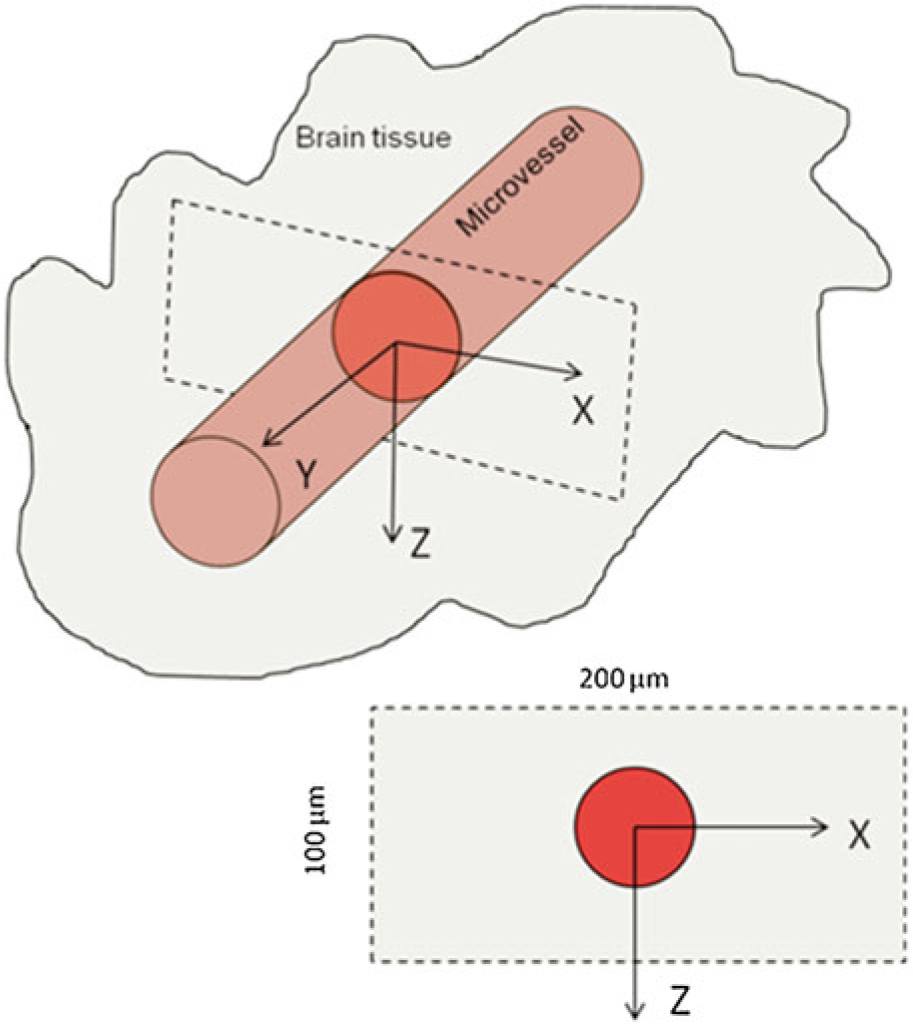
Illustration of the scanning region and the orientation of a microvessel in the brain tissue using multiphoton microscopy to determine the BBB solute permeability and its brain tissue diffusion coefficient. x-z is the cross-sectional plane of the microvessel, and y is the axial direction of the vessel. The ROI (scanning region) has a size of ~200 μm x ~ 8 μm x ~ 100 μm (x, y, z) (Reprint with the permission from ref. [14], Copyright 2014, American Society of Mechanical Engineers)
Fig. 4.

Determination of BBB solute permeability P and effective solute diffusion coefficient Deff in rat brain tissue from 3-D images. (a) The cross-sectional image of a rat cerebral microvessel filled with fluorescent probes and its surrounding brain tissue. The dashed orange line enclosed circle is the ROI for determining vessel permeability P. Eight straight white lines in different radial directions are drawn from the center of the vessel to determine Deff. (b) The total intensity in the ROI as a function of perfusion time. The slope of the regression line over the initial linear accumulation is used for the estimation of solute permeability P = 1/I0 × (dI/dt)0 × r/2. I0 is fluorescence intensity in the vessel lumen, while r is the radius of the vessel. (c) The averaged fluorescence intensity along the eight lines at different times (t = 25, 50 and 75 s) are plotted from the vessel wall. The smooth lines are the best fitting curves of the model prediction at the corresponding times when the proper Deff is chosen. Deff/Dfree = 0.15 (Dfree is the solute diffusion coefficient in an aqueous solution at 37 °C) is the best fitting value for this run of the experiment. (Reprint with the permission from ref. [14], Copyright 2014, American Society of Mechanical Engineers)
3.8. Image Analysis
The images are analyzed using ImageJ (National Institutes of Health).
For the 2-D images, the analysis is straightforward, for the intensity of a ROI as a function of time (Fig. 2).
For the 3-D images, the collected images are first reconstructed into a segment of 200 μm × 100 μm cross-sectional area (x-z) with 8 μm thickness. The temporal and spatial solute intensity (concentration) profiles I(t, xt, zt) surrounding a microvessel in this cross-sectional area with 8 μm thickness of the brain tissue are determined by the ImageJ program.
3.9. Determination of Solute Permeability of BBB (PBBB) from Collected Images
Figure 2 demonstrates how to determine PBBB from the 2-D images collected for the ROI comprising several microvessels (either the pial microvessels at the brain surface or the cerebral microvessels ~100–200 μm below the pia mater).
3.9.1. Determination of Solute Permeability of BBB (PBBB) from 2-D Images
Find a microvessel in the image, and draw a measuring window about 30–60 μm wide and 50–100 μm long (orange frame in Fig. 2a) (seeNote 11).
Plot the increasing intensity of the fluorescent probe in the measuring window as a function of perfusion time (Fig. 2b). The slope of the regression line over the initial linear accumulation (dI/dt)0 (red line) is used to determine the solute permeability P = 1/ΔI0 × (dI/dt)0 × r/2, where ΔI0 (black line with arrowheads) is the step intensity increase when the dye just fills up the vessel lumen and r is the radius of the vessel.
3.9.2. Determination of Solute Permeability of BBB (PBBB) from 3-D Images
Figure 4a shows a cross-sectional image (x-z) of a rat cerebral microvessel filled with a solution of fluorescently labeled solutes and the surrounding brain tissue. The orange dashed line circled region is the ROI to determine P (see Note 12).
The total intensity in the ROI as a function of perfusion time. The slope of the regression line over the initial linear accumulation is used for the estimation of solute permeability P = 1/I0 × (dI/dt)0 × r/2. I0 is fluorescence intensity in the vessel lumen while r is the radius of the vessel (Fig. 4b). The determined P is used in the boundary condition (in Eq. 4) for solving the unsteady transport equation to predict the spatial-temporal solute tissue distribution profiles surrounding a microvessel (see Note 13).
3.10. Determination of Effective Solute Diffusion Coefficient in Brain Tissue (Deff) from 3-D Images
Figure 4a, c illustrates how to determine Deff from the collected images
Eight straight white lines in different radial directions are drawn from the center of the vessel (Fig. 4a).
The averaged fluorescence intensity along the eight lines at different times (t = 25, 50, and 75 s) is plotted from the vessel wall (Fig. 4c). The smooth lines are the best fitting curves of the model prediction at the corresponding times when the proper Deff is chosen (see Note 13). Deff/Dfree = 0.15 (Dfree is the solute diffusion coefficient in an aqueous solution at 37 °C) is the best fitting value for this run of the experiment.
3.11. Corrections for Influence of Red Blood Cells, Free Dye, and Solvent Drag on BBB Permeability
The above determined BBB solute permeability is the uncorrected permeability. Three factors, from red blood cells, free dye, and solvent drag, need to be corrected to find the true diffusive permeability defined in Kedem-Katchalsky equations (see introduction).
The fluorescence dye solution is injected into the brain at the rate of 3 ml/min, the same as the normal blood perfusion rate at the carotid artery. Although at this perfusion rate the blood is assumed to be replaced by the fluorescence solution, there is still residue blood (red blood cells, RBCs) in the cerebral microvessels, which would overestimate the measured BBB permeability by ~11%, as estimated in [12].
In addition to RBCs, free dye would overestimate the permeability to fluorescently labeled solutes. The influence of the free dye on the solute permeability is estimated by using equation Pcorrect = [1/(1–F)] Pmeasure − [F/(1–F)] Pfreedye, where Pmeasure was the measured permeability and Pfreedye is similar to PNaFl since the molecular weights of FITC (389.4) is close to that of sodium fluorescein (NaFl, 376). F is the intensity fraction of the free dye to the fluorescently labeled probe in the solution. F is less than 1/1000 in the commonly used FITC-conjugated solute solutions [12-16]. Pcorrect is the corrected apparent permeability P.
- The above apparent permeability P corrected for the RBCs and free dye still overestimates the true diffusive solute permeability Pd due to the coupling of solute flux with water flow (solvent drag). The Pd is calculated by using the following equations:
where P is the corrected apparent permeability, Pe is the Peclet number, Lp is the hydraulic conductivity of the microvessel, which is ~2.0 × 10⁻⁹ cm/s/cm H2O for the cerebral microvessels [29], σ is the reflection coefficient of the microvessel to the solute, and Δpeff is the effective filtration pressure across the microvessel wall, obtained from:
where Δp and Δπ are the hydrostatic and oncotic pressure differences across the microvessel wall. The superscript dye-solute is NaFl or Dex-70k, in our examples. σ of rat cerebral microvessels to the test solutes is estimated based on previous studies [12] according to the molecule sizes. σdextran-70k (the same as σalbumin) and σNaFl were estimated to be 0.95 and 0.1, respectively. Δp in the cerebral microvessel was ~10 cm H2O; Δπalbumin was 3.6 cm H2O for 10 mg/mL BSA [12].
Acknowledgments
The author would like to thank the funding support from the National Institutes of Health R01NS101362 (B. Fu) and R01AG064798 (D. Zhu).
Footnotes
All procedures should be performed in biosafety hood with laminar flow, and handling of the inserts should be carefully done with autoclaved forceps to avoid potential contaminations.
The insert with cells should be handled with autoclaved forceps.
Although all the perimeters including the dextran dilution have been previously tested, it may still be worthwhile running a standard curve for fluorescent reading of dextran at different dilutions to make sure that the concentration (C) and fluorescence reading (F) from the plate reader will be in a linear range.
The permeability coefficient also depends on the size of a molecular, or its molecule weight [30]; therefore using different sizes of dextran will result in differences in permeability coefficient results [27].
The chamber is cleaned by 70% ethanol before applying the solution.
For example, sodium fluorescein of 0.1 mg/mL, in the linear range of 0.0125–0.2 mg/mL, and FITC-dextran 70k of 1 mg/mL, in the linear range of 0.125–2 mg/mL, will be used in the in vivo experiment.
Within this depth of the light collection, the fluorescence intensity is proportional to the total number of fluorescent molecules and is independent of the chamber depth. This narrow depth of light collection in our system allows us to minimize the influence from the light coming from other parts of the brain tissue, especially from the meninges for the pial microvessels. It is very important to use the objective lens with proper magnification and numerical aperture to achieve narrow but enough depth of light collection to collect correct samples with minimum light contamination from irrelevant parts.
The post-capillary venule is most permeable among all microvessels. We follow the method described in [16] for identifying post-capillary venules.
About 3 mL/min is the mean blood flow rate at the carotid artery for this sized rat.
The collecting time is related to the image quality. 5–15 s per ROI in our experiment is good enough for the image quality for determining the BBB solute permeability and effective diffusion coefficient in brain tissue.
The size and placement of the measuring window are chosen to satisfy that (a) the vessel segment is straight, (b) the dye does not spread out of the window during the time for P measurement (5–30 s for the size of dyes used in our experiment), and (c) no contamination of the dye from the neighboring vessels.
The circumference of the orange dashed line enclosed ROI is chosen as 10–30 μm from the vessel perimeter to avoid contamination from the adjacent vessels but large enough to include the spreading dye from the vessel lumen during the period for the P measurement.
| (1) |
| (2) |
| (3) |
| (4) |
| (5) |
| (6) |
References
- 1.Abbott NJ, Patabendige AA, Dolman DE, Yusof SR, Begley DJ (2010) Structure and function of the blood-brain barrier. Neurobiol Dis 37(1):13–25. 10.1016/j.nbd.2009.07.030 [DOI] [PubMed] [Google Scholar]
- 2.Farkas E, Luiten PG (2001) Cerebral microvascular pathology in aging and Alzheimer’s disease. Prog Neurobiol 64(6):575–611. 10.1016/s0301-0082(00)00068-x [DOI] [PubMed] [Google Scholar]
- 3.Nicolazzo JA, Charman SA, Charman WN (2006) Methods to assess drug permeability across the blood-brain barrier. J Pharm Pharmacol 58(3):281–293. 10.1211/jpp.58.3.0001 [DOI] [PubMed] [Google Scholar]
- 4.Fu BM (2018) Transport across the blood-brain barrier. Adv Exp Med Biol 1097:235–259. 10.1007/978-3-319-96445-4_13 [DOI] [PubMed] [Google Scholar]
- 5.Cornford EM, Young D, Paxton JW, Sofia RD (1992) Blood-brain barrier penetration of felbamate. Epilepsia 33(5):944–954. 10.1111/j.1528-1157.1992.tb02205.x [DOI] [PubMed] [Google Scholar]
- 6.Zlokovic BV, Begley DJ, Djuricic BM, Mitrovic DM (1986) Measurement of solute transport across the blood-brain barrier in the perfused Guinea pig brain: method and application to N-methyl-alpha-aminoisobutyric acid. J Neurochem 46(5):1444–1451. 10.1111/j.1471-4159.1986.tb01760.x [DOI] [PubMed] [Google Scholar]
- 7.de Lange EC, de Boer BA, Breimer DD (1999) Microdialysis for pharmacokinetic analysis of drug transport to the brain. Adv Drug Deliv Rev 36(2–3):211–227. 10.1016/s0169-409x(98)00089-1 [DOI] [PubMed] [Google Scholar]
- 8.Elsinga PH, Hendrikse NH, Bart J, Vaalburg W, van Waarde A (2004) PET studies on P-glycoprotein function in the blood-brain barrier: how it affects uptake and binding of drugs within the CNS. Curr Pharm Des 10 (13):1493–1503. 10.2174/1381612043384736 [DOI] [PubMed] [Google Scholar]
- 9.Wang R, Ashwal S, Tone B, Tian HR, Badaut J, Rasmussen A, Obenaus A (2007) Albumin reduces blood-brain barrier permeability but does not alter infarct size in a rat model of neonatal stroke. Pediatr Res 62(3):261–266. 10.1203/PDR.0b013e318123f757 [DOI] [PubMed] [Google Scholar]
- 10.Gaber MW, Yuan H, Killmar JT, Naimark MD, Kiani MF, Merchant TE (2004) An intravital microscopy study of radiation-induced changes in permeability and leukocyte-endothelial cell interactions in the microvessels of the rat pia mater and cremaster muscle. Brain Res Brain Res Protoc 13(1):1–10. 10.1016/j.brainresprot.2003.11.005 [DOI] [PubMed] [Google Scholar]
- 11.Easton AS, Fraser PA (1994) Variable restriction of albumin diffusion across inflamed cerebral microvessels of the anaesthetized rat. J Physiol 475(1):147–157. 10.1113/jphysiol.1994.sp020056 [DOI] [PMC free article] [PubMed] [Google Scholar]
- 12.Shi L, Palacio-Mancheno P, Badami J, Shin DW, Zeng M, Cardoso L, Tu R, Fu BM (2014) Quantification of transient increase of the blood-brain barrier permeability to macromolecules by optimized focused ultrasound combined with microbubbles. Int J Nanomedicine 9:4437–4448. 10.2147/IJN.S68882 [DOI] [PMC free article] [PubMed] [Google Scholar]
- 13.Shi L, Zeng M, Fu BM (2014) Temporal effects of vascular endothelial growth factor and 3,5-cyclic monophosphate on blood-brain barrier solute permeability in vivo. J Neurosci Res 92(12):1678–1689. 10.1002/jnr.23457 [DOI] [PMC free article] [PubMed] [Google Scholar]
- 14.Shi L, Zeng M, Sun Y, Fu BM (2014) Quantification of blood-brain barrier solute permeability and brain transport by multiphoton microscopy. J Biomech Eng 136(3):031005. 10.1115/1.4025892 [DOI] [PubMed] [Google Scholar]
- 15.Shin DW, Fan J, Luu E, Khalid W, Xia Y, Khadka N, Bikson M, Fu BM (2020) In vivo modulation of the blood-brain barrier permeability by transcranial direct current stimulation (tDCS). Ann Biomed Eng 48(4):1256–1270. 10.1007/s10439-020-02447-7 [DOI] [PMC free article] [PubMed] [Google Scholar]
- 16.Yuan W, Lv Y, Zeng M, Fu BM (2009) Non-invasive measurement of solute permeability in cerebral microvessels of the rat. Microvasc Res 77(2):166–173. 10.1016/j.mvr.2008.08.004 [DOI] [PubMed] [Google Scholar]
- 17.Crone C, Olesen SP (1982) Electrical resistance of brain microvascular endothelium. Brain Res 241(1):49–55. 10.1016/0006-8993(82)91227-6 [DOI] [PubMed] [Google Scholar]
- 18.Pardridge WM (1998) CNS drug design based on principles of blood-brain barrier transport. J Neurochem 70(5):1781–1792. 10.1046/j.1471-4159.1998.70051781.x [DOI] [PubMed] [Google Scholar]
- 19.Patlak CS, Fenstermacher JD (1975) Measurements of dog blood-brain transfer constants by ventriculocisternal perfusion. Am J Phys 229 (4):877–884. 10.1152/ajplegacy.1975.229.4.877 [DOI] [PubMed] [Google Scholar]
- 20.Nicholson C, Phillips JM (1981) Ion diffusion modified by tortuosity and volume fraction in the extracellular microenvironment of the rat cerebellum. J Physiol 321:225–257. 10.1113/jphysiol.1981.sp013981 [DOI] [PMC free article] [PubMed] [Google Scholar]
- 21.Thorne RG, Nicholson C (2006) In vivo diffusion analysis with quantum dots and dextrans predicts the width of brain extracellular space. Proc Natl Acad Sci U S A 103(14):5567–5572. 10.1073/pnas.0509425103 [DOI] [PMC free article] [PubMed] [Google Scholar]
- 22.Stroh M, Zipfel WR, Williams RM, Webb WW, Saltzman WM (2003) Diffusion of nerve growth factor in rat striatum as determined by multiphoton microscopy. Biophys J 85 (1):581–588. 10.1016/S0006-3495(03)74502-0 [DOI] [PMC free article] [PubMed] [Google Scholar]
- 23.Ishizaki T, Chiba H, Kojima T, Fujibe M, Soma T, Miyajima H, Nagasawa K, Wada I, Sawada N (2003) Cyclic AMP induces phosphorylation of claudin-5 immunoprecipitates and expression of claudin-5 gene in blood-brain-barrier endothelial cells via protein kinase A-dependent and -independent pathways. Exp Cell Res 290(2):275–288. 10.1016/s0014-4827(03)00354-9 [DOI] [PubMed] [Google Scholar]
- 24.Lippmann ES, Al-Ahmad A, Azarin SM, Palecek SP, Shusta EV (2014) A retinoic acid-enhanced, multicellular human blood-brain barrier model derived from stem cell sources. Sci Rep 4:4160. 10.1038/srep04160 [DOI] [PMC free article] [PubMed] [Google Scholar]
- 25.Ma SH, Lepak LA, Hussain RJ, Shain W, Shuler ML (2005) An endothelial and astrocyte co-culture model of the blood-brain barrier utilizing an ultra-thin, nanofabricated silicon nitride membrane. Lab Chip 5(1):74–85. 10.1039/b405713a [DOI] [PubMed] [Google Scholar]
- 26.Bell RD, Winkler EA, Singh I, Sagare AP, Deane R, Wu Z, Holtzman DM, Betsholtz C, Armulik A, Sallstrom J, Berk BC, Zlokovic BV (2012) Apolipoprotein E controls cerebrovascular integrity via cyclophilin A. Nature 485 (7399):512–516. 10.1038/nature11087 [DOI] [PMC free article] [PubMed] [Google Scholar]
- 27.Zhao Z, Sagare AP, Ma Q, Halliday MR, Kong P, Kisler K, Winkler EA, Ramanathan A, Kanekiyo T, Bu G, Owens NC, Rege SV, Si G, Ahuja A, Zhu D, Miller CA, Schneider JA, Maeda M, Maeda T, Sugawara T, Ichida JK, Zlokovic BV (2015) Central role for PICALM in amyloid-beta blood-brain barrier transcytosis and clearance. Nat Neurosci 18 (7):978–987. 10.1038/nn.4025 [DOI] [PMC free article] [PubMed] [Google Scholar]
- 28.Yuan F, Leunig M, Berk DA, Jain RK (1993) Microvascular permeability of albumin, vascular surface area, and vascular volume measured in human adenocarcinoma LS174T using dorsal chamber in SCID mice. Microvasc Res 45(3):269–289. 10.1006/mvre.1993.1024 [DOI] [PubMed] [Google Scholar]
- 29.Kimura M, Dietrich HH, Huxley VH, Reichner DR, Dacey RG Jr (1993) Measurement of hydraulic conductivity in isolated arterioles of rat brain cortex. Am J Phys 264(6 Pt 2): H1788–H1797. 10.1152/ajpheart.1993.264.6.H1788 [DOI] [PubMed] [Google Scholar]
- 30.Xiang TX, Anderson BD (1994) The relationship between permeant size and permeability in lipid bilayer membranes. J Membr Biol 140 (2):111–122. 10.1007/bf00232899 [DOI] [PubMed] [Google Scholar]