Abstract
Numerous studies have established that estimated brain age, as derived from statistical models trained on healthy populations, constitutes a valuable biomarker that is predictive of cognitive decline and various neurological diseases. In this work, we curate a large-scale heterogeneous dataset (N = 10,158, age range 18 - 97) of structural brain MRIs in a healthy population from multiple publicly-available sources, upon which we train a deep learning model for brain age estimation. The availability of the large-scale dataset enables a more uniform age distribution across adult life-span for effective age estimation with no bias toward certain age groups. We demonstrate that the age estimation accuracy, evaluated with mean absolute error (MAE) and correlation coefficient (r), outperforms previously reported methods in both a hold-out test set reflective of the custom population (MAE = 4.06 years, r = 0.970) and an independent life-span evaluation dataset (MAE = 4.21 years, r = 0.960) on which a previous study has evaluated. We further demonstrate the utility of the estimated age in life-span aging analysis of cognitive functions. Furthermore, we conduct extensive ablation tests and employ feature-attribution techniques to analyze which regions contribute the most predictive value, demonstrating the prominence of the frontal lobe as well as pattern shift across life-span.
In summary, we achieve age estimation performance comparable to previous studies but with a more heterogenous dataset confirming the efficacy of deep learning and the added utility of training with data both in larger number and more uniformly distributed than in previous studies. We demonstrate the regional contribution to our brain age predictions through multiple routes and confirm the association of divergence between estimated and chronological brain age with neuropsychological measures.
Keywords: brain-age, MRI, deep learning, normal aging, adult life-span
1. Introduction
Age estimation is the task of estimating an individual’s age based on a set of other covariates. In particular, a large body of research focuses on the task of predicting brain age based on imaging studies[1, 2, 3]. In addition to its utility in studying the aging process itself, estimated age, as derived from models trained on a healthy population, has emerged as a useful biomarker for diseases[4]. Specifically, the divergence of one’s estimated age from chronological age has been associated with various diseases, especially those thought to mimic an advanced age state[5, 6].
Typically, models for estimating brain age are trained on datasets representing a normal aging population free of obvious disease. When subsequently applied on (possibly abnormal) participants, predicted brain age has been linked to education and self-reported physical activity [7] and has been utilized to characterize diseases including Alzheimer’s Disease (AD) [8], schizophrenia [9], traumatic brain injury [10], etc., where deviation from normal aging trajectory occurs alongside disease state. Related to this, healthy individuals are generally recruited such that their age overlap with the age range of the disease being studied; that is, healthy controls for schizophrenia studies will be younger than those for AD. When creating a selection of structural neuroimaging it is likely that the source data will oversample certain age ranges.
There are three components necessary to determine brain age with this paradigm: 1) covariates: the measured brain characteristics which serve as inputs to the model, 2) dataset: the precise cohort of normal aging participants upon which the model is trained, 3) model: the precise algorithms used to estimate the brain age given the available covariates.
While brain characteristics can be derived via many methods, neuroimaging is the most common and comprehensive way to characterize the “brain state” in vivo. Within neuroimaging, past studies have addressed EEG (Electroencephalogram) [11], DTI (diffusion tensor imaging) [12], and resting state BOLD fMRI (blood-oxygen-level dependent functional MRI) [13], which reflect different physiological brain measures. However, T1-weighted (T1w) structural MRI, which reveals features of the underlying anatomical characteristics of the brain, including gray and white matter delineation and gyral and sulcal patterns, is the most common modality in brain age estimation research. Imaging-derived neuroanatomical characteristics are biomarkers particularly sensitive to the aging process [14]. Practically, as one most widely available and standardized neuroimaging modalities, T1w structural MRI can be easily acquired for a large population. And within structural MRI domain, studies have used derived summary variables such as regional volumes or thickness estimation [15], requiring additional software processing to generate such values, and also unprocessed MRI scans [16].
We believe that, for these tools to be broadly useful, they must be trained on adequately diverse datasets that reflect the diversity of the populations on which the model might potentially be deployed. This range of population can include location, scanner, protocol, recruitment criteria and age. In this study, we propose using a composite dataset aggregated from several publicly available multi-center neuroimaging datasets, representing a diverse healthy population. This healthy study population is both larger in scale than those investigated by most previous age estimation studies and specifically designed to enable training age estimation models, and their evaluation, with an approximately uniform age distribution across the adult life span.
Lastly, given a study population and selected brain characteristics, the age is estimated based on statistical machine learning techniques. Another way to formulate the age estimation problem is to extract generalizable features from the brain that best capture the chronological age of a person provided the individual is undergoing a typical aging process that is present in a general healthy population. Numerous traditional machine learning methods have been proposed for age estimation including relevance vector machines [17, 18], Gaussian processes [19, 20], random forests [21], hidden Markov models [22], and non-negative matrix factorization [23].
More modern deep learning based methods are especially well suited to this task provided enough training data, and have been previously applied by [16] who demonstrated favorable performance. Interpretability is a critical aspect of any deep neural network based method. We seek not only to achieve predictive performance, but also to derive insights by understanding which features are most predictive. In this work, we explore regional contributions in the regression task by considering both feature ablation experiments and an activation map based post hoc interpretation method.
In summary, we utilize a 3D deep convolutional neural network based regression model to estimate age using T1w structural MRI volumes from a diverse multi-study population that is sampled with even age distribution across adult age span. We seek to extend and improve upon existing age-prediction studies by evaluating uniform and non-uniform age distributions in training and by performing analyses examining the regional contribution of prediction. This model performs well in both the hold-out test set from the same population and also in an independent life-span evaluation dataset. The deviance of the estimated age from chronological age is linked to neuropsychological and neuromorphometric measures. We further demonstrate the involvement of the frontal lobe in brain age estimation, and the pattern variability across life-span.
2. Method
In this section, we first describe the population and the experimental setup used in this study. We then describe the MRI pre-processing steps and the convolutional neural network used to estimate age. Next, given our learned model for estimating brain age, we present analysis that associates the divergence of the estimated age from the chronological brain age with neuropsychological and neuromorphometric measures. Finally, we describe multiple modes of regionality analysis for identifying which regions are most predictive. These consist of both ablation experiments and an extension of the class activation mapping method for interpreting feature importance in deep networks to the regression setting.
2.1. Study Population
It is necessary to build an adequate neuroimaging dataset for age prediction in the full adult life span, especially given study recruitment criteria the dataset is not necessarily evenly distributed across age. Increased participation in open data consortia and imaging datasets greatly facilitates the collection of such data. In this work, we collect more than 30,000 T1w MRI scans from multiple open neuroimaging datasets. All scans were acquired for studies approved by local institutional review board, research ethics committee, or human investigations committees. The list of the datasets used in this study with the full names and sources are listed in supplementary Table S2. Among those, we only include participants with clear indication of normal neurological evaluations contingent on the individual data providers criteria for a subject that is considered free of disease. Specifically, we exclude participants with any neurological or psychiatric disease, and also participants with no available diagnosis label. We also chose 18 as the minimum age to cover adulthood and also to avoid the neurodevelopmental stage. This results in 10,158 MRI sessions from 6,142 unique participants, the statistics are summarized in Table 1.
Table 1:
Dataset information
| Dataset | Nsessions | Nsubjects | age range | agesession mean ± std | gendersession M/F | gendersubject M/F |
|---|---|---|---|---|---|---|
| ADNI | 2423 | 438 | 56.3 - 95.8 | 76.64 ± 6.05 | 1223/1192 | 217/221 |
| AIBL | 781 | 457 | 60 - 92 | 72.86 ± 6.53 | 359/421 | 199/258 |
| NIFD | 428 | 136 | 36.9 - 85.2 | 65.76 ± 7.66 | 185/243 | 59/77 |
| IXI | 561 | 561 | 20.0 - 86.3 | 48.67 ± 16.47 | 248/313 | 248/313 |
| BGSP | 1566 | 1566 | 19 - 35 | 21.54 ± 2.89 | 661/905 | 661/905 |
| Cam-CAN | 652 | 652 | 18 - 88 | 54.30 ± 18.59 | 322/330 | 322/330 |
| OASIS-1 | 316 | 316 | 18 - 94 | 45.09 ± 23.90 | 119/197 | 119/197 |
| OASIS-2 | 145 | 56 | 60 - 97 | 76.54 ± 7.99 | 52/93 | 19/37 |
| SALD | 467 | 467 | 19 - 80 | 45.07 ± 17.39 | 168/297 | 168/297 |
| SLIM | 972 | 561 | 18 - 28.5 | 20.68 ± 1.40 | 425/547 | 244/317 |
| PPMI | 130 | 74 | 30.6 - 81 | 60.95 ± 10.85 | 91/39 | 48/26 |
| SchizConnect | 742 | 567 | 18 - 70 | 35.36 ± 12.76 | 429/313 | 338/229 |
| DLBS | 301 | 301 | 20.6 - 89.1 | 53.62 ± 19.92 | 115/186 | 115/186 |
| CoRR | 1326 | 642 | 18 - 83 | 28.78 ± 12.39 | 689/637 | 343/299 |
| total | 10158 | 6142 | 18 - 97 | 47.92 ± 24.89 | 4764/5783 | 2780/3362 |
However, as shown in Figure 1A and B, where we illustrate the age distribution of the 10,158 sessions and 6,142 participants respectively, the age distribution of the population is poorly balanced. Although there are studies covering the full age span including normal aging studies Cam-CAN [24], IXI, SALD [25], DLBS [26], OASIS-1 [27], and consortium-based studies such as CoRR [28], SchizConnect [29], many of the public imaging studies either focused on age-related disease in the older adult population including ADNI, AIBL [30], OASIS-2 [31], PPMI [32], NIFD; or on young participants including BGSP [33], SLIM [34]. To alleviate the potential bias toward a certain age segment, we sought to balance the age distribution that we ultimately use in the training population.
Figure 1:
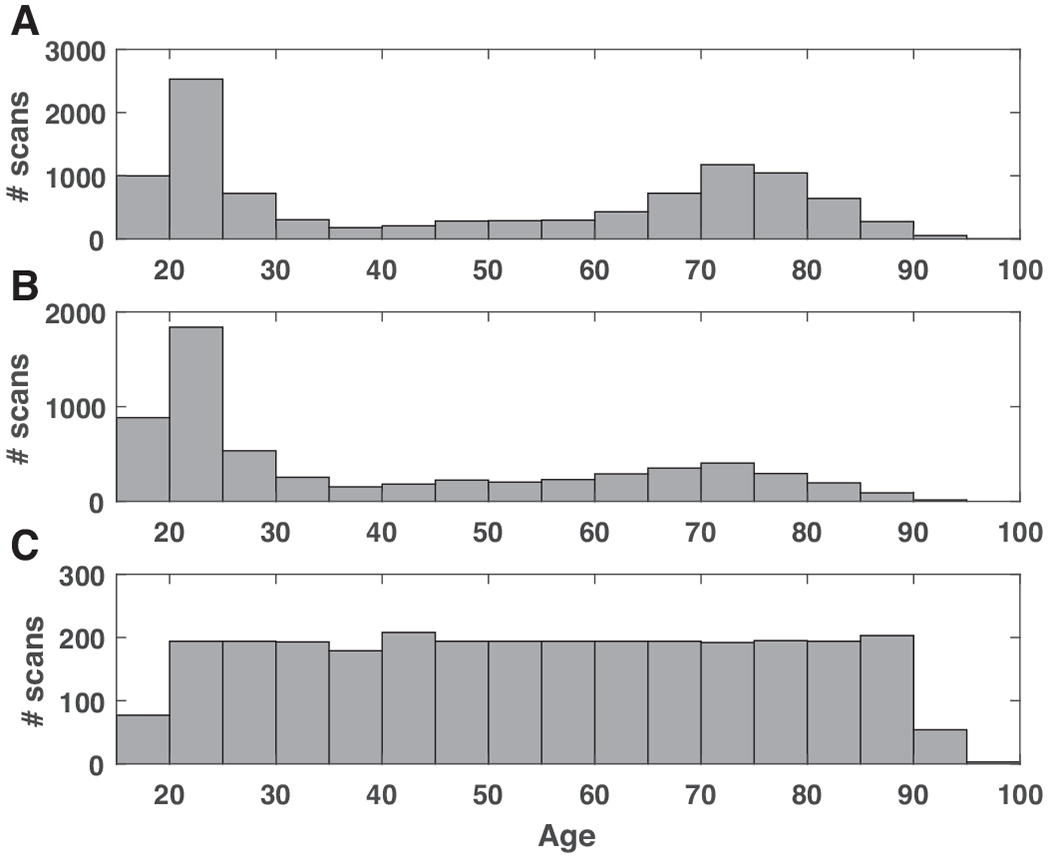
The age distribution of the study population. A) The age distribution of the raw dataset consisted of 10,158 MRI sessions; B) the age distribution of the dataset consisted of 6,142 unique participants; C) the age distribution of the evenly sampled dataset.
In this study, when constructing the dataset to be uniform across age-span, we adopt both ‘oversampling’ and ‘undersampling’. Briefly, we oversample participants from age ranges with fewer participants by including the longitudinal follow-up sessions from the same participants, which could be regarded as a natural augmentation. For age ranges with more participants, we only include one scan per subject to increase the variability of the sample. If that number is still above the minimum across age bins, we further undersample stratified on confounding factors including acquisition site and gender.
We stratify the populations into age bins and use the bin with the minimum number of participants as the basis number. The age bins used in this study are [18, 20), [20, 25), [25, 30), … , [85, 90), [90, 100).
One interesting observation is that the [35, 40), [40, 45) are the two age bins with fewest number of participants, so we use the number of participants in this age segment as the base level and allow repeated scans from same participants. The other age bins having multiple scans per subject are the two age bins at the tail end: [85, 90) and [90, 100], because of the relative lower number in these two age bins. We undersample the participants in all other bins.
The final dataset consists of 2,852 MRI sessions from 2,694 participants covering age range 18-97, with the mean age 54.34 years old, standard deviation 21.16 years old. The age distribution of the evenly-sampled adult age span dataset is shown in Figure 1C.
2.2. Experimental setup
We design training, validation and test sets of participants for model training and evaluation. We build a validation set reflecting of general MRI scan distribution and population distribution. Similarly, a test set representative of the same population as the training and validation sets is important for evaluation.
Given this uniform age-distributed dataset we described in the section above, we perform stratified split based on acquisition sites and gender within each age bin: 8/10 as training set, 1/10 as validation set, 1/10 as test set, ensuring non-overlapping participants and similar distribution of age, gender and acquisition sites in the training, validation and test sets.
We also evaluate our model by testing it on an independent test set: Cam-CAN. Aiming to study the normal aging process through the adult life-span, Cam-CAN provided even age distribution across adult life-span and was previously used as an independent testing sample in another age estimation study [19]. We note that the trained model should be applicable to any similarly acquired structural neuroimaging within this age range. However, the result on an independent sample, which usually reflects a homogeneous population or acquisition setting, might be over- or under-optimistic.
Additionally, we also perform a test-retest experiment using an independent dataset of three participants scanned 40 times in 30 days [35] to evaluate the reproducibility of the model.
2.3. MRI Preprocessing
We apply basic pre-processing steps including nonparametric nonuniform intensity normalization (N3) based bias field correction [36], brain extraction using FreeSurfer [37], and affine registration to the 1mm3 isotropic MNI152 brain template with trilinear interpolation using FSL FLIRT [38]. The dimension of the 3D volume is 182 × 218 × 182 (LR×AP×SI).
All the preprocessed scans were checked by a well-trained reviewer with visual inspection. Scans having obvious and severe MRI artifacts, brain extraction failure or poor registration were excluded.
2.4. Convolutional neural network
We use a three-dimensional convolutional neural network (3D-CNN) regression model for age estimation, with similar architecture as the 3D-CNN classification model for Alzheimer’s disease classification used in [39]. We follow a general CNN architecture similar to the VGG classification architecture [40] with multiple interleaved convolutional blocks and max pooling layers and an increasing number of features along the depth. We replaced all 2D operations with 3D operations and included one fully-connected layer to reduce the number of parameters. We use convolutional layers with kernel size of 3 × 3 × 3, rectified linear unit (ReLU) as the activation function, and batch normalization (BN) layers before the activation functions. We flatten the output from the last convolutional layer and feed into a fully-connected (FC) layer. And the final activation is a linear operation instead of a softmax in classification tasks. We include weight l2 regularization to prevent overfitting with a factor of 1.0. The algorithm was optimized using Adam algorithm with mean absolute error (MAE) loss function, and with a batch size of 5. The initial learning rate was tuned in the range from 1e – 4 to 1e – 6 including [1e-4, 5e-5, 2e-5, 1e-5, 5e-6, 2e-6, 1e-6] and was set at 2e-5.
We implemented the algorithm using Keras and TensorFlow. An illustration of the framework is shown in Figure 2. In this study, we use five (N in Figure 2) stages. The feature dimension of the first layer is 16 and increases by a factor of 2 in each subsequent stage. The optimal model is selected as the model with the lowest validation MAE.
Figure 2:
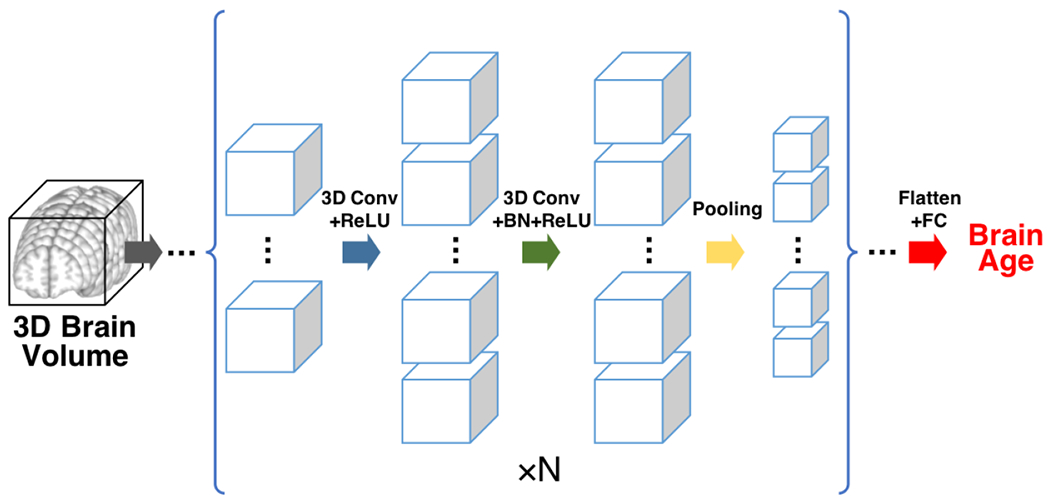
The convolution neural network architecture. The inputs are 3D brain volumes. Each cube represents one 3D feature map. The size of the cube reflects the spatial dimension of the feature map, the number of the cubes reflects the number of feature maps (channel dimension) at a specific depth. The blue arrow denotes 3D convolution operation with rectified linear unit (ReLU), the green arrow denotes 3D convolution followed by batch normalization (BN) and ReLU, the yellow arrow denotes the max pooling operation. The basic unit enclosed in the bracket is repeated N = 5 times with increasing number of features and decreasing spatial dimension. The final convolutional output is flattened and fed into one fully-connected (FC) layer with linear output (red arrow), generating the final brain age prediction.
2.5. Comparison with model trained on unbalanced dataset
We also trained the model using all scans from unique participants (N = 6,142, Figure 1B). We applied the trained model on the independent Cam-CAN dataset and studied the distribution of MAE over chronological age groups.
Besides, a simple way to potentially correct the imbalance without adjusting the sampling of the dataset is re-weighting the samples, specifically, we assign different weights to different sample, with the weights in proportional to the inverse of the frequency of specific age segments. We note that while importance weighting is a principled statistical technique with well-known effects in traditional statistical models, its impact on the learned predictors in deep learning algorithms are a subject of active inquiry [41].
2.6. Neuropsychological and morphometric associations
To test the utility of the estimated age in studying cognitive functions across adult life-span, we evaluate the association between the summary scores of Benton face recognition test (BFRT) and the estimated age in Cam-CAN dataset.
Specifically, we use the signed difference of the estimated age and chronological age to reflect the deviance of individual brain age from their chronological age, and we refer to this value as agediff hereinafter. The BFRT is a commonly used neuropsychological instrument that can be easily and reliably administered in adult patients to test baseline visual memory and perception [42]. We adopted the SubScore-1, SubScore-2, TotalScore (SubScore-1 + SubScore-2) as dependent variables in individual linear regression models incorporating gender, chronological age, agediff, and the interaction of chronological age and agediff:
Additionally, we evaluate the association between agediff with cortical thickness generated using FreeSurfer [43] by performing a partial correlation with gender and chronological age as covariates. FreeSurfer parcellates the cortex into 68 cortical regions.
2.7. Age activation map
Class activation mapping [44, 45] is a commonly-used method for interpreting the classification using CNNs and has been previously used in CNN based medical image analysis [46] to marry potential disease pathology with classification findings. In this work, we use the idea of a class activation map in a regression setting by highlighting the small-valued gradient in grad-CAM framework. We use functions in the keras-vis package (https://github.com/raghakot/keras-vis/). We generate the average activation map within each age group to investigate the age-specific pattern of underlying substrates for age estimation.
2.8. Slice based age estimation
Besides the post hoc saliency map based activation map method, we also propose ablation analyses methods focusing on part of the input data. We apply serial 2D CNNs for age estimation with the input being three consecutive slices along each axis. By doing so, we take into consideration the inter-subject alignment precision (i.e. not using just one slice) and also the similarity among different channels (i.e. not using five slices). The network architecture of the 2D CNN is the identical to the 3D CNN architecture described in the previous section with the 3D operations replaced with the corresponding 2D operations. We report the predictive performance on various sets of 2D slices to analyze predictive importance.
2.9. Lobe based age estimation
Besides sliced based age estimation, we propose using another more anatomically-informed way to study the regionality through ablation experiments at the lobar level. The individual lobe masks were generated following a previous study [39]. The ages are estimated using each lobe individually.
3. Results
3.1. Age prediction
In the hold-out test set, whose instances are distributed identically as the training and validation set, our model achieves an MAE of 4.06 years and correlation coefficient r = 0.970.
An independent normal aging life-span dataset—Cam-CAN—was tested in a previous brain age study [19]. In that study, when the Cam-CAN data were pre-processed with the optimal parameters selected from the independent training sample, their proposed model achieved an MAE of 6.08 years and correlation coefficient r = 0.929. We tested out our model in Cam-CAN study processing the T1w MRI images using the same pipeline as the other samples. The relationship between the estimated age and chronological age in Cam-CAN is shown in Figure 3. The correlation coefficient r is 0.960, MAE is 4.21 years, which outperforms the result in the previous study [19]. We also observe two obvious “outliers” among the 652 participants tested, further investigation is needed to pinpoint potential sources of error, either methodological, constitutional or true poor estimation. The results demonstrate our proposed model achieves accurate estimation in all age segments.
Figure 3:
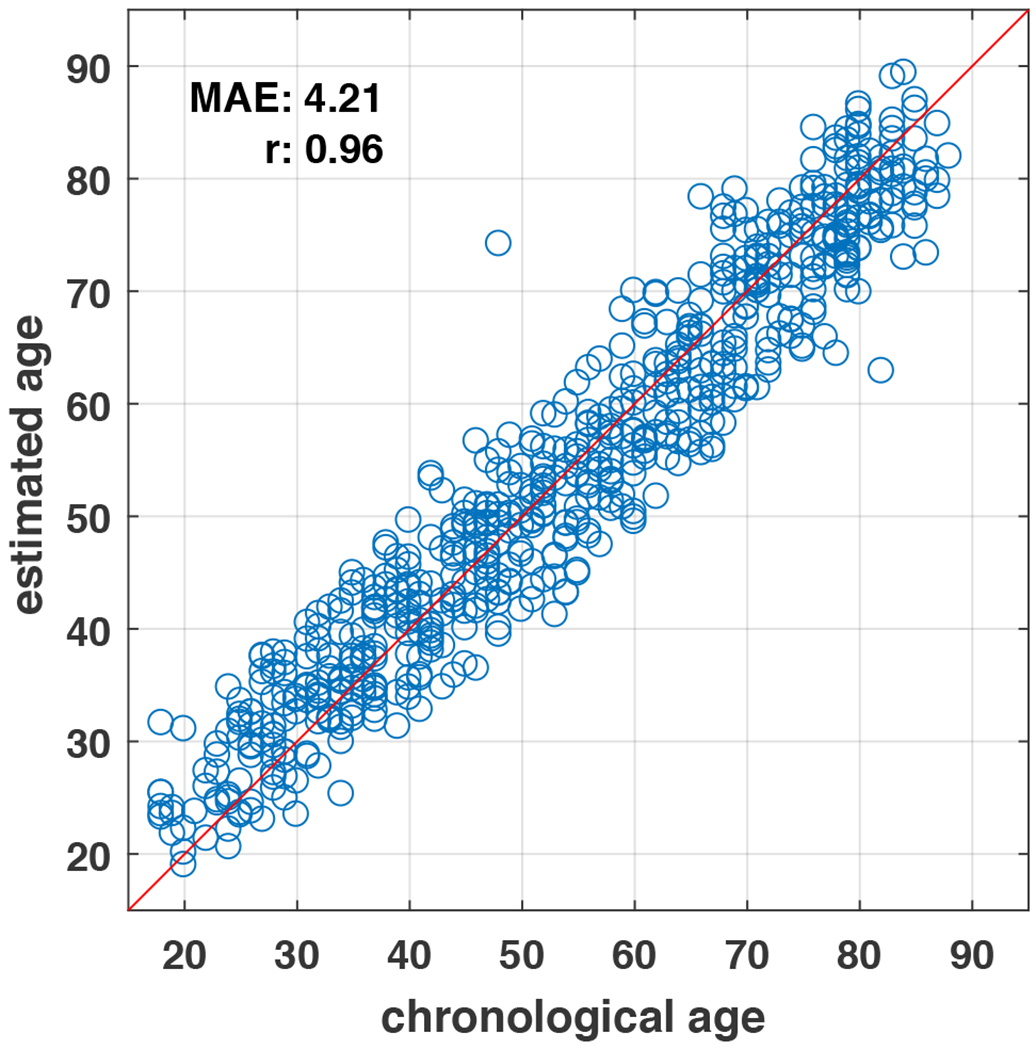
The estimated age versus chronological age in an independent test set of adult life-span.
3.2. Reproducibility
We evaluate the reproducibility of the algorithm in test-retest acquisitions. We show the results in Table 2 and Figure 4, observing that there is a difference in the estimated age and actual reported chronological age that is consistent over the sessions with approximately a 1 year standard deviation.
Table 2:
Reproducibility experiment result
| subject | actual age | predicted age mean | predicted age std |
|---|---|---|---|
| subj-1 | 26 | 25.19 | 1.07 |
| subj-2 | 31 | 33.02 | 1.14 |
| subj-3 | 30 | 27.06 | 0.81 |
Figure 4:
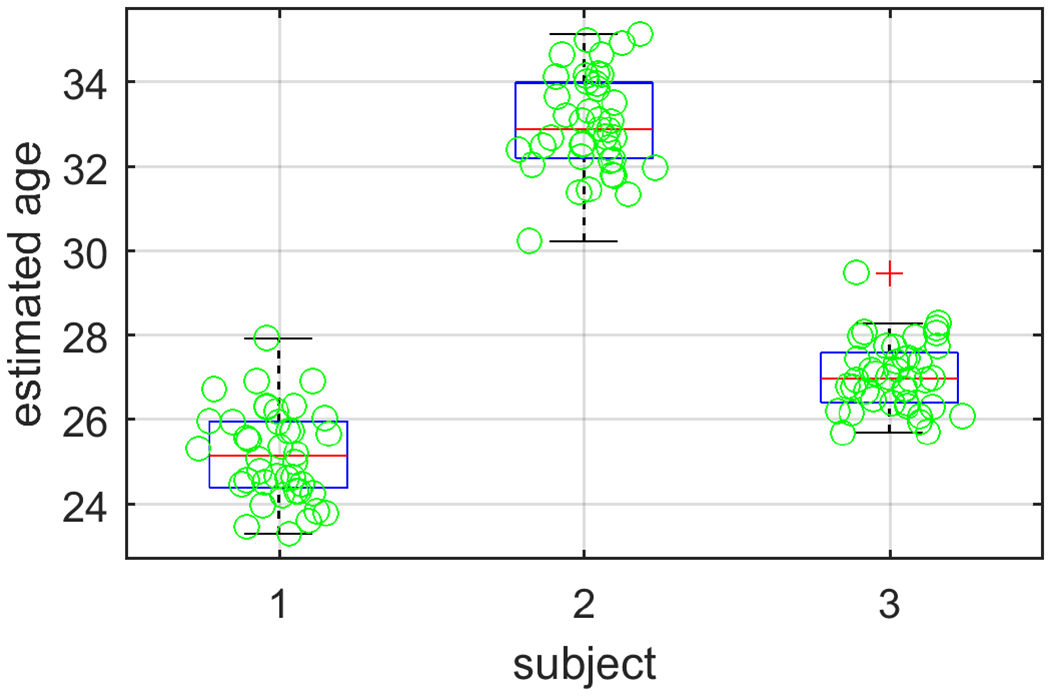
The distribution of predicted ages in test-retest scans.
3.3. Comparison with results using nonuniform dataset
We compare the results using nonuniform dataset with the MAE performance in Cam-CAN dataset. Using the nonuniform dataset achieves comparable overall MAE (4.27 years) as the balanced data. Re-weighting the samples helps slightly improves the MAE (4.17 years) than the balanced dataset despite using many more scans. Additionally, we observe the MAE using the nonuniform dataset is not evenly distributed across life-span: MAE is lower in the young age with more abundant data, as shown in Figure 5 (B). This could introduce potential bias in life-span studies. Using sample re-weighting (Figure 5 (C)) alleviates the problem and using balanced dataset generates generally even distribution across age-span (Figure 5 (A)).
Figure 5:
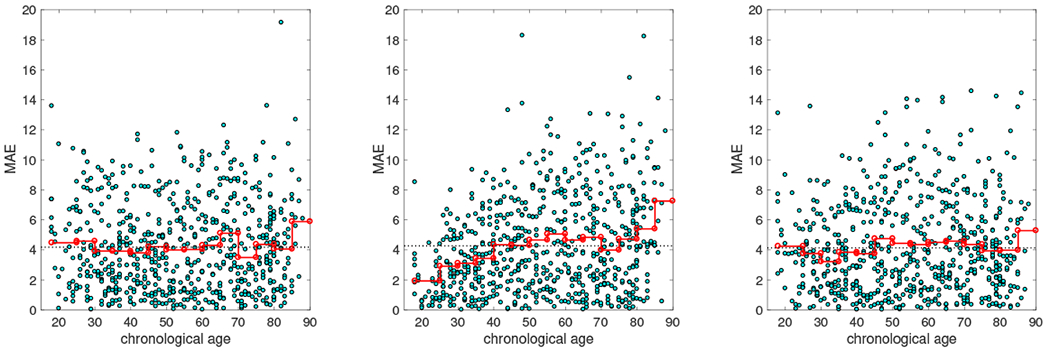
Distribution of MAE across life-span. (Left) Age estimated using the balanced dataset. Each step in the red line indicate the MAE in that age group, the black dashed line indicates the overall MAE. (Middle) Age estimated using the nonuniform dataset. (Right) Age estimated using the nonuniform dataset but with sample re-weighting.
3.4. Neuropsychological and neuromorphometric association
The association of the BFRT scores with the difference in the estimated age and the chronological age and its interaction with chronological age are summarized in Table 3, with the p-value of the regression corresponding to age, agediff and agediff × age.
Table 3:
Association with Benton face recognition scores
| Score | age | age diff | age diff × age | |||
|---|---|---|---|---|---|---|
| β | p | β | p | β | p | |
| SubScore-1 | −2.51e-3 | 3.01e-6 | −0.0127 | 0.0297 | 2.62e-4 | 0.0102 |
| SubScore-2 | −0.0605 | 1.24e-32 | −0.157 | 2.90e-3 | 2.31e-3 | 0.0119 |
| TotalScore | −0.0630 | 5.07e-34 | −0.170 | 1.54e-3 | 2.57e-3 | 5.88e-3 |
The association of the cortical thickness measures with the agediff is illustrated in Figure 6. The thickness of cortical regions are significantly associated with the agediff. In addition, out of the 68 regions measured, 51 regions have a stronger correlation with the estimated age than the chronological age. This is expected as the age estimated through structural MRI image is in principle more coupled to structural phenotypes.
Figure 6:
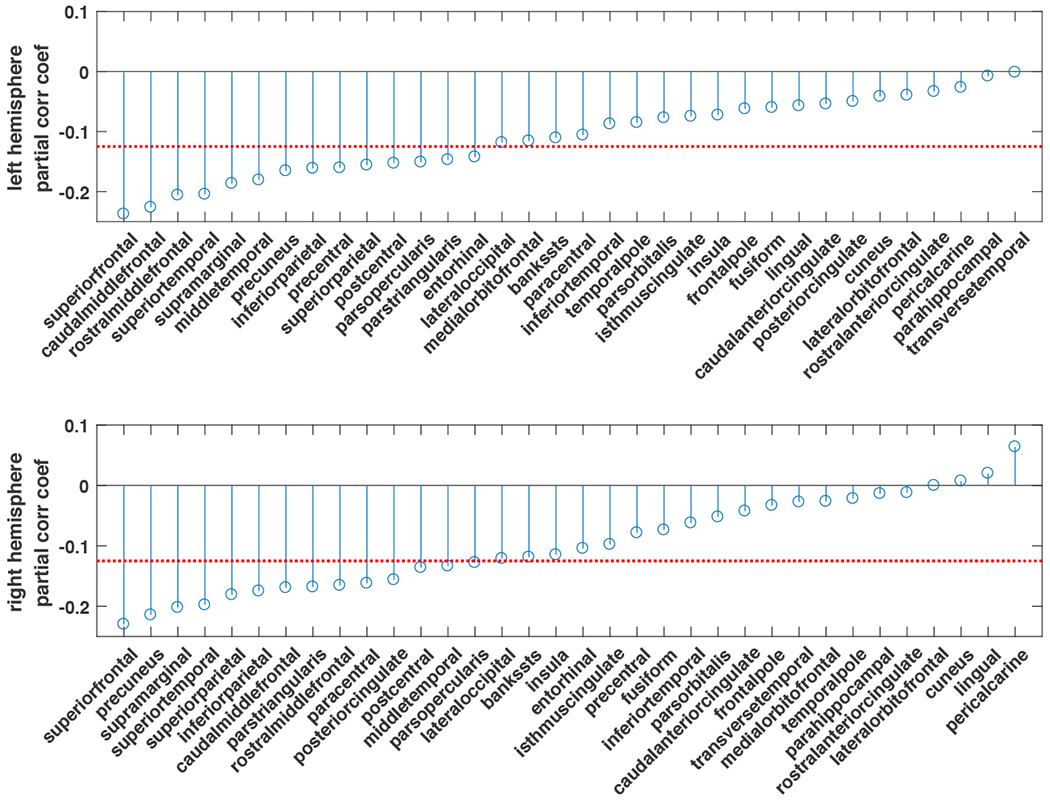
The partial correlation coefficients of agediff and cortical thickness measures. The red dashed line indicates α = 0.05 under multiple comparison of N=34 regions.
3.5. Age activation map
We expect the anatomical patterns characterizing different age groups to be different throughout lifetime but are consistent within a local age range. Thus we generate and illustrate the age activation maps every 5 years, in the same way as preparing the dataset. The 3D iso-surfaces of the average age activation maps are shown in Fig. 7. The average age activation maps overlaid on the MNI152 template are shown in Fig. 8 (Left). To accommodate the anatomical differences in different age groups, we also generated average T1w image within each age group, and overlaid the corresponding age activation map, as shown in Fig. 8 (Right).
Figure 7:
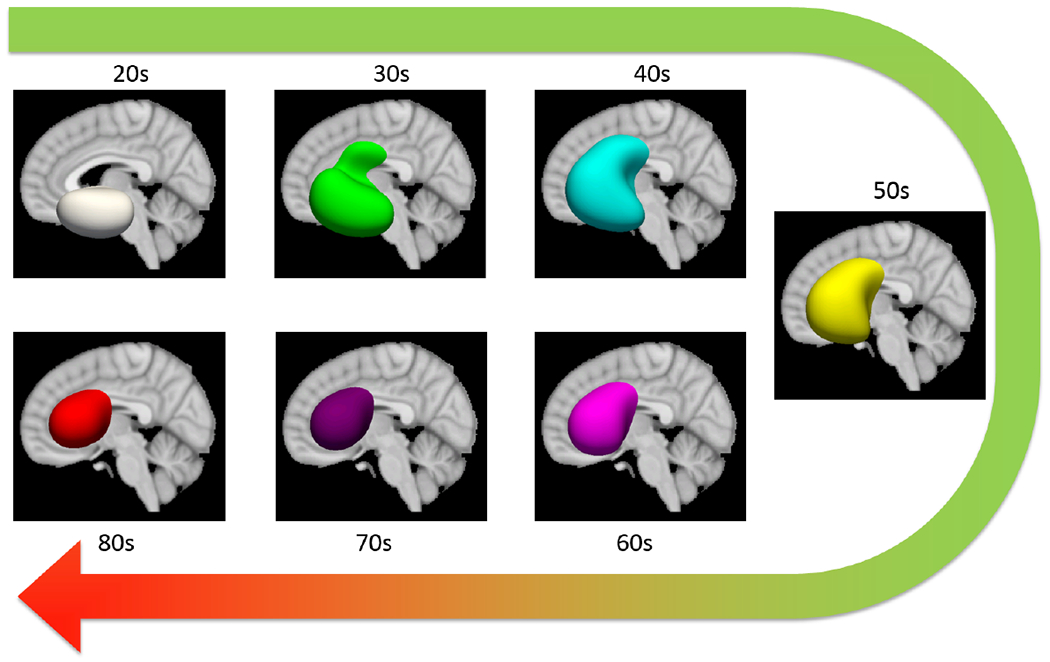
The 3D iso-surfaces (0.8) of the age activation maps at different age groups.
Figure 8:
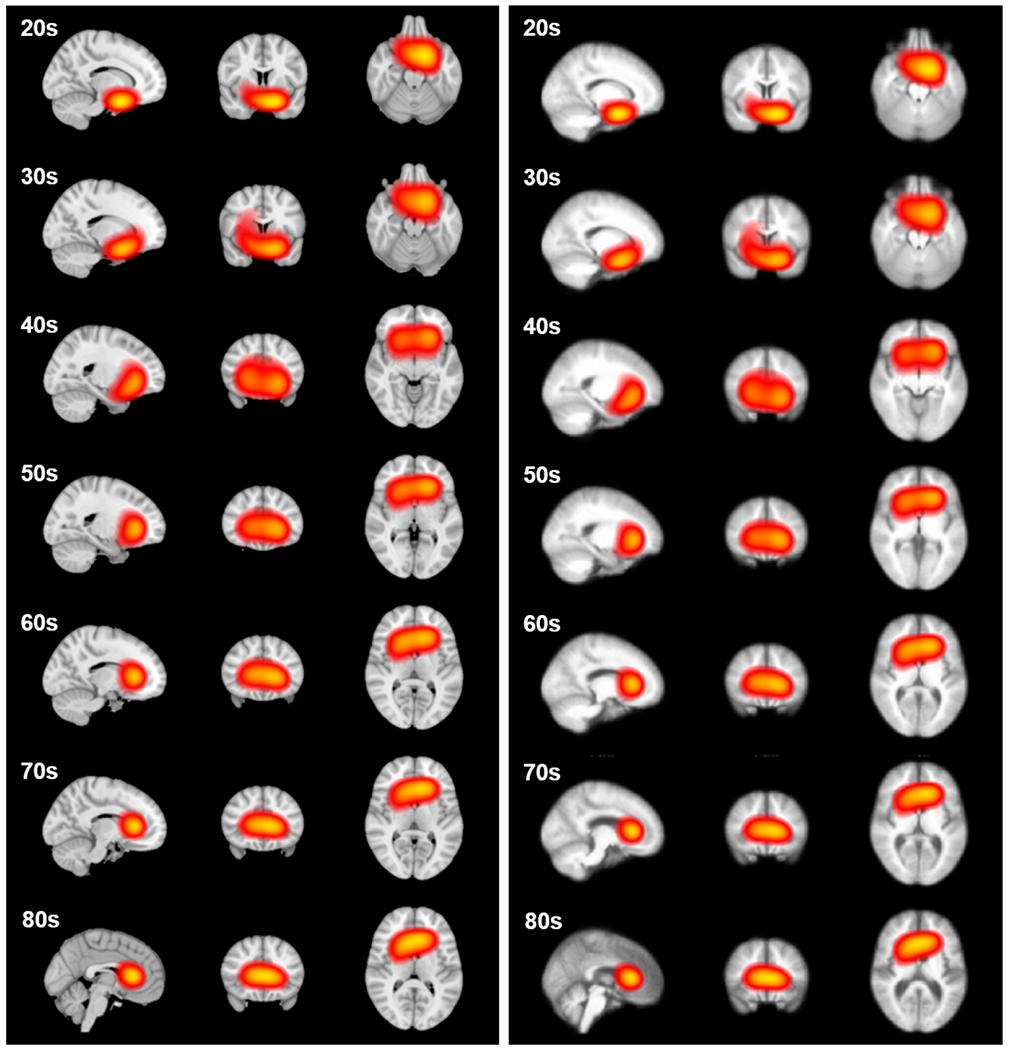
The age activation maps at different age groups overlaid on the (Left) MNI152 template, and (Right) average T1w image within each age group, both with threshold at 0.8. Each slice is identified in the plane to identify the voxel of highest intensity.
3.6. Slice based age estimation
The age estimation performance using 2D MRI slabs sliced at different coordinate planes is shown in Figure 9. The slices with the best performance are also illustrated.
Figure 9:
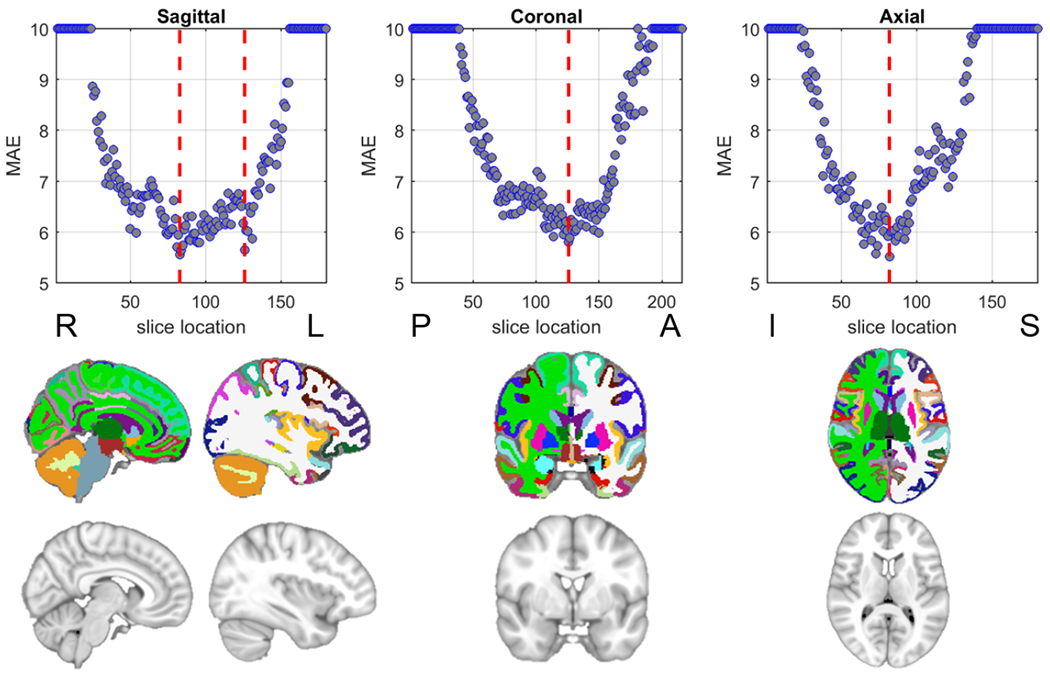
MRI 2D slice based age estimation. (Top row) The mean absolute error (MAE) of the estimated age on the test set using 2D slices at different locations, the red lines indicate the location with lowest MAE. MAEs larger than 10 are capped to 10 for illustration purpose. (Bottom row) The illustration of slices at the red lines in the top row from the MNI152 template and the corresponding segmentation (the colors follow the FreeSurfer color lookup table).
3.7. Lobe based age estimation
The MAE trained using different lobes are shown in Table 4, where we show the best estimation performance achieved through frontal lobe. And temporal lobe achieved marginally lower performance.
Table 4:
Lobe based age estimation
| Lobe | Frontal | Temporal | Parietal | Occipital | Cerebellum | Whole-brain |
|---|---|---|---|---|---|---|
| MAE | 5.33 | 5.81 | 6.37 | 7.66 | 6.20 | 4.06 |
4. Discussion
In this study, a large heterogeneous dataset of structural neuroimaging across the adult lifespan was aggregated from multiple publicly available data sources. A deep convolutional neural network was developed, trained and applied to predict the chronological age from the subject’s scan.
This uniformly distributed dataset is able to achieve estimation without appreciable bias towards a certain age group, while maintaining training efficiency compared with training on an nonuniform dataset. While this study aims to examine the aging process across the adult life-span, other studies aiming to examine the role of aging in other conditions would likely benefit from other specific training dataset inclusion criteria. For example, for studies of autism and prodromal psychosis where age of onset skews younger, studies would require the inclusion of participants below 18, and participants in middle and old age would likely be less informative.
The regionality analysis in this study reveals patterns of neuroanatomical contributions of normal aging. All analyses provide evidence for the prominence of frontal regions in all epochs of age estimation in the adult lifespan. Frontal regions have been implicated in normal aging through both neuropsychological studies and neuroimaging studies [47, 48, 49]. In addition, the pattern shifts reflected in the age activation map based analysis imply a frontal lobe-focused locus of age-related structural changes. We found a negative correlation between several frontal lobe stucture’s cortical thickness measures and difference in age. This may be due to gray and white matter having differing contributions to the age-prediction model.
Neuropsychological evaluations targeting different cognitive domains and brain regions might help reveal the underlying complexity in the aging-process. Although these saliency maps are not well understood, it may be possible they reflect patterns of intensity changes driven by either shrinkage or expansion of ventricles, or differences in the boundary of gray or white matter. More studies are needed to explain and understand these contributions.
Our analysis revealed the association between the divergence of estimated age from chronological age and BFRT performance. BFRT scores are strongly correlated to actual age, in that performance decreases with increased age. While deviations in estimated age versus BFRT reflect two processes that may independently deviate through different mechanisms from a subject’s age, it is useful to have a secondary independent measurement available upon which to compare chronological age. Deviations in BFRT and the difference in estimated age might reflect data points to study to improve the accuracy of the model, or provide insight into why young appearing brains perform worse, or older appearing brains perform better than expected. This suggests the potential utility of the estimated age at normal aging evaluation, in complement to other cognitive test and neuroimaging based measures. The utility relates to an open question of the aging process. It still requires further validation how a scan’s predicted deviance would reveal an individual’s brain health status or even trigger clinical evaluations, since while inter-subject differences in normal aging process exist, they are not well understood. Moreover, it is unclear whether this inherent variability increases with age or stays constant throughout the life-span.
One consideration is that the set of participants with no current pathological symptoms might have disease at asymptomatic prodromal state that have yet to manifest in the clinical evaluation, such as pre-clinical AD. Such work would require follow-up data to preclude disease for a given period of time such that they remain stable as controls. Otherwise, one would be unable to determine the difference between prodromal Alzheimer’s disease and MCI. However, this was not available for all participants, and in a group of otherwise healthy individuals, it is likely that some healthy individuals do harbor occult disease. Additionally, participants were considered normal using criteria germane to the disease of focus in different studies.
Another consideration in uniform sampling is the tails, specifically the youngest and oldest group. For this study to focus on adult age prediction, there are practical limitations including the reduced imaging data available for very old individuals and that this study doesn’t include individuals under 18 years of age. Future studies should examine on stratification procedures keeping in mind the difficulty of obtaining indivdual scans and adolescent development.
One consideration is the leave-N-out validation scheme, in lieu of a cross-validation. Although computationally much more taxing, future studies using it may help explain variance in age estimation differences. While ideally one would want to include both methods, for large imaging studies it is important to consider when developing and evaluating a large-scale neuroimaging model.
We do not report that this model achieve the most superior age-prediction results using a deep learning or similar framework using T1-weighted structural images compared to existing studies, but that it in fact examines the contribution of age distribution in a training set. This is understudied in age-prediction when using large data-sets because there is limited diversity to the images chosen. In addition, there is added diversity of the studies from which the model was trained, and the protocols and acquisitions may vary across both site and study. This in fact benefits this model compared to individual studies of unified aging because the variance of acquisition differences are included in the training, compared to training data where a more cohesive protocol is used, alongside uniform age separation. Such inclusion without appreciable loss of accuracy supports the use of this type of model on a wider variety of baseline scans.
5. Conclusion
This study has demonstrated the high accuracy of an age estimation framework using routine structural neuroimaging and a deep convolutional neural network, trained on a large-scale healthy population with uniform age distribution across adult age span. While there is considerable interest and value in a highly accurate estimation model that can be applied to a wide variety of structural MRI protocols, this study also demonstrates patterns of the regional contributions of aging across the lifespan using multiple methods, agnostic of tissue classes, structure delineation or surface parcellation. This study provides a framework that may have value in evaluating meaningful quantitative and visual biomarkers for both aging and broad neuroimaging applications. Further studies may examine the estimated age and the regional contributions to see if they may be useful in understanding one’s age divergence in the context of a particular disease or condition’s pathology.
Supplementary Material
8. Acknowledgment
Data were provided in part by IXI, accessed from http://brain-development.org/ixi-dataset.
Data were provided in part by OASIS. OASIS Cross-Sectional: Principal Investigators: D. Marcus, R, Buckner, J, Csernansky J. Morris; P50 AG05681, P01 AG03991, P01 AG026276, R01 AG021910, P20 MH071616, U24 RR021382 OASIS: Longitudinal: Principal Investigators: D. Marcus, R, Buckner, J. Csernansky, J. Morris; P50 AG05681, P01 AG03991, P01 AG026276, R01 AG021910, P20 MH071616, U24 RR021382.
Data were provided in part by the Brain Genomics Superstruct Project of Harvard University and the Massachusetts General Hospital, (Principal Investigators: Randy Buckner, Joshua Roffman, and Jordan Smoller), with support from the Center for Brain Science Neuroinformatics Research Group, the Athinoula A. Martinos Center for Biomedical Imaging, and the Center for Human Genetic Research. 20 individual investigators at Harvard and MGH generously contributed data to the overall project.
Data used in preparation of this article were obtained from the Alzheimer’s Disease Neuroimaging Initiative (ADNI) database (adni.loni.usc.edu). As such, the investigators within the ADNI contributed to the design and implementation of ADNI and/or provided data but did not participate in analysis or writing of this report. A complete listing of ADNI investigators can be found at: http://adni.loni.usc.edu/wp-content/uploads/how_to_apply/ADNI_Acknowledgement_List.pdf
Data collection and sharing for this project was funded by the Alzheimer’s Disease Neuroimaging Initiative (ADNI) (National Institutes of Health Grant U01 AG024904) and DOD ADNI (Department of Defense award number W81XWH-12-2-0012). ADNI is funded by the National Institute on Aging, the National Institute of Biomedical Imaging and Bioengineering, and through generous contributions from the following: AbbVie, Alzheimer’s Association; Alzheimer’s Drug Discovery Foundation; Araclon Biotech; BioClinica, Inc.; Biogen; Bristol-Myers Squibb Company; CereSpir, Inc.; Cogstate; Eisai Inc.; Elan Pharmaceuticals, Inc.; Eli Lilly and Company; EuroImmun; F. Hoffmann-La Roche Ltd and its affiliated company Genentech, Inc.; Fujirebio; GE Healthcare; IXICO Ltd.; Janssen Alzheimer Immunotherapy Research & Development, LLC.; Johnson & Johnson Pharmaceutical Research & Development LLC.; Lumosity; Lundbeck; Merck & Co., Inc.; Meso Scale Diagnostics, LLC.; NeuroRx Research; Neurotrack Technologies; Novartis Pharmaceuticals Corporation; Pfizer Inc.; Piramal Imaging; Servier; Takeda Pharmaceutical Company; and Transition Therapeutics. The Canadian Institutes of Health Research is providing funds to support ADNI clinical sites in Canada. Private sector contributions are facilitated by the Foundation for the National Institutes of Health (www.fnih.org). The grantee organization is the Northern California Institute for Research and Education, and the study is coordinated by the Alzheimer’s Therapeutic Research Institute at the University of Southern California. ADNI data are disseminated by the Laboratory for Neuro Imaging at the University of Southern California.
Data used in the preparation of this article was obtained from the Australian Imaging Biomarkers and Lifestyle flagship study of ageing (AIBL) funded by the Commonwealth Scientific and Industrial Research Organisation (CSIRO) which was made available at the ADNI database (www.loni.usc.edu/ADNI). The AIBL researchers contributed data but did not participate in analysis or writing of this report. AIBL researchers are listed at www.aibl.csiro.au.
Data used in preparation of this article were obtained from the Frontotemporal Lobar Degeneration Neuroimaging Initiative (FTLDNI) database (http://4rtniftldni.ini.usc.edu). The investigators at NIFD/FTLDNI contributed to the design and implementation of FTLDNI and/or provided data, but did not participate in analysis or writing of this report (unless otherwise listed).
Data collection and sharing for this project was funded by the Frontotemporal Lobar Degeneration Neuroimaging Initiative (National Institutes of Health Grant R01 AG032306). The study is coordinated through the University of California, San Francisco, Memory and Aging Center. FTLDNI data are disseminated by the Laboratory for Neuro Imaging at the University of Southern California.
Data used in the preparation of this article were obtained from the Parkinson’s Progression Markers Initiative (PPMI) database (www.ppmi-info.org/data). For up-to-date information on the study, visit www.ppmi-info.org. PPMI - a public-private partnership - is funded by the Michael J. Fox Foundation for Parkinson’s Research and funding partners, the full names of all of the PPMI funding partners can found at www.ppmi-info.org/fundingpartners.
Data collection and sharing for this project was provided by the Cambridge Centre for Ageing and Neuroscience (Cam-CAN). CamCAN funding was provided by the UK Biotechnology and Biological Sciences Research Council (grant number BB/H008217/1), together with support from the UK Medical Research Council and University of Cambridge, UK.
Data used in preparation of this article were obtained from the SchizConnect database (http://schizconnect.org) As such, the investigators within SchizConnect contributed to the design and implementation of SchizConnect and/or provided data but did not participate in analysis or writing of this report.
Data collection and sharing for this project was funded by NIMH cooperative agreement 1U01MH097435.
Footnotes
Data used in preparation of this article were partially obtained from the Alzheimer’s Disease Neuroimaging Initiative (ADNI) database (adni.loni.usc.edu). As such, the investigators within the ADNI contributed to the design and implementation of ADNI and/or provided data but did not participate in analysis or writing of this report. A complete listing of ADNI investigators can be found at: http://adni.loni.usc.edu/wp-content/uploads/how_to_apply/ADNI_Acknowledgement_List.pdf
Data used in the preparation of this article were partially obtained from the Australian Imaging Biomarkers and Lifestyle flagship study of ageing (AIBL) funded by the Commonwealth Scientific and Industrial Research Organisation (CSIRO) which was made available at the ADNI database (www.loni.usc.edu/ADNI). The AIBL researchers contributed data but did not participate in analysis or writing of this report. AIBL researchers are listed at www.aibl.csiro.au.
Data used in preparation of this article were partially obtained from the Frontotemporal Lobar Degeneration Neuroimaging Initiative (FTLDNI) database (http://4rtniftldni.ini.usc.edu). The investigators at NIFD/FTLDNI contributed to the design and implementation of FTLDNI and/or provided data, but did not participate in analysis or writing of this report.
Disclosures
FAP is a consultant for and has equity in Imij Technologies. SAS has equity in Imij technologies and is on the scientific advisory board of Meira GTX. ZCL consults part-time for Amazon. XF, FAP and SAS have a patent application filed through Columbia University related to neuroimaging methods. JY has nothing to disclose.
Code Availability
All code available upon reasonable request.
References
- [1].Huang T, Chen H, Fujimoto R, Ito K, Wu K, Sato K, Taki Y, Fukuda H, Aoki T, Age estimation from brain mri images using deep learning, in: 2017 IEEE 14th International Symposium on Biomedical Imaging (ISBI 2017), 2017, pp. 849–852. doi: 10.1109/ISBI.2017.7950650. [DOI] [Google Scholar]
- [2].Sturmfels P, Rutherford S, Angstadt M, Peterson M, Sripada CS, Wiens J, A domain guided CNN architecture for predicting age from structural brain images, CoRR abs/1808.04362. arXiv:1808.04362. URL http://arxiv.org/abs/1808.04362 [Google Scholar]
- [3].Bermudez C, Plassard AJ, Chaganti S, Huo Y, Aboud KS, Cutting LE, Resnick SM, Landman BA, Anatomical context improves deep learning on the brain age estimation task, Magnetic Resonance Imaging 62 (2019) 70–77. doi: 10.1016/j.mri.2019.06.018. URL https://doi.Org/10.1016/j.mri.2019.06.018 [DOI] [PMC free article] [PubMed] [Google Scholar]
- [4].Cole JH, Marioni RE, Harris SE, Deary IJ, Brain age and other bodily ‘ages’: implications for neuropsychiatry, Molecular Psychiatry 24 (2) (2018) 266–281. doi: 10.1038/s41380-018-0098-1. URL 10.1038/s41380-018-0098-1 [DOI] [PMC free article] [PubMed] [Google Scholar]
- [5].Chung Y, Addington J, Bearden CE, Cadenhead K, Cornblatt B, Mathalon DH, McGlashan T, Perkins D, Seidman LJ, Tsuang M, Walker E, Woods SW, McEwen S, van Erp TGM, and C. TD, Use of machine learning to determine deviance in neuroanatomical maturity associated with future psychosis in youths at clinically high risk, JAMA Psychiatry 75 (9) (2018) 960. doi: 10.1001/jamapsychiatry.2018.1543. URL 10.1001/jamapsychiatry.2018.1543 [DOI] [PMC free article] [PubMed] [Google Scholar]
- [6].Kaufmann T, van der Meer D, Doan NT, Schwarz E, Lund MJ, Agartz I, Alnæs D, Barch DM, Baur-Streubel R, Bertolino A, Bettella F, Beyer MK, Bøen E, Borgwardt S, Brandt CL, Buitelaar J, Celius EG, Cervenka S, Conzelmann A, Córdova-Palomera A, Dale AM, de Quervain DJF, Carlo P, Djurovic S, Dørum ES, Eisenacher S, Elvsåshagen T, Espeseth T, Fatouros-Bergman H, Flyckt L, Franke B, Frei O, Haatveit B, Håberg AK, Harbo HF, Hartman CA, Heslenfeld D, Hoekstra PJ, Høgestøl EA, Jernigan TL, Jonassen R, Jönsson EG, Kirsch P, Kłoszewska I, Kolskår KK, Landrø NI, Hellard S, Lesch K-P, Lovestone S, Lundervold A, Lundervold AJ, Maglanoc LA, Malt UF, Mecocci P, Melle I, Meyer-Lindenberg A, Moberget T, Norbom LB, Nordvik JE, Nyberg L, Oosterlaan J, Papalino M, Papassotiropoulos A, Pauli P, Pergola G, Persson K, Richard G, Rokicki J, Sanders A-M, Selbæk G, Shadrin AA, Smeland OB, Soininen H, Sowa P, Steen VM, Tsolaki M, Ulrichsen KM, Vellas B, Wang L, Westman E, Ziegler GC, Zink M, Andreassen OA, Westlye LT, Common brain disorders are associated with heritable patterns of apparent aging of the brain, Nature Neuro-science 22 (10) (2019) 1617–1623. doi: 10.1038/s41593-019-0471-7. URL 10.1038/s41593-019-0471-7 [DOI] [PMC free article] [PubMed] [Google Scholar]
- [7].Steffener J, Habeck C, O’Shea D, Razlighi Q, Bherer L, Stern Y, Differences between chronological and brain age are related to education and self-reported physical activity, Neurobiology of Aging 40 (2016) 138–144. doi: 10.1016/j.neurobiolaging.2016.01.014. [DOI] [PMC free article] [PubMed] [Google Scholar]
- [8].Gaser C, Franke K, Klöppel S, Koutsouleris N, Sauer H, Alzheimer’s Disease Neuroimaging I, BrainAGE in mild cognitive impaired patients: Predicting the conversion to Alzheimer’s disease, PLOS ONE 8 (6) (2013) e67346. doi: 10.1371/journal.pone.0067346. [DOI] [PMC free article] [PubMed] [Google Scholar]
- [9].Schnack HG, van Haren NE, Nieuwenhuis M, Pol HEH, Cahn W, Kahn RS, Accelerated brain aging in schizophrenia: A longitudinal pattern recognition study, American Journal of Psychiatry 173 (6) (2016) 607–616. doi: 10.1176/appi.ajp.2015.15070922. [DOI] [PubMed] [Google Scholar]
- [10].Cole JH, Leech R, Sharp DJ, I. for the Alzheimer’s Disease Neuroimaging, Prediction of brain age suggests accelerated atrophy after traumatic brain injury, Annals of Neurology 77 (4) (2015) 571–581. doi: 10.1002/ana.24367. [DOI] [PMC free article] [PubMed] [Google Scholar]
- [11].Al Zoubi O, Ki Wong C, Kuplicki RT, Yeh H.-w., Mayeli A, Re-fai H, Paulus M, Bodurka J, Predicting age from brain EEG signals—a machine learning approach, Frontiers in Aging Neuroscience 10 (184). doi: 10.3389/fnagi.2018.00184. [DOI] [PMC free article] [PubMed] [Google Scholar]
- [12].Mwangi B, Hasan KM, Soares JC, Prediction of individual subject’s age across the human lifespan using diffusion tensor imaging: A machine learning approach, NeuroImage 75 (0) (2013) 58–67. doi: 10.1016/j.neuroimage.2013.02.055. [DOI] [PubMed] [Google Scholar]
- [13].Li H, Satterthwaite TD, Fan Y, Brain age prediction based on resting-state functional connectivity patterns using convolutional neural networks, in: International Symposium on Biomedical Imaging (ISBI), 2018, pp. 101–104. doi: 10.1109/ISBI.2018.8363532. [DOI] [PMC free article] [PubMed] [Google Scholar]
- [14].Walhovd KB, Westlye LT, Amlien I, Espeseth T, Reinvang I, Raz N, Agartz I, Salat DH, Greve DN, Fischl B, Dale AM, Fjell AM, Consistent neuroanatomical age-related volume differences across multiple samples, Neurobiology of Aging 32 (5) (2011) 916–932. doi: 10.1016/j.neurobiolaging.2009.05.013. [DOI] [PMC free article] [PubMed] [Google Scholar]
- [15].Valizadeh S, Hänggi J, Mérillat S, Jäncke L, Age prediction on the basis of brain anatomical measures, Human Brain Mapping (2016) 997–1008 doi: 10.1002/hbm.23434. [DOI] [PMC free article] [PubMed] [Google Scholar]
- [16].Cole JH, Poudel RPK, Tsagkrasoulis D, Caan MWA, Steves C, Spector TD, Montana G, Predicting brain age with deep learning from raw imaging data results in a reliable and heritable biomarker, NeuroImage doi: 10.1016/j.neuroimage.2017.07.059. [DOI] [PubMed] [Google Scholar]
- [17].Ashburner J, A fast diffeomorphic image registration algorithm, NeuroImage 38 (1) (2007) 95–113. doi: 10.1016/j.neuroimage.2007.07.007. [DOI] [PubMed] [Google Scholar]
- [18].Franke K, Ziegler G, Klöppel S, Gaser C, Estimating the age of healthy subjects from T1-weighted MRI scans using kernel methods: Exploring the influence of various parameters, NeuroImage 50 (3) (2010) 883–892. doi: 10.1016/j.neuroimage.2010.01.005. [DOI] [PubMed] [Google Scholar]
- [19].Lancaster J, Lorenz R, Leech R, Cole JH, Bayesian optimization for neuroimaging pre-processing in brain age classification and prediction, Frontiers in Aging Neuroscience 10 (28). doi: 10.3389/fnagi.2018.00028. [DOI] [PMC free article] [PubMed] [Google Scholar]
- [20].Gutierrez Becker B, Klein T, Wachinger C, Gaussian process uncertainty in age estimation as a measure of brain abnormality, NeuroImage 175 (2018) 246–258. doi: 10.1016/j.neuroimage.2018.03.075. [DOI] [PubMed] [Google Scholar]
- [21].Konukoglu E, Glocker B, Zikic D, Criminisi A, Neighbourhood approximation using randomized forests, Medical Image Analysis 17 (7) (2013) 790–804. doi: 10.1016/j.media.2013.04.013. [DOI] [PubMed] [Google Scholar]
- [22].Wang B, Pham TD, MRI-based age prediction using hidden Markov models, Journal of Neuroscience Methods 199 (1) (2011) 140–145. doi: 10.1016/j.jneumeth.2011.04.022. [DOI] [PubMed] [Google Scholar]
- [23].Varikuti DP, Genon S, Sotiras A, Schwender H, Hoffstaedter F, Patil KR, Jockwitz C, Caspers S, Moebus S, Amunts K, Davatzikos C, Eickhoff SB, Evaluation of non-negative matrix factorization of grey matter in age prediction, NeuroImage 173 (2018) 394–410. doi: 10.1016/j.neuroimage.2018.03.007. [DOI] [PMC free article] [PubMed] [Google Scholar]
- [24].Taylor JR, Williams N, Cusack R, Auer T, Shafto MA, Dixon M, Tyler LK, Cam CAN, Henson RN, The Cambridge Centre for Ageing and Neuroscience (Cam-CAN) data repository: Structural and functional MRI, MEG, and cognitive data from a cross-sectional adult lifespan sample, NeuroImage 144 (2017) 262–269. doi: 10.1016/j.neuroimage.2015.09.018. [DOI] [PMC free article] [PubMed] [Google Scholar]
- [25].Wei D, Zhuang K, Chen Q, Yang W, Liu W, Wang K, Sun J, Qiu J, Structural and functional MRI from a cross-sectional southwest university adult lifespan dataset (SALD), bioRxiv (2018) 177279 doi: 10.1101/177279. [DOI] [PMC free article] [PubMed] [Google Scholar]
- [26].Rodrigue K, Kennedy K, Devous M, Rieck J, Hebrank A, Diaz-Arrastia R, Mathews D, Park D, Beta-amyloid burden in healthy aging: regional distribution and cognitive consequences, Neurology 78 (6) (2012) 387–395. doi: 10.1212/WNL.0b013e318245d295. [DOI] [PMC free article] [PubMed] [Google Scholar]
- [27].Marcus DS, Wang TH, Parker J, Csernansky JG, Morris JC, Buckner RL, Open Access Series of Imaging Studies (OASIS): cross-sectional MRI data in young, middle aged, nondemented, and demented older adults, Journal of cognitive neuroscience 19 (9) (2007) 1498–1507. doi: 10.1162/jocn.2007.19.9.1498. [DOI] [PubMed] [Google Scholar]
- [28].Zuo X-N, Anderson JS, Bellec P, Birn RM, Biswal BB, Blautzik J, Breitner JC, Buckner RL, Calhoun VD, Castellanos FX, An open science resource for establishing reliability and reproducibility in functional connectomics, Scientific data 1 (2014) 140049. doi: 10.1038/sdata.2014.49. [DOI] [PMC free article] [PubMed] [Google Scholar]
- [29].Wang L, Alpert KI, Calhoun VD, Cobia DJ, Keator DB, King MD, Kogan A, Landis D, Tallis M, Turner MD, Potkin SG, Turner JA, Ambite JL, SchizConnect: Mediating neuroimaging databases on schizophrenia and related disorders for large-scale integration, NeuroImage 124 (Pt B) (2016) 1155–67. doi: 10.1016/j.neuroimage.2015.06.065. [DOI] [PMC free article] [PubMed] [Google Scholar]
- [30].Ellis KA, Bush AI, Darby D, De Fazio D, Foster J, Hudson P, Lautenschlager NT, Lenzo N, Martins RN, Maruff P, Masters C, Milner A, Pike K, Rowe C, Savage G, Szoeke C, Taddei K, Villemagne V, Woodward M, Ames D, The Australian Imaging, Biomarkers and Lifestyle (AIBL) study of aging: methodology and baseline characteristics of 1112 individuals recruited for a longitudinal study of Alzheimer’s disease, International Psychogeriatrics 21 (4) (2009) 672–687. doi: 10.1017/S1041610209009405. [DOI] [PubMed] [Google Scholar]
- [31].Marcus DS, Fotenos AF, Csernansky JG, Morris JC, Buckner RL, Open access series of imaging studies: longitudinal MRI data in nondemented and demented older adults, Journal of cognitive neuroscience 22 (12) (2010) 2677–2684. doi: 10.1162/jocn.2009.21407. [DOI] [PMC free article] [PubMed] [Google Scholar]
- [32].Marek K, Jennings D, Lasch S, Siderowf A, Tanner C, Simuni T, Coffey C, Kieburtz K, Flagg E, Chowdhury S, et al. , The Parkinson Progression Marker Initiative (PPMI), Progress in Neurobiology 95 (4) (2011) 629–635. doi: 10.1016/j.pneurobio.2011.09.005. [DOI] [PMC free article] [PubMed] [Google Scholar]
- [33].Holmes AJ, Hollinshead MO, O’Keefe TM, Petrov VI, Fariello GR, Wald LL, Fischl B, Rosen BR, Mair RW, Roffman JL, Smoller JW, Buckner RL, Brain Genomics Superstruct Project initial data release with structural, functional, and behavioral measures, Scientific Data 2 (2015) 150031. doi: 10.1038/sdata.2015.31. [DOI] [PMC free article] [PubMed] [Google Scholar]
- [34].Liu W, Wei D, Chen Q, Yang W, Meng J, Wu G, Bi T, Zhang Q, Zuo X-N, Qiu J, Longitudinal test-retest neuroimaging data from healthy young adults in southwest China, Scientific Data 4 (2017) 170017. doi: 10.1038/sdata.2017.17. [DOI] [PMC free article] [PubMed] [Google Scholar]
- [35].Maclaren J, Han Z, Vos SB, Fischbein N, Bammer R, Reliability of brain volume measurements: A test-retest dataset, Scientific Data 1. doi: 10.1038/sdata.2014.37. [DOI] [PMC free article] [PubMed] [Google Scholar]
- [36].Sled JG, Zijdenbos AP, Evans AC, A nonparametric method for automatic correction of intensity nonuniformity in MRI data, IEEE Transactions on Medical Imaging 17 (1) (1998) 87–97. doi: 10.1109/42.668698. [DOI] [PubMed] [Google Scholar]
- [37].Ségonne F, Dale AM, Busa E, Glessner M, Salat D, Hahn HK, Fischl B, A hybrid approach to the skull stripping problem in MRI, NeuroImage 22 (3) (2004) 1060–1075. doi: 10.1016/j.neuroimage.2004.03.032. [DOI] [PubMed] [Google Scholar]
- [38].Jenkinson M, Bannister P, Brady M, Smith S, Improved optimization for the robust and accurate linear registration and motion correction of brain images, NeuroImage 17 (2) (2002) 825–841. doi: 10.1006/nimg.2002.1132. [DOI] [PubMed] [Google Scholar]
- [39].Feng X, Yang J, Lipton ZC, Small SA, Provenzano FA, Deep learning on MRI affirms the prominence of the hippocampal formation in Alzheimer’s disease classification, bioRxiv (2018) 456277 doi:10.1101/456277. [Google Scholar]
- [40].Simonyan K, Zisserman A, Very deep convolutional networks for large-scale image recognition, in: International Conference on Machine Learning (ICLR), 2015. [Google Scholar]
- [41].Byrd J, Lipton Z, What is the effect of importance weighting in deep learning?, in: International Conference on Machine Learning, 2019, pp. 872–881. [Google Scholar]
- [42].Benton AL, Sivan AB, Hamsher K. d., Varney NR, Spreen O, Contributions to neuropsychological assessment: A clinical manual, Oxford University Press, USA, 1994. [Google Scholar]
- [43].Fischl B, Dale AM, Measuring the thickness of the human cerebral cortex from magnetic resonance images, Proceedings of the National Academy of Sciences 97 (20) (2000) 11050–11055. [DOI] [PMC free article] [PubMed] [Google Scholar]
- [44].Zhou B, Khosla A, Lapedriza A, Oliva A, Torralba A, Learning deep features for discriminative localization, in: IEEE Conference on Computer Vision and Pattern Recognition (CVPR), 2016, pp. 2921–2929. doi:http://doi.computer.org/10.1109/CVPR.2016.319. [Google Scholar]
- [45].Selvaraju RR, Cogswell M, Das A, Vedantam R, Parikh D, Batra D, Grad-CAM: Visual explanations from deep networks via gradient-based localization, in: IEEE International Conference on Computer Vision (ICCV), 2017, pp. 618–626. doi:http://doi.computer.org/10.1109/ICCV.2017.74. [Google Scholar]
- [46].Feng X, Yang J, Laine AF, Angelini ED, Discriminative localization in CNNs for weakly-supervised segmentation of pulmonary nodules, in: International Conference on Medical Image Computing and Computer-Assisted Intervention (MICCAI), Springer International Publishing, 2017, pp. 568–576. doi: 10.1007/978-3-319-66179-7_65. [DOI] [PMC free article] [PubMed] [Google Scholar]
- [47].Gazzaley A, Cooney JW, Rissman J, D’Esposito M, Top-down suppression deficit underlies working memory impairment in normal aging, Nature Neuro-science 8 (2005) 1298. doi: 10.1038/nn1543. [DOI] [PubMed] [Google Scholar]
- [48].Chetelat G, Landeau B, Salmon E, Yakushev I, Bahri MA, Mezenge F, Perrotin A, Bastin C, Manrique A, Scheurich A, Scheckenberger M, Desgranges B, Eustache F, Fellgiebel A, Relationships between brain metabolism decrease in normal aging and changes in structural and functional connectivity, NeuroImage 76 (1) (2013) 167–177. doi: 10.1016/j.neuroimage.2013.03.009. [DOI] [PubMed] [Google Scholar]
- [49].Shamchi SP, Khosravi M, Taghvaei R, Emamzadehfard S, Paydary K, Raynor W, Zadeh MZ, Castro S, Nielsen A, Werner T, Alteration of normal regional brain FDG uptake in normal aging, Journal of Nuclear Medicine 58 (supplement 1) (2017) 483–483. [Google Scholar]
Associated Data
This section collects any data citations, data availability statements, or supplementary materials included in this article.


