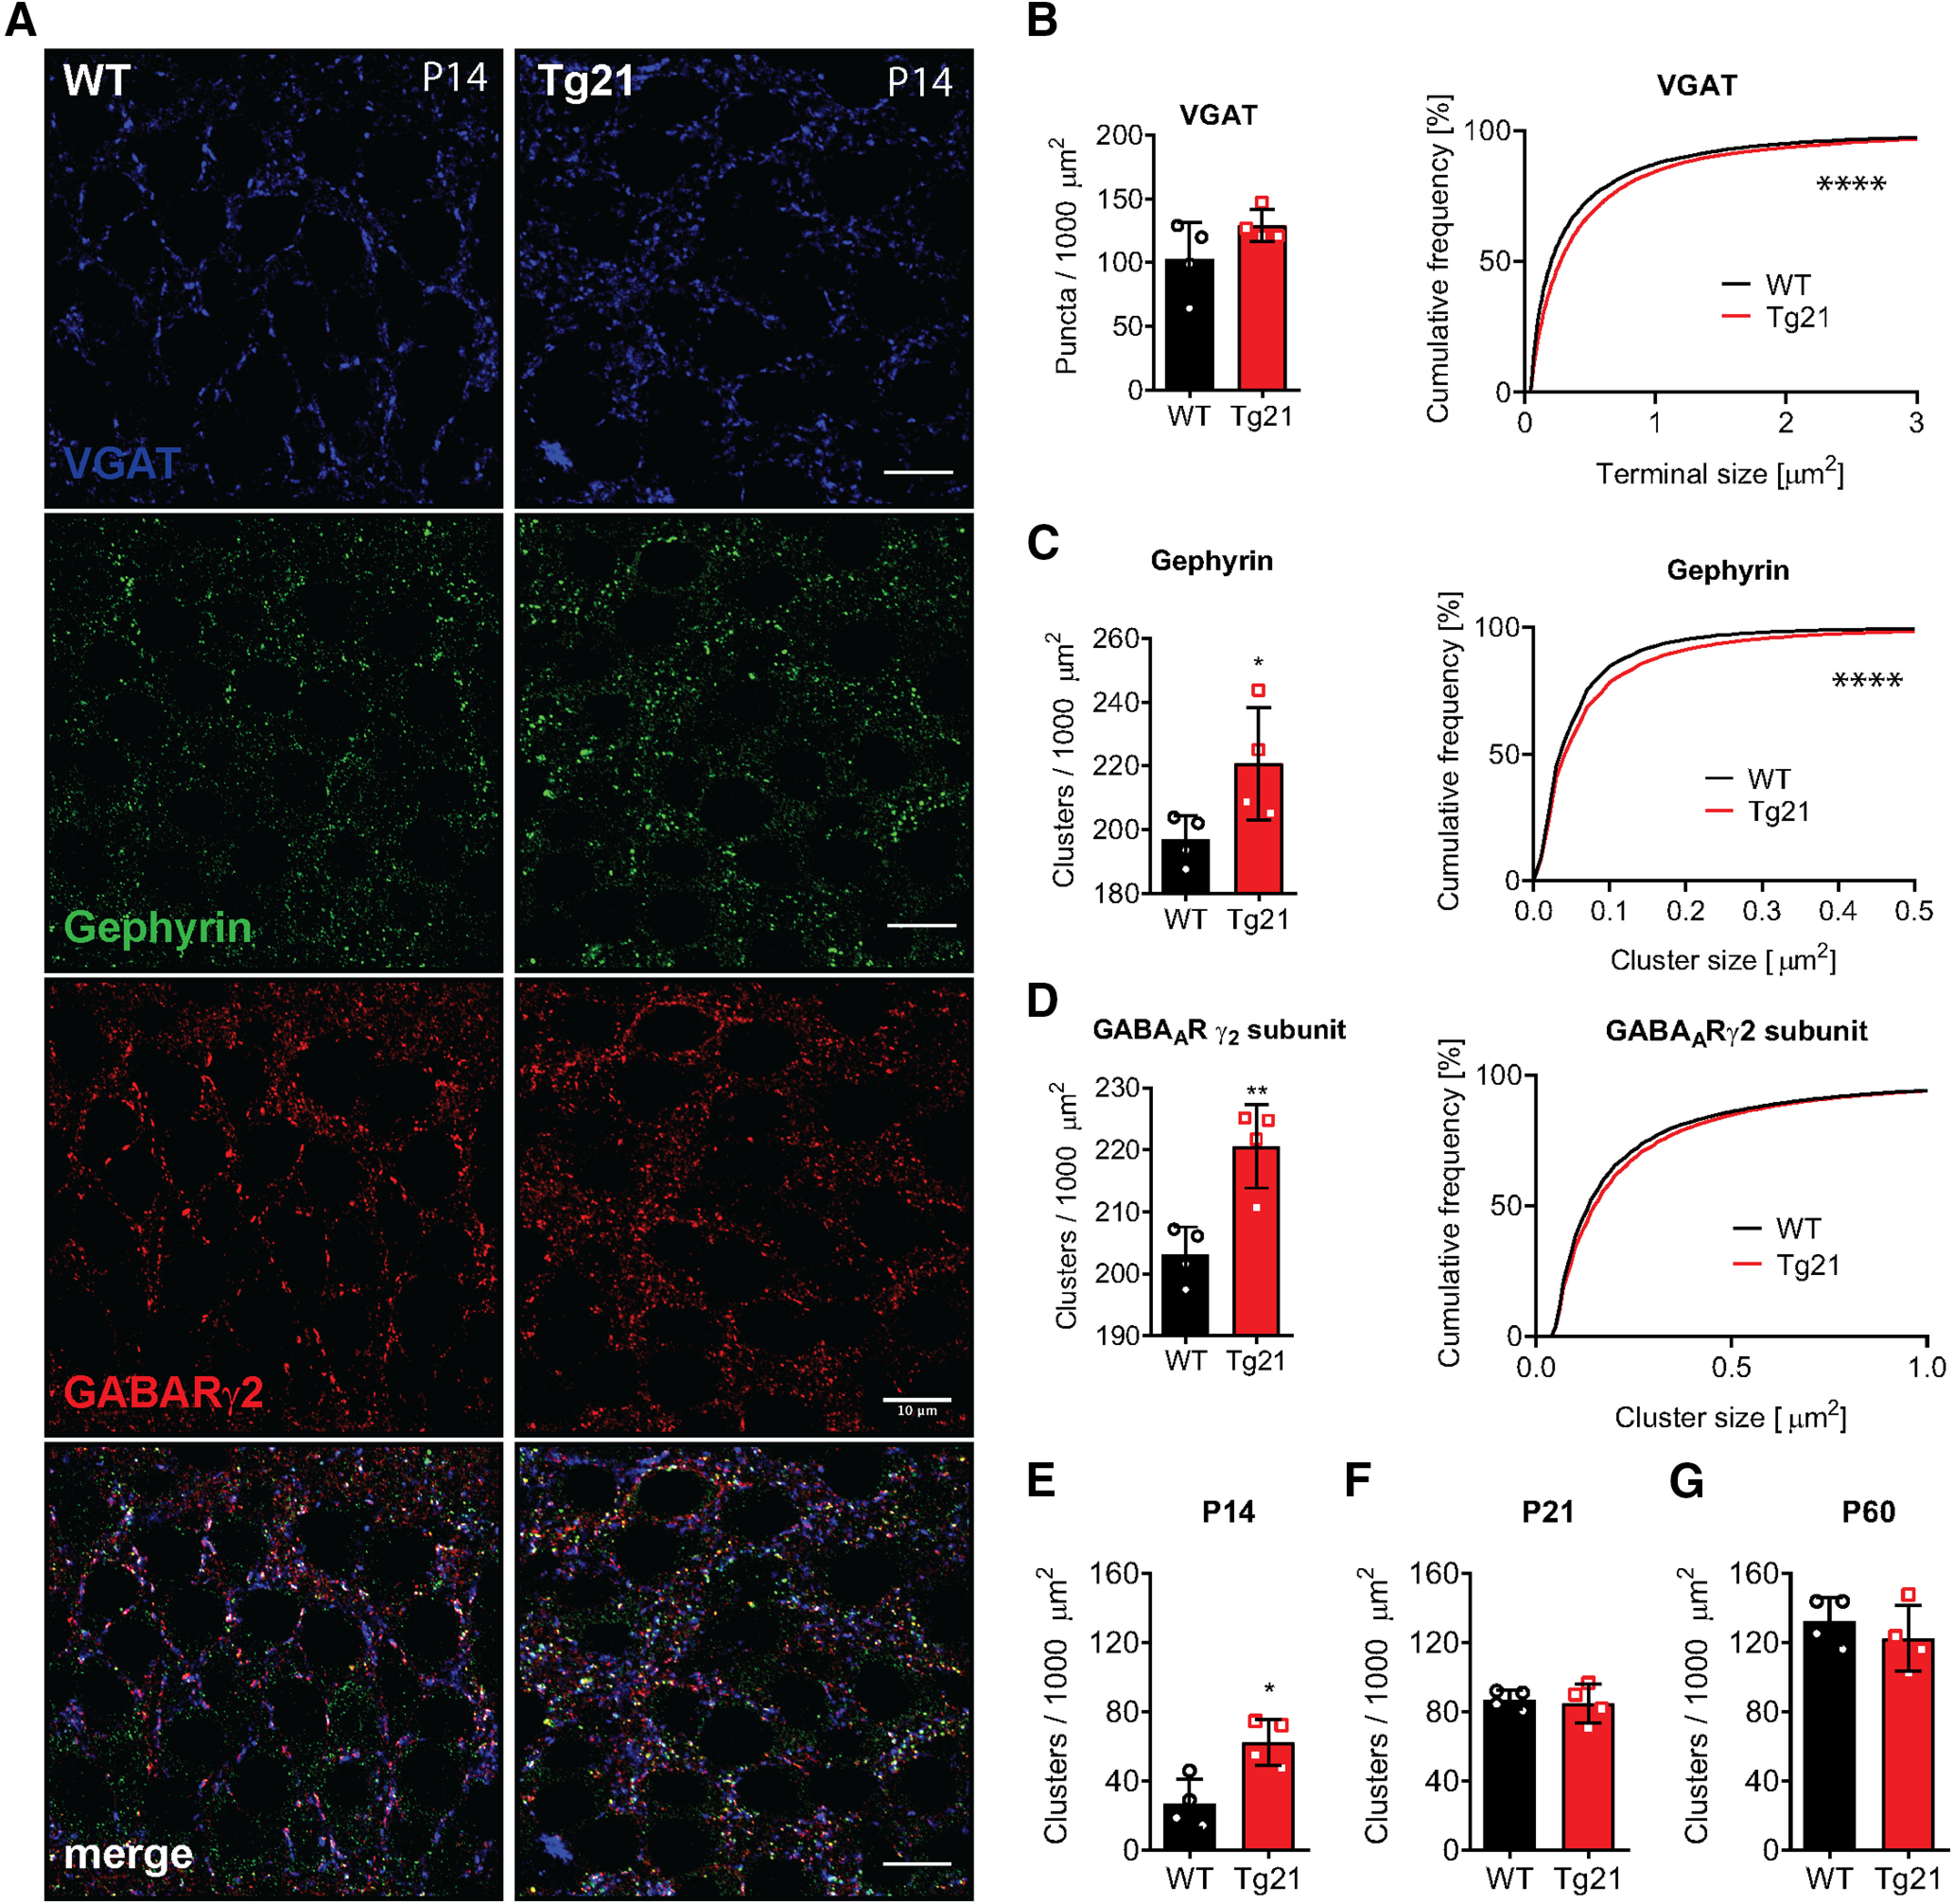
Figure 4.

Increased GABAAR cluster density in CA1 pyramidal cells of Tg21 mice at P14. A, Representative images of immunofluorescence staining against VGAT: vesicular GABA transporter (blue), gephyrin (green), and γ2-GABAAR subunit (red) in WT and Tg21 mice. B, Quantification of presynaptic (VGAT) terminals in WT and Tg21 mice showing increased terminal size (cumulative plot) in Tg21 mice. C, Quantification of postsynaptic clusters of gephyrin showing increased cluster number (bar graph) and size (cumulative plot). D, Quantification of γ2-GABAAR subunits in WT and Tg21 mice showing increased density (bar graph) in Tg21 mice. Density of postsynaptic (triple labeled) clusters in WT and Tg21 mice at P14 (E), P21(F), and P60 (G). Bar graphs show mean ± SD, data points represent individual mice, N = 5 animals per age and genotype, Student’s t test (B–J). Cumulative frequency plots show total number of quantified clusters in WT and Tg21 animals; *p < 0.05, **p < 0.01, ***p < 0.001, ****p < 0.0001. Scale bar: 10 μm.
