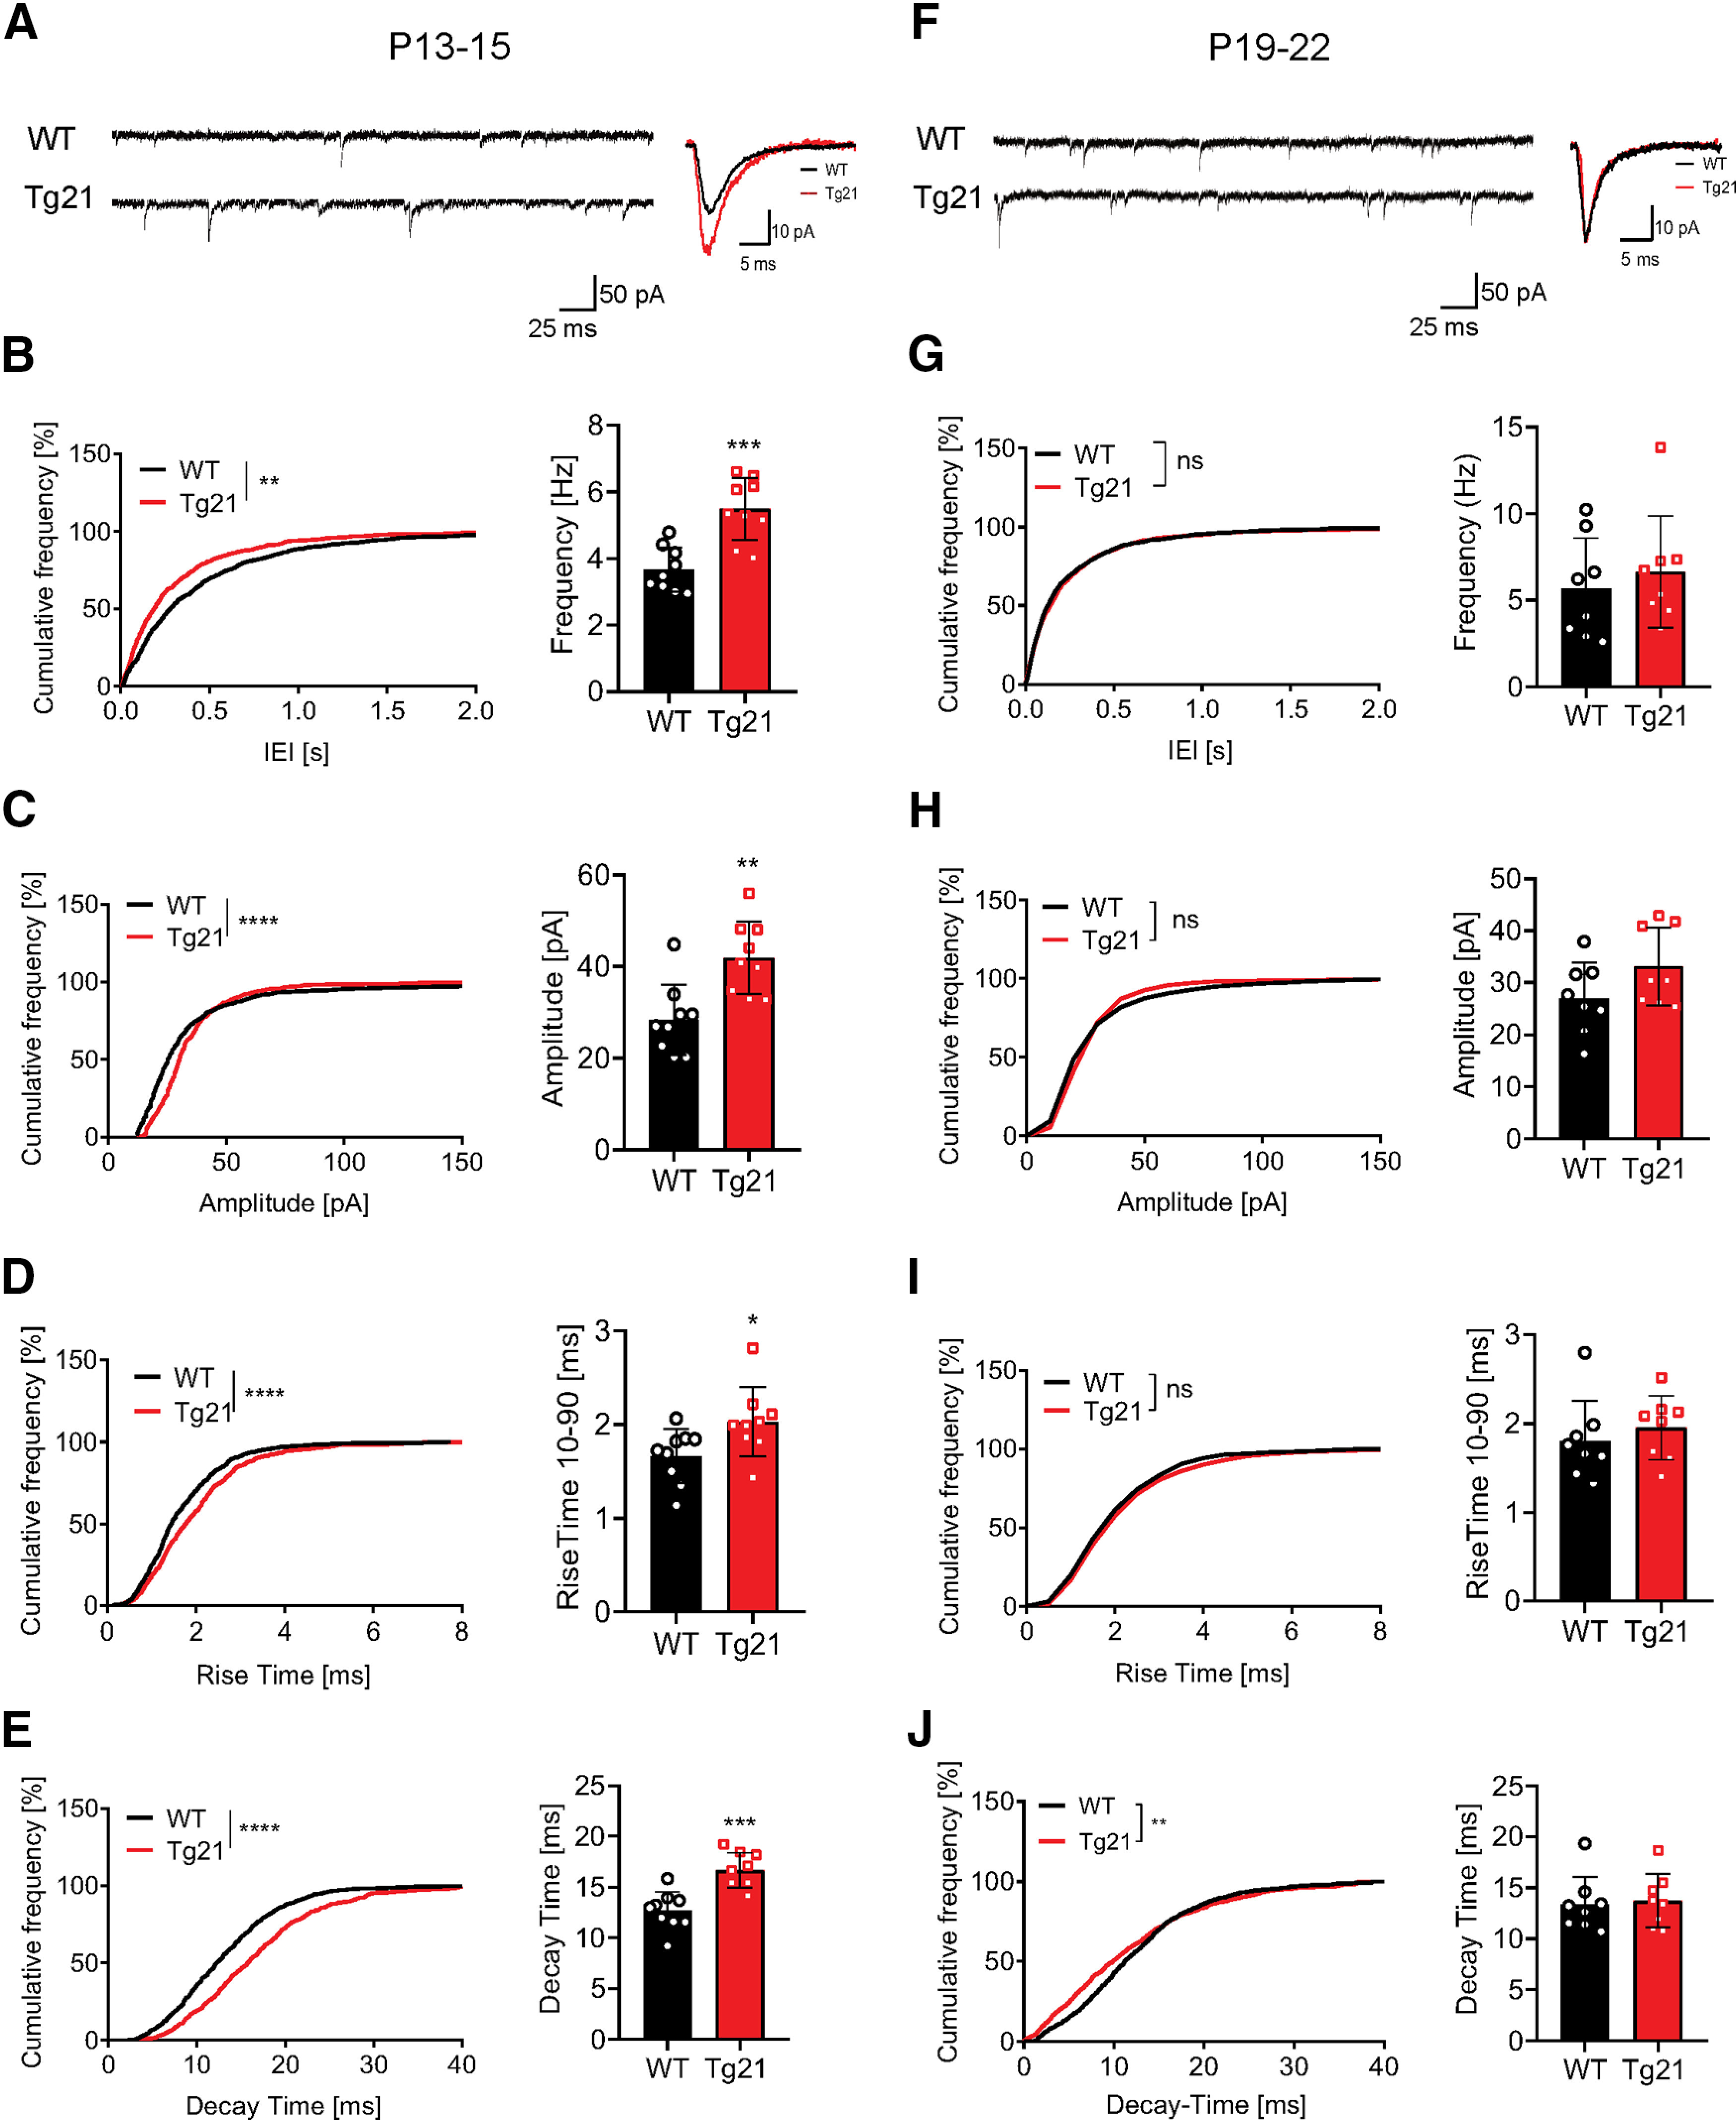
Figure 5.

Enhancement of GABAergic synaptic transmission in CA1 area of Tg21 mice at P13–P15. A, Representative raw and averaged mean traces of the mIPSCs in WT and Tg21 mice at P13–P15. B–E, Cumulative frequency distribution plots and data points graphs at P13–P15 of (B) IEIs and frequency, (C) amplitude, (D) rise-time constant, and (E) decay-time constant of the mIPSCs from WT (black bars) and Tg21 (red bars). An increase in frequency, amplitude, rise time, and decay time is observed in Tg21mice at P13–P15. F, Representative raw and averaged mean traces of the mIPSCs for WT and Tg21 mice at P19–P22. G–J, Cumulative frequency distribution plots at P19–P22 of (G) IEIs and frequency, (H) amplitude, (I) rise-time constant, and (J) decay-time constant. No differences are observed in Tg21 mice at P19–P22. Graphs show mean ± SD, data points represent individual mice, N = 9 animals per genotype (P13–P15) and N = 8 animals (P19–P22), Student’s t test. Cumulative frequency plots show total number of events in WT and Tg21 animals, KS tests; *p < 0.05, **p < 0.01, ***p < 0.001, ****p < 0.0001.
