

Abstract
With the intensifying global efforts to eradicate wild polioviruses, policymakers face complex decisions related to achieving eradication and managing post-eradication risks. These decisions and the expanding use of inactivated poliovirus vaccine (IPV) trigger renewed interest in poliovirus immunity, particularly the role of mucosal immunity in the transmission of polioviruses. Sustained high population immunity to poliovirus transmission represents a key prerequisite to eradication, but poliovirus immunity and transmission remain poorly understood despite decades of studies. In April 2010, the US Centers for Disease Control and Prevention convened an international group of experts on poliovirus immunology and virology to review the literature relevant for modeling poliovirus transmission, develop a consensus about related uncertainties, and identify research needs. This paper synthesizes the quantitative assessments and research needs identified during the process. Limitations in the evidence from OPV challenge studies and other relevant data led to differences in expert assessments, indicating the need for additional data, particularly in several priority areas for research: 1) the ability of IPV-induced immunity to prevent or reduce excretion and affect transmission, 2) the impact of waning immunity on the probability and extent of poliovirus excretion, 3) the relationship between the concentration of poliovirus excreted and infectiousness to others in different settings, and 4) the relative role of fecal-oral versus oropharyngeal transmission. This assessment of current knowledge supports the immediate conduct of additional studies to address the gaps.
Keywords: polio eradication, expert judgment, dynamic modeling
INTRODUCTION
In June 2010, the Global Polio Eradication Initiative launched an aggressive strategic plan to complete the global eradication of wild polioviruses (WPVs) within the next few years(1) and to subsequently stop routine use of oral poliovirus vaccine (OPV).(2-4) Achieving the goals of the strategy still involves many choices related to managing the risks of sustained transmission in the few remaining countries yet to interrupt indigenous transmission of WPV types 1 and 3 (WPV1 and WPV3) and of importations establishing transmission in previously polio-free areas.(5) Notably, national and global health leaders face important choices related to optimizing vaccines for routine immunization and/or supplementary immunization activities (SIAs) using monovalent, bivalent, and trivalent OPV (mOPV, bOPV, and tOPV) and/or inactivated poliovirus vaccine (IPV) standalone or combination products.(5) After eradication, eventually eliminating cases of vaccine associated paralytic polio (VAPP) and the risk of circulating vaccine-derived poliovirus (cVDPV) outbreaks will require OPV cessation,(3, 4, 6) but important choices remain with respect to the intensity of OPV use until OPV cessation and the timing of OPV cessation. After OPV cessation, numerous decision options(7) exist related to the management of risks for outbreaks of live polioviruses from potential undetected circulation of WPVs,(8, 9) persistent circulation of VDPVs, reintroductions from a very small number of immunodeficient patients who might excrete VDPVs for many years, and/or unintentional or intentional release.(10) Significant uncertainties remain with respect to cVDPV risks associated with the use of OPV to respond to outbreaks, and the effectiveness of IPV for outbreak response activities, particularly in the future with declining population exposure to live polioviruses. Given the limited experience with IPV in developing countries, limited data exist to inform the choice between OPV and IPV in most places.
In addition to preventing disease, eradication programs must focus on providing population immunity(11) to stop poliovirus transmission among susceptible individuals and immune individuals who both can get asymptomatically infected.(12, 13) Risk- and decision-analytic models to evaluate the risks, costs, and benefits of the various options must account for the dynamics of poliovirus transmission to estimate cases.(14, 15) The extent to which individuals with acquired immunity participate asymptomatically in poliovirus transmission remains poorly understood, which provides motivation for improving our understanding of poliovirus immunity, waning, and the relative roles of systemic and local immunity by using models to synthesize the available information.
The development of existing risk and policy models for polio(7, 10, 14-22) focused on evaluating global policies after the successful eradication of WPVs, in particular to help assess economic trade-offs and to estimate the impact of delay and the number of rounds in outbreak response efforts on the size of potential post-eradication outbreaks. Given this scope, the inputs used in the poliovirus transmission model(17) at the core of these policy models reflected several simplifications. For example, the poliovirus transmission model(17) focused on an “average serotype,” characterized potential future outbreaks over a two-year period following a virus reintroduction, assumed initial population immunity profiles that depended on the pre- and post-eradication vaccination policies, and only characterized waning of immunity through changes in the assumed pre-outbreak population immunity profile as a function of time. The complexity of current policy(5, 7) created by an increased number of vaccine options motivates the need to expand on the existing poliovirus transmission model.
The quality of any model and appropriateness of its use for addressing specific questions depend on the scope, inputs, and assumptions that go into the model, and the characterization of different immunity states emerges as a key structural component of building any poliovirus transmission model.(8, 14, 15, 17, 23, 24) The determination of the relevant immunity states requires making assumptions that allow for the characterization of a finite set of immunity states stratified by exposure history and quantified based on evaluation of the existing literature to characterize the model inputs.(13, 25) Recognizing limitations in the existing data and the value of expert review, we used a process involving expert judgment to evaluate, grade, and synthesize the available data to characterize appropriate immunity states, potential values for model inputs, and key sources of uncertainty.(25) We sought to represent the consensus (or lack thereof) among leading poliovirus scientists about the state of the evidence and to develop numerical values and uncertainty characterizations for a finite but sufficient set of immunity states required to model poliovirus immunity and transmission to inform current and future policy decisions. The process produced an overall comprehensive review of the literature(25) as well as quantitative characterizations of various immunity states based on expert elicitation. Unlike some formal approaches to expert elicitation,(26-28) our approach involved multiple iterations with the experts to interpret the available data informing assessments. Although our approach involved iteration and several group discussions, our approach differed from a traditional Delphi approach(29, 30) because we did not attempt to force a consensus of point estimates from the group. We instead focused on understanding and characterizing sources of uncertainty and variability among the experts. This manuscript identifies research priorities based on our synthesis of the results from the expert review and elicitation process.
BACKGROUND
Immunity to poliovirus transmission represents a complicated concept. The three WPV serotypes differ with respect to their neurovirulence in immunologically naive individuals, with paralysis-to-infection ratios ranging from less than 1:1000 for type 2 and type 3 to up to 1:100 or more for type 1,(13, 31, 32) and all poliovirus strains (i.e., even from the same serotype) may differ with respect to transmissibility. Infection or successful vaccination with OPV or IPV induces serum antibodies that provide systemic humoral immunity and protect individuals from developing paralytic poliomyelitis if exposed to a homotypic virus.(13, 33) In contrast, local mucosal immunity may play a more important role in preventing or reducing replication of virus in specific sites such as the alimentary tract that affect virus excretion rather than development of paralytic symptoms.(34) This study addresses immunity to poliovirus transmission in its broadest sense as the ability to prevent or reduce fecal and oropharyngeal excretion and thereby limit infectiousness to others, rather than just immunity to disease. Specifically, we use the term “immunity to poliovirus transmission” to refer to the combined effect of immunity on susceptibility to infection, duration of excretion, concentration of excreted virus, and impact of reduced excretion on transmission. We focus on excretion as the best proxy to determine the ability of an individual to transmit to others, although actual exposure of contacts also depends on many other factors, including contact patterns and the survival of the virus after excretion in various media (e.g., hands, aerosol droplets, fomites, and other contaminated materials). Existing poliovirus transmission models(8, 17) simplified the characterization of immunity states using relative susceptibility, relative infectiousness, and relative duration of infectiousness compared to fully susceptibles and assumed that these values remain the same for any individual in any setting. This assumes that the models capture all properties associated with inherent immunity by model inputs specific for each immunity state and all transmission-related factors in other inputs. Given significant uncertainty and variability in transmission-related factors, the existing models(7, 10, 14-22) used a single number, the basic reproductive number (R0), to characterize the average infectiousness of an average fully susceptible individual to other fully susceptible individuals. While R0 varies by population, the characteristics of the immunity states in these models do not, such that the overall infectiousness to others follows directly from the setting-specific R0 and the setting-invariant relative properties of each immunity state compared to fully susceptibles. The impact of vaccination may also depend on population-specific take rates.
For this expert elicitation we focused first on characterizing the inherent average properties of the expanded set of immunity states (i.e., relative susceptibility, excretion rates over time, concentration of excreted virus) required to address emerging policy questions. We elicited the relationship between concentration of virus excreted and infectiousness to others to relate the inherent properties to transmission. We did not attempt to characterize the absolute transmissibility of polioviruses in different settings, which depends on setting and strain-dependent R0 values, or alternatively on developing separate model inputs that represent the components of R0 (e.g., contact rates, virus survival in the environment, and human infectious doses). The expert review and elicitation primarily focused on the inherent characteristics of the immunity states based on a large, but limited, body of evidence.(25) The relationship between concentration of virus excreted and infectiousness to others, the role of oropharyngeal excretion in transmission, and the relative secondary attack rates of OPV vs. WPV involve consideration of factors beyond inherent immunity, and require relatively much more judgment than characterization of the inherent immunity states.
METHODS
The expert review process involved multiple steps, starting with the selection of experts based on relevant prior publications in the peer-reviewed literature, and followed by preparation of materials for a meeting as well as multiple rounds of iteration (see Appendix A. 1 for details about the process). This paper presents the complete and finalized synthesis of the expert assessments for the 8 immunity states we identified during the meeting as the minimum set required to model immunity to poliovirus transmission that we then used to facilitate the collection of expert input (Figure 1):
Figure 1: Diagram of “recent” immunity states for one serotype (i.e., not showing variability within groups as a function of time since last exposure or other factors).
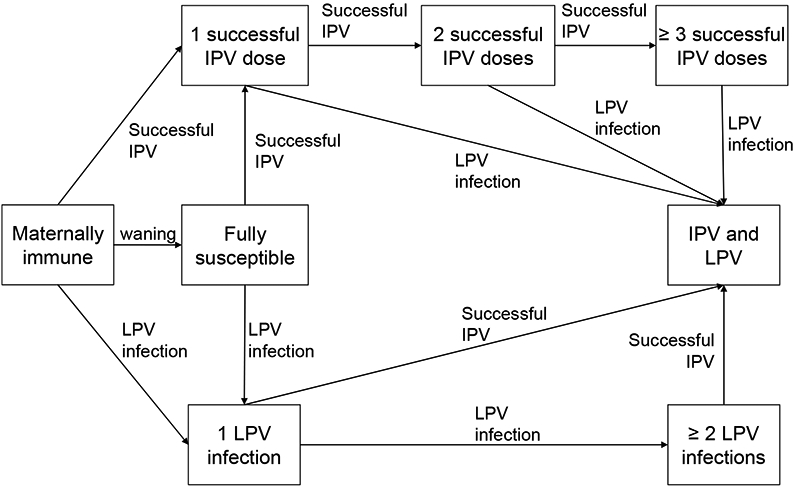
Acronyms: IPV = inactivated poliovirus vaccine; LPV = live poliovirus
“Maternally immune: Individuals born with maternal antibodies that wane rapidly with age (if not infected with LPV or successfully vaccinated with IPV)
Fully susceptible: Individuals never infected with LPV or successfully vaccinated with IPV and maternal antibodies effectively waned to 0
1 successful IPV dose: Individuals with 1 IPV dose that reached and stimulated the immune system and no history of LPV infection, including those “primed” and without measureable serum antibody
2 successful IPV doses: Individuals with 2 IPV doses that reached and stimulated the immune system and no history of LPV infection
≥ 3 successful IPV doses: Individuals with at least 3 IPV doses that reached and stimulated the immune system and no history of LPV infection
IPV and LPV: Individuals infected at least once with an LPV and successfully vaccinated at least once with LPV and IPV, in any order 1 LPV infection: Individuals with a history of a single LPV infection and no history of successful IPV vaccinations
≥ 2 LPV infections: Individuals with a history of multiple LPV infections and no history of successful IPV vaccinations”(25)
We emphasize that our definitions require actual “takes” to enter an immunity state (i.e., successful vaccination that stimulates the immune system or LPV infections that replicate in the host). Figure 1 only depicts the “recent” immunity states, defined as the highest states of immunity that arise immediately after the complete immune response to an infection or successful vaccination (i.e., before any waning). We assume that waning implies that the level of immunity to poliovirus transmission in each state (except fully susceptibles) changes as a function of time since entering the immunity state (not shown in Figure 1).
The characterization of the immunity states for modeling immunity to poliovirus transmission focuses on quantifying the contribution to transmission by individuals in each immunity state. Conceptually, we let the function CT(t) describe the average contribution to transmission of all infected individuals in an immunity state as a function of the time t since the exposure. The area under a CT(t) curve gives the total contribution to transmission of infected individuals. We define the relative total contribution to transmission (RTCT) of each immunity state compared to fully susceptibles as the product of the relative probability of becoming infected compared to fully susceptibles (i.e., relative susceptibility) and the relative area under the curve CT(t) compared to fully susceptibles. For example, a RTCT of 0.1 in a given immunity state means that in the model 10 exposed individuals in the given immunity state generate the same number of secondary infections in a certain setting as 1 fully susceptible individual for an identical exposure and setting. As mentioned above, the absolute number of secondary infections generated by 1 fully susceptible individual depends either directly on the value of R0 in the given setting or on a more detailed model of the factors that affect transmission, which go beyond the characterization of the immunity state.
Unfortunately, we cannot directly observe the contribution to transmission, and consequently we focus on eliciting (somewhat more) measurable quantities from which we then construct CT(t) curves and ultimately the RTCT. We define the following quantities for elicitation (note that we express concentration of virus in tissue- or cell-culture infective doses (CID) as log10 CID50/g for fecal excretion and as log10 CID50/ml for oropharyngeal excretion):
Sr = Relative susceptibility to infection (i.e., the probability of homotypic poliovirus infection in a recent immunity state divided by the probability of homotypic poliovirus infection in fully susceptibles, given identical exposure, scaled from 0 to 1, where 1 indicates the same susceptibility to infection as fully susceptibles and 0 implies complete immunity to re-infection)
P(t) = Proportion of all infected individuals in a given immunity state excreting any amount of virus at time t
C(t) = Average concentration of virus excreted by all individuals excreting virus at time t in a given immunity state (only including excretion by those excreting) (in mean log10 CID50/g or ml)
I(v) = Infectiousness to others for an individual from any immunity state excreting a concentration of virus v (scaled to the maximum infectiousness defined as infectiousness of an individual excreting at 10 log10 CID50/g or per ml)
In addition to depending on the immunity state, all of these quantities may also vary by excretion and transmission mode (i.e., fecal vs. oropharyngeal), strain (e.g., OPV vs. WPV), and serotype. The relative susceptibility (Sr) relates to infection defined as any replication of virus in the gut, oropharynx, or otherwise, which typically gets measured by the proportion of OPV-challenged subjects with virus isolated from at least one stool specimen.(25) We emphasize that while challenge studies typically report the proportion of exposed individuals excreting a detectable concentration of virus (i.e., typically on the order of 2 log10 CID50/g for stool samples), P(t) refers to the proportion of infected individuals excreting any amount of virus. In computing the average concentration of virus excreted, studies may include results from negative stools (i.e., from subjects not infected or no longer excreting at detectable levels) as 0 log or at the lowest dilution tested.(25) However, C(t) explicitly includes in the average only those individuals still excreting virus at time t. Despite design and laboratory limitations,(25) one can measure Sr, P(t), and C(t) relatively directly. Measuring infectiousness as a function of excreted titers (I(v)) remains much more challenging, if not practically impossible, and therefore assessments rely on indirect data and understanding of poliovirus transmission.(25) Infectiousness refers to the rate of infecting others (i.e., the number of secondary infections per day generated by an individual), which we use only in a relative and scaled form, with 1 indicating the rate of infecting others by an individual excreting at 10 log titers, and 0 indicating no infectiousness to others.
Using the above quantities, we construct the CT(t) curves for each immunity state following a series of steps. In the presence of exposure (i.e., OPV vaccination or existence of a non-zero force of natural infection), the relative susceptibility determines the fraction of exposed individuals from a given immunity state that becomes infected in a given situation, compared to fully susceptibles. Among those infected, not all individuals excrete virus at every point in time t following the exposure. Those that excrete at time t will excrete an average concentration C(t) of virus leading to an infectiousness of I(C(t)) at time t, while those that do not excrete remain noninfectious to others (i.e., I(0)=0). Therefore, the average contribution to transmission of all infected individuals in an immunity state as a function of time after the exposure depends on the proportion of infected individuals that excrete:
We emphasize for a non-linear function I(v),in general: I[C(t)] × P(t) ≠ I[C(t)×P(t)] (square brackets used to emphasize the distinction). Thus, assessing the product C(t)×P(t) would not suffice and therefore we elicit both quantities separately. We further note that we assume that P(t) and duration estimates ignore the effect of the low rate of mortality on excretion, although in transmission models the overall contribution to transmission depends on the assumed setting-specific mortality rates.(35) The relative total contribution to transmission of an immunity state i equals:
where T represent the period of excretion, which we elicited as ending by 10 weeks after the exposure for a typical immunocompetent individual in any immunity state, index i indicates the given immunity state, and index FS indicates the fully susceptible state. We emphasize that Sr, P(t), and C(t) each represent inherent properties of an immunity state, but that the relationship I(v) between excreted virus concentrations and infectiousness to others involves factors beyond immunity that depend on setting-specific conditions and behavior. By scaling to an artificial maximum level of excretion, we attempt to create an average relationship between excretion and infectiousness that allows us to determine the inherent fecal and oropharyngeal RTCTs of each immunity state, by strain and serotype. By separating fecal excretion and infectiousness from oropharyngeal excretion and infectiousness, we allow the relative importance of both modes to vary by setting independent of the mode-specific RTCTs.
Due to the reality of waning, we would ideally like to elicit Sr, P(t), and C(t) and construct CT(t) for each immunity state and at each stage of waning. However, this would represent an overwhelmingly large set of quantities and curves to assess, even if discretized according to a limited number of waning stages. Instead, we focused on eliciting Sr, P(t), and C(t) for recent immunity states and then separately characterizing how relative susceptibility and the total virus output might increase as a function of the time after entering an immunity state. We define the average total virus output (TV) as follows:
DO = Average daily output for any individual (in g/day for fecal output and ml/day for oropharyngeal output)
A(t) = Average daily amount of virus excreted at time t by all infected individuals in a given immunity state (includes infected individuals who are not excreting) (in log CID50/day) = C(t) × P(t) × DO
TV = Average total virus output excreted by all infected individuals in a given immunity state (in log10 CID50) = Area under the A(t) curve
The value of DO does not affect the contribution to transmission if we assume that it remains constant across immunity states (see appendix A.2), but it represents a necessary quantity to ensure a physically meaningful interpretation of TV as total amount of virus excreted over time following the exposure (i.e., rather than a sum of concentrations over time if we take the area under the curve C(t) × P(t), which gives units of log10 CID50×day/g or ml). To characterize the process of waning, we elicited the increase in Sr and TV as functions of the time s after entering an immunity state:
ws(s) = increase in Sr, scaled to the Sr values for the recent immunity state and fully susceptibles (0 ≤ ws(s) ≤ 1)
wtv(s) = increase in TV, scaled to the TV values for the recent immunity state and fully susceptibles (0 ≤ wtv(s) ≤ 1)
For both of these, a value of 0 means no increase compared to the value in the corresponding recent immunity state, and 1 means a maximum increase to the level of fully susceptibles. Thus, using the assessed ws and wtv values for the recent and fully susceptible immunity states, we infer relative susceptibility and total virus output as a function of s:
where SrFS gives the Sr for fully susceptibles, which equals 1 by definition, and TVFS gives the TV for fully susceptibles, which varies by expert.
The elicitation process allows us to construct relative susceptibility for each immunity state at any stage of waning, and to characterize how the total virus output changes as a function of s, while also obtaining assessments for the shape of the waning curves that remain independent of the assumed initial level. However, while TV provides a sense of the combined effect of waning on duration and concentration of virus excreted, we cannot directly infer CT(t) curves from the assessments. To infer CT(t) curves, we assume that: (1) A(t) increases by exactly wtv(s) towards the A(t) for fully susceptibles at each point in time t, and (2) at any point in time t, P(t) and C(t) both increase by the same relative amount f(t) towards the corresponding values for fully susceptibles (i.e., we attribute any increase in total virus output equally to duration of excretion and concentration of virus excreted). These assumptions allow us to derive P(t), C(t), and CT(t) at any stage of waning for each immunity state (see appendix A.2).
Finally, besides characterizing immunity states using the quantities described above, we elicited a number of additional quantities relevant to poliovirus immunity and transmission:
The average duration of the latent period, defined as the average time between exposure and excretion of sufficiently high concentrations of virus for infectiousness to others (in days)
The average duration of the infectious period, defined as the average length of time of excretion of sufficiently high concentrations of virus for infectiousness to others (in days)
The proportion of total transmissions that occur via the oropharyngeal mode
The relative secondary attack rate of OPV vs. WPV, defined as the number of secondary infections generated in contacts of an index OPV infection divided by the number of secondary infections generated in contacts of an index WPV infection in an otherwise identical situation.
RESULTS
We summarize the results of the elicitation process by presenting the range of assessed values quantitatively using box plots that capture the distribution of the best estimates for all 9 experts (unless otherwise noted), including the mean, median, lower quartile, upper quartile, minimum, and maximum of the assessments (see inset in Figure 2). We also qualitatively discuss insights and areas of agreement or disagreement, in some cases noting why one or more of the experts (identified anonymously as A, B, C, D, E, F, G, H, or I) offered a different perspective.
Figure 2: Box plots for the relative susceptibility to poliovirus type 1 excretion by recent immunity state, where 1 indicates susceptibility equal to fully susceptibles and 0 indicates complete immunity to excretion. Inset: Interpretation of box plots used for synthesizing the collective expert assessments in this and following figures.
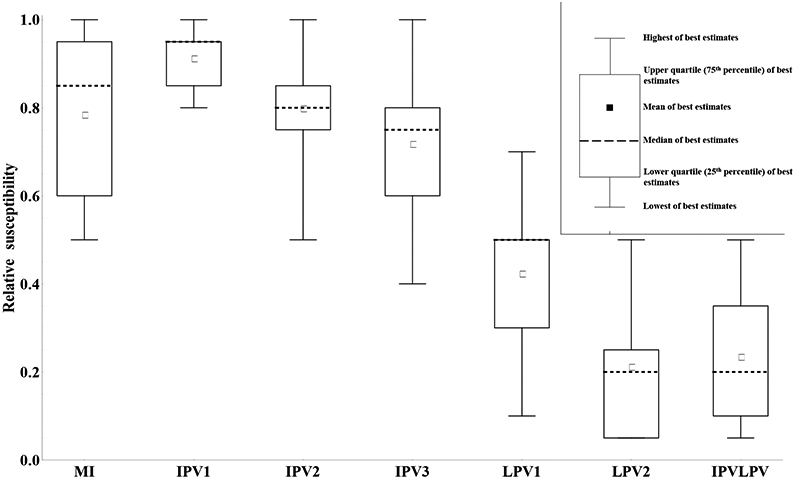
Acronyms: MI = maternally immune; IPV = inactivated poliovirus vaccine; IPV1 = 1 successful IPV dose; IPV2 = 2 successful IPV doses; IPV3 = 3 or more successful IPV doses; IPVLPV = IPV and LPV (i.e., 1 or more successful IPV doses and 1 or more LPV infections); LPV = live poliovirus; LPV1 = 1 LPV infection; LPV2 = 2 or more LPV infections
Relative susceptibility to poliovirus infection
Numerous studies that administered OPV vaccines to subjects with a history of one or more infections or successful vaccinations showed that individuals with positive serum antibody levels, while protected from poliomyelitis disease, can still become re-infected and excrete homotypic polioviruses.(13, 25, 36, 37) Natural exposure to wild poliovirus also can lead to re-infection in seropositives.(12, 38) We sought to quantify the extent to which individuals in different recent immunity states can become (re-)infected, compared to fully susceptibles, which we call relative susceptibility (Sr). By the inherent relative comparison we control somewhat for different types of exposure (WPV, mOPV, tOPV, different amounts of virus), but given the possible effect of serotype interference even on relative susceptibility, we specifically refer to the susceptibility to infection following exposure to a single serotype (e.g., mOPV1, WPV1).
Figure 2 summarizes the assessments of relative susceptibility for each of the recent immunity states, except for fully susceptibles (i.e., relative susceptibility for fully susceptibles equals 1 by definition). Figure 2 shows the results only for type 1 given that the results for types 2 and 3 appear very similar, although we note that 1 (G) of the 9 experts provided slightly different assessments by serotype. The lack of a significant serotype effect depends strongly on our definition of immunity states reflecting the immunity after actual “takes” (i.e., infections or successful IPV doses) and it contrasts with the results from challenge studies with tOPV, which will typically show different relative susceptibility for each serotype due to interference between serotypes that impact take rates. Conditioning on “take” also implies a greater effect of each dose compared to study data, which typically report the aggregate proportions excreting among responders and non-responders to a prior dose.(25) Overall, Figure 3 suggests reasonable agreement that immunity induced only from IPV provides far less protection from infection than a history involving one or more LPV infections. The assessments also agree that relative susceptibility decreases with the number of successful IPV doses or LPV infections. Figure 2 reveals notable differences between estimates from the experts, with the assessments typically covering about half of the range from 0 to 1 for all of the immunity states except for 1 successful IPV dose, which all experts agree does little to protect from infection. One expert (H) felt that maternal immunity and a single successful IPV dose provided no protection from infection and one expert (E) felt that none of the IPV immunity states provide protection from infection. One expert (C) indicated lower relative susceptibility for 2 or ≥ 3 successful IPV doses compared to 1 LPV infection, while all others indicated that even a single LPV infection provided better protection from re-infection than any number of successful IPV doses in the absence of prior LPV infections.
Figure 3: Box plots for the proportion of infected individuals excreting any amount of type 1 WPV (P(t)), by recent immunity state and excretion mode.
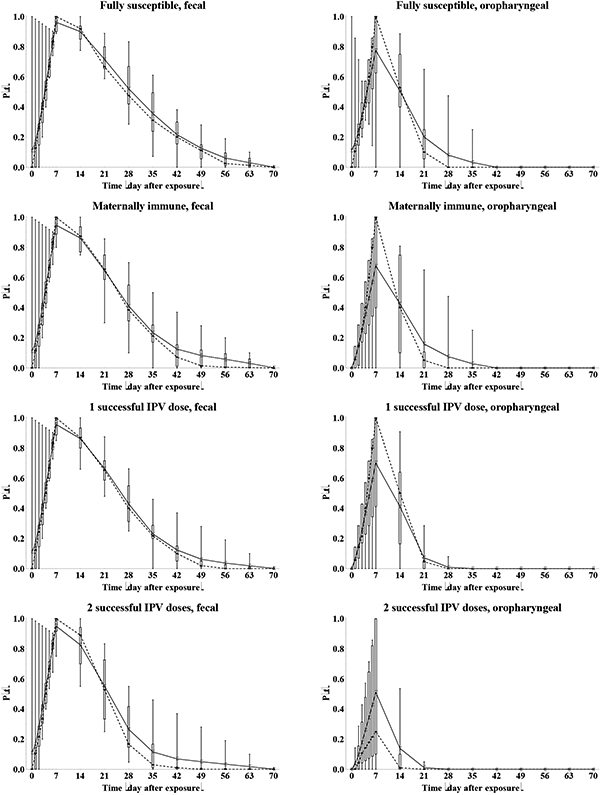
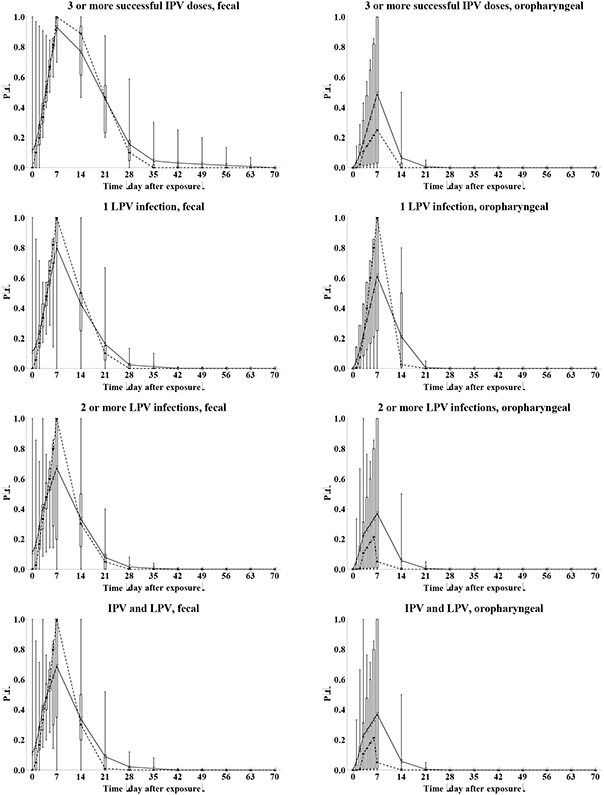
Acronyms: IPV = inactivated poliovirus vaccine; LPV = live poliovirus; WPV = wild poliovirus
The variation between experts reflects uncertainty due to limitations in the available data, with none of the studies evaluated by the experts designed specifically for the purpose of providing Sr information. Limitations of the data include small sample sizes, the use of tOPV challenge doses, the absence of reported pre-challenge antibody levels, the possibility of secondary OPV exposure interfering with study results, laboratory limitations, and the absence of a susceptible control arm.(25) In addition, uncertainty exists with respect to the suitability of OPV challenge studies to explore immunity to natural infection with WPVs or VDPVs. Despite the limitations, we note that the data to support relative susceptibility assessments led to agreement about the qualitative differences between LPV and IPV with respect to susceptibility to infection and the limited impact of maternal antibodies or priming with IPV on susceptibility to infection.(25) Relative susceptibility given a single LPV infection shows the greatest uncertainty, which may reflect different mental corrections of the data by the experts to condition on actual “takes.”
Duration and concentration of virus excreted after poliovirus re-infection as a function of recent prior exposure history
Following the characterization of relative susceptibility for each recent immunity state, we quantify the excretion pattern over time in terms of duration and concentration of virus excreted by (re-)infected individuals. We distinguish the two main modes of excretion that contribute to transmission of poliovirus (i.e., fecal excretion resulting from poliovirus replication in the intestines and oropharyngeal excretion resulting from poliovirus replication in the oropharynx). Many OPV challenge studies report fecal excretion rates over time, some report fecal virus titers, and very few studies report oropharyngeal excretion rates or titers over time.(25) Despite the availability of data from studies, similar limitations exist in these studies as noted above for relative susceptibility,(25) which complicates estimation of numerical values or establishment of qualitative differences (e.g., between serotypes, OPV and WPV, 1, 2, or ≥ 3 successful IPV, and 1 or ≥ 2 LPV).
Given differences in assumptions for the time shortly after infection, we provide daily results during the first week and then weekly values. Figure 3 summarizes the results of the elicitation for the proportion of infected individuals excreting any amount of WPV1 (P(t)). One expert (G) indicated some serotype differences for 1 or more immunity states for fecal excretion based on his interpretation of published and unpublished data and none for oropharyngeal excretion. None of the experts quantified different curves for WPV compared to OPV excretion in feces, but two experts (B, C) indicated higher proportions for oropharyngeal excretion for WPV compared to OPV infections. In addition, several experts indicated that they remained unaware of data that allows differentiation between OPV and WPV even though differences might exist, and one expert (I) indicated qualitatively that prolonged excretion probably occurs more frequently following a WPV infection, but that this remained of small epidemiological significance with this expert assuming most transmissions occur during the initial stage of excretion. The curves for WPV1 in Figure 3 remain very similar to those for other serotypes and/or for OPV (not shown). Comparison with the typically reported data remains indirect, because Figure 3 shows excretion of any amount of poliovirus among only infected individuals rather than excretion of detected poliovirus among all exposed individuals. Where comparable data exist (e.g., fecal OPV excretion for fully susceptibles) the overall patterns appear similar to those observed in OPV challenge studies.(25)
With respect to fecal excretion, all experts agreed that immunity derived from an LPV infection reduces the probability of extended excretion given infection. Most experts indicated that maternal immunity shows limited effect on the length of excretion given infection. The experts provided somewhat differing assessments with respect to the effect of IPV-induced immunity on the length of excretion, as shown by the height of the boxes in the plots. Not surprisingly given the scarcity of data, Figure 4 shows much more variation between experts in the P(t) curves for oropharyngeal excretion. Fundamentally, some experts (A, E, G, I) believe that all infected individuals excrete from the oropharynx for some time, regardless of the immunity (i.e., peak proportion excreting at the maximum of 1 on day 7) and that immunity only reduces the concentration of virus (see below). In contrast, other experts believe that serum antibodies prevent viremia and spread of the infection to the oropharynx in some or all subjects who experience intestinal infection, leading to peak oropharyngeal excretion proportions of well below 1 and as low as 0. All experts agree that IPV-induced immunity reduces the length of oropharyngeal excretion more than the length of fecal excretion, while LPV-induced immunity effectively reduces both modes of excretion. One expert (H) believes that excretion by infected individuals starts essentially immediately after exposure, while all others believe some latent period exists before excretion starts, which explains the long whiskers in the box plots during the first week. In vitro studies show that replication in susceptible cells begins within hours, which almost certainly occurs in vivo, although it takes 1-3 days for sufficient titers to allow detection by culture, and consequently some uncertainty exists about the time when actual excretion begins.
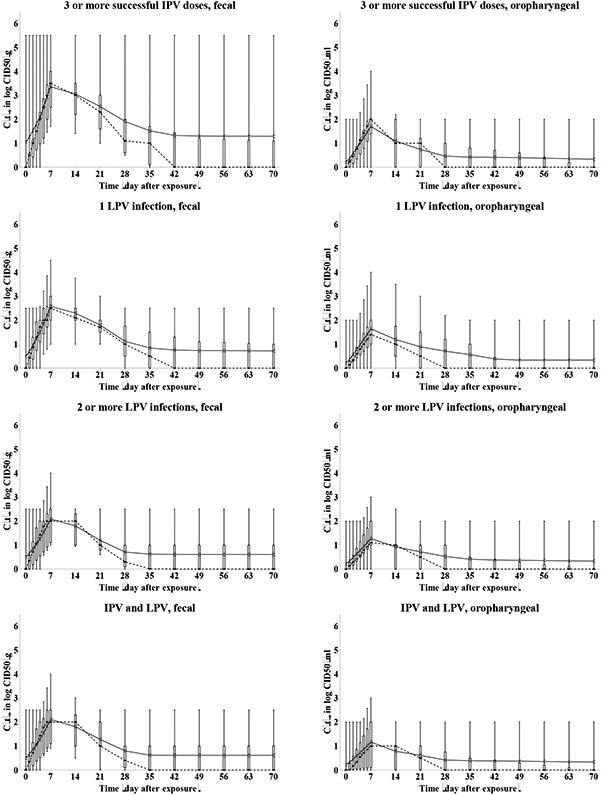
Figure 4: Box plots for the average concentration of WPV type 1 by individuals excreting at time t after the challenge (C(t), in log10 CID50/g), by recent immunity state and excretion mode.
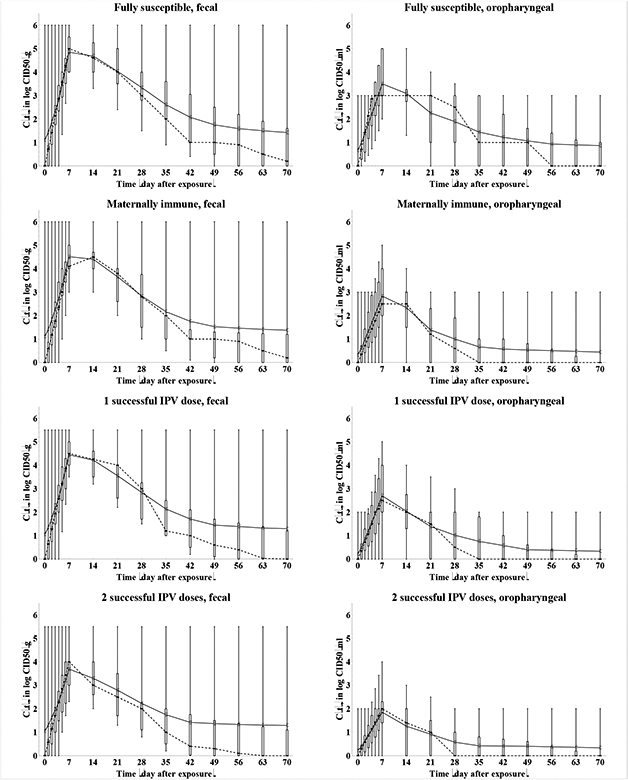
Acronyms: CID50 = tissue- or cell-culture infectious doses; g = gram (i.e, of stool); IPV = inactivated poliovirus vaccine; LPV = live poliovirus; ml = milliliter (i.e., of oropharyngeal excreta); WPV = wild poliovirus
Figure 4 summarizes the results of the elicitation for the average concentration of WPV1 excreted by excretors over time (C(t)). One expert (B) quantified a different curve for both fecal and oropharyngeal WPV compared to OPV excretion and one expert each for only fecal (G) and only oropharyngeal (C) excretion, with higher titers following a WPV infection. In addition, several experts indicated that the uncertainty and variability in excreted titers and lack of data limited their abilities to assess differences between WPV and OPV quantitatively. The possibility of higher titers following a WPV infection compared to an OPV infection comes from the presumed greater ability of WPVs to replicate in humans than attenuated poliovirus, and this difference in part explains why WPVs remain more transmissible and neurovirulent than OPVs (see below). One expert (G) indicated some serotype differences in virus titers for 1 or more immunity states for fecal excretion based on his interpretation of published and unpublished data and none for oropharyngeal excretion. The behavior in Figure 4 reflects two distinct interpretations of the limited data on virus titers over time, which explains much of the uncertainty conveyed in the box plots. Two experts (G, H) assumed constant virus titers at any time of excretion, while the other 7 experts assumed a rapid increase to a maximum titer during the first or second week, followed by a more gradual decrease (on a log scale) to essentially no excretion by the end of the excretion period. The distinction affects how long individuals remain maximally infectious to others (i.e., either for the entire period of excretion or only during the first week or two). Moreover, the peak levels assessed by the experts also varied by two orders of magnitude, consistent with the range of titers observed in OPV challenge studies.(25) The degree to which exclusive IPV-induced antibodies reduce the concentration of virus in feces emerges as another key uncertainty, with varying differences in titers for 2 or more successful IPV doses compared to fully susceptibles. One expert (H) assumed that IPV-induced antibodies do not reduce the concentration of virus in feces at all. For oropharyngeal excretion, agreement exists that any active immunity induced by IPV or LPV significantly reduces virus titers (or prevents excretion altogether), with some differences remaining in the absolute values. Experts also differed in their views about the existence of an effect of maternal immunity and the first IPV dose on titers. One possible explanation for the clear effect of IPV-induced immunity on oropharyngeal excretion despite no such effect on fecal excretion arises from the concept that the oropharyngeal infection required for excretion may result from a secondary, blood-borne infection from the gut, which serum antibodies may prevent. Alternatively, the oropharynx may support less poliovirus replication than the intestinal tract and the presence of IPV-induced serum antibodies may limit oropharyngeal excretion to low or undetectable levels.
Relationship between concentration of virus excreted and infectiousness to others
The previous sections characterize the susceptibility to infection and the extent of excretion given infection for each of the recent immunity states, which both represent inherent, average properties of immunity states. To characterize immunity to poliovirus transmission, we must further assess the relationship between the concentration of virus excreted and infectiousness to others (I(v)). We express infectiousness in scaled form to the maximum infectiousness, defined as the infectiousness of an individual excreting at 10 log10 CID50/g or per ml. For example, a scaled infectiousness value of 0.5 at a titer of 4 log10 CID50/g implies that an individual (from any immunity state) excreting 4 log10 CID50/g of virus from feces at a given time infects half as many contacts per day as an individual excreting 10 log10 CID50/g of the same virus from feces in an otherwise identical situation. This represents a very complex relationship, because we cannot directly observe poliovirus transmissions or the dose of ingested virus in natural exposures (i.e., as opposed to vaccine challenge). Moreover, most poliovirus infections occur asymptomatically, which complicates the establishment of infection due to a natural exposure. Even if we could easily measure transmission, we cannot determine whether a secondary infection occurred due to exposure resulting from virus excreted in the feces and/or the oropharynx by the index infection. Moreover, the relationship between the concentration of virus excreted and the probability of infecting others remains uncertain, even with perfect knowledge about the excretion mode and human infectious doses, due to the numerous factors that might influence virus concentrations during the time between excretion of the index infection and ingestion by the contact.(25, 39) While we cannot directly measure this relationship in a study, the experts relied on their understanding of transmission pathways and human infectious doses for poliovirus to provide their best assessments.(25)
Figure 5 summarizes the results for type 1 OPV and WPV viruses, including the full relationship (Figure 5a) and the distribution of the midpoints, defined as the titers for which the infectiousness reaches 0.5 (Figure 5b). Only one expert (I) provided serotype differences for this relationship, with higher titers required to reach infectiousness of 0.5 for type 2 compared to type 1, and even higher titers for type 3, based on his interpretation of data to suggest serotype differences in the human infectious doses. While initial inspection of Figure 5a might suggest relatively high agreement about the relationship, this mainly stems from the requirement that by definition the curves start at 0 and end at 1. Figure 5b clearly shows very large variation around the midpoints, which lies right around the titers of excretion typically assumed for most immunity states (Figure 4) and which matters most with respect to characterizing the contribution to poliovirus transmission. Not surprisingly given the lack of data directly informing this relationship, Figure 5 indeed reflects great uncertainty, including several differences in assessed qualitative behavior. First, experts differed with respect to the shape of the relationship. While 6 experts (A, D, E, F, G, I) provided S-shaped curves for both fecal or oropharyngeal OPV and WPV infectiousness, suggesting the most rapid increase in infectiousness around the midpoint, 3 experts provided super-linear curves (C for fecal infectiousness, B (only for WPV) and H for oropharyngeal infectiousness), indicating that infectiousness may rapidly increase at low log titers and more slowly at high log titers. Second, 7 experts (A, B, D, E, F, G, H) provided lower or equal midpoints of infectiousness for oropharyngeal compared to fecal excretion, implying that substantial relative oropharyngeal infectiousness requires less virus excretion than fecal infectiousness. In contrast, one expert (I) provided higher midpoints for oropharyngeal compared to fecal excretion based on experience with other viruses suggesting that fecal-oral transmission represents a highly effective route and thus does not require as much virus. Another expert (C) provided higher midpoints for oropharyngeal than fecal OPV excretion but not for WPV excretion given his belief that a clear difference between both routes arises only for a more attenuated virus. One expert provided identical curves for both types of excretion (E). All 4 experts (B, C, E, F) who provided separate curves for WPV and OPV excretion assessed lower midpoints for WPV compared to OPV, suggesting that infection with WPV leads to substantial relative infectiousness more rapidly as titers increase than infection with OPV. This behavior might explain the consensus that WPVs remain more transmissible on average than OPVs (discussed below in the subsection on relative secondary attack rate of OPV vs. WPV). Four experts (A, C, E, F, H) indicated that infectiousness starts to increase at any small concentration of virus excreted for any strain and excretion mode (e.g., they provided a non-zero value at the lowest tabulated titer level of 1 log10 CID50/g or ml), while the other 5 (B (for OPV only) D, E, G, I (except type 1, fecal)) assumed zero infectiousness up to 1 or 2 log10 CID50/g, suggesting a minimum level of excretion required for poliovirus transmission. Overall, the curves reflect substantial uncertainty in the relationship between concentration of virus excreted and infectiousness to others, which may partly stem from the cognitive complexity of the definition of this relationship, but also reflects the large number of factors that affect poliovirus transmission and the lack of good data on this topic.(25) This relationship represents a key unknown required for the characterization of the contribution of transmission of immunity states. Unfortunately, conducting studies on this topic remains very challenging and we would expect to find highly variable results from setting to setting. For example, in a high exposure setting increasing the concentration of virus excreted may only marginally increase the fraction of contacts that becomes infected, while in low exposure setting some minimal threshold of excretion may exist to allow a sufficiently high ingested dose in contacts. Moreover, the experience with low immunogenicity of OPV in developing settings still leaves gaps in our understanding of factors that influence the acquisition of infection(25) even if we control the inoculum. Given the lack of data and that the relationship may well depend on the setting, models may need to seek to fit this relationship to the setting studied to ensure that the model correctly captures the infectiousness of different immunity states.
Figure 5: Box plots for the effect of the concentration of excreted type 1 virus on infectiousness to others, scaled to maximum infectiousness at 10 log10 CID50/g or ml (I(v)).
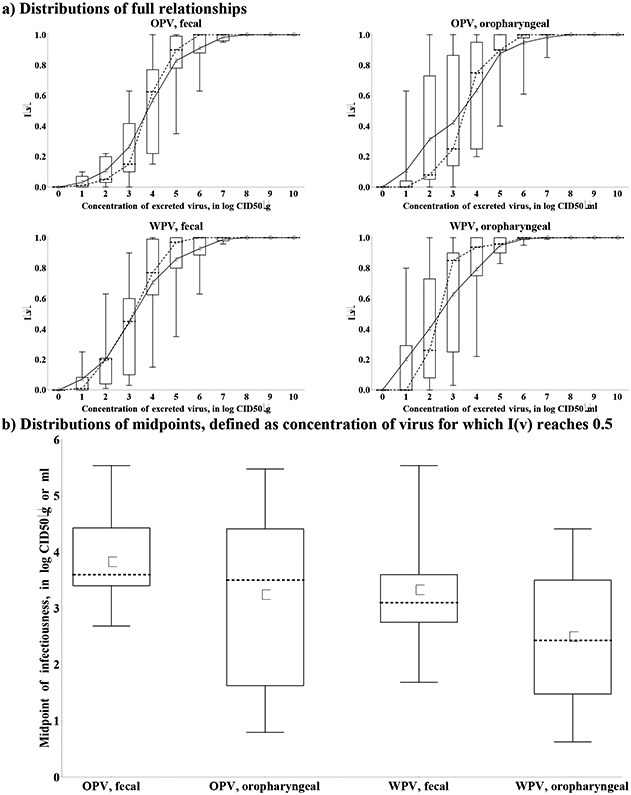
Acronyms: CID50 = tissue- or cell-culture infectious doses; g = gram (i.e, of stool); ml = milliliter (i.e., of oropharyngeal excreta); OPV = oral poliovirus vaccine; WPV = wild poliovirus
Inferred relative contribution to transmission of recent immunity states
We determine the relative total contribution to transmission (RTCT) of recent immunity states inferred from the expert assessments discussed above for relative susceptibility (Sr), proportion excreting and concentration of virus excreted as a function of time after exposure (P(t) and C(t)), and infectiousness to others as a function of concentration of excreted virus (I(v)), as described in the methods. We first construct the curves for contribution to transmission as a function of time after exposure (CT(t)) for each immunity state and each individual expert, as shown in Figure 6. A CT(t) value of 1 means that all infected individuals in the immunity state remain as infectious to others as individuals excreting at the maximum level of 10 log10 CID50. Given that the experts assessed infectiousness at high titers differently (Figure 5), we also obtain large differences in CT(t) values, which remain somewhat artificial. Nevertheless, Figure 6 clearly shows the kinetics of the contribution to transmission that increases quickly during the first week, and then starts a gradual decrease to 0 as a the proportion that stopped excreting increases (Figure 3) and/or the concentration of virus decreases (Figure 4), which occurs much faster for oropharyngeal transmission compared to fecal-oral transmission. The peak contributions to transmission decrease from fully susceptible to maternally immune, to successive IPV doses, and finally to successive LPV infections.
Figure 6: Box plots for the contribution to transmission, given infection (CT(t)) as a function of the time after WPV type 1 exposure, by recent immunity state.
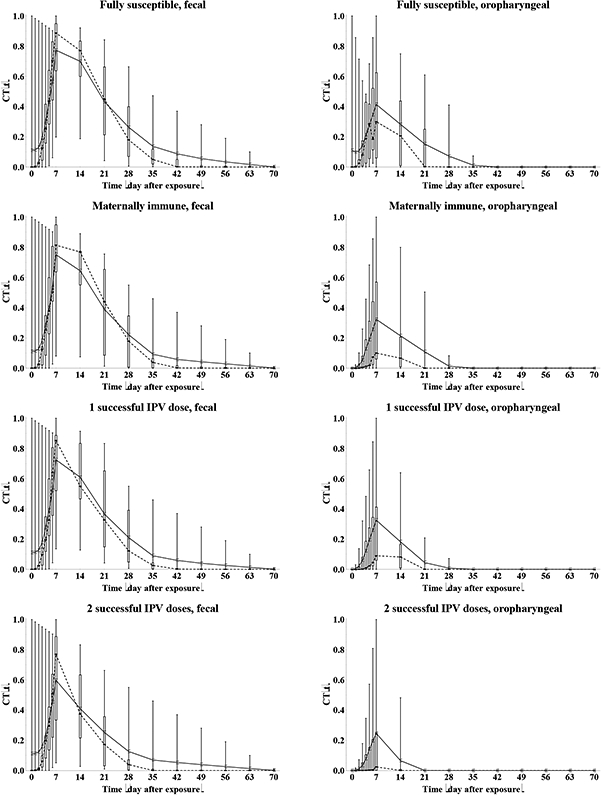
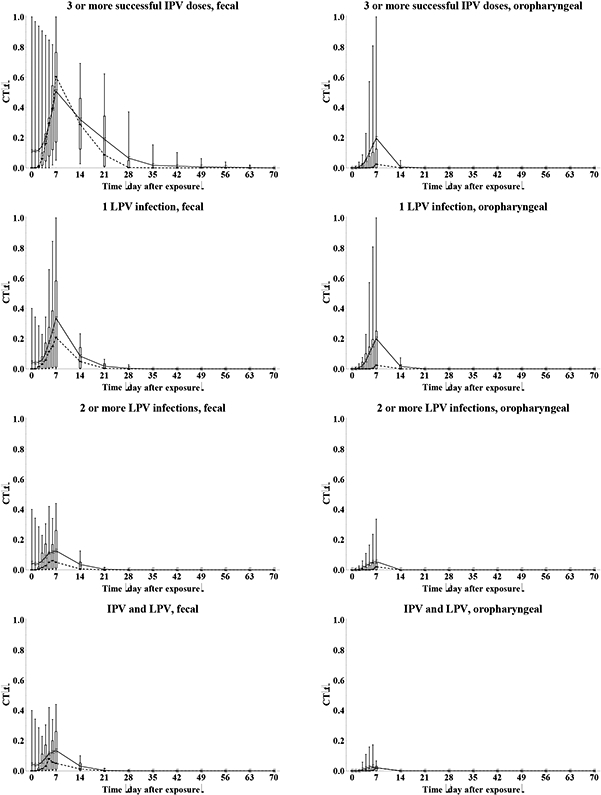
Acronyms: IPV = inactivated poliovirus vaccine; LPV = live poliovirus; WPV = wild poliovirus
Given the artificial units of the contribution to transmission, the most meaningful comparison of the characterization of immunity states between experts involves comparing their RTCTs, defined as the area under the CT(t) curves for a given immunity state divided by the area under the curve for fully susceptibles, and multiplied by relative susceptibility of the immunity state. RTCT provides a summary measure of immunity to poliovirus transmission of an immunity state with respect to a given serotype, strain, and transmission mode. Importantly, it assumes that the relationship I(v) captures the average infectiousness associated with each concentration of excretion, and that this applies to all settings, although as discussed setting-specific variability probably exists. Figure 7 shows the distribution of RTCTs for both OPV and WPV type 1 viruses. While the best data exist with respect to OPV excretion,(25) the results for WPV transmission remain the most important in the context of developing policies involving WPV eradication and managing cVDPVs, which behave like WPVs. Figure 7 suggests that as a group the experts believe that the immunity to OPV transmission probably provides a reasonable proxy of the immunity to WPV transmission. Nevertheless, some differences emerge especially when comparing medians, and these stem from a few experts who provided different assessments between OPV and WPV for P(t), C(t), and/or I(v). These experts confirmed that given the greater infectiousness of WPVs and the threshold behavior of the human infectious dose, some difference may exist in the immunity of some immunity states to WPV vs. OPV transmission, even in relative terms (i.e., compared to fully susceptibles). One expert (A) expressed the possibility that the immunity to poliovirus transmission of LPV states may also depend on whether it resulted from a prior OPV or WPV infection, in particular as it relates to waning, as observed for other vaccine-preventable diseases. Other experts (E, G) explicitly stated that a live virus infection results in the same immunity state regardless of the live virus strain(s) that induced the immunity, even if the level of immunity to WPV transmission may differ from the level of immunity to OPV transmission.
Figure 7: Box plots for the inferred relative total contribution to transmission (RTCT) compared to fully susceptibles for type 1.
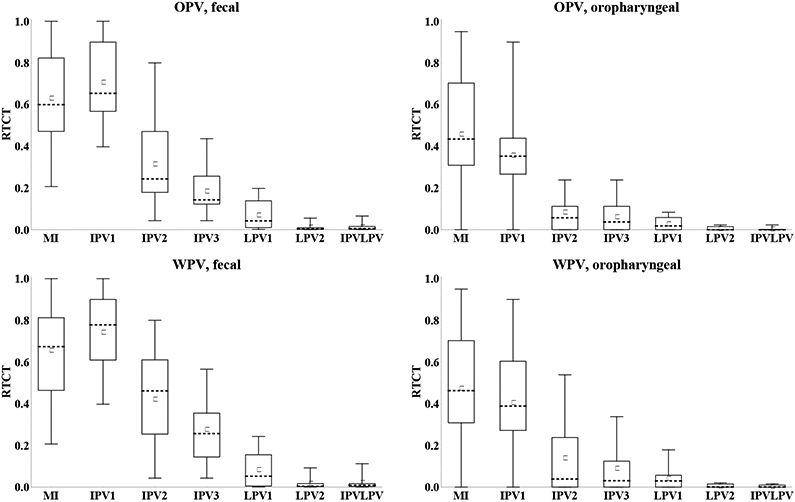
Acronyms: MI = maternally immune; IPV = inactivated poliovirus vaccine; IPV1 = 1 successful IPV dose; IPV2 = 2 successful IPV doses; IPV3 = 3 or more successful IPV doses; IPVLPV = IPV and LPV (i.e., 1 or more successful IPV doses and 1 or more LPV infections); LPV = live poliovirus; LPV1 = 1 LPV infection; LPV2 = 2 or more LPV infections; OPV = oral poliovirus vaccine; WPV = wild poliovirus
Substantial uncertainty exists with respect to value of the relative immunity to poliovirus transmission (i.e., the RTCT) for every immunity state, with the greatest uncertainty for maternal immunity and 1 or 2 successful IPV doses. While one expert (H) indicated that maternal immunity completely eliminates the potential to participate in oropharyngeal transmission, the other experts gave values that imply up to 95% oropharyngeal RTCT for maternally immunes compared to fully susceptibles. For the other immunity states, the qualitative patterns remain relatively robust, with higher immunity to fecal-oral transmission following any number of LPV infections compared to only IPV, and only slightly better immunity to oropharyngeal transmission following one or more LPV infections compared to only IPV. Given the higher relative susceptibility values for the IPV than LPV immunity states (Figure 2), experts who believe that essentially no difference exists in oropharyngeal RTCTs should assess lower oropharyngeal P(t) or C(t) for IPV compared to LPV immunity states. This adjustment could effectively lead to overestimation of the oropharyngeal RTCTs of the IPV immunity states, implying that the difference between the IPV and LPV immunity states with respect to the oropharyngeal RTCT may not represent an accurate reflection of the expert beliefs. Relatively large differences emerge between the RTCTs of 1 LPV infection compared to 2 or more LPV infections. All experts provided differences in Sr, P(t), and/or C(t) between these immunity states based on the higher antibody levels arising with successive LPV infections, which correlate with less excretion.(25, 40-43) However, given that the challenge data by prior OPV generally do not condition on take while our immunity states require actual infections, the experts had to mentally correct for the effect of suboptimal take in studies, possibly leading to under- or overestimation of the effect of additional doses.
Duration of the latent and infectious periods
The duration of the infectious period for an individual equals the amount of time that the individual excretes at sufficiently high titers to become infectious to others, and the latent period measures the time until an individual first excretes at or above this minimum level. As seen in Figure 5, some experts indicated that infectiousness starts at any low concentration of virus excreted, while others indicated that infectiousness start at some non-zero minimum concentration of excreted virus, so the assessments for the proportion of infected individuals excreting any concentration of virus over time (P(t)) does not necessarily represent the proportion of infected individuals infectious to others. Therefore, we elicited the average durations of the latent and infectious periods directly, with initial estimates derived from the assessed P(t) curves. Figure 8 shows the results for the duration of infectiousness for type 1, which remain qualitatively consistent with Figure 3. Two experts (G, I) indicated some serotype differences, one expert (C) indicated that differences exist between OPV and WPV with respect to oropharyngeal infectiousness, and no experts provided different durations for OPV and WPV with respect to fecal infectiousness. All experts indicated that infected individuals from any immunity state become infectious for some time with respect to fecal-oral transmission for type 1, but one expert (I) indicated no infectiousness following type 2 and 3 infections in the LPV immunity states. Five experts (D, E, F, G, H) indicated no infectiousness with respect to oropharyngeal transmission in one or more immunity states. The experts consistently indicated longer durations of fecal compared to oropharyngeal infectiousness, except for one expert (I) who assessed no fecal infectiousness in the LPV immunity states for some serotypes. All experts provided short durations of the latent period, ranging from 0 to 5.3 days, with minimal differences between immunity states, serotypes, strains, and transmission modes.
Figure 8: Box plots for the duration of the infectious period given type 1 WPV infection, by transmission mode and recent immunity state. No experts indicated differences between OPV and WPV for fecal and 1 expert for oropharyngeal infectiousness.*.
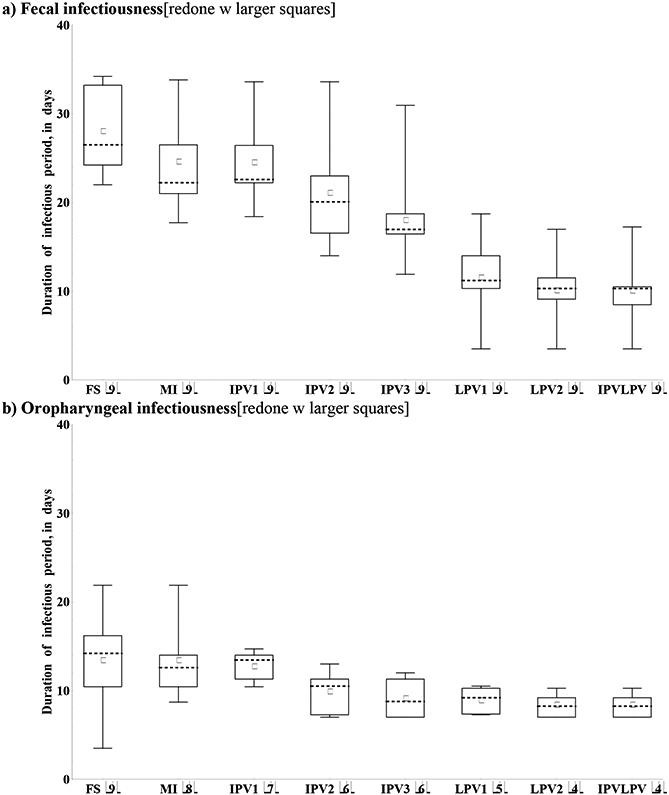
Acronyms: MI = maternally immune; IPV = inactivated poliovirus vaccine; IPV1 = 1 successful IPV dose; IPV2 = 2 successful IPV doses; IPV3 = 3 or more successful IPV doses; IPVLPV = IPV and LPV (i.e., 1 or more successful IPV doses and 1 or more LPV infections); LPV = live poliovirus; LPV1 = 1 LPV infection; LPV2 = 2 or more LPV infections; OPV = oral poliovirus vaccine; WPV = wild poliovirus Note: *Numbers in parentheses indicate number of experts included in box plots (i.e., those who assumed non-zero duration of the infectious period)
Relative contribution of oropharyngeal transmission
Given the differences in relative total contribution to transmission between fecal-oral and oropharyngeal transmission, we must consider the relative contribution of oropharyngeal transmission, defined as the proportion of transmissions that occur via the oropharyngeal mode, to assess overall immunity to the transmission of infection. The literature typically assumes that this depends heavily on the setting, with oropharyngeal transmission representing a more important mode of transmission in settings of good hygiene and sanitation (low R0), and fecal-oral transmission representing the dominant mode of transmission in many developing countries (high R0).(13, 25, 34) The evidence from developed countries that IPV provides some level of protection for the population due to reduced transmission supports this assumption.(33, 44-46) Moreover, a difference may exist between transmission among close contacts (e.g., households, institutions) and transmission in the community. Therefore, we elicited the contribution of oropharyngeal transmission along these dimensions, as shown in Figure 9 (note that we did not elicit separate assessments for different serotypes or virus strains). While the majority of experts appear in agreement with the assumption of relatively more oropharyngeal transmission in low R0 settings, as shown by the height of the whiskers, one expert (I) indicated that fecal-oral transmission dominates even in low R0 settings based on the known longer duration and higher concentration of fecally-excreted compared to oropharyngeally-excreted viruses. Figure 9 further suggests that the difference between settings (i.e., R0 level) represents a much more important consideration than the difference between close and community contacts. However, consistent with the lack of good data on community transmission,(25) we discern more uncertainty with respect to community transmission compared to close contact transmission. Given that community transmission provides the primary concern for poliovirus transmission models, models may need to calibrate this input to any specific modeled setting.
Figure 9:
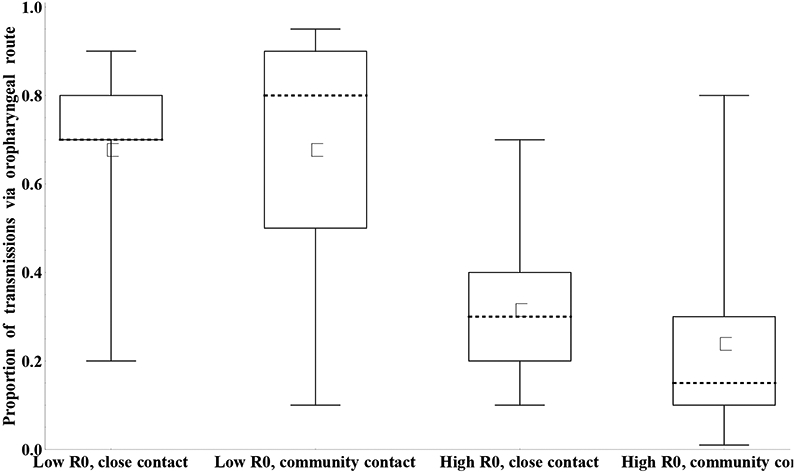
Box plots for the proportion of transmissions (any serotype or strain) that occur via the oropharyngeal mode by basic reproductive number (R0) setting and type of contact. [redone w larger squares]
Waning of immunity to poliovirus excretion as a function of time since last exposure
Although characterization of the recent immunity states represents the critical starting point, we must also characterize the decrease due to waning in protection from re-infection and excretion as a function of time since the last exposure. Numerous studies suggest that antibodies wane,(47-49) and this may impact the immunity to poliovirus infection and excretion. Local, secretory antibodies on mucosal surfaces tend to wane considerably faster than serum antibodies.(25, 50) However, very limited data exist that characterize the long term waning process with respect to virus excretion.(25)
The experts assessed the increase in relative susceptibility to infection and the increase in total virus output if infected as a function of the time s since entering an immunity state (ws(s) and wtv(s)), respectively. A curve that represents this relationship starts at 0 by definition and may increase up to 1 over time, depending on the assessed extent of waning with respect to relative susceptibility. Recognizing the context of very limited data, only 1 expert (I) indicated any differences in the waning process between serotypes, and the elicitation format assumed no difference in the waning process with respect to immunity to WPV and OPV transmission.
Figure 10a summarizes the assessments for the increase in relative susceptibility to poliovirus infection as a result of waning. The impressive variation conveyed in this figure reflects a combination of true uncertainty about the mechanisms of waning, possible variability in the waning process among individuals in the same immunity state, and differences in assumptions of the starting level of relative susceptibility between experts. With respect to the latter source of variation, an expert who assumed a low relative susceptibility value for the recent immunity state might indicate more waning because more protection exists that may wane. In contrast, experts who already indicated a relative susceptibility near 1 for the recent immunity state might feel that little further waning occurs. In this context, Figure 10a excludes assessments from any experts who assessed a relative susceptibility of 1 for the recent immunity state (as indicated by the number of included experts indicated in parentheses after the immunity state in each panel), but some effect of the starting point on the apparent uncertainty in waning may still exist. Figure 10b shows the inferred relative susceptibility values over time, using the relative susceptibility values for the recent immunity states provided by each expert shown in Figure 2. This reduced the visually apparent uncertainty to some extent, and we emphasize that the variation stems both from the waning process itself and from different assumptions about relative susceptibility of the immunity state altogether, independent of waning. For example, for maternally immunes, we observe relatively large variation in relative susceptibility for the recent immunity state (i.e., at birth) and the first months, but very good agreement that relative susceptibility becomes essentially 1 by 12 months. One expert (D) indicated an increase in relative susceptibility of 0.93 by 12 months (with a starting relative susceptibility of 0.8 so that the inferred relative susceptibility at 12 months becomes 0.99) based on the existence of some small level of residual maternal immunity beyond 12 months for measles and the possible effect of similar outliers for poliovirus in places where very high initial titers of maternal antibodies exist (e.g., India). All other experts assumed that after 1 year maternally immunes become completely equivalent to fully susceptibles with respect to relative susceptibility to infection. For the other immunity states, the experts provided assessments of waning on an annual scale. While great uncertainty exists with respect to the shapes of the waning curves (Figure 10a), relatively good agreement exists that relative susceptibility eventually wanes to almost 1 for IPV-induced immunity and a single LPV infection. Less agreement exists about whether individuals with a history of at least 2 LPV infections or IPV and LPV eventually become fully susceptible. Five experts (A, E, G, H, I) indicated that in the long run LPV immunes become essentially identical to IPV immunes. While substantial variation exists in the shapes of the waning curves, the group averages in Figure 10b suggest a phase of relatively rapid waning during the first 5 years, followed by a much more gradual increase in relative susceptibility in the long term.
Figure 10a: Box plots for the increase in relative susceptibility to poliovirus excretion due to waning by immunity state, as a function of time after entering the immunity state. *.
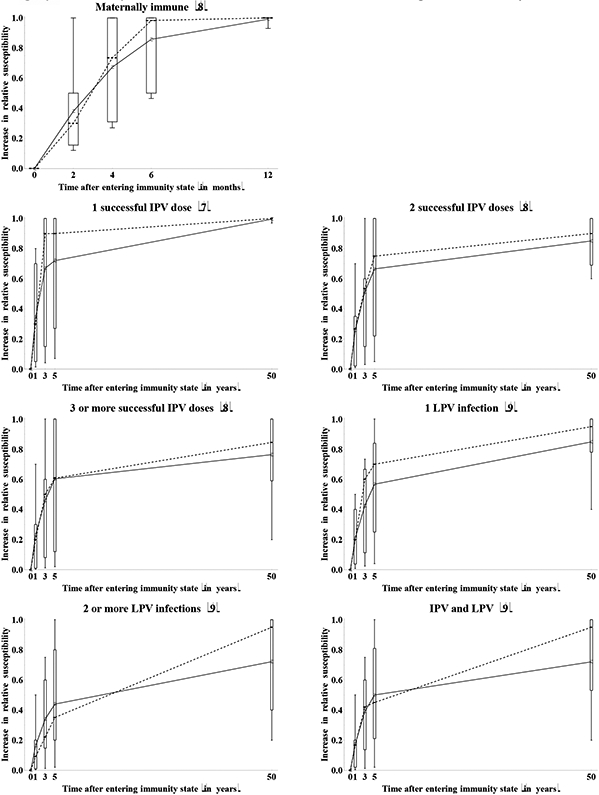
* Numbers in parentheses indicate number of experts who provided an assessment (i.e., those who did not assume relative susceptibility of 1 at the outset).
Figure 10b: Box plots for the inferred relative susceptibility to type 1 poliovirus excretion due to waning by immunity state, as a function of time since entering the immunity state.
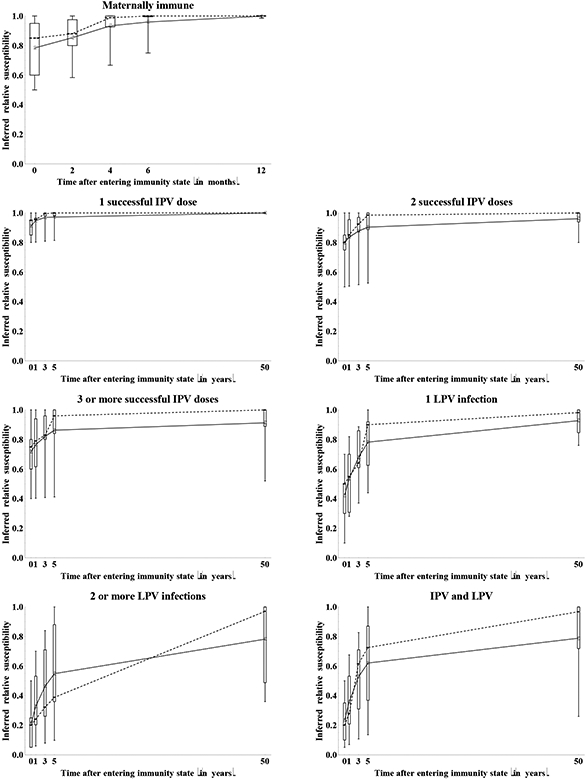
Acronyms: IPV = inactivated poliovirus vaccine; LPV = live poliovirus;
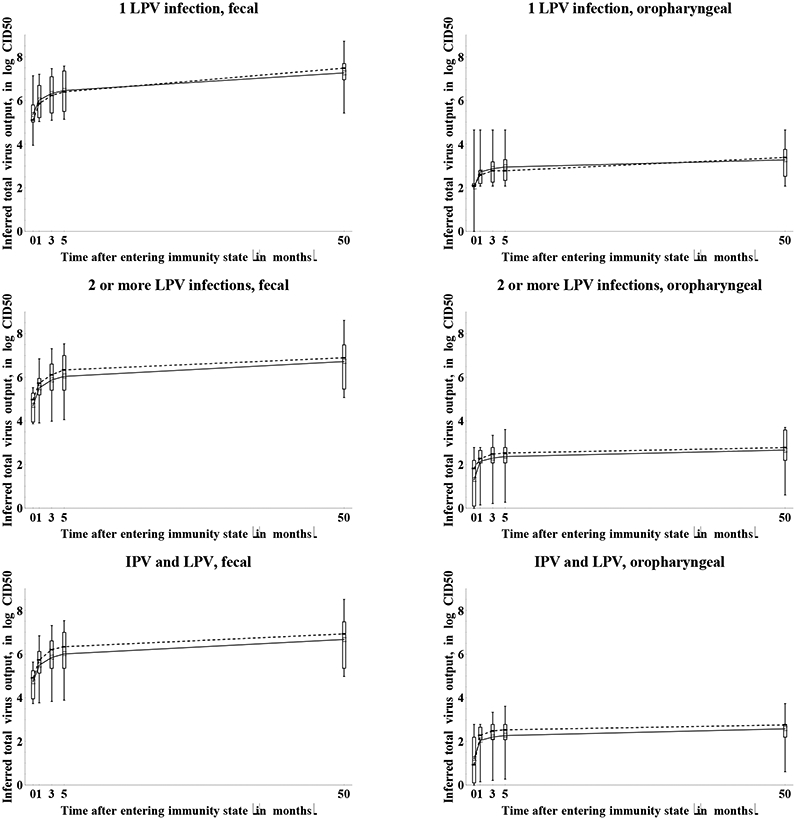
Figure 11 shows both the assessed increase in total virus output and the inferred total virus output over time. Considerations similar to Figure 10 related to the starting values apply to Figure 11 as well. We observe roughly the same waning phases in Figure 11 as in Figure 10 for the average of the assessments, although individual experts provided widely divergent shapes of waning curves. We find similar behavior for maternally immunes as observed for relative susceptibility, with one expert (D) believing that some minimal residual immunity may exist at 12 months of age (as noted above). With respect to total fecal virus output, the experts agree that substantial waning of mucosal immunity occurs during the first years following the last exposure, regardless of the immunity state. However, considerable uncertainty exists as to whether the total fecal virus output eventually reaches the level of fully susceptibles or remains significantly lower. This may reflect unresolved uncertainty related to the ability of humoral immunity, which the group believes persists longer than mucosal immunity, to prevent or reduce fecal excretion in the absence of mucosal immunity, and the unknown effect of an anamnestic response on duration of shedding. Even more uncertainty exists with respect to the total oropharyngeal virus output given infection. Qualitatively, 4 experts (C, E, G, I) believe that immunity to oropharyngeal excretion does not wane at all (except for maternally immunes) based on the belief that oropharyngeal infection may result only from spread of infection from the gut, which serum antibodies or cell-mediated memory immunity can prevent. In contrast, 3 experts (A, D, H) believe that the same mechanisms that reduce fecal excretion (i.e., primarily local antibodies in mucosal sites) also reduce oropharyngeal excretion, implying identical shapes of the waning curves for both excretion modes. The other two experts (B, F) did not explicitly state an assumption one way or the other, but their assessments suggest that individuals with multiple prior LPV infections or successful IPV doses maintain a moderate to very good ability to reduce or avoid oropharyngeal excretion if infected. Indirect evidence from community experience with IPV in developed countries shows that IPV reduces transmission, which suggests that oropharyngeal infections may originate from gut infections and serum antibodies may prevent or reduce susceptibility.(33, 44-46) Despite uncertainties about the mechanisms of waning and the shape of the curves, Figure 11b shows greater uncertainty about the total oropharyngeal virus output in the recent immunity states in many cases than the uncertainty indicated over time. Thus, while not all experts agree whether individuals in recent immunity states excrete any virus from the oropharynx, all experts agree that as time passes after entering the immunity state, individuals from any immunity state can excrete some virus from the oropharynx if infected.
Figure 11a: Box plots for the increase in total type 1 poliovirus output due to waning by immunity state and excretion mode.*.
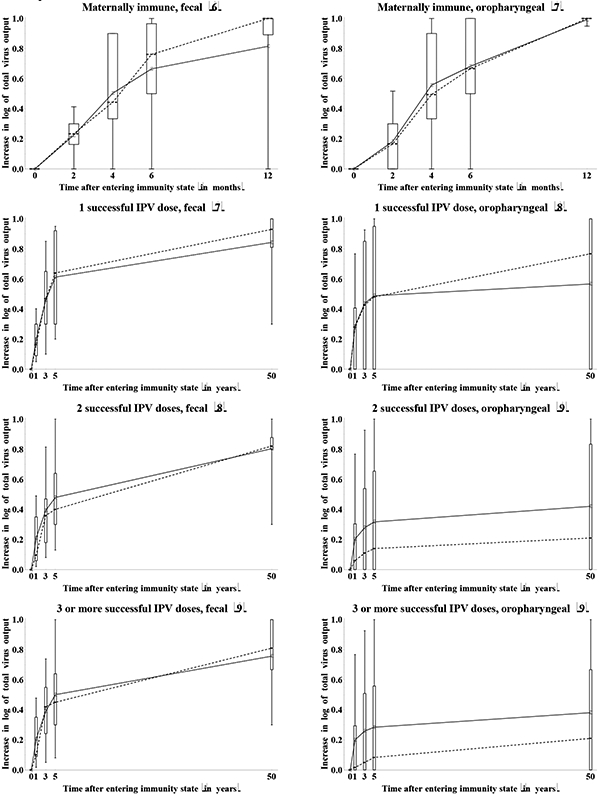
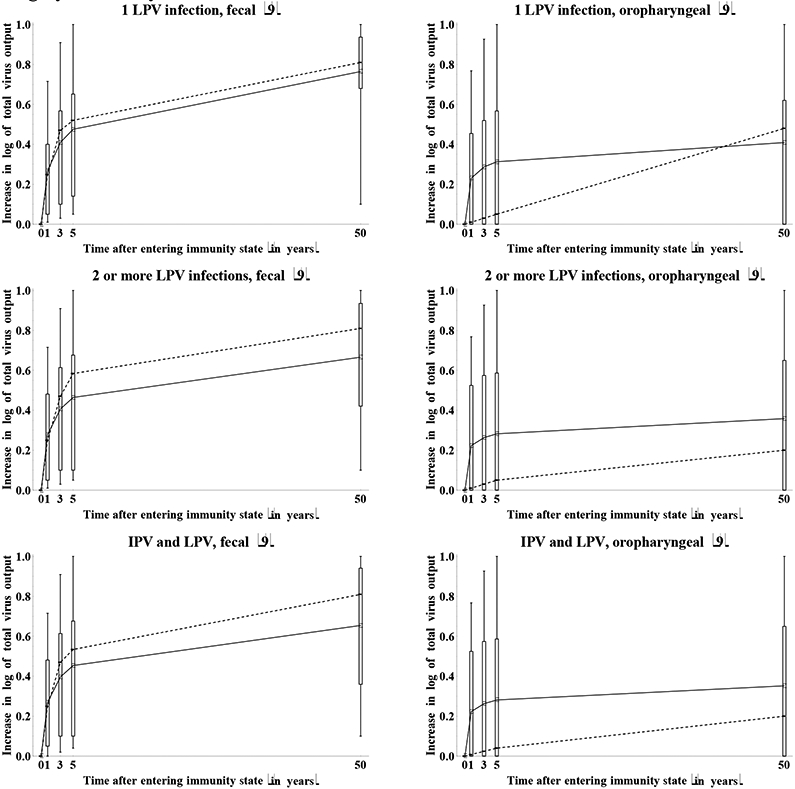
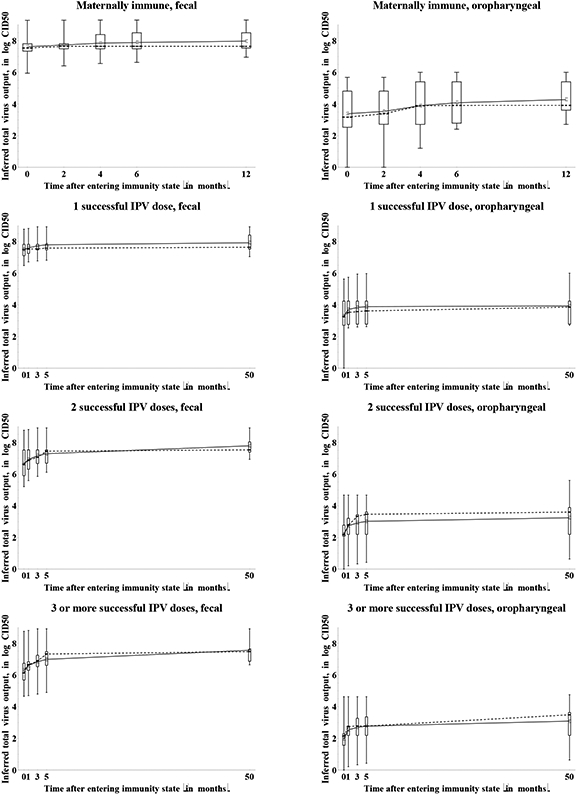
* Numbers in parentheses indicate number of experts who provided an assessment (i.e., those who did not assume relative susceptibility of 1 at the outset).
11b: Box plots for the inferred total WPV type 1 output due to waning by immunity state and excretion mode (assuming daily fecal output of 100 gram and daily oropharyngeal output of 1 milliliter).
Acronyms: CID50 = tissue- or cell-culture infectious doses; IPV = inactivated poliovirus vaccine; LPV = live poliovirus; WPV = wild poliovirus
Figure 12 shows the impact of waning on the assessments of the immunity to poliovirus transmission by mode of transmission in terms of the RTCTs at 0, 4, and 12 months for maternally immunes and 0, 3, and 50 years for all other immunity states. The general pattern suggests good agreement that waning implies an increase in the contribution to transmission for all immunity states. With respect to fecal-oral transmission, the distribution of assessments remains wider for the recent compared to the historic immunity states that do not involve LPV infections, while for individuals with a history of one or more LPV infections, we see wider distributions for the historic compared to the recent immunity states. We observed greater uncertainty about the contribution to oropharyngeal transmission in the recent immunity states (Figure 7), and this uncertainty persists and possibly increases with time after entering the immunity state. These overall results reflect uncertainty both due to lack of data and due to different assumptions by the experts about the mechanisms of oropharyngeal infections and the role of serum antibodies in preventing or reducing excretion from the oropharynx.
Figure 12: Box plots for the relative total contribution to transmission (RTCT) compared to fully susceptibles for type 1 WPV of recent and historic immunity states, by transmission mode. [redone w larger squares].
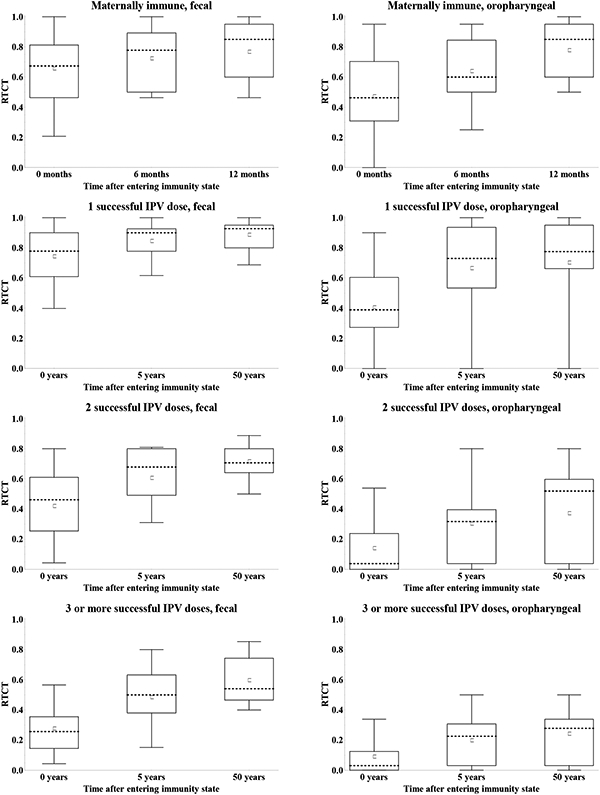
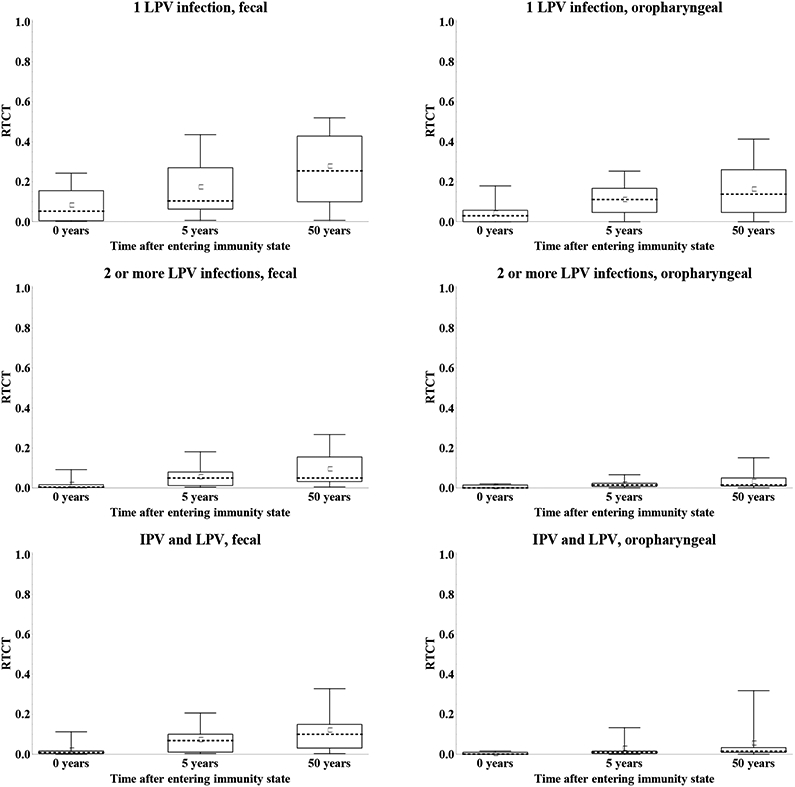
Acronyms: IPV = inactivated poliovirus vaccine; LPV = live poliovirus; WPV = wild poliovirus
Consistent with the majority of experts not expressing serotype differences due to lack of data to support quantification or a belief that any differences remain relatively small we did not find many important serotype differences. Out of a total number of 480 possible serotype comparisons in RTCT values for all the recent and historic immunity states, strains, and excretion modes, only 26 (5%) showed a difference of more than 10% between at least two serotypes for the means or medians from the group. When different, these central values typically suggested higher RTCTs for type 3, followed by type 1, and lowest RTCTs for type 2.
Relative secondary attack rate of OPV vs. WPV
Although we focused on characterizing immunity states, we also reviewed the evidence related to the relative secondary attack rate of OPV vs. WPV,(25) defined as the number of secondary infections generated in contacts of an index OPV infection divided by the number of secondary infections generated in contacts of an index WPV infection in an otherwise identical situation. Multiple studies exists on the frequency of infections among close contacts (households or institutions) of index WPV and OPV infections and a few studies also consider community contacts (e.g., household visitors or the community at large).(25, 51, 52) However, due to limitations in the data (e.g., challenges associated with detecting secondary infections and distinguishing them from tertiary infections, numerous factors affecting transmission to contacts), it remains impossible to make direct comparisons between OPV and WPV studies to assess relative secondary attack rates.(25) Nonetheless, the ability of WPVs to continue to circulate in places throughout the world despite massive OPV use suggests that WPVs remain inherently more transmissible than OPVs excreted by vaccinees, although once an OPV-related virus evolves enough to become a cVDPV, it probably exhibits transmissibility similar to WPVs.(51-53) We note that some of the differences between OPV and WPV in excretion and infectiousness assessed by the experts on those topics (related to Figures 3, 4, and 5) also contribute to the differences in relative transmissibility of OPV vs. WPV, and consequently some dependence exists between the results. However, other factors (e.g., survival in the environment) may also independently affect the assessed differences in transmissibility.
Figure 13 shows the assessments for the relative attack rate of OPV vs. WPV. These assessments suggest important uncertainty for both close and community contacts, with more important differences between WPV and OPV for community contacts. Given that community transmission provides the primary concern for poliovirus transmission models, we expect models may need to calibrate this input to any specific modeled setting. Part of the uncertainty may stem from the fact that secondary attack rates for WPVs (i.e., the reference) vary widely between studies, suggesting significant variability even between homotypic WPV strains.(51) One expert (A) explained his high relative secondary attack rate based on the fact that OPV already eliminated attenuating mutations once excreted by a vaccine recipient, but other experts did not explicitly distinguish between “pure” OPV and excreted OPV, in part because all polioviruses constantly evolve. Laboratory studies suggest that type 1 includes more attenuating mutations, which presumably reduces transmissibility, compared to types 2 and 3,(6, 54, 55) which would explain the observed serotype differences, although two experts (F,H) did not indicate differences in relative secondary attack rates between serotypes.
Figure 13:

Box plots for the relative attack rate of oral poliovirus (OPV) vs. wild poliovirus (WPV) by type of contact and serotype.
DISCUSSION
Despite the large body of literature on poliovirus immunity and transmission,(25) this synthesis of expert assessments revealed numerous important sources of uncertainty. The uncertainties stem from both limitations in the existing studies leading to different interpretations of the data, and complete absence of data on some topics.(25) For example, some important older studies used the original, lower potency IPV preparation or candidate OPV strains available at the time. The impact of repeating such studies with the current, enhanced-potency IPV, Sabin OPV, and/or different laboratory methods remains unknown. Many studies from developing countries remain difficult to interpret due to frequent live poliovirus exposure interfering with study results and low take rates, while studies from developed countries may not generalize to settings of highest interest with respect to polio eradication. Moreover, some studies used tOPV for challenge or did not perform or report serology in a way that facilitated assignment of study arms to the 8 immunity states used for this elicitation.(25)
In addition to true uncertainty related to data limitations, some of the apparent uncertainty may also stem from the complex nature of this elicitation process. We elicited a large number of quantities, and despite extensive iteration on the definition and interpretation of the elicited quantiles, some differences in understanding of the concepts elicited between the experts may persist. For example, we elicited excretion curves (Figures 3 and 4) conditioned on infected subjects and excretors, the relationship between titers and infectiousness scaled to an artificial maximum (Figure 5), and waning curves scaled between recent immunity states and fully susceptibles (Figures 10a and 11b), and this required the experts to make difficult mental adjustments, which may explain some of the differences observed between experts. We also asked the experts to mentally translate data reported by dose to assessments for immunity states conditioned on actual “takes,” which required interpretation and judgment.
Table 1 provides an overview of the key uncertainties identified for each topic, identifies sources of these uncertainties based on insights from this expert review process, and suggests some potential research opportunities that might help to reduce the uncertainties. In most cases, uncertainties derive from the lack of sufficient data or inability to study specific topics, but in a few cases we identified the uncertainty about the topic as arising from different interpretations of the existing limited data. For example, given various studies(25, 56-59) in limited settings that support potentially different conclusions about the effect of maternal antibodies on excretion, experts might weigh the impact of limitations(25) on the conclusions differently. Similarly, in the absence of pre-challenge serology information, experts may attribute a difference in excretion patterns between recipients of 1 and 2 prior doses to a real effect of the second dose, an artifact of poor take of the first dose, or a combination of both. With respect to the concentration of virus excreted over time after the exposure, experts may view gradual decreases of virus titers over time either as the true behavior for each individual or merely as an effect of a greater proportion of non-excretors as a function of time.
Table 1:
Identified uncertainties and potential research opportunities by topic.
| Uncertainty | Source(s) of uncertainty | Research opportunities identified |
|---|---|---|
| Relative susceptibility and excretion pattern over time: | ||
| Validity of challenge model for WPV or VDPV infection | Inability to conduct controlled WPV studies | |
| Effect of inoculum and mode of ingestion | Insufficient data; no good model for alternative ingestion routes | More studies using different challenge doses, alternative administration modes (e.g., spraying) |
| Role of maternal antibodies in preventing or reducing excretion | Different interpretations of existing data; differences between settings (e.g., birth dose in India versus elsewhere) | Challenge of unvaccinated infants, stratified by age and maternal antibody level, including oropharyngeal samples |
| Effect of first LPV infection on excretion | Different interpretations of the existing data | More studies on effect of successive doses, stratified by responders vs. non-responders |
| Effect of single IPV dose on excretion | Inability to measure priming effect | Studies on mechanisms of anamnestic response and development of additional laboratory methods |
| Probability and concentration of oropharyngeal excretion by immunity state | Insufficient data; unknown effect of serum antibodies on oropharyngeal infection | More frequent collection of pharyngeal samples in challenge studies, stratified by antibody levels |
| Concentration of fecal excretion towards the end of the LPV infection | Different interpretations of the existing data | Review of data on fecal virus titers reported for individuals, additional studies as needed |
| Existence of inherent serotype differences | Insufficient data for direct comparisons | More challenges studies with different mOPVs in different arms |
| Effect of IPV-induced antibody titers | Insufficient data directly comparing IPV to fully susceptibles | More extensive challenges studies in LPV-free settings with IPV recipients and susceptibles |
| Duration of latent period | Insufficient data immediately after challenge | More frequent collection and titration of samples during first week in challenge studies |
| Effect of heterologous immunity on excretion | Insufficient data | More challenges studies with arms receiving successive mOPV doses, stratified by responders vs. non-responders |
| Difference in immunity derived from IPV- or LPV-induced maternal antibodies | Challenge studies in newborns in both IPV and OPV-using countries | |
| Relationship between virus excretion and ability to transmit: | ||
| Shape of dose-response relationship | Challenges in studying transmission | More studies on human infectious dose, environmental fate of polioviruses after excretion; typical inoculum in natural exposures |
| Transmission mode (fecal-oral vs. oropharyngeal): | ||
| Contribution of oropharyngeal transmission in low R0 setting and to lesser extent in high R0 setting | Challenges in studying transmission | Research on ability to tell mode of infection from antibodies; household studies in WPV-endemic areas |
| Waning: | ||
| Long term impact of waning on relative susceptibility and total virus output | Insufficient data; unknown ability of serum antibodies to reduce fecal excretion; unknown role of serum antibodies in preventing oropharyngeal excretion | Challenge study of IPV or OPV immunes stratified by time since the last dose, in LPV-free settings; studies of the correlation between serum antibodies and fecal and oropharyngeal excretion, in the absence of mucosal antibodies; longitudinal studies of systemic and mucosal antibodies; studies on mechanisms of anamnestic response |
| Relative transmissibility of OPV vs. WPV: | ||
| Magnitude of difference in transmissibility, especially at the community level | Inability to directly measure transmissibility; instability of live polioviruses leading to large variations (both OPV and WPVs) | Household studies in WPV-endemic areas; epidemiological/modeling studies |
| Serotype and strain differences | Impact of elimination of attenuating mutations on transmissibility | Studies on duration and concentration of excreted virus as a function of degree of reversion, as well as other properties that may affect transmission rather than neurovirulence |
| Overall ability of IPV to reduce transmission: | ||
| Effect of limited intestinal immunity and better oropharyngeal immunity provided by IPV on transmission in high R0 settings | Limited experience with IPV in developing countries | IPV field studies, including demonstration projects and virological surveillance in countries switching from OPV to IPV |
Acronyms: IPV = inactivated poliovirus vaccine; LPV = live poliovirus; mOPV = monovalent OPV; OPV = oral poliovirus vaccine;VDPV = vaccine-derived poliovirus; WPV = wild poliovirus
We believe that studies designed specifically to address uncertainties due to insufficient data or different interpretations of existing data may reduce uncertainty significantly, as shown by the research opportunities. However, some uncertainty stems from practical issues or inherent inabilities to conduct studies. For example, researchers cannot ethically use WPV for studies, but the use of OPV for challenge studies raises questions about the validity of inferences for WPV exposures and makes it impossible to systematically study the differences in transmissibility of OPV vs. WPV. Similarly, the contribution of oropharyngeal transmission remains difficult to study due to challenges in measuring the transmission of asymptomatic infections, establishing the nature of infection in an index infection (i.e., in the gut, oropharynx, or both), and establishing the source of an infecting virus (i.e., fecally- or oropharyngeally-excreted virus). For these uncertainties, we suggest the need to develop better tools to improve our ability to identify and measure the importance of different exposures routes, if possible and appropriate.
We offer some specific insights about the uncertainties and research opportunities for each topic in Table 1. The assessments of relative susceptibility and excretion over time relied on OPV challenge studies, but the validity of extrapolation from these studies to WPV or VDPV infections remains unknown. Specifically, all challenge studies use oral ingestion of the attenuated virus and most assume identical doses in each challenge.(25) No ethical study design exists to study WPV or VDPV infection directly, but studies addressing alternate modes of transmission (e.g., by mimicking the exposure one would get in an oropharyngeal transmission setting using some form of spraying) or different inoculums may address the impact of type of exposure to some extent. Strain differences between WPVs, VDPVs, and OPVs will remain a source of uncertainty and we recognize the need for continued caution in interpreting OPV challenge data and using them as the basis for developing inputs for models. Setting aside these limitations, the existing challenge studies also still leave gaps in our understanding of: (1) the role of maternal antibodies on excretion, (2) the immunity to excretion for recipients of a single dose of IPV or OPV, (3) the probability and concentration of oropharyngeally excreted virus, (4) changes in the concentration of fecal virus excretion as a function of time since the exposure, (5) the existence of serotype differences, (6) the effect on excretion of IPV-induced antibody titers in the absence of a history of LPV infection, which appears limited,(37) and (7) the duration of the latent period. While not explicitly addressed in the expert elicitation, the experts also raised the possible effect of heterologous immunity on excretion as an uncertainty, and the possibility of different immunity derived from maternal antibodies induced by IPV vs. LPV in the mother. Carefully designed challenge studies might help address some of these five data gaps, as shown in the last column of Table 1.
The effect of the concentration of poliovirus excreted on actual transmissions remains perhaps the most difficult knowledge gap to address with empirical studies. While some data exist about the infectious dose required for poliovirus infection,(39) no data appear to exist on the concentration of virus that gets ingested as a function of the concentration of fecally- or oropharyngeally-excreted virus. Nevertheless, this relationship represents a critical step in characterizing immunity states and quantifying population immunity to poliovirus transmission. More basic studies on the human infectious dose for different polioviruses and the environmental fate of polioviruses may help reduce these uncertainties.
The assessments for the proportion of transmissions that occurs via the oropharyngeal mode rely on limited data from the pre-vaccine era, epidemiological observations in IPV-using developed countries, and inferences about the sanitary conditions in different settings. Not surprisingly given the absence of direct measurements, substantial uncertainty exists related to oropharyngeal transmission. The ability to measure the mode of poliovirus transmissions would improve our understanding, and an opportunity may exist to study what different types of antibodies might reveal about the nature of the exposure and spread of the infection within the host. In addition, the experts noted that the evidence derives mostly from household studies or detailed studies carried out in developed countries. Thus, similar studies in developing country settings with known high poliovirus transmissibility might increase our ability to quantify the relative contribution of oropharyngeal transmission in those settings, which represents an important driver of the overall contribution to transmission of IPV immunes in particular.
While the uncertainties related to excretion for recent immunity states primarily results from limits in the existing data, even imperfect data on the effect of waning of immunity on excretion remain sparse. Agreement exists about the relatively rapid decrease in mucosal immunity compared to systemic immunity, but the effect of the more slow waning of systemic immunity on the actual ability to prevent or reduce excretion remains unresolved. This includes both the qualitative role of serum antibodies in limiting excretion and quantitative extent to which waning makes immunes similar to fully susceptibles in terms of their ability to participate in transmission. In addition, the effect of waning with respect to oropharyngeal excretion depends on the role of serum antibodies in preventing oropharyngeal excretion. To address the qualitative differences, studies might explicitly address the correlation between serum antibodies and fecal and oropharyngeal excretion in the absence of mucosal antibodies. Performing OPV challenge studies among both IPV and LPV immunes in an LPV-free setting, stratified by the time since the last dose or infection, might offer the potential to reduce the quantitative uncertainties. Such studies may occur as part of an evaluation of antiviral drugs.
While data mostly from the 1950s and 1960s exist on secondary attack rates for both OPV and WPV,(25, 51, 52) no study provides a direct comparison of OPV and WPV. Designing a study that does so appears very challenging due to ethical and practical issues and the reality that very few places with WPV transmission remain. Therefore, any quantitative assessments must rely on indirect comparisons of secondary attack rates for OPV and WPV and inferences from epidemiological observations, laboratory experiments, genetic, and phenotypic differences between virus strains. While many studies on OPV phenotypes focus on properties related to neurovirulence, a greater focus on properties that might affect transmission would improve our understanding of this topic. These properties include duration and concentration of excretion, survival on fomites and in the environment, and human infectious doses. We recognize that these properties remain challenging to study, but advances in this area could help characterize the mechanisms of emergence of VDPVs in different conditions. Modeling might provide an approach to integrate the available evidence to explore consistency between assumptions and observations.
Although our review focused largely on challenge studies, significant questions remain about the behavior of IPV use in outbreak situations and in developing countries, and large IPV field studies may provide essential data that we cannot obtain from small-scale challenge studies. The lack of epidemiological evidence and experience leads to uncertainty about the ability of IPV impact intestinal immunity and stop transmission in high R0 countries.(60) Opportunities exist to learn from the current shift of countries to IPV, particularly by developing studies to detect the circulation of any OPV-related viruses that may circulate in IPV-using areas that share borders with OPV-using areas. Studies of community-wide switches from OPV to IPV could significantly improve our understanding of the impact of IPV on the dynamics of community transmission of LPVs.
The relative importance of uncertainties in model inputs depends on their impact on the overall uncertainties of model outputs.(61) We emphasize that the model output and importance of uncertainties will depend on the policy question addressed by the model, and consequently prioritization of the research opportunities in a broad sense will depend on prioritization of policy questions. Nonetheless, we expect that given the very important impact of waning on population immunity up until and after OPV cessation, improved characterization of waning represents a high priority for research. Similarly, the role of IPV-induced antibodies on excretion and the role of oropharyngeal transmission in overall infection transmission represent major uncertainties that will affect immunization policies going forward, which we expect also suggests some urgency. Finally, the uncertainties surrounding the evolution of OPVs remain critical to designing appropriate outbreak response policies for the post-eradication era. We note that the prioritization of research and actual delivery of research results must align for the research to provide real value to policy makers. For example, we might initiate long-term studies of waning now that promise results in decades, and while this might prove useful, such studies do not promise to help inform current or near-future policies. Thus, we suggest that future studies will need to consider the value of the information of potential research proposals in the context of informing actual policy decisions and improving our basic scientific understanding of poliovirus immunity and transmission in order to establish clear priorities. We hope that the results presented here will help researchers and policy makers appreciate the impact of some of the current uncertainties and potential high level opportunities for addressing them.
In terms of using the assessments to inform models, we believe that this process provides a valuable synthesis of the current state of the evidence, reflects consensus about some model inputs, and clear areas of uncertainty. This elicitation process explicitly identified study limitations and asked experts to factor these into their assessments. While we present the range in the best assessments from the group, we did not attempt to derive uncertainty characterizations in terms of “consensus” probability distributions.(26-28, 30) Nevertheless, for some of the inputs the experts clearly identified the absence of good data as a limitation and emphasized their level of uncertainty. Future models using the results from this elicitation must reflect the uncertainty expressed qualitatively in the process by presenting the impact of different model input assumptions. This became especially apparent in the discussions related to transmission rather than inherent immunity. It may prove inappropriate to assume a single, average relationship between excretion and infectiousness for all settings, which would imply the need to calibrate the relationship to specific settings. The relative importance of oropharyngeal transmission and the relative R0 of OPV vs. WPV emerged as key transmission-related quantities for which no good data exist to inform assessments, which modelers will need to consider in conjunction with their characterization of the absolute infectiousness to others typically captured by R0 or more detailed transmission characterizations.
This process provided a valuable overview of the state of the evidence related to poliovirus immunity and transmission and quantitative expert assessments of key poliovirus transmission model inputs. Combining this information with data on costs will help make key programmatic decisions based on the consensus of the evidence and uncertainty. These decisions include choices to manage population immunity using the available tools (mOPVs, bOPV, tOPV, IPV) in different settings and formulating optimal outbreak response strategies in different time periods until and after eradication. In addition, this synthesis identified key knowledge gaps as well as a number of possible studies to address these knowledge gaps. We emphasize the need to balance the costs and ethical considerations of such studies against their potential to reduce important uncertainties and improve our ability to make informed decisions.
Supplementary Material
ACKNOWLEDGMENTS
We thank the U.S. Centers for Disease Control and Prevention (CDC) for its support of the work described in this manuscript by hosting the expert meeting mentioned in the manuscript and providing financial support to Kid Risk, Inc. under Contract 200-2010-M-33379. The contents of this manuscript are solely the responsibility of the authors and do not necessarily represent the official views of the CDC or the World Health Organization. We thank Drs. Walter Dowdle, Olen Kew, and Walter Orenstein for helpful comments.
LIST OF ABBREVIATIONS
- bOPV
bivalent oral poliovirus vaccine
- CID50
tissue- or cell-culture infectious dose
- CDC
US Centers for Disease Control and Prevention
- cVDPV
circulating vaccine-derived poliovirus
- FS
fully susceptible (immunity state)
- IPV
inactivated poliovirus vaccine
- IPV1
1 successful IPV dose (immunity state)
- IPV2
2 successful IPV doses (immunity state)
- IPV3
3 or more successful IPV doses (immunity state)
- IPVLPV
IPV and LPV (i.e., one or more successful IPV doses and 1 or more LPV infections) (immunity state)
- iVDPV
immunodeficient vaccine-derived poliovirus
- LPV
live poliovirus (i.e., WPV, OPV, or VDPV)
- LPV1
1 LPV infection (immunity state)
- LPV2
2 or more LPV infections (immunity state)
- mOPV
monovalent oral poliovirus vaccine (generic term)
- mOPV1,2,3
monovalent oral poliovirus vaccine types 1,2,3, respectively
- OPV
oral poliovirus vaccine (generic term)
- tOPV
trivalent oral poliovirus vaccine
- R0
basic reproductive number
- VDPV
vaccine-derived poliovirus (generic term)
- WPV
wild poliovirus (generic term)
- WPV1,2,3
wild poliovirus type 1,2,3, respectively
REFERENCES
- 1.World Health Organization. Global Polio Eradication Initiative - Strategic Plan 2010-2012. Geneva; 2010. Report No.: WHO/Polio/10.01. [Google Scholar]
- 2.Aylward RB, Sutter RW, Heymann DL. OPV cessation--the final step to a "Polio-free" World. Science 2005;310(5748):625–626. [DOI] [PubMed] [Google Scholar]
- 3.World Health Organization. Polio eradication initiative. Cessation of routine oral polio vaccine (OPV) use after global polio eradication Framework for national policy makers in OPV-using countries. Geneva, Switzerland; 2005. Report No.: WHO/POL/05.02. [Google Scholar]
- 4.World Health Assembly. Poliomyelitis: Mechanism for management of potential risks to eradication (resolution 61.1). Geneva: World Health Organization; 2008. [Google Scholar]
- 5.Thompson KM, Pallansch MA, Duintjer Tebbens RJ, Wassilak SG, Kim J-H, Cochi SL. Pre-eradication vaccine policy options for poliovirus infection and disease control (in preparation). Boston: Kid Risk, Inc.; 2010. [DOI] [PMC free article] [PubMed] [Google Scholar]
- 6.Kew OM, Sutter RW, de Gourville E, Dowdle WR, Pallansch MA. Vaccine-derived polioviruses and the endgame strategy for global polio eradication. Annual Review of Microbiology 2005;59:587–635. [DOI] [PubMed] [Google Scholar]
- 7.Sangrujee N, Duintjer Tebbens RJ, Cáceres VM, Thompson KM. Policy decision options during the first 5 years following certification of polio eradication. Medscape General Medicine 2003;5(4):35. [PubMed] [Google Scholar]
- 8.Eichner M, Dietz K. Eradication of poliomyelitis: When can one be sure that polio virus transmission has been terminated? American Journal of Epidemiology 1996;143(8):816–822. [DOI] [PubMed] [Google Scholar]
- 9.Kalkowska DA, Duintjer Tebbens RJ, Thompson KM. The probability of undetected wild poliovirus circulation after apparent global interruption of transmission (in press). American Journal of Epidemiology 2011. [DOI] [PubMed] [Google Scholar]
- 10.Duintjer Tebbens RJ, Pallansch MA, Kew OM, Cáceres VM, Jafari H, Cochi SL, Aylward RB, Thompson KM. Risks of paralytic disease due to wild or vaccine-derived poliovirus after eradication. Risk Analysis 2006;26(6): 1471–1505. [DOI] [PubMed] [Google Scholar]
- 11.Fine PEM. Herd immunity: History, theory, practice. Epidemiologic Reviews 1993;15(2):265–302. [DOI] [PubMed] [Google Scholar]
- 12.Fox JP, Gelfand HM, LeBlanc DR, Rowan DF. The influence of natural and artificially induced immunity on alimentary infections with polioviruses. American Journal of Public Health 1958;48(9): 1181–1192. [DOI] [PMC free article] [PubMed] [Google Scholar]
- 13.Sutter RW, Kew OM, Cochi SL. Poliovirus vaccine-live In: Plotkin SA, Orenstein WA, Offit PA, editors. Vaccines. Fifth ed: Saunders Elsevier; 2008. p. 631–686. [Google Scholar]
- 14.Duintjer Tebbens RJ, Pallansch MA, Kew OM, Sutter RW, Aylward RB, Watkins M, Gary HE Jr., Alexander JP Jr., Jafari H, Cochi SL, Thompson KM. Uncertainty and sensitivity analyses of a decision analytic model for post-eradication polio risk management. Risk Analysis 2008;28(4):855–876. [DOI] [PubMed] [Google Scholar]
- 15.Thompson KM, Duintjer Tebbens RJ, Pallansch MA, Kew OM, Sutter RW, Aylward RB, Watkins M, Gary HE Jr., Alexander JP Jr., Jafari H, Cochi SL. The risks, costs, and benefits of possible future global policies for managing polioviruses. American Journal of Public Health 2008;98(7): 1322–1330. [DOI] [PMC free article] [PubMed] [Google Scholar]
- 16.Duintjer Tebbens RJ, Pallansch MA, Alexander JP Jr., Thompson KM. Optimal vaccine stockpile design for an eradicated disease: Application to polio. Vaccine 2010;28(26):4312–4327. [DOI] [PubMed] [Google Scholar]
- 17.Duintjer Tebbens RJ, Pallansch MA, Kew OM, Cáceres VM, Sutter RW, Thompson KM. A dynamic model of poliomyelitis outbreaks: Learning from the past to help inform the future. American Journal of Epidemiology 2005;162(4):358–372. [DOI] [PubMed] [Google Scholar]
- 18.Thompson KM, Duintjer Tebbens RJ. The case for cooperation in managing and maintaining the end of poliomyelitis: Stockpile needs and coordinated OPV cessation. The Medscape Journal of Medicine 2008; 10(8): 190. [PMC free article] [PubMed] [Google Scholar]
- 19.Thompson KM, Duintjer Tebbens RJ. Using system dynamics to develop policies that matter: Global management of poliomyelitis and beyond. System Dynamics Review 2008;24(4):433–449. [Google Scholar]
- 20.Thompson KM, Duintjer Tebbens RJ, Pallansch MA, Kew OM, Sutter RW, Aylward RB, Watkins M, Gary HE Jr., Alexander JP Jr., Venczel L, Johnson D, Cáceres VM, Sangrujee N, Jafari H, Cochi SL. Development and consideration of global policies for managing the future risks of poliovirus outbreaks: Insights and lessons learned through modeling. Risk Analysis 2006;26(6): 1571–1580. [DOI] [PubMed] [Google Scholar]
- 21.Thompson KM, Duintjer Tebbens RJ, Pallansch MA. Evaluation of response scenarios to potential polio outbreaks using mathematical models. Risk Analysis 2006;26(6):1541–1556. [DOI] [PubMed] [Google Scholar]
- 22.Thompson KM, Duintjer Tebbens RJ. Eradication versus control for poliomyelitis: An economic analysis. Lancet 2007;369(9570): 1363–1371. [DOI] [PubMed] [Google Scholar]
- 23.Eichner M, Hadeler KP. Deterministic models for the eradication of poliomyelitis: Vaccination with the inactivated (IPV) and attenuated (OPV) polio virus vaccine. Mathematical Biosciences 1995; 127(2): 149–66. [DOI] [PubMed] [Google Scholar]
- 24.Eichner M, Hadeler KP, Dietz K. Stochastic models for the eradication of poliomyelitis: Minimum population size for polio virus persistence In: Isham V, Medley GF, editors. Models for infectious human diseases: Their structure and relation to data. New York: Cambridge University Press; 1996. p. 315–27. [Google Scholar]
- 25.Duintjer Tebbens RJ, Pallansch MA, Chumakov KM, Halsey NA, Hovi T, Minor PD, Modlin JF, Patriarca PA, Sutter RW, Wright PF, Wassilak SGF, Cochi SL, Kim J-H, Thompson KM. Expert review on poliovirus immunity and transmission. Risk Analysis:In Press. [DOI] [PMC free article] [PubMed] [Google Scholar]
- 26.Mallor F, Garcia-Olaverri C, Gomez-Elvira S, Mateo-Collazas P. Expert judgment-based risk assessment using statistical scenario analysis: A case study-running the bulls in pamplona (Spain). Risk Analysis 2008;28(4): 1003–19. [DOI] [PubMed] [Google Scholar]
- 27.Van der Fels-Klerx HJ, Cooke RM, Nauta MN, Goossens LH, Havelaar AH. A structured expert judgment study for a model of Campylobacter transmission during broiler-chicken processing. Risk Analysis 2005;25(1): 109–24. [DOI] [PubMed] [Google Scholar]
- 28.Otway H, von Winterfeldt D. Expert judgment in risk analysis and management: Process, context, and pitfalls. Risk Analysis 1992; 12(1):83–93. [DOI] [PubMed] [Google Scholar]
- 29.Elmer F, Seifert I, Kreibich H, Thieken AH. A delphi method expert survey to derive standards for flood damage data collection. Risk Analysis;30(1):107–24. [DOI] [PubMed] [Google Scholar]
- 30.Cooke RM. Experts in uncertainty: Opinion and subjective probability in science. New York: Oxford University Press; 1991. [Google Scholar]
- 31.Bernier RH. Some observations on poliomyelitis lameness surveys. Reviews of Infectious Diseases 1984;6 Suppl 2:S371–S375. [DOI] [PubMed] [Google Scholar]
- 32.Nathanson N, Kew OM. From emergence to eradication: The epidemiology of poliomyelitis deconstructed. American Journal of Epidemiology 2011; 172(11): 1213–1229. [DOI] [PMC free article] [PubMed] [Google Scholar]
- 33.Plotkin SA, Vidor E. Poliovirus vaccine -- inactivated In: Plotkin SA, Orenstein WA, Offit PA, editors. Vaccines. Fifth ed: Saunders Elsevier; 2008. [Google Scholar]
- 34.Melnick JL. Poliovirus and other enteroviruses In: Evans AS, Kaslow RA, editors. Viral infections of humans: Epidemiology and control. 4th ed. New York: Plenum Medical; 1997. p. 583–663. [Google Scholar]
- 35.Anderson RM, May RM. Infectious diseases of humans: Dynamics and control. New York: Oxford University Press; 1991. [Google Scholar]
- 36.Ghendon YZ, Sanakoyeva II. Comparison of the resistance of the intestinal tract to poliomyelitis virus (Sabin's strains) in persons after naturally and experimentally acquired immunity. Acta Virologica 1961;5:265–73. [Google Scholar]
- 37.The Cuba IPV Study Collaborative Group. Randomized, placebo-controlled trial of inactivated poliovirus vaccine in Cuba. New England Journal of Medicine 2007;356(15): 1536–1544. [DOI] [PubMed] [Google Scholar]
- 38.Marine WM, Chin TD, Gravelle CR. Limitation of fecal and pharyngeal poliovirus excretion in Salk-vaccinated children. A family study during a type 1 poliomyelitis epidemic. American Journal of Hygiene 1962;76:173–195. [DOI] [PubMed] [Google Scholar]
- 39.Dowdle WR, Van der Avoort HGAM, de Gourville EM, Delpeyroux F, Deshpande JM, Hovi T, Martín J, Pallansch MA, Kew OM, Wolff C. Containment of polioviruses after eradication: Characterizing risk to improve management. Risk Analysis 2006;26(6): 1449–1469. [DOI] [PubMed] [Google Scholar]
- 40.Glezen PW, McCollough RH, Lamb GA, Chin TDY. Quantitative relationship of preexisting homotypic antibodies to excretion of poliovirus types 1, 2, and 3 following the feeding of trivalent attenuated poliovirus vaccine. American Journal of Epidemiology 1969;90(2): 146–156. [DOI] [PubMed] [Google Scholar]
- 41.Glezen WP, Lamb GA, Belden EA, Chin TD. Quantitative relationship of preexisting homotypic antibodies to the excretion of attenuated poliovirus type 1. American Journal of Epidemiology 1966;83(2):224–237. [DOI] [PubMed] [Google Scholar]
- 42.Kogon A, Sigland I, Elveback LR, Fox JP. Oral poliovirus vaccination in middle income families. American Journal of Epidemiology 1965;82(1): 14–26. [Google Scholar]
- 43.Pagano JS, Böttiger M, Bonnevier JO, Gard S. The response and the lack of spread in Swedish school children given an attenuated poliovirus vaccine prepared in human diploid cell strain. American Journal of Hygiene 1964;79:74–85. [DOI] [PubMed] [Google Scholar]
- 44.Oostvogel P, van Wijngaarden J, van der Avoort HG, Mulders MN, Conyn-van Spaendonck MA, Rümke H, van Steenis G, van Loon AM. Poliomyelitis outbreak in an unvaccinated community in the Netherlands, 1992–3. The Lancet 1994;344(8923):665–70. [DOI] [PubMed] [Google Scholar]
- 45.Böttiger M The elimination of polio in the Scandinavian countries. Public Health Reviews 1993;21(1-2):27–33. [PubMed] [Google Scholar]
- 46.Lapinleimu K Elimination of poliomyelitis in Finland. Reviews of Infectious Diseases 1984;6(Suppl 2):S457–S460. [DOI] [PubMed] [Google Scholar]
- 47.Böttiger M Polio immunity to killed vaccine: An 18-year follow-up. Vaccine 1990;8(5):443–445. [DOI] [PubMed] [Google Scholar]
- 48.Pirez MC, Olivera I, Diabarboure H, Montano A, Baranano R, Badia F, Bonnet MC. Seroprevalence of anti-polio antibodies in a population 7 months to 39 years of age in Uruguay: Implications for future polio vaccination strategies. Vaccine 2009;27(20):2689–2694. [DOI] [PubMed] [Google Scholar]
- 49.Faden H, Duffy L, Sun M, Shuff C. Long-term immunity to poliovirus in children immunized with live attenuated and enhanced-potency inactivated trivalent poliovirus vaccines. Journal of Infectious Diseases 1993;168(2):452–454. [DOI] [PubMed] [Google Scholar]
- 50.Ogra PL, Fishaut M, Gallagher MR. Viral vaccination via the mucosal routes. Reviews of Infectious Diseases 1980;2:352–369. [DOI] [PubMed] [Google Scholar]
- 51.Fine PE, Carneiro IA. Transmissibility and persistence of oral polio vaccine viruses: Implications for the global poliomyelitis eradication initiative. American Journal of Epidemiology 1999; 150(10): 1001–1021. [DOI] [PubMed] [Google Scholar]
- 52.Fine PEM, Carneiro IAM. Transmissibility and persistence of oral poliovirus vaccine viruses: Implications for the global poliomyelitis eradication initiative. London: Infectious Disease Epidemiology Unit, Department of Infectious and Tropical Diseases, London School of Hygiene; 1998. May. [Google Scholar]
- 53.Estivariz CF, Watkins M, Handoko D, Rusipah R, Deshpande J, Rana BJ, Irawan E, Widhiastuti D, Pallansch MA, Thapa A, Imari S. A large vaccine-derived poliovirus outbreak on Madura island--Indonesia, 2005. Journal of Infectious Diseases 2008;197(3):347–54. [DOI] [PubMed] [Google Scholar]
- 54.Chumakov K, Ehrenfeld E, Wimmer E, Agol VI. Vaccination against polio should not be stopped. Nat Rev Microbiol 2007;5(12):952–8. [DOI] [PubMed] [Google Scholar]
- 55.Minor PD. The molecular biology of poliovaccines. Journal of General Virology 1992;73(pt. 12):3065–3077. [DOI] [PubMed] [Google Scholar]
- 56.John TJ, Jain H, Ravishankar K, Amaresh A, Verma H, Deshpande J, Pallansch MA, Singh AP, Sreevatsava M, Burton A, Malankar P, Chatterjee A, Sutter RW. Monovalent type 1 oral poliovirus vaccine among infants in India: Report of two randomized double-blind controlled clinical trials. Vaccine 2011;29(34):5793–5801. [DOI] [PubMed] [Google Scholar]
- 57.Plotkin SA, Lebrun A, Koprowski H. Vaccination with the chat strain of type 1 attenuated poliomyelitis virus in leopoldville. Belgian congo. 2. Studies of the safety and efficacy of vaccination. Bull World Health Organ 1960;22:215–34. [PMC free article] [PubMed] [Google Scholar]
- 58.Plotkin SA, Pagano JS, Koprowski H. Vaccination of full-term infants with attenuated polioviruses. 2nd International Conference on Live Poliomyelitis Vaccines Washington, D.C.: Pan American Health Organization; 1960. p. 294–301. [Google Scholar]
- 59.Sutter RW, John TJ, Jain H, Agarkhedkar S, Ramanan PV, Verma H, Deshpande JM, Singh AP, Sreevatsava M, Malankar P, Burton A, Chatterjee A, Jafari H, Aylward RB. Immunogenicity of bivalent types 1 and 3 oral poliovirus vaccine: A randomised, double-blind, controlled trial. The Lancet 2010;376(9753): 1682–1688. [DOI] [PubMed] [Google Scholar]
- 60.Thompson KM, Wallace GS, Duintjer Tebbens RJ, Smith PH, Barskey AE, Pallansch MA, Gallagher KM, Alexander JP, Armstrong GL, Cochi SL, Wassilak SG. Trends in the risk of u.S. Polio outbreaks and poliovirus vaccine availability for response. Public Health Reports 2012;127(1):23–37. [DOI] [PMC free article] [PubMed] [Google Scholar]
- 61.Duintjer Tebbens RJ, Thompson KM, Hunink M, Mazzuchi TM, Lewandowski D, Kurowicka D, Cooke RM. Uncertainty and sensitivity analyses of a dynamic economic evaluation model for vaccination programs. Medical Decision Making 2008;28(2): 182–200. [DOI] [PubMed] [Google Scholar]
Associated Data
This section collects any data citations, data availability statements, or supplementary materials included in this article.