Abstract
A comparison between fatigue precracked and sharp-notched Charpy-type fracture toughness specimens is presented for characterizing the elastic-plastic fracture toughness of Ti-6Al-4V parts (produced by electron beam melting, a powder bed fusion method). The effects of processing and postprocessing conditions on crystallographic texture, grain morphology, and elastic-plastic fracture toughness of additively manufactured Ti-6Al-4V parts are currently under investigation at the National Institute of Standards and Technology (NIST) in Boulder, Colorado. The specimens tested in this work were subjected to hot isostatic pressing (HIP) for 2 h at 900°C and 100 MPa in Argon environment (sub-β transus HIP), which is a commercial postprocessing step known to seal internal porosity in additively manufactured Ti-6Al-4V parts. Lack-of-fusion (LoF) pores were still visible after HIP treatment. These specific pores were exposed to the external surfaces and were thus immune to HIP treatment. In this work, the following variables and their effects on room temperature fracture toughness (measured by means of three-point-bending unloading compliance tests on Charpy-type specimens) were specifically addressed: notch configuration (fatigue precrack vs. sharp electrodischarge machining notch), specimens directly attached to the build plate (nonsupported) vs. connected to the build plate using standard thin wafer supports (supported), and LoF content. The results of this preliminary investigation will guide the choices for the remaining fracture toughness characterization of Ti-6Al-4V under various processing and postprocessing conditions.
Keywords: additive manufacturing, Charpy-type specimen, fatigue precrack, fracture toughness, gas pores, hot isostatic pressing, lack-of-fusion pores, sharp notch, Ti-6Al-4V
Introduction
Additive manufacturing (AM), also known as three-dimensional (3D) printing, is a process in which material is joined or solidified under computer control to create a 3D object, with material typically being added together (such as liquid molecules or powder grains being fused together) layer by layer. In the 1990s, 3D printing was considered only suitable for producing functional or aesthetical prototypes. Nowadays, the precision, repeatability, and material range have increased to the point that 3D printing, or AM, is considered an industrial production technology.
The sale of AM products and services is projected to exceed US$6.5 billion worldwide by 2019.1 To enable use of metal AM in fatigue and fracture applications, a recent National Institute of Standards and Technology (NIST)/ASTM workshop2 identified the need for a deeper understanding of fatigue and fracture behavior of these materials through detailed investigations of processing-structure-property-performance relationships.
This paper reports on a preliminary investigation conducted at the NIST to establish the optimal conditions for conducting elastic-plastic fracture toughness tests on Charpy-type bend specimens of AM Ti-6Al-4V (in short, Ti64). In particular, the possibility to use a very sharp electrical discharge machining (EDM) notch in place of a fatigue precrack (FPC) has been investigated.
Material Parameters
In the present work, AM Ti64 was investigated in the following conditions.
Specimens were fabricated by electron beam melting powder bed fusion (Arcam3 A1, software version 3.2.132; accelerating voltage was 60 kV, layer thickness was 50 μm, and speed factor was 35) from gas-atomized powder (the particle size range was approximately 40 to 100 μm, and the average particle size was 70 μm).
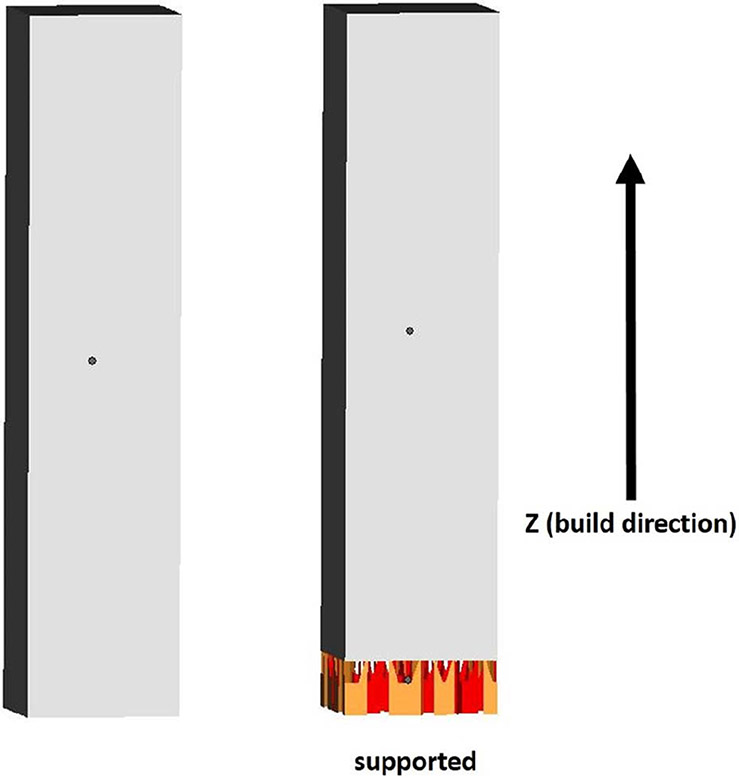
Charpy build volumes were developed in the vertical orientation (longest dimension parallel to build direction) either connected to the build plate using 5-mm-long standard thin wafer supports (supported, S) or directly attached to the build plate (nonsupported, N). A sketch showing an example of nonsupported vs. supported specimens is shown in figure 1.
A scan length of 84 mm was used. Scan length is a manufacturer-specific parameter that corresponds to the distance the electron beam travels on a single track before turning around to begin the next track and has been shown to determine energy density and to affect texture.* Note that the scan length considered here is an extreme case (the recommended maximum value is around 80 mm), and the initial intention was just to slightly push the limits of the build parameters. This extreme value, which caused an instability in the melting conditions, is expected to affect overall material quality and part density because of the presence of a significant lack-of-fusion (LoF) pores.4 However, this is to be regarded as a preliminary investigation on the fracture toughness of AM Ti64 in a condition affected by significant LoF pores. Additional tests on shorter scan lengths and different manufacturing parameters will be reported in a future publication. Also, note that not all parts produced with a scan length of 84 mm contained significant LoF porosity.
All specimens were subjected to hot isostatic pressing (HIP) after fabrication, which is known to reduce internal gas porosity but has no effect on defects that are open to the surface of a given AM part. The sub-β transus HIP cycle (900°C, 200 MPa) was applied to seal the internal gas porosity. This cycle is not expected to drastically change the crystallographic texture.5
Two different notch configurations were considered: FPC and sharp-notched (SN) specimens. In the former configuration, an actual crack was produced at the bottom of the machined V-notch by fatigue cycling the specimen in three-point bending on a universal tensile machine; in the latter, a very sharp notch was machined by EDM by the use of a thin wire (diameter ≈ 0.13 mm). In a previous investigation,6 SN and FPC specimens were shown to provide similar toughness properties for several high-toughness steels (API X65, API X100, maraging 18Ni, AISI 4340, AISI 9310) and a nickel alloy (Inconel 625). The use of SN specimens can make toughness testing significantly simpler and cheaper by eliminating the need to precrack the specimens.
FIG. 1.
Sketch of nonsupported (left) and supported (right) build volumes.
Experimental and Analytical Considerations
Twelve Charpy-type specimens (length = 55 mm, cross-section dimensions = 10 mm), half of which were FPC specimens and the other half were SN specimens, were tested at room temperature (21°C ± 2°C). For both notch configurations, the initial crack size (machined notch + FPC for FPC specimens, machined notch for SN) was nominally 4.5 mm. All specimens were side-grooved for a total thickness reduction of 20 % (1 mm per side). Sketches of the two types of specimen (FPC and SN) are provided in figure 2.
FIG. 2.
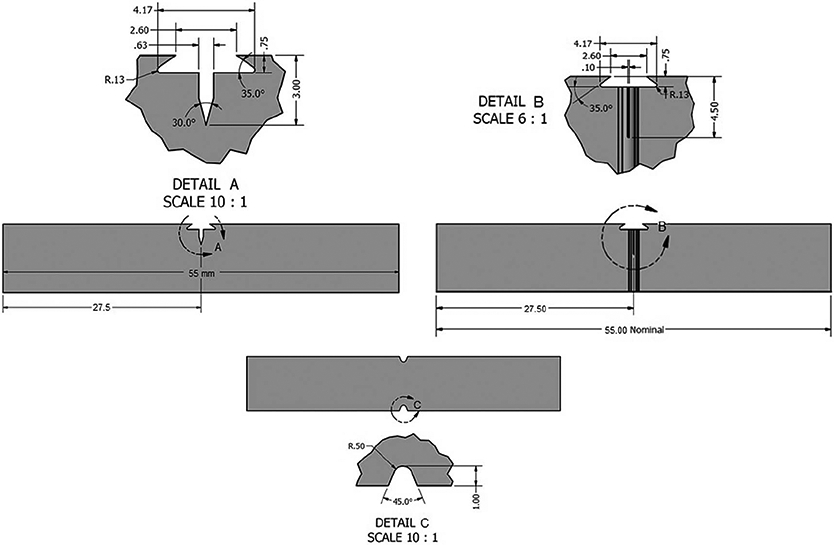
Configuration of the FCG specimens (before precracking) (left) and of the SN specimens (right) (shown with side grooves).
Six specimens (three FPC and three SN) were nonsupported, and the remaining six were supported. The test matrix is provided in Table 1.
TABLE 1.
Test matrix for the elastic-plastic fracture toughness tests on AM Ti64
| Notch Configuration | N/S | Specimens Tested |
|---|---|---|
| FPC | N | A, B, C |
| S | A, B, C | |
| SN | N | A, B, C |
| S | A, B, C |
Note: N = nonsupported; S = supported.
Tests were conducted in accordance with ASTM E1820-18ae1, Standard Test Method for Measurement of Fracture Toughness,7 by means of the elastic compliance (EC) single-specimen technique, which allows calculation of the crack size based on the slope of unloading-reloading cycles. In the analysis of unloading-reloading cycles, the recommendations of Appendix X3 of ASTM E1820-18a were followed (only unload compliances used, after discarding the first and last 5 % of the cycle). Additional analyses of the tests were performed by means of the normalization data reduction (NDR) technique (described in Annex A15 of ASTM E1820-18ae1). After testing, specimens were heat-tinted for 1 hour at 400°C and then broken in liquid nitrogen to expose the fracture surface for crack size measurements.
Besides the critical value of the J-integral at crack initiation (JQ) and the crack resistance curve (J-R curve), an additional parameter was calculated for each test: the tearing modulus, TM, which was originally proposed by Paris et al.8 and has been sometimes used as a quantitative measure of a material’s resistance to crack propagation:
| (1) |
where E is Young’s modulus, σY is the flow stress (average of yield and tensile strengths), is the slope of the power law regression line J = C1ΔaC2 at the point where TM is calculated and is given by:
| (2) |
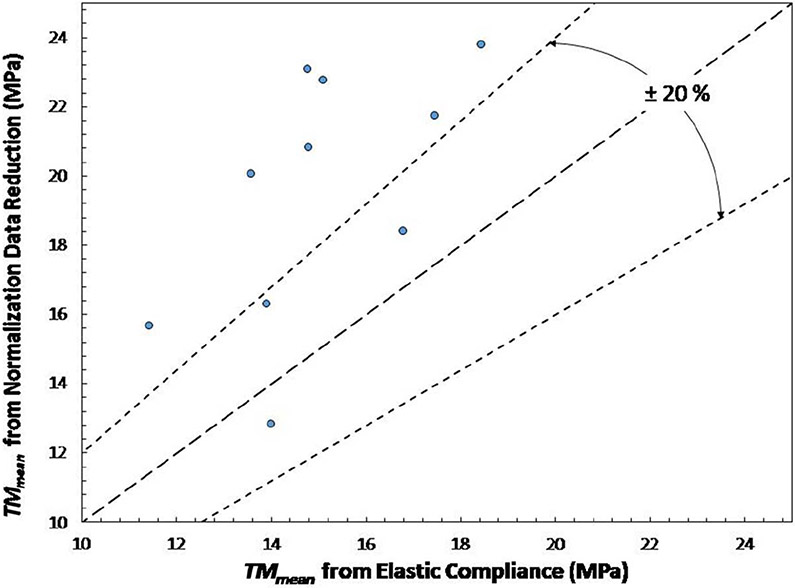
The tearing modulus is a direct measure of a material’s resistance to crack propagation (the higher the TM, the steeper the J-R curve; note that in fracture terminology, “R” stands for “resistance”). It was included in the ASTM E813 standard, which was withdrawn in 1997 and replaced by ASTM E1820. Note that ASTM E813 prescribed a linear fit of valid data points, which implied a unique value for in equation (1). However, ASTM E1820 dictates a power law fit, and thus different values of TM can be obtained based upon where the slope is calculated. In this work, two values of tearing modulus were calculated: TM,JQ at [ΔaQ, JQ] and TM,mean (average between TM,JQ and TM,Jlimit, calculated at the intersection between the power law regression curve and the upper limit of the data validity range). They respectively represent the material’s crack resistance at initiation and the average crack resistance over the range of valid data.
Results and Discussion
The results of the 12 tests performed are summarized in Table 2.
TABLE 2.
Results of the elastic-plastic fracture toughness tests on AM Ti64
| Notch Type | S/N | Specimen ID | JQ (kN/m) | TM,JQ (MPa) | TM,mean (MPa) |
|---|---|---|---|---|---|
| FPC | N | A | 130.25 | 21.85 | 13.92 |
| B | 122.82 | 27.99 | 18.44 | ||
| C | 112.23 | 15.67 | 9.75 | ||
| Average | 121.77 | 21.84 | 14.04 | ||
| SD | 9.06 | 6.16 | 4.34 | ||
| S | A | 149.50 | 26.98 | 17.47 | |
| B | 133.75 | 22.01 | 14.02 | ||
| C | 149.99 | 26.03 | 16.79 | ||
| Average | 144.41 | 25.00 | 16.09 | ||
| SD | 9.23 | 2.64 | 1.83 | ||
| SN | N | A | 205.07 | 20.02 | 12.60 |
| B | 162.96 | 23.22 | 14.78 | ||
| C | 184.19 | 23.73 | 15.10 | ||
| Average | 184.07 | 22.32 | 14.16 | ||
| SD | 21.05 | 2.01 | 1.36 | ||
| S | A | 97.04 | 18.04 | 11.44 | |
| B | 184.21 | 23.28 | 14.80 | ||
| C | 189.91 | 21.49 | 13.58 | ||
| Average | 157.05 | 20.94 | 13.27 | ||
| SD | 52.05 | 2.66 | 1.70 |
Note: N = nonsupported; S = supported; SD = standard deviation.
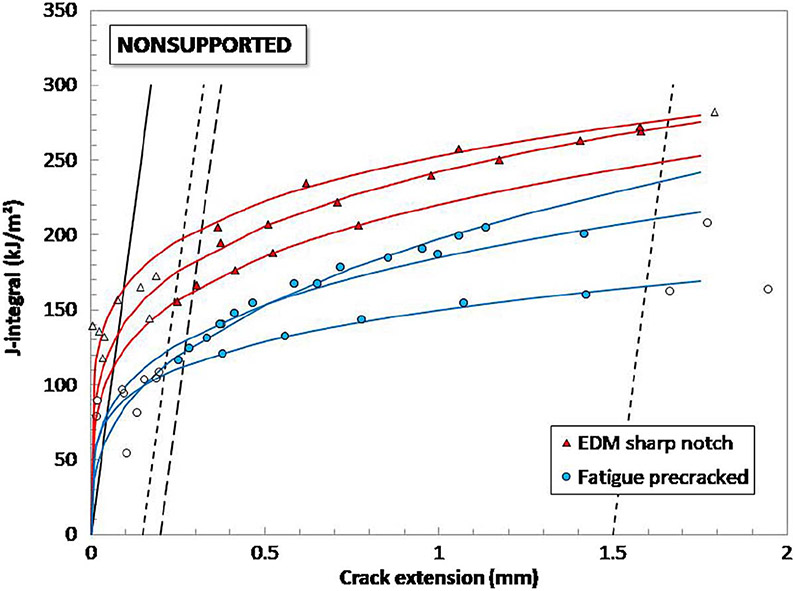
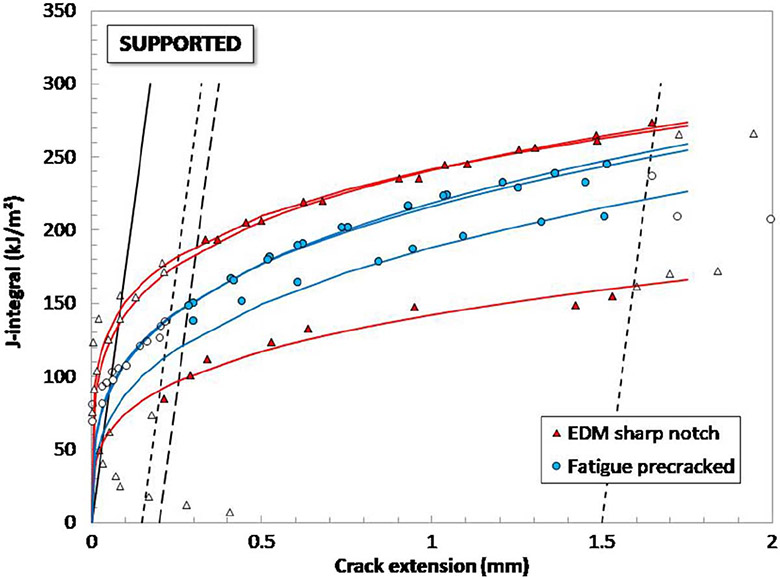
J-R curves, obtained from the EC technique, are compared in figures 3 and 4 for nonsupported and supported specimens, respectively. In the figures, the solid line represents the construction line, whereas the parallel dotted lines with 0.15- and 1.5-mm offsets define the range of data points to be fitted, and the parallel dashed line with the 0.2-mm offset intersects with the power law regression curve to yield the provisional critical value JQ.
FIG. 3.
Elastic compliance J-R curves obtained from nonsupported specimens of AM Ti64. Filled symbols correspond to data points that were fitted to obtain the J-R curves.
FIG. 4.
Elastic compliance J-R curves obtained from supported specimens of AM Ti64. Filled symbols correspond to data points that were fitted to obtain the J-R curves.
With the exception of the lowest J-R curve (specimen with the highest density of LoF pores), an overestimation of fracture toughness is observed for SN specimens, which can be explained in terms of relatively low toughness of the investigated material (JQ < 150 kJ/m2). Therefore, only FPC specimens should be used for the characterization of AM Ti64.
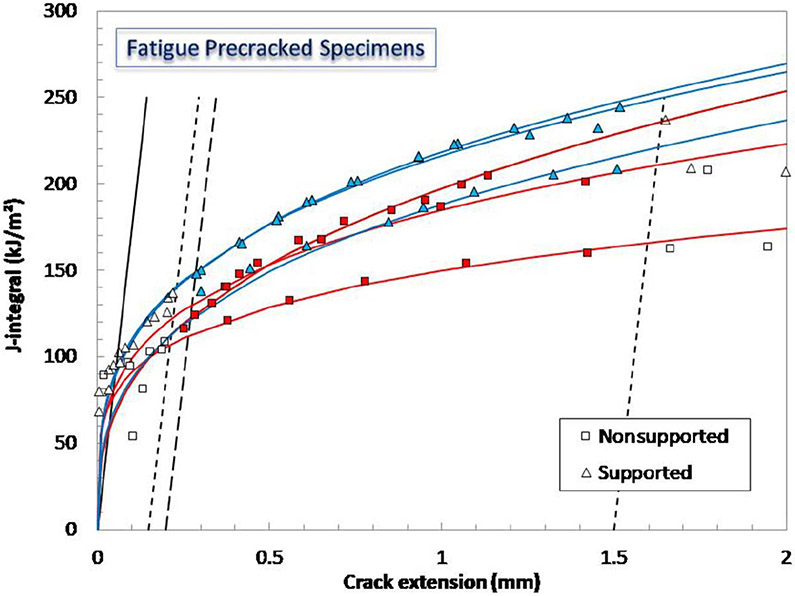
A clear effect of the use of supports connecting specimens to the build plate was not observed, as illustrated in figure 5 (FPC specimens).
FIG. 5.
Elastic compliance J-R curves obtained from FPC specimens of AM Ti64 (nonsupported and supported). Filled symbols correspond to data points that were fitted to obtain the J-R curves.
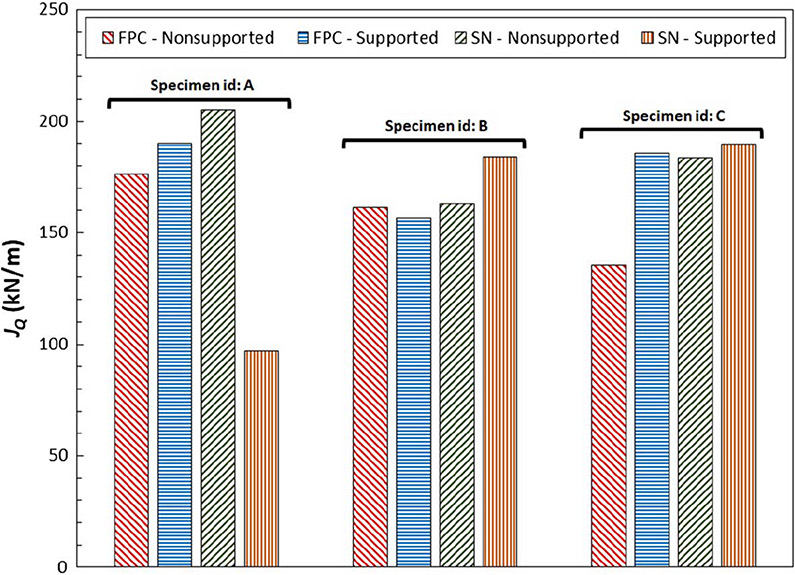
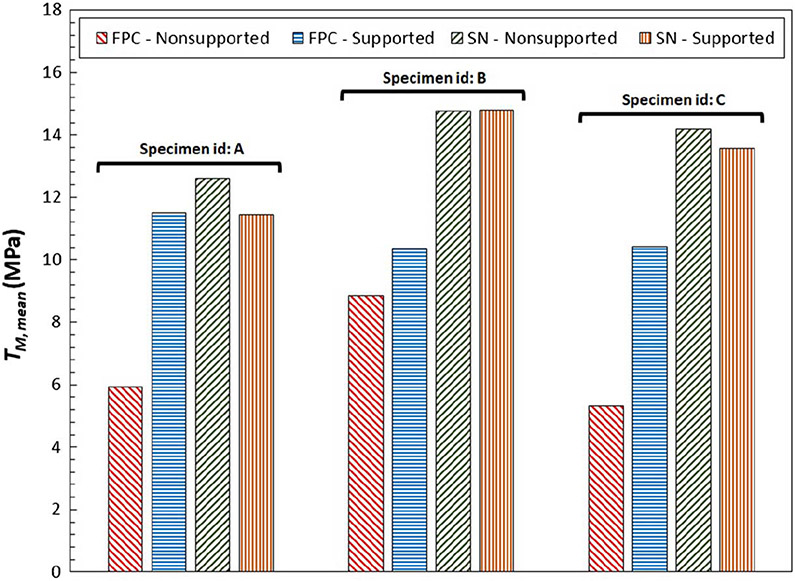
The results obtained are also illustrated in the form of bar charts in figure 6 (JQ values) and figure 7 (TM,mean values). The three group bars in the figures correspond to specimens A, B, and C. Note that there is no relationship between specimens with the same identifier (A, B, or C).
FIG. 6.
JQ values obtained from AM Ti64 in the different conditions investigated.
FIG. 7.
TM,mean values obtained from AM Ti64 in the different conditions investigated.
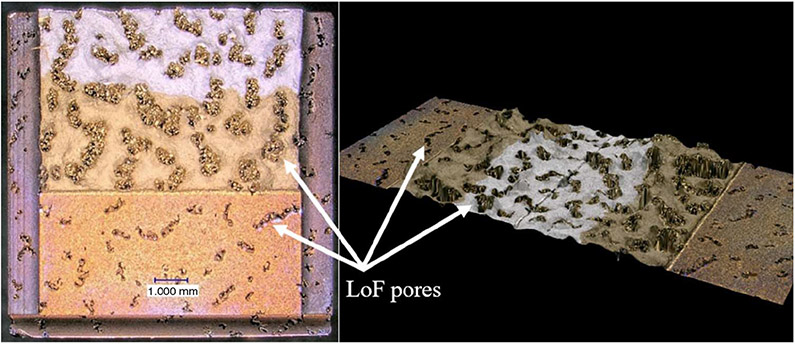
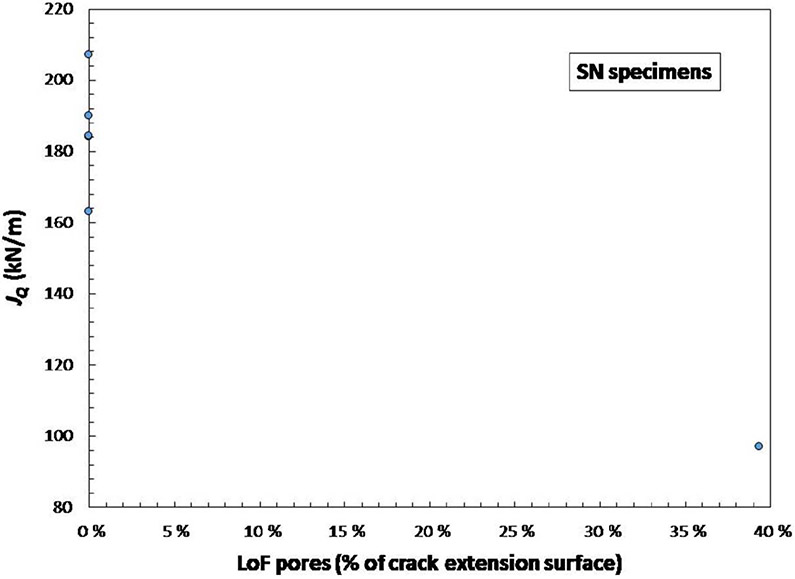
Based on the examination of the fracture surfaces, it was found that the area fraction of LoF pores on the fracture surface affects the measured fracture toughness. A clear example is provided by specimen SN-S-A, which corresponded to the lowest and shallowest J-R curve in figure 4 and yielded the lowest values of critical toughness (JQ = 97.04 kN/m) and tearing resistance (TM,JQ = 18.04 MPa and TM,mean = 11.44 MPa; see Table 2).
This specimen had, by far, the largest number of visible LoF pores on its fracture surface, as clearly illustrated by the optical image and the 3D reconstruction in figure 8 and the scanning electron microscope image in figure 9.
FIG. 8.
Specimen SN-S-A: optical image (left) and 3D reconstruction (right) of mating fracture surfaces.
FIG. 9.
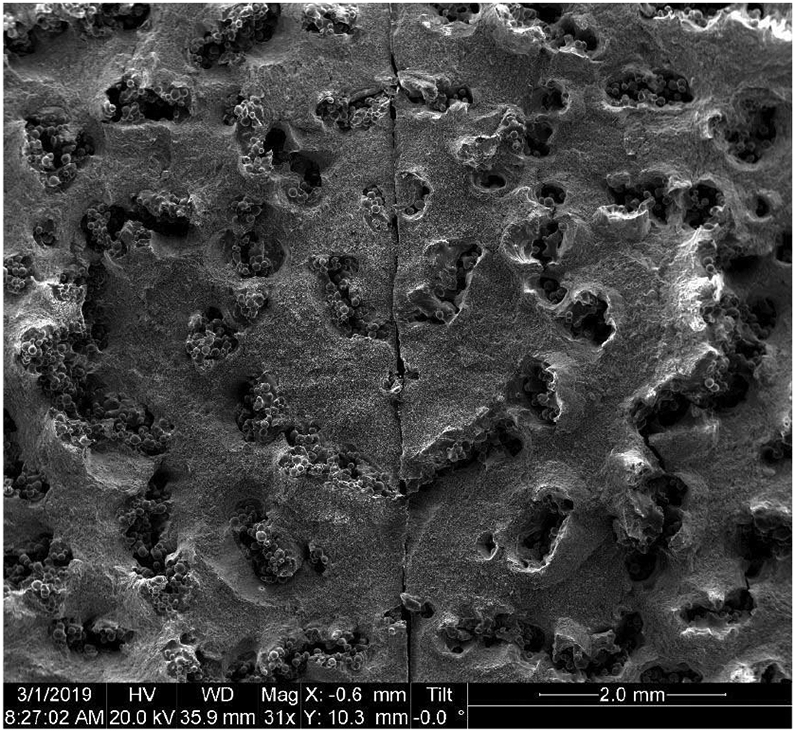
Specimen SN-S-A: scanning electron microscope image of mating fracture surfaces.
For this specimen, a number of macroscopically visible LoF pores were identified on the fracture surface, covering 39.4 % of the fracture surface between the machined SN and the final crack front. Some of these LoF pores (4.9 % of the fracture surface) were adjacent to the machined notch and most likely affected crack initiation (JQ and TM,JQ).
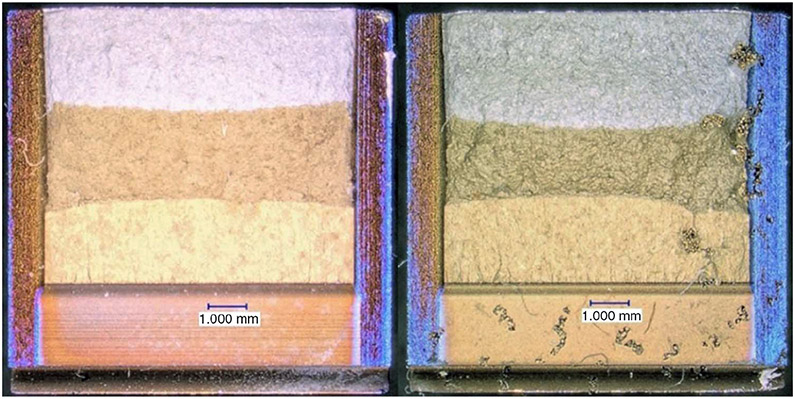
Most of the other specimens exhibited either no evidence of LoF on the fracture surface (e.g., specimen FPC-S-B, left side of fig. 10) or just a few spots within the crack extension range but away from the fatigue crack front (e.g., specimen FPC-N-C, right side of fig. 10).
FIG. 10.
Specimen FPC-S-B, no evidence of LoF pores (left); specimen FPC-N-C, few LoF pores, away from the fatigue crack front (right).
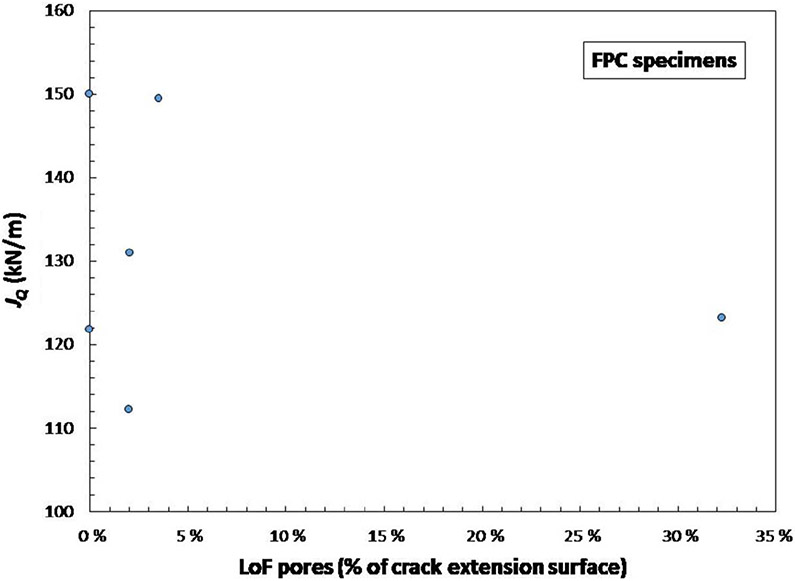
The number of available specimens, particularly those with significant LoF (>5 %), is not enough to derive statistically reliable conclusions, so this issue needs to be addressed in future research. Neither figures 11 (FPC specimens) nor 12 (SN specimens) indicate statistically significant trends for fracture toughness as a function of the percentage of LoF pores.
FIG. 11.
Values of critical toughness for FPC specimens of AM Ti64 as a function of the percentage of LoF area.
FIG. 12.
Values of critical toughness for SN specimens of AM Ti64 as a function of percent LoF area.
Additional Fracture Toughness Analyses by Means of the NDR Technique
The NDR procedure is a single-specimen analytical method that can be used to obtain a J-R curve directly from a force-displacement record, together with initial and final crack size measurements taken from the specimen fracture surface. The normalization technique, currently described in Annex A15 of ASTM E1820, was introduced in fundamental papers such as Joyce,9 Herrera and Landes,10 Landes et al.,11 and Lee.12
The fracture toughness tests performed in this study on AM Ti64 were also analyzed with the NDR technique, utilizing an open-source software tool, distributed by Oak Ridge National Laboratory in 2019,13 after “stripping away” the unloading-reloading cycles from the force-crack mouth opening displacement records.
The NDR analysis results (JQ, TM,JQ, and TM,mean) are compared in Table 3 with the corresponding outcome of the EC analyses. Note that for two tests (specimens FPC-N-C and SN-N-A), the NDR analysis could not be performed because of excessive total crack extension.
TABLE 3.
Comparison between fracture toughness results obtained from the EC and NDR techniques
| Elastic Unloading Compliance |
Normalization Data Reduction |
|||||||
|---|---|---|---|---|---|---|---|---|
| Notch Type | S/N | Specimen ID | JQ (kN/m) | TM,JQ (MPa) | TM,mean (MPa) | JQ (kN/m) | TM,JQ (MPa) | TM,mean (MPa) |
| FPC | N | A | 130.25 | 21.85 | 13.92 | 125.86 | 25.15 | 16.30 |
| B | 122.82 | 27.99 | 18.44 | 107.15 | 34.19 | 23.78 | ||
| C | 112.23 | 15.67 | 9.75 | … | … | … | ||
| Average | 121.77 | 21.84 | 14.04 | 116.50 | 29.67 | 20.04 | ||
| SD | 9.06 | 6.16 | 4.34 | 13.23 | 6.39 | 5.29 | ||
| S | A | 149.50 | 26.98 | 17.47 | 121.68 | 32.20 | 21.74 | |
| B | 133.75 | 22.01 | 14.02 | 170.34 | 20.35 | 12.82 | ||
| C | 149.99 | 26.03 | 16.79 | 201.30 | 28.50 | 18.41 | ||
| Average | 144.41 | 25.00 | 16.09 | 164.44 | 27.02 | 17.65 | ||
| SD | 9.23 | 2.64 | 1.83 | 40.14 | 6.06 | 4.51 | ||
| SN | N | A | 205.07 | 20.02 | 12.60 | … | … | … |
| B | 162.96 | 23.22 | 14.78 | 155.08 | 34.56 | 23.08 | ||
| C | 184.19 | 23.73 | 15.10 | 138.73 | 33.87 | 22.76 | ||
| Average | 184.07 | 22.32 | 14.16 | 146.91 | 34.21 | 22.92 | ||
| SD | 21.05 | 2.01 | 1.36 | 11.56 | 0.48 | 0.23 | ||
| S | A | 97.04 | 18.04 | 11.44 | 66.13 | 22.81 | 15.67 | |
| B | 184.21 | 23.28 | 14.80 | 137.48 | 31.33 | 20.80 | ||
| C | 189.91 | 21.49 | 13.58 | 145.49 | 30.43 | 20.04 | ||
| Average | 157.05 | 20.94 | 13.27 | 116.37 | 28.19 | 18.84 | ||
| SD | 52.05 | 2.66 | 1.70 | 43.69 | 4.68 | 2.77 | ||
Note: N = nonsupported; S = supported; SD = standard deviation.
Despite some scatter, some clear trends can be observed:
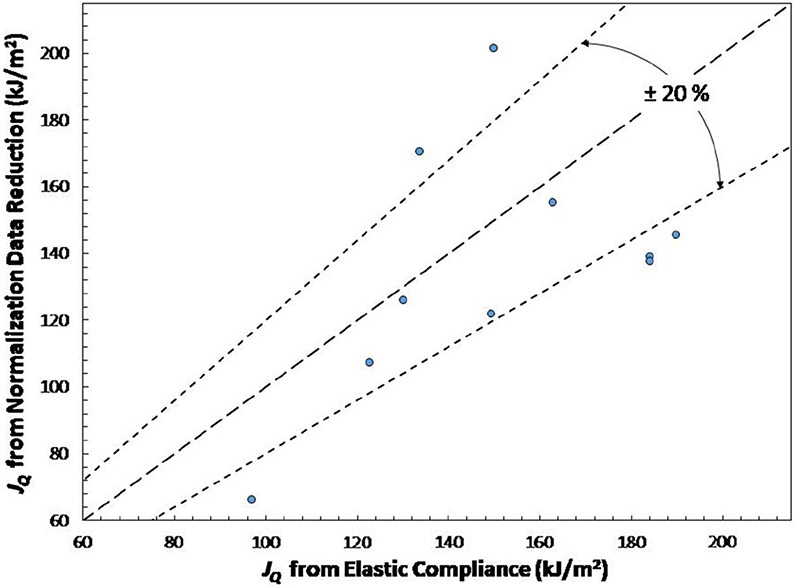
Critical toughness values from the NDR are generally lower than those calculated from EC (see also fig. 13) by an amount ranging from 5 to 34 %.
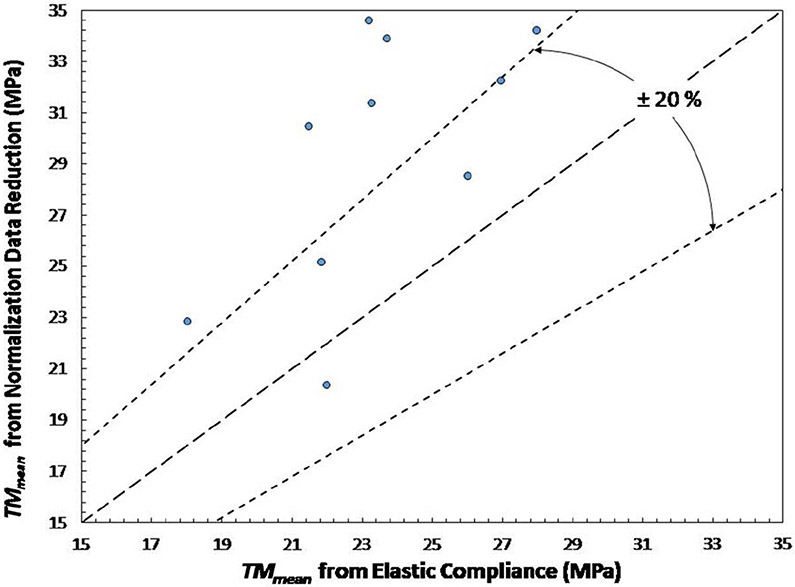
NDR resistance curves are generally steeper than those from EC, as shown by the higher values of both TM,JQ (fig. 14) and TM,mean (fig. 15).
FIG. 13.
Comparison between JQ values from EC and NDR techniques.
FIG. 14.
Comparison between TM,JQ values from EC and NDR techniques.
FIG. 15.
Comparison between TM,JQ values from EC and NDR techniques.
These differences are not consistent with the information provided in some early NDR references,9-11 which show good to excellent agreement between EC and NDR J-R curves. More recently, a large database of 348 J-R curve tests on C(T) and SE(B) specimens, performed at SCK•CEN (the Belgian Nuclear Center) and analyzed by means of three different single-specimen techniques (EC, NDR, and potential difference), was presented at an ASTM Special Technical Meeting on Use of Potential Drop in Elastic-Plastic Fracture Toughness Testing.14 Based on the presentation and only considering tests on SE(B) specimens, JQ/JIc values from NDR are, on average, 5 % higher than those from EC, whereas tearing modulus at initiation (TM,JQ) from NDR is, on average, 31 % lower than those from EC. For both parameters, however, scatter bands are huge (ratio NDR/EC: 0.59–7.14 for JQ, 0.34–3.46 for TM,JQ).
Conclusions
The most significant conclusions emerging from the investigation presented are as follows:
The critical fracture toughness (JQ) of AM Ti-6Al-4V in HIP condition (scan length = 84 mm), measured at room temperature on FPC Charpy-type specimens, is in the range of 110–150 kJ/m2. This corresponds, in terms of stress intensity factor KQ, to a range 119–139 MPa√m, which is somewhat higher than the values of KQ typically found in the literature for “non-AM” Ti-6Al-4V.
Specimens manufactured with thin wafer supports connecting them to the build plate (supported) appear to have approximately equivalent fracture toughness to those directly attached to the build plate (nonsupported). This conclusion, however, needs to be confirmed by additional research.
The use of SNs, produced by EDM, in the place of FPCs does not represent a viable option because it overestimates fracture toughness by more than 20 %. This is due to the relatively low toughness of the material, as compared with other high-toughness steels, for which SN specimens are a viable option for elastic-plastic fracture toughness measurements.
For some specimens, a significant number of LoF pores were observed on the fracture surface. Insufficient experimental evidence is available to quantify their effect on the material’s fracture toughness.
Results obtained by means of the NDR technique are different from those calculated from the EC procedure in that generally critical toughness is lower and crack resistance (slope of the J-R curve, as expressed by values of tearing modules) is higher.
Concerning the issue of LoF, it must be pointed out that the scan length used (84 mm) is an extreme situation. Whenever scan length is large and LoF significant, the influence of microstructural features must be investigated in order to decouple effects from microstructure and defects on fracture toughness. HIP cannot seal such gross LoF pores because they are exposed to the surface. Controlling scan length (the recommended value is around 80 mm) produces less variability and eliminates the presence of LoF pores.
ACKNOWLEDGMENTS
The authors gratefully acknowledge the collaboration of Ross Rentz in setting up and performing the fracture toughness tests. This paper is a work of the U.S. government and is not subject to copyright protection in the United States.
Footnotes
Certain commercial software, equipment, instruments or materials are identified in this paper in order to adequately specify the experimental procedure. Such identification is not intended to imply recommendation or endorsement by the National Institute of Standards and Technology, nor is it intended to imply that the equipment or materials identified are necessarily the best available for the purpose.
References
- 1.Gorelik M, “Additive Manufacturing in the Context of Structural Integrity,” International Journal of Fatigue 94, pt. 2 (2017): 168–177, 10.1016/j.ijfatigue.2016.07.005 [DOI] [Google Scholar]
- 2.Hrabe N, Barbosa N, Daniewicz S, and Shamsaei N, Findings from the NIST/ASTM Workshop on Mechanical Behavior of Additive Manufacturing Components (Gaithersburg, MD: National Institute of Standards and Technology, 2016), 10.6028/NIST.AMS.100-4 [DOI] [Google Scholar]
- 3.Chaput K, Butler TM, Georgin B, and Schwalbach E, “Influence of Processing Parameters on the Development of Microstructure and Texture in EBM Ti-6Al-4V” (paper presentation, RAPID Conference, Pittsburgh, PA, May 8–11, 2017). [Google Scholar]
- 4.Hrabe N, Gnaupel-Herold T, and Quinn T, “Fatigue Properties of a Titanium Alloy (Ti-6Al–4V) Fabricated via Electron Beam Melting (EBM): Effects of Internal Defects and Residual Stress,” International Journal of Fatigue 94, pt. 2 (2017): 202–210, 10.1016/j.ijfatigue.2016.04.022 [DOI] [Google Scholar]
- 5.Benzing J, Hrabe N, Quinn T, White R, and Rentz R, “Manipulation of Microstructure and Tensile Properties of Additively Manufactured Ti-6Al-4V Parts” (paper presentation, 19th International ASTM/ESIS Symposium on Fatigue and Fracture Mechanics (42nd National Symposium on Fatigue and Fracture Mechanics), Denver, CO, May 15–17, 2019). [Google Scholar]
- 6.Lucon E, “Cost-Effective Alternatives to Conventional Charpy Tests for Measuring the Impact Toughness of Very-High-Toughness Steels,” Journal of Pressure Vessel Technology 140, no. 2 (April 2018): 021401, 10.1115/1.4038902 [DOI] [PMC free article] [PubMed] [Google Scholar]
- 7.Standard Test Method for Measurement of Fracture Toughness, ASTM E1820-18ae1 (West Conshohocken, PA: ASTM International, approved November 1, 2018), 10.1520/E1820-18AE01 [DOI] [Google Scholar]
- 8.Paris PC, Tada H, Zahoor A, and Ernst H, A Treatment of the Subject of Tearing Instability, Report No. NUREG-0311 (Washington, DC: U.S. Nuclear Regulatory Commission, 1977). [Google Scholar]
- 9.Joyce JA, “Analysis of a High Rate Round Robin Based on Proposed Annexes to ASTM E1820,” Journal of Testing and Evaluation 29, no. 4 (July 2001): 329–351, 10.1520/JTE12262J [DOI] [Google Scholar]
- 10.Herrera R and Landes J, “Direct J-R Curve Analysis: A Guide to the Methodology,” in Fracture Mechanics: Twenty-First Symposium, ed. Gudas J, Joyce J, and Hackett E (Conshohocken, PA: ASTM International, 1990), 24–43, 10.1520/STP18987S [DOI] [Google Scholar]
- 11.Landes J, Zhou Z, Lee K, and Herrera R, “Normalization Method for Developing J-R Curves with the LMN Function,” Journal of Testing and Evaluation 19, no. 4 (July 1991): 305–311, 10.1520/JTE12574J [DOI] [Google Scholar]
- 12.Lee K, “Elastic-Plastic Fracture Toughness Determination under Some Difficult Conditions” (PhD diss., University of Tennessee, 1995), http://web.archive.org/web/20190709210121/http://trace.tennessee.edu/utk_graddiss/2791/ [Google Scholar]
- 13.Esteban Linares A, Clowers L, Chen X, Sokolov M, and Nanstad R, “Using Automated J-R Curve Analysis Software to Simplify Testing and Save Time,” Advanced Materials and Processes 177, no. 2 (February/March 2019): 27–30. [Google Scholar]
- 14.Scibetta M and Lucon E, “SCK•CEN Activities for the Qualification of the Potential Drop Technique” (paper presentation, ASTM E08.07 Special Technical Meeting on Use of Potential Drop in Elastic-Plastic Fracture Toughness Testing, Jacksonville, FL, November 12, 2013). [Google Scholar]


