Abstract
Nonhuman primate (NHP) models will expedite therapeutics and vaccines for COVID-19 into clinical trials. We compared acute SARS-CoV-2 infection in young and old rhesus macaques and baboons and old marmosets. Macaques had clinical signs of viral infection, mild-to-moderate pneumonitis and extra-pulmonary pathologies; both age groups recovered in two weeks. Baboons had prolonged viral RNA shedding and substantially more lung inflammation compared with macaques. Inflammation in bronchoalveolar lavage (BAL) was increased in old versus young baboons. Using techniques like CT imaging, immunophenotyping, alveolar/peripheral cytokine responses and immunohistochemical analyses, we delineated cellular immune responses to SARS-CoV-2 infection in macaque and baboon lungs, including innate and adaptive immune cells and a prominent Type I-interferon response. Macaques developed T cell memory phenotype/responses and bystander cytokine production. Old macaques had lower titres of SARS-CoV-2-specific IgG antibody levels compared with young. Acute respiratory distress in macaques and baboons recapitulates the progression of COVID-19 in humans, making them suitable as models to test vaccines and therapies.
Early reports indicate that nonhuman primates (NHPs) are suitable models for the pathology of severe acute respiratory syndrome coronavirus 2 (SARS-CoV-2) infection/Coronavirus Disease 2019 (COVID-19), and for evaluating vaccine candidates1,2,3–6. These studies delineated the associated histopathology and morbidity at terminal endpoints for rhesus macaques, cynomolgus macaques and african green monkeys. To expand the existing understanding of the NHP models of SARS-CoV-2 infection1,2,3–6 we evaluated the baboon and old marmoset model which are not yet reported for SARS-CoV-2 infection. In addition we expanded on the rhesus macaque model of SARS-CoV-2 infection by CT imaging, flow cytometry based cellular phenotyping, and alveolar and peripheral cytokine responses during the course of the disease development and resolution. We also complemented the data with matched immunological and histopathological findings in organs from the terminal endpoints. We sought to characterize early cellular immune events in the lung following SARS-CoV-2 infection, in three NHP genera: Indian rhesus macaques (old and young), baboons(old and young), and common marmosets (old). In early stages, macaques developed clinical signatures of viral infection and systemic inflammation, early evidence of viral replication, mild-to-moderate interstitial and alveolar pneumonitis, and moderate progressive pneumonia. Longitudinal studies over two weeks in young and old macaques showed early signs of COVID-19 with recovery in both age groups. Analysis of blood, and bronchoalveolar lavage revealed a complex early inflammatory milieu with influx in the lungs of innate and adaptive immune cells, particularly myeloid cells, and a prominent Type I-interferon response. While rhesus macaques exhibited moderate disease, baboons were susceptible to SARS-CoV-2 infection with extensive pathology following infection, and marmosets demonstrated mild infection. Thus, different NHP species exhibit heterogeneous responses to SARS-CoV-2 infection. Rhesus macaques and baboons develop different, quantifiable disease attributes making them essential models to test vaccines and therapeutics against COVID-19.
Results
Heterogeneity in SARS-CoV-2 viral loads in young and old NHP
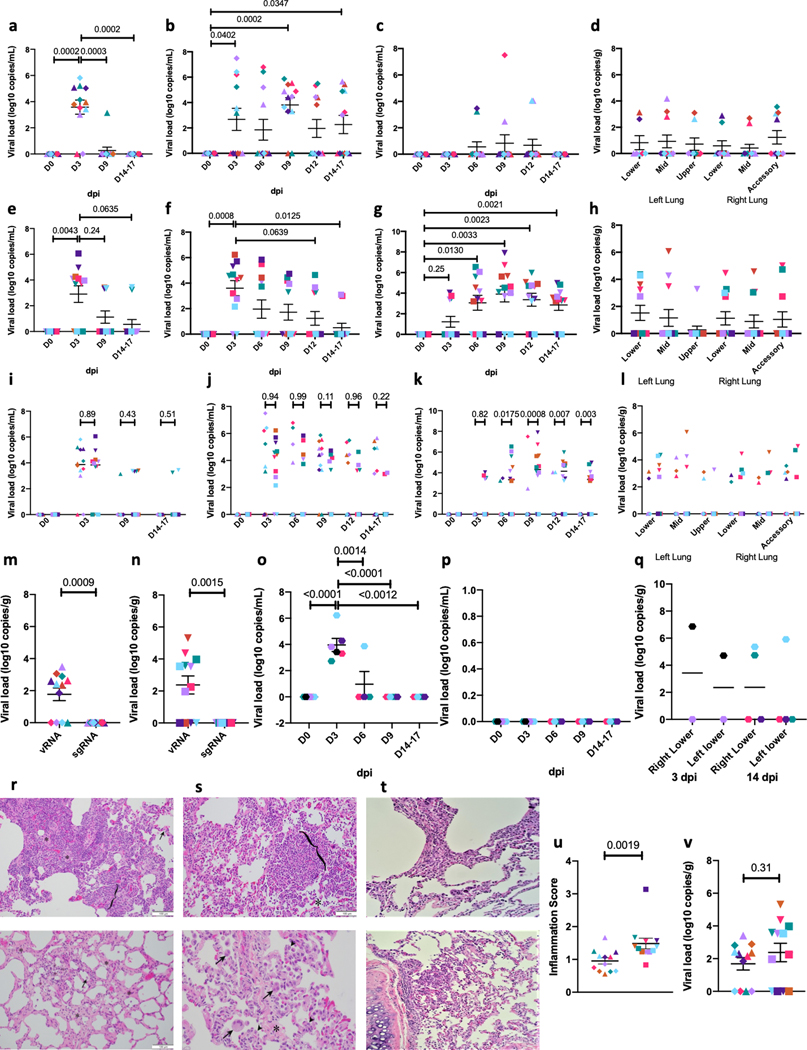
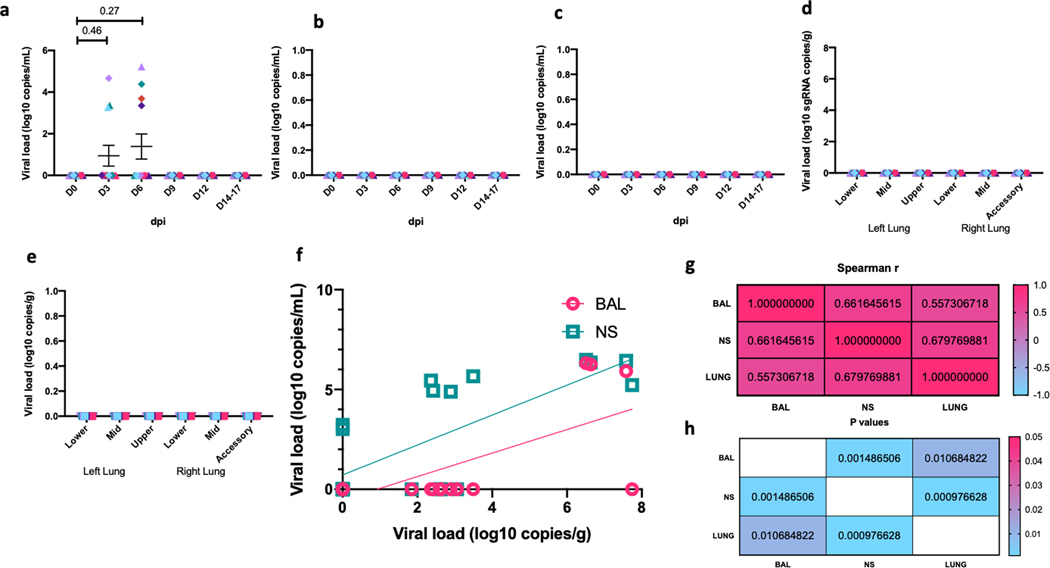
Macaques, baboons and old marmosets were infected by multiple routes (ocular, intratracheal and intranasal) with sixth-passage, fully sequenced and authenticated virus at a target dose of 1.05×10⁶ PFU/per animal. SARS-CoV-2 viral RNA (vRNA) was detected early in all species at 3 dpi (Fig 1a–o, Supplementary Table 1: Legend), and declined thereafter at variable rates. Comparable BAL vRNA levels were detected from young and old macaques at 3 dpi (5/6 each) (Fig 1a). Virtually no BAL vRNA was detected at 9 dpi (1/12) and none at 12 dpi (Fig 1a). vRNA in NS could be detected in 50% of animals at 3 dpi, 10/12 (6 young, 4 old) at 9 dpi and 6/12 at study end (Fig 1b). VRNA was detected in 4/12 and 2/12 animals, respectively, from RS (Fig 1c) and in BS (Extended Data Figure 1a) at 3 and 6 dpi but infrequently at later time points. VRNA was detected in the lungs of 8/12 (3 young, 5 old) macaques at necropsy (14–17 dpi) (Fig 1d). No vRNA was detected in any plasma samples (Extended Data Figure 1b) or in randomly selected urine samples (Extended Data Figure 1c). We also detected no SARS CoV-2 subgenomic RNA (correlate for infectious/replicating virus) in either rhesus (Extended Data Figure 1d) or baboon (Extended Data Figure 1e) lungs in the longitudinal study (Fig 1m). Thus, despite vRNA persistence in the lungs of immunocompetent macaques, the absence of replicative virus indicates that macaques control SARS-CoV-2 infection.
Figure 1. SARS-CoV-2 RNA and histopathology in rhesus macaques, baboons and marmosets.
Viral RNA in BAL fluid (a) and nasopharyngeal (b), rectal (c) swabs collected longitudinally and lung tissue homogenates (d) collected at endpoint (14–17 dpi) from SARS-CoV-2 infected rhesus macaques. Viral RNA in BAL fluid (e) and nasopharyngeal (f) and rectal (g) swabs collected longitudinally and lung tissue homogenates (h) at endpoint (14–17 dpi) from SARS-CoV-2 infected baboons. (n=12). Comparison of viral RNA in BAL fluid (i) and nasopharyngeal (j), rectal (k) swabs and lung (l) of SARS-CoV-2 infected rhesus macaques and baboons. To estimate the persistence of replicative virus we performed the subgenomic RNA estimation on endpoint lung samples of rhesus macaques (m) and baboons (n). (n=12). Viral RNA in nasal wash (o) and oral (p) swabs longitudinally. (n=6 for 0–3 dpi and n=4 for 6–14 dpi). Viral RNA was also measured in lung homogenates marmosets (q) at endpoint (3 dpi, n=2 & 14 dpi, n=4). One way (a-c, e-g, m-n) and Two way (i-l) Repeated-measures ANOVA with Geisser-Greenhouse correction for sphericity and Tukey’s post hoc correction for multiple-testing (GraphPad Prism 8). Data are represented as mean± SEM. Histopathologic analysis in infected rhesus macaques revealed regionally extensive interstitial lymphocytes, plasma cells, lesser macrophages and eosinophils expanding the alveolar septa (bracket) and alveolar spaces filled with macrophages (*). Normal alveolar wall is highlighted (arrow) for comparison (r, upper panel). Alveolar spaces with extensive interstitial alveolar wall thickening by deposits of collagen (*) and scattered alveolar macrophages (arrow) (r, lower panel). Histopathologic analysis in infected baboons also revealed regionally extensive interstitial lymphocytes, plasma cells, lesser macrophages and eosinophils expanding the alveolar septa (bracket) and alveolar spaces filled with macrophages (*) (s, upper panel). Alveolar wall thickening by interstitial deposits of collagen (*), alveoli lined by occasional type II pneumocytes (arrowhead) and alveolar spaces containing syncytial cells (arrow) and alveolar macrophages (s, lower panel). Histopathologic analysis in marmosets revealed milder form of interstitial lymphocytes, and macrophages recruited to the alveolar space (t). Comparison of endpoint viral titer (u) and lung inflammation score (v) of infected rhesus macaques and baboons. (n=12). One tailed Mann-Whitney U test was applied. (Rhesus macaques: Old-Triangle, Young Diamonds; Baboons: Old-Inverted triangle, Young-Square; Old marmosets: Hexagon; Colors represent individual animals, Supplementary Table 1).
The pattern of vRNA in baboons mimicked that of macaques (Fig 1e–h). At 3 dpi, 8/12 and 10/12 baboons had detectable BAL vRNA (Fig 1e), and NS vRNA (Fig 1f), respectively. A comparatively higher number of old baboons (4/6) harbored BAL vRNA at 9 dpi, relative to young (0/6) (Fig 1e). Despite these differences, peak BAL vRNA (~4 logs) was detected in both age groups at 3 dpi (Fig 1i). VRNA levels detected in NS (Fig 1f) and RS (Fig 1g) of old baboons was greater relative to young. Peak vRNA levels were detected at 3 dpi (6/6 old and 4/6 young baboons) in NS. At 6 and 9 dpi, 4/6 old (mean > 3-logs) and only 1/6 young (mean < 1-log) baboons, respectively, were positive in NS (Fig 1f). Peak vRNA was detected at 9 dpi for both age groups of baboons in RS (Fig 1g), with an average of ~5-logs in old baboons, which was higher than ~ 3-logs in young baboons (Fig 1g). VRNA was also detected in the lungs of 5 old baboons at necropsy (14–17 dpi) (Fig 1h) but no SARS CoV-2 subgenomic RNA was detected (Fig 1n, Extended Data Figure 1e). While no statistically significant differences were observed for BAL vRNA levels (Fig 1i) and NS vRNA levels (Fig 1j) between baboons and macaques, RS showed marked differences with baboons harboring greater levels (by several logs) throughout the infection protocol (Fig 1k). Differences in lung viral titers were not significantly different between rhesus and baboons (Fig 1l).
Less than 4 logs of vRNA was detected in NS from infected old marmosets, peaking at 3 dpi, and 1/6 animals was also positive at 6 dpi (Fig 1o). No BS vRNA was detected throughout the study (Fig 1p). In comparison to macaques and baboons, marmosets had accelerated clearance of vRNA. Only low lung vRNA levels were detected at study end (Fig 1q).
Gross examination at necropsy (14–17 dpi) identified red discoloration of the lung lobes in 50% of macaques (Extended Data Figure 2b) and 100% of baboons (Extended Data Figure 3a, b). Tables S2 (macaques) and S3 (baboons) summarize the histopathologic findings. Lungs were the most affected organ in each case (Extended Data Figure 2a–d, 3; Supplementary Table 2, S3). Multifocal minimal to mild interstitial mononuclear inflammation was seen in 11/12 macaques (Fig 1 r, Supplementary Table 2, Extended Data Figure 2c) and 12/12 Baboons (Fig 1s, Extended Data Figure 3d–g), generally composed of macrophages and lymphocytes that expanded the alveolar septa (Fig 1p, Extended Data Figure 2d, e, f, g), with variable neutrophil infiltrates (Extended Data Figure 2e; 3d, e, h, i), or fibrosis (Fig 1q, Extended Data Figure 2f, g; Extended Data Figure 3h, i). A subset of six marmosets was euthanized at 3 dpi (n=2), while others were necropsied at 14 dpi. Interstitial and alveolar pneumonitis was observed (Fig 1t), although not as prevalent as in macaques or baboons. Thus, our results show that three NHP genera develop different degrees of COVID-19 when evaluated side by side, with baboons exhibiting moderate to severe pathology, macaques exhibiting moderate pathology and old marmosets exhibiting mild pathology. The pulmonary inflammation score was significantly different between macaques and baboons, with greater inflammation in baboon lungs (Fig 1u), however the vRNA levels did not differ statistically (Fig 1v).
Longitudinal SARS-CoV-2 infection in rhesus macaques, baboons and marmosets demonstrates heterogeneity in radiological and clinical outcomes across age and species
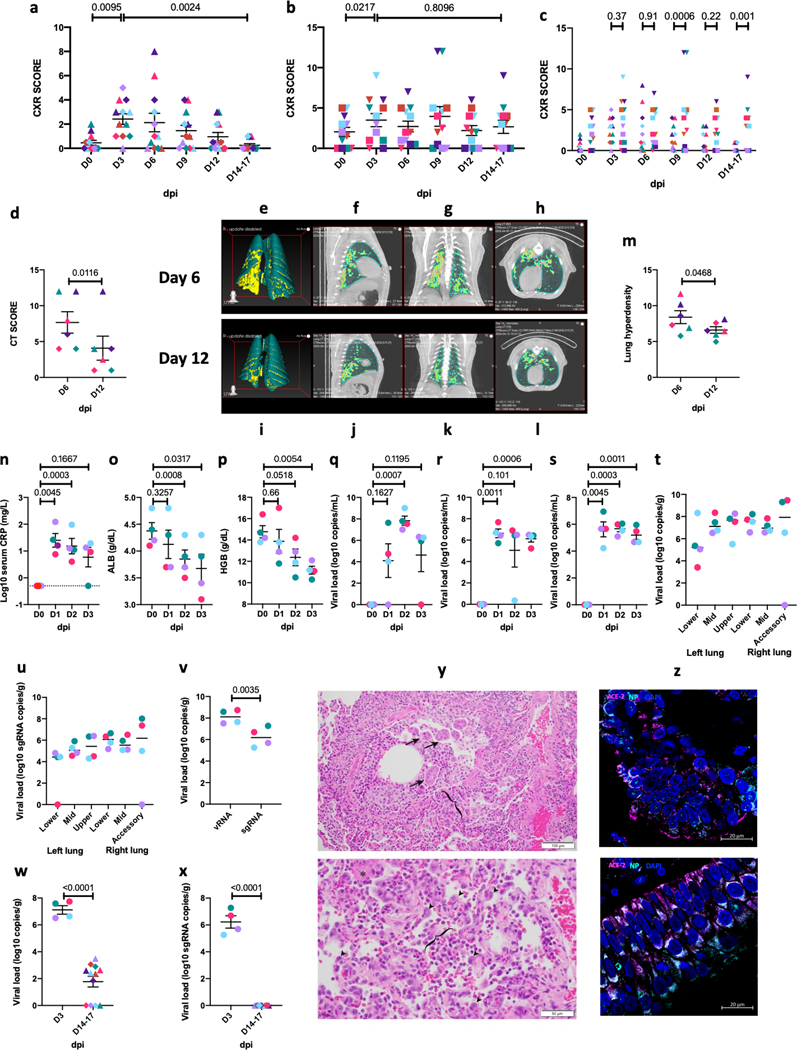
All SARS-CoV-2 infected macaques (Fig 2a, Supplementary Table 4) and baboons (Fig 2b, Supplementary Table 5) exhibited low baseline Chest X Ray (CXR) scores (Fig 2a–b, Supplementary Table 4, S5) with no age differences (Fig 2a, b) but there were significantly higher CXR scores in baboons compared to macaques (Fig 2c) at Day 9 and study end. Several infected macaques showed changes consistent with pneumonia (Supplementary Table 4) with peak severity at 3–6 dpi, and a decline by study end (Fig 2a, Supplementary Table 4). Examples of extensive pneumonia by CXR were seen in macaques at 6 dpi with subsequent resolution at endpoint (Supplementary Figure 1 a–c). Several animals exhibited multi-lobe alveolar infiltrates and/or interstitial opacities at 6 dpi while others exhibited progressive, moderate to severe interstitial and alveolar infiltrates at 6 dpi, which resolved by day 14. Conversely, CXRs of all procedure control animals (which underwent repeated BAL procedures) revealed minimal to no findings.
Figure 2. Radiological correlates of SARS-CoV-2 infection in rhesus macaques and baboons.
CXR (a) scores in macaques (n=12), (b) baboons (n=12) and comparative CXR (c) scores of infected rhesus macaques and baboons. CT scores in macaques (d) (n=6). 3D reconstruction (e, i) of ROI volume representing the location of lesion. (f-h, j-l) represent image for quantification of lung lesion with teal area representing normal and yellow areas represent hyperdense voxels. Percent change in lung hyperdensity in SARS-CoV2 infected animals over 6 dpi compared to 12 dpi (m) (n=6). Clinical correlates of early SARS-CoV-2 infection in rhesus macaques over 0–3 dpi (Circles, Colors represent individual animals, Supplementary Table 1) showing Changes in serum CRP (n), albumin (o), hemoglobin content (p) in peripheral blood. Viral RNA BAL fluid (q), nasopharyngeal (r), and buccopharyngeal (s) swabs longitudinally. Viral RNA (t) and subgenomic RNA (u) was measured in lung tissue homogenates at endpoint (3 dpi). Side by side comparison of viral RNA and subgenomic RNA (v). Comparison of viral titer (w) and lung subgenomic RNA (x) of infected rhesus macaques between 3 day short and 14–17 day long study. (n=12). Mann-Whitney U test was applied.Hematoxylin and eosin (H&E) staining was performed on formalin-fixed paraffin-embedded (FFPE) lung sections from infected animals for pathological analysis Histopathologic analysis revealed bronchitis characterized by infiltrates of macrophages, lymphocytes, neutrophils, and eosinophils that expanded the wall (bracket), and along with syncytial cells (arrows) filled the bronchiole lumen and adjacent alveolar spaces. (y, upper panel); Suppurative interstitial pneumonia with Type II pneumocyte hyperplasia (arrowheads) and alveolar space filled with neutrophils, macrophages and fibrin (*). Bracket denotes alveolar space. (y, lower panel). Multilabel confocal immunofluorescence microscopy of lungs (z, upper panel) and nasal epithelium (z, lower panel) at 63x with Nucleocapsid (N) specific antibody (green) DAPI (blue), and ACE2 (red). (a-f) Data are represented as mean± SEM (n=4).). Undetectable viral titers are represented as 1 copy. One way (a-b, n-s) and Two way (c) Repeated-measures ANOVA with Geisser-Greenhouse correction for sphericity and Tukey’s post hoc correction for multiple-testing (GraphPad Prism 8) and (d, m, v-x) One tailed Mann-Whitney U test was applied. Data are represented as mean± SEM.
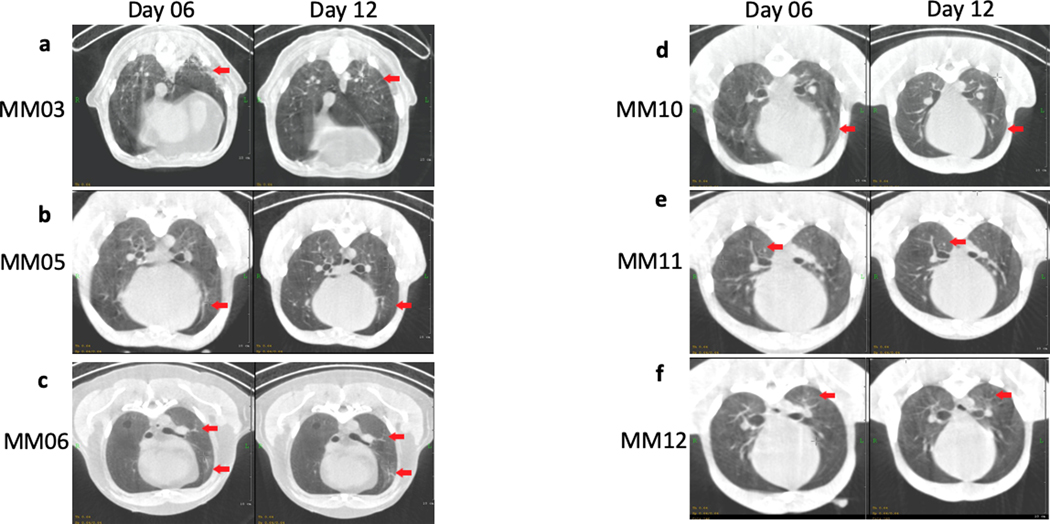
High resolution lung CT imaging was performed prior to and following SARS-CoV-2 infection for six young and six old macaques (Fig 3d–m). CT for baboons and both CT and CXR imaging for marmosets was not feasible. Pneumonia was present in all animals post-infection, but to a significantly higher degree in old macaques relative to young (Extended Data Figure 4, Supplementary Table 6). At 6 dpi, severe patchy alveolar patterns were observed in some lobes, while others had milder, interstitial patterns, with moderate to severe ground glass opacities primarily in old macaques (Extended Data Figure 4a–f). Resolution of many ground glass opacities and nodular as well as multifocal lesions was observed in all animals at 12 dpi (Fig 2d, Extended Data Figure 4a, b, d–f). At 12 dpi, all but one of the old macaques exhibited a normal or nearly normal CT. Findings in one old macaque were considerably improved but retained patchy round glass opacities in all lobes and alveolar patterns in some lobes at 12 dpi (Extended Data Figure 4c). This animal had the highest overall score by CT (Fig 2d) and CXRs (Fig 2a–b). These results suggest that multi-lobe pneumonia may persist longer in some old macaques. Hyperdensity analysis revealed a significant, progressive increase in involved lung volume at 6 dpi, which normalized by 12 dpi (Fig 2e–m).
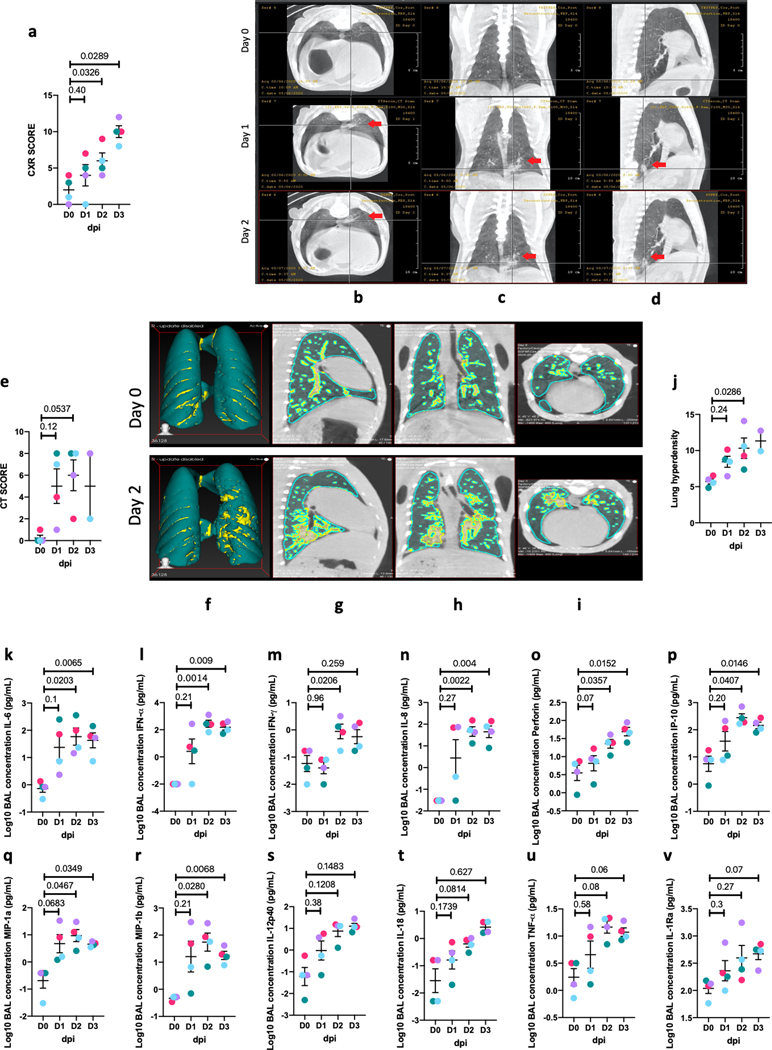
Figure 3. Alveolar compartment from 0–3 dpi for infected rhesus macaques.
CXR (a) and CT (e) scores of rhesus macaques over 0–3 dpi (Circles, Colors represent individual animals, Supplementary Table 1). Representative CT scan images performed on Day 0–2 dpi show (b) transverse, (c) vertical, (d) longitudinal view of left caudal lobe ground glass opacity on 1 dpi (middle), 2 dpi 35 and baseline at 0 dpi (upper inset). CT scans (b-d) revealed evidence of pneumonia and lung abnormalities in the infected animals relative to controls which resolved between 1 to 2 dpi (red arrow). 3D reconstruction (f) of ROI volume representing the location of lesion. (Fig 2g–i) represent image for quantification of lung lesion with teal area representing normal intensity lung voxels, while yellow areas represent hyperdense voxels. Percent change in lung hyperdensity in SARS-CoV2 infected animals over Day 1–3 dpi compared to the baseline (j). Simultaneous analysis of multiple cytokines by Luminex technology in the BAL fluid of rhesus macaques over 0–3 dpi revealed SARS-CoV-2 induced alveolar inflammation showing increased Levels of IL-6 (k), IFN-a (l), IFN-g (m), IL-8 (n), perforin (o), IP-10 (p), MIP1a (q), MIP1b (r), IL-12p40 (s), IL-18 (t), TNF (u) and IL-1Ra (v) are expressed in Log10 concentration in picogram per mL of BAL fluid. Data are represented as mean± SEM (n=4). One way Repeated-measures ANOVA (a, k-v) with Geisser-Greenhouse correction for sphericity and Tukey’s post hoc correction for multiple-testing (GraphPad Prism 8) was applied. (e, j) n=4 for 0–2 dpi, n=2 for 3dpi. Ordinary one-way ANOVA with Dunnett’s post hoc test was applied. Data represented as (mean ± SEM).
Early events in SARS-CoV-2 infection of rhesus macaques
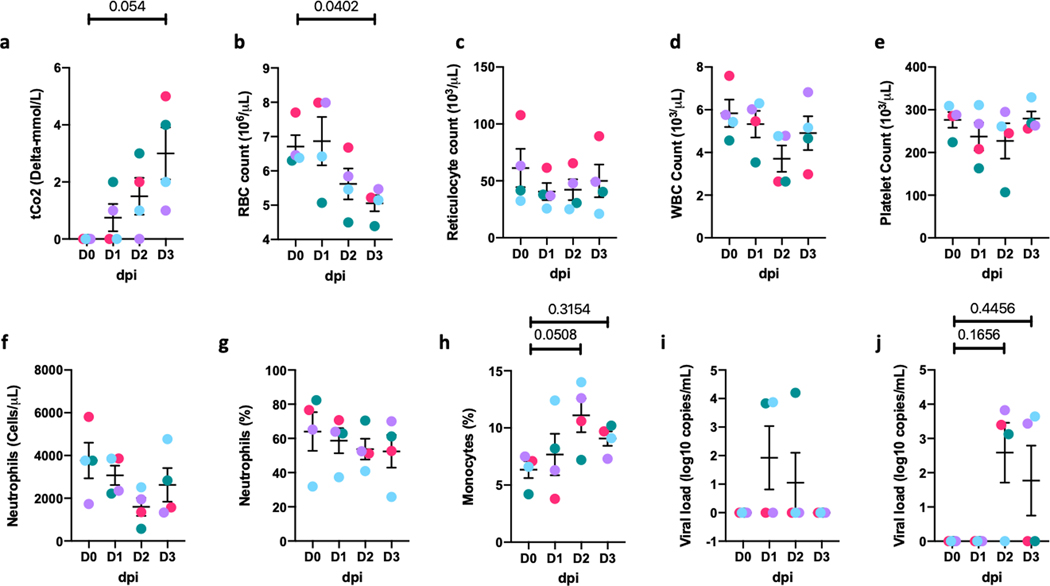
We performed an independent acute 3-day infection study of rhesus macaques, that included extensive imaging and immunological readouts. Four rhesus macaques (Supplementary Table 1) were infected as described previously and all animals developed clinical signs of viral infection with a doubling of serum C-Reactive Protein (CRP) levels relative to baseline (Fig 2n); significantly decreased serum albumin (Fig 2o) and hemoglobin (Fig 2p) levels, indicating viralinduced anemia; and progressively increasing total serum CO2 levels (Extended Data Figure 5a) indicative of pulmonary dysfunction.
As before, vRNA was detected in BAL, NS and BS at 1–3 dpi (Fig 2q–s) and in RS after 1 dpi (Extended Data Figure 5i). At necropsy (3 dpi), SARS-CoV-2 vRNA was detected in 23/24 random lung sections analyzed. Six-8 log copies/100 mg of lung tissue was detected from every lobe (Fig 2t). The ~4-log increase in BAL vRNA from 1 to 2 dpi (Fig 2q) was consistent with early active replication of SARS-CoV-2, a finding verified by significant subgenomic vRNA levels (6 logs) at 3 dpi (Fig2u) which was ~2 logs lower than detected vRNA (Fig2v). Thus, SARS CoV2 induces a rapid replicative response in lungs evident within 3 days which subsides by two weeks with low vRNA (Fig 2w) and no subgenomic vRNA detected in 14–17 dpi lung samples (Fig 2x). The vRNA titers in BAL and NS of Rhesus macaques demonstrated a strong positive correlation with the vRNA titers in Lungs at both endpoints (Extended Data Figure 1 f–h).
Examination at day 3 necropsy revealed findings of interstitial and alveolar pneumonia (Fig 2y). Supplementary Table 7 summarizes the histopathologic findings. The lung was again the most affected organ (Fig 2y, Supplementary Table 7, Extended Data Figure 6). Multifocal, mild to moderate interstitial pneumonia characterized by infiltrates of neutrophils, macrophages, lymphocytes, and eosinophils was present in all four animals (Fig 2y lower panel, Extended Data Figure 6d, e, g, h), and was accompanied by variable fibrosis (4/4, Extended Data Figure 6e), fibrin deposition (3/4, Extended Data Figure 6c), and vasculitis (3/4, Extended Data Figure 6f). All four macaques exhibited the following: 1) Syncytial cells in the epithelial lining and/or alveolar lumen (Extended Data Figure 6e, g, k); 2) Bronchitis characterized by infiltrates of eosinophils within the bronchial wall and epithelium (Fig 2y upper panel, Extended Data Figure 6i, j, k); Bronchus-associated lymphoid tissue (BALT) hyperplasia (Extended Data Figure 6i); and 4) Minimal to moderate lymphoplasmacytic and eosinophilic tracheitis and rhinitis.
Fluorescence immuno-histochemical analysis revealed SARS CoV-2 proteins in lungs (Fig 2z upper panel, Supplementary Figure 2a, g, Supplementary Figure 3a, d, g, j), nasal epithelium (Fig 2z, lower panel, Supplementary Figure 2b, h, Supplementary Figure 3b, e, h, k) and tonsils (Supplementary Figure 2c, i, Supplementary Figure 3c, f, I, l). In all tissues, including lungs (Fig 2y, upper panel, Supplementary Figure 2 a, g), nasal epithelium (Fig 2z, upper panel, Supplementary Figure 2 b, h) and tonsils (Supplementary Figure 2 c, i), N antigen was detected in cells expressing ACE2 and in adjacent cells consistent with SARS-CoV-2 utilizing ACE2 to bind, internalize and proliferate inside cells7,8. ACE2 protein levels were much lower in lung tissues derived from naïve compared to those following SARS-CoV-2 infection (Supplementary Figure 2 m, n), a finding consistent with a recent RNAseq analysis showing up-regulation of ACE2 following infection, especially among young macaques9. The majority of S signal was detected in the epithelial layer with discrete distribution throughout the lung tissue (Supplementary Figure 3a, d). In the nasal cavity, virus was observed in epithelial lining cells (Supplementary Figure 3b, h), but was distributed throughout tonsillar tissue (Supplementary Figure 2c, i). Thus, viral replication is supported in the upper and lower lung compartments during the first 3 days of infection and viral antigens are detected at high levels in the lungs.
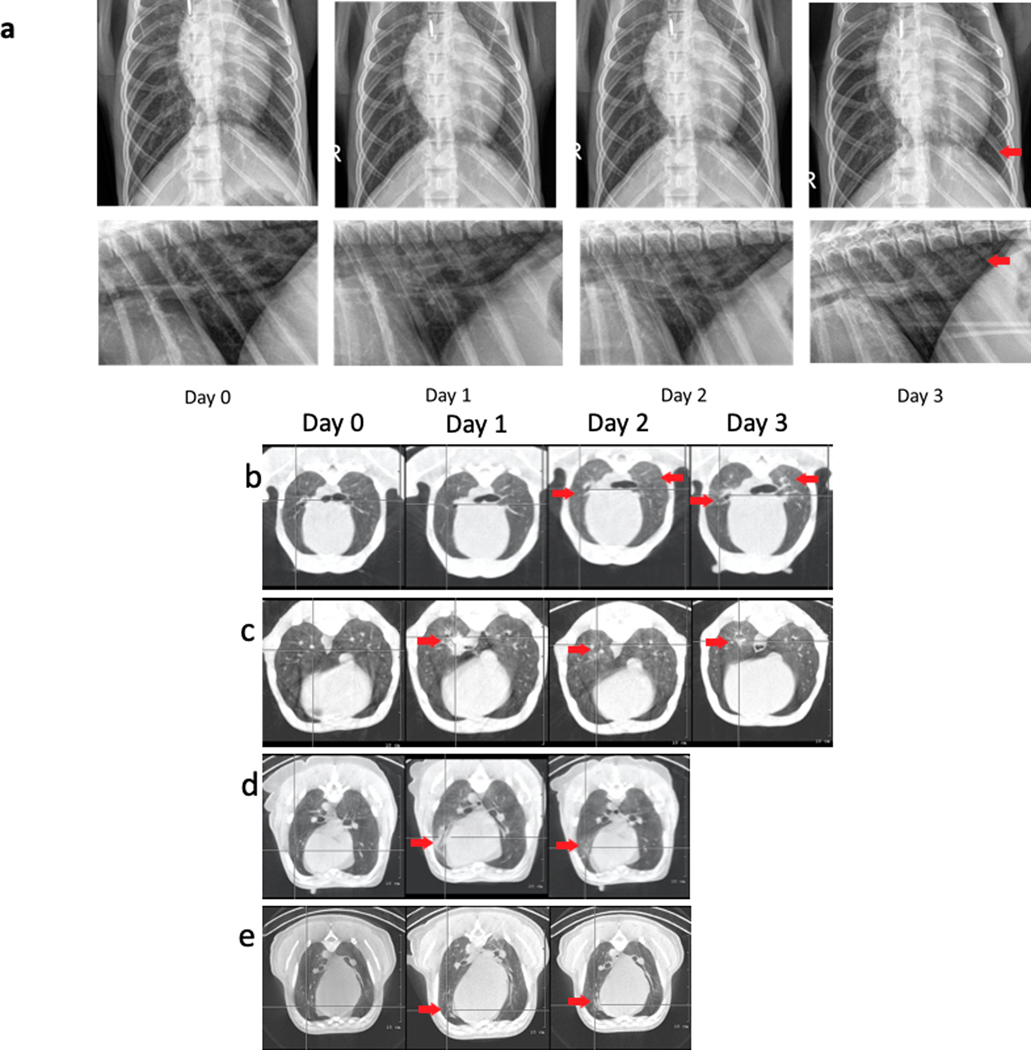
CXRs of all four infected macaques showed progressive increase in CXR abnormality scores (Fig 3a, Extended Data Figure 7a). The 2 and 3 dpi CXR scores were significantly elevated relative to baseline (Fig 3a), with partial resolution of specific lesions at 2 or 3 dpi (Extended Data Figure 7a). There were mild-to-severe multifocal interstitial-to-alveolar patterns with soft tissue opacities in various lobes or diffusely in some animals, with more severe abnormalities in the lower lung lobes, and with the most severe findings at 3 dpi (Extended Data Figure 7a). Lung CT scans showed increased multifocal pulmonary infiltrates with ground glass opacities in various lobes, linear opacities in the lung parenchyma, nodular opacities in some lung lobes, and increased soft tissue attenuation extending primarily adjacent to the vasculature within 1 dpi (Fig 3c, Extended Data Figure 7b–e). In some animals, multifocal alveolar pulmonary patterns and interstitial opacities were observed in lobe subsections, with soft tissue attenuation and focal border effacement with the pulmonary vasculature. Features intensified at 2–3 dpi, primarily in the lung periphery, but also adjacent to the primary bronchus and the vasculature (Fig 3d, Extended Data Figure 7b). In other animals, progressive alveolar or interstitial pulmonary patterns were observed at 2 dpi (Fig 3c). While ground glass opacities in some lobes intensified at 2 dpi, others resolved (Extended Data Figure 7c, d). In one animal, the individual nodular pattern at 1 dpi evolved to a multifocal soft tissue nodular pattern in multiple lobes with associated diffuse ground glass opacities (Extended Data Figure 7d). At 3 dpi, persistent, patchy, fairly diffuse ground glass pulmonary opacities existed in many lung lobes with multifocal nodular tendency (Extended Data Figure 7e). Overall, CT abnormality scores continuously increased over the 3 dpi (Fig 3e). Percent change in the hyperdensity volume was calculated using CT scans to quantify pathological changes over time 10. We observed a significant increase in lung hyperdense areas from 1 to 3 dpi (Fig 3f–j). Together, CXR and CT scans revealed moderate multi-lobe pneumonia in all infected animals (Fig 3j), confirming the histopathology results (Fig 2w, x, Extended Data Figure 6) in the very early phase of SARS-CoV-2 infection in macaques.
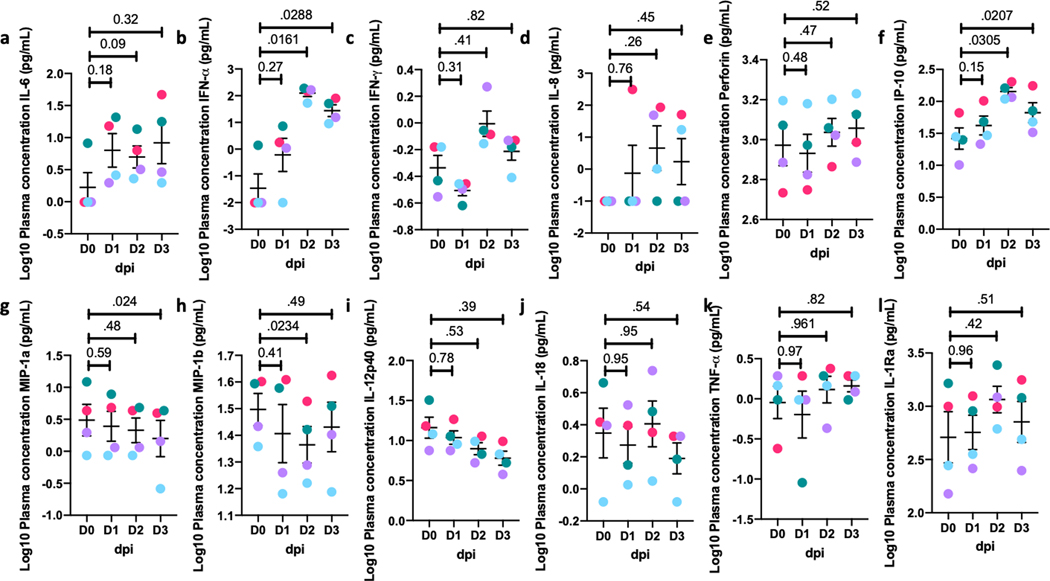
IL-6, IFN-α, IFN-γ, IL-8, perforin, IP-10, MIP1-α and MIP1-β (Fig 3k–v) were all significantly elevated in BAL fluid of acutely infected macaques. Of particular interest was elevated IFN-α (Fig 3l), which has critical anti-viral activity, including against SARS-CoV-2 11. Expression of a downstream Type-I interferon-regulated gene IP-10 (CXCL-10), which promotes the recruitment of CXCR3+ Th1 T cells, was also increased (Fig 3p). Therefore, macaques mount an early anti-viral response to SARS-CoV-2 infection. Type I IFNs and IL-6 are key components of a “cytokinestorm” which promote acute respiratory distress syndrome (ARDS) associated with both SARS-CoV-1 and −2, when induced uncontrollably12. Of plasma cytokine levels tested (Extended Data Figure 8), IFN-α and IP-10 were also significantly elevated at 2 and 3 dpi (Extended Data Figure 8b, f). Thus, clinical, imaging, pathology and cytokine analyses provide evidence for an acute SARS-CoV-2 infection in macaques, which leads to a moderate pneumonia, with early activation of anti-viral responses.
Myeloid cell response in the lungs of infected rhesus macaques
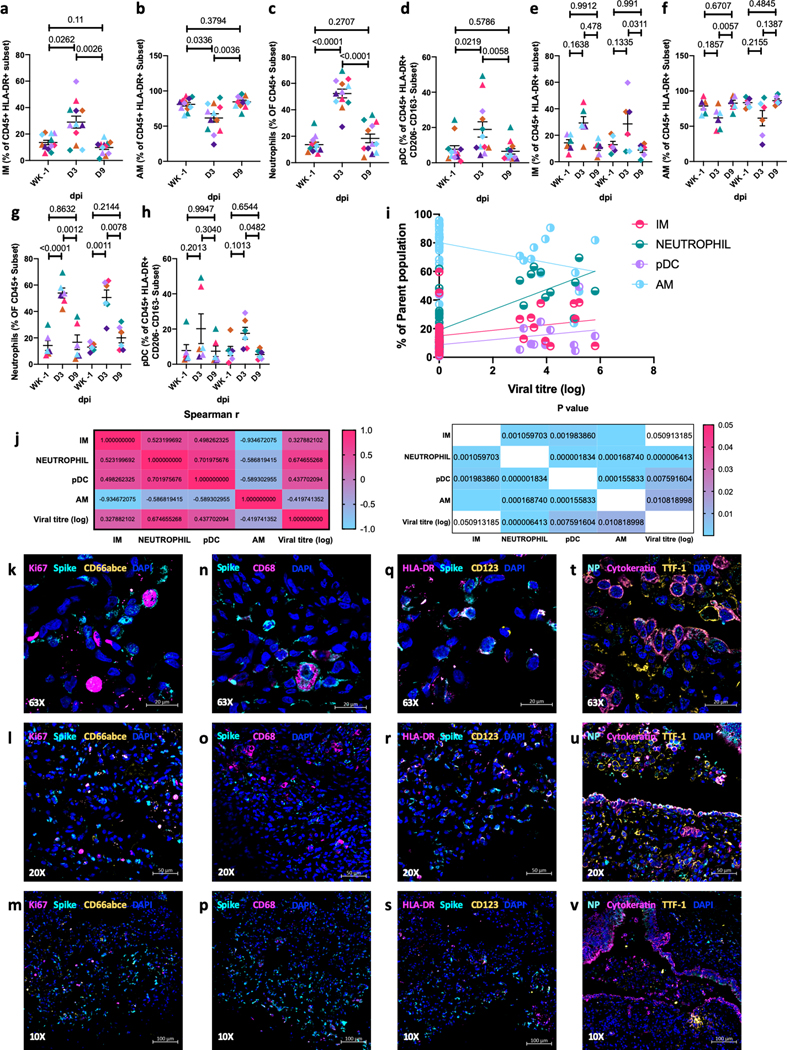
BAL is predominantly comprised of alveolar macrophages (AMs) in healthy lungs13. BAL and peripheral blood cellular composition14,15 of SARS-CoV-2 infected macaques in our longitudinal study showed markedly altered immune cell composition and responses at necropsy. Infection moderately increased the proportions of BAL myeloid cells [interstitial macrophages (IMs, Fig 4a, e), neutrophils (Fig 4c, g) and plasmacytoid dendritic cells (pDCs, Fig 4d, h)] at 3 dpi with no age effect. In contrast, resident AM levels declined significantly at 3 dpi (Fig 4b, f). The increase in myeloid subpopulations at 3 dpi was highly correlated with vRNA levels (Fig4j). Multi-label confocal imaging of Ki67 staining showed that few of the virally-infected cells in lung tissue actively proliferated (Fig 4k–m). Neutrophils (Fig 4k–m, Extended Data Figure 9a, i), macrophages (Fig 4m–o, Extended Data Figure 9b, j) and pDCs (Fig 4o–q, Extended Data Figure 8 c, k) recruited to the lung harbored high levels of viral proteins (Fig 4k–s, Extended Data Figure 9). In addition, resident epithelial cells, Type 1 and Type 2 pneumocytes all harbored viral antigens (Fig 4t–v, Extended Data Figure 9d, l). These are also reported to be the primary alveolar cells with high ACE2 expression and SARS-CoV-2 signal in NHPs16 and humans17. These data suggest that early infection of resident alveolar cells might trigger the cytokine storm that induces rapid lung influx of specialized myeloid cell subsets known to express Type I IFNs and other pro-inflammatory cytokines is a key event in the control of SARS-CoV-2 infection. Relative to AMs, IMs have a shorter half-life, exhibit continuous turnover, help to maintain homeostasis and protect against continuous pathogen exposure from the environment18. Increased lung recruitment of pDCs suggests a potentially important feature of protection from advanced COVID-19 disease since they are a major source of Type I interferons such as IFN-α which is elevated in BAL within 1–3 dpi (Fig 3l, Extended Data Figure 8b).
Figure 4. Accumulation of myeloid cells in BAL of infected rhesus macaques.
Flow cytometric analysis of BAL IMs (a, e), AMs (b, f), neutrophils (c,g), and pDCs (d, h). Data shown combined for age (a-d) (n=12); data split by age (g-h) (n=6). Data is represented as mean± SEM. (a-d) One way and 36 two way Repeated-measures ANOVA with Geisser-Greenhouse correction for sphericity and Tukey’s post hoc correction for multiple-testing (GraphPad Prism 8) was applied. (Old-Triangle, Young Diamonds, Colors represent individual animals, Supplementary Table 1). (n=12). Correlations with Spearman’s rank test between cellular fraction and Log10 viral RNA copy number in BAL (i) and corresponding values for Spearman’s rank correlation coefficient (j, left panel) and P values (j, right panel). Coloring scheme for i – Neutrophil (teal), IM (magenta), AM (turquoise, pDC (light purple). Multilabel confocal immunofluorescence microscopy of FFPE lung sections from SARS CoV-2 infected Rhesus macaques having a high viral titer at 3 dpi with DAPI (blue) (k-v) and SARS CoV-2 Spike (k-s) specific antibody (turquoise), k-m: KI-67 (magenta) 37, neutrophil marker CD66abce (yellow); n-p: SARS CoV-2 Spike (turquoise), pan-macrophage marker CD68 (magenta) and DAPI (blue); q-s: SARS CoV-2 Spike (turquoise), HLA-DR (magenta), pDC marker CD123 (yellow) and DAPI (blue); t-v: SARS CoV-2 Nucleocapsid protein specific antibody (turquoise), Pan-cytokeratin (magenta), Thyroid transcription factor-1 (yellow) at 63X (k,n,q,t), 20X (l,o,r,u) and 10X (m,p,s,v).
T cell, antibody and cytokine responses in lungs of infected-rhesus macaques
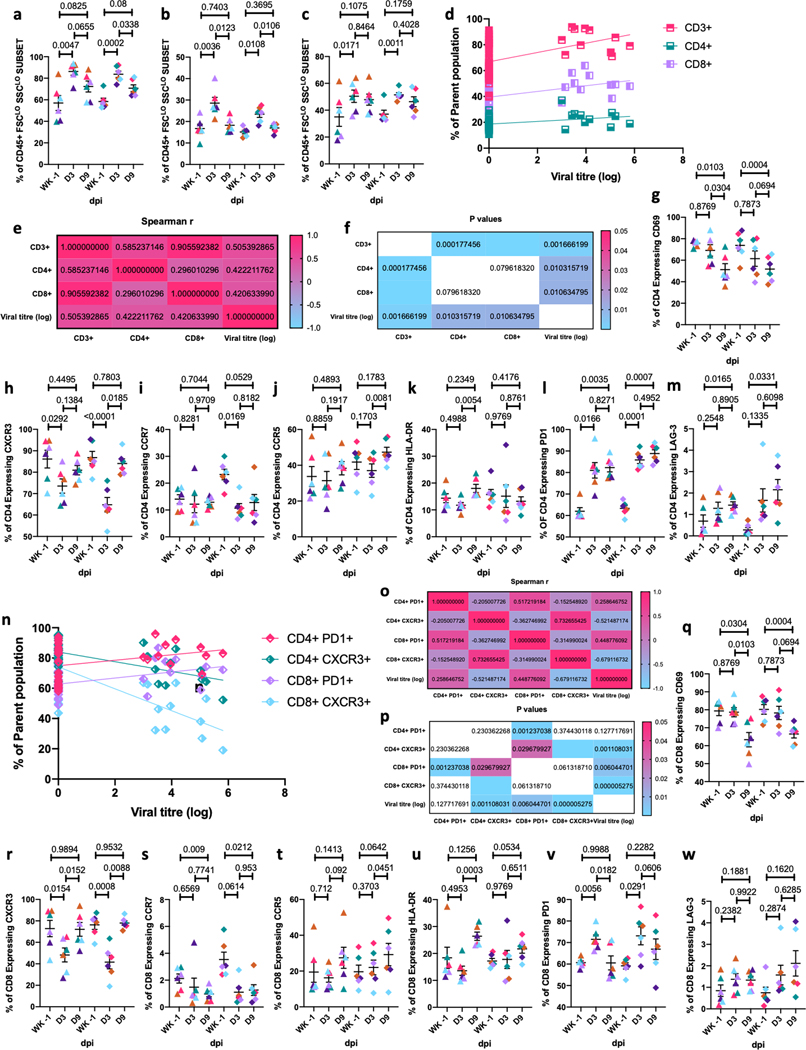
Macaque infection resulted in a significant T cell influx to the alveolar space by 3 dpi, which normalized by 9 dpi (Fig 5a–c) and correlated significantly with BAL viral titer (Fig 5d–f). Following infection, BAL CD4+ T cells expressed significantly lower levels of antigen-experience/tissue residence (CD69), Th1 (CXCR3), memory (CCR7), and activation (HLA-DR) (Fig 5g–k) markers. In contrast, CD4+ T cells expressing PD-1 and LAG-3 (Fig 5l,m) significantly increased. CXCR3 expression on CD4+ T cells showed significant negative correlation with viral titer while PD1 expression was positively correlated but not significant (Fig5n–p). A similar effect was observed in BAL CD8+ T cell subsets, where CD69, CXCR3, and CCR7 expression (Fig5q–u) was significantly reduced following infection whereas PD-1 and LAG-3 expression (Fig5v,w) was significantly increased. PD1 expression on CD8 subsets positively correlated with BAL viral titer while CXCR3 expression was inversely correlated (Fig5n–p). There were no age-related differences in T cell responses. Rapid influx of myeloid cells expressing Type I IFNs likely results in immune control of SARS-CoV-2 infection, but allows for viral antigens to persist which recruits T cells with a profile associated with immune activation in the effector phase.
Figure 5. T cells in BAL of infected rhesus macaques.
BAL Frequencies of CD3+ T cells (a), CD4+ T cells (b), CD8+ T cells (c) and their correlations with Spearman’s rank test between cellular fraction and Log10 viral RNA copy number in BAL (d) and corresponding values for Spearman’s rank correlation coefficient (e) and P values (f). Coloring scheme for d – CD3+ (magenta), CD4+ (tuquoise) & CD8+ (light purple) T Cells. CD4+ T cell subsets expressing early activation marker CD69 (g), CXCR3 (h), PD-1 (i) and memory marker CCR7 (j), CCR5 (k), HLA-DR (l) and LAG-3 (m). Correlations with Spearman’s rank test between PD1 and CXCR3 expression on CD4+ and CD8+ T cells and Log10 viral RNA copy number in BAL (n) and corresponding values for Spearman’s rank correlation coefficient (o) and P values (p). Coloring scheme for n –CD4+ PD1+ (magenta), CD4+ CXCR3+ (teal), CD8+ PD1+ (light purple), CD8+ CXCR3+ (turquoise). CD8+ T cell subsets expressing early activation marker CD69 (q), CXCR3 (r), PD-1 (s) and memory marker CCR7 (t), CCR5 (u), HLA-DR (v) and LAG-3 (w). (Old-Triangle, Young Diamonds, Colors represent individual animals, Supplementary Table 1). (n=12). Fig 5a-c, g-m, q-w: Data is represented as mean± SEM. (n=12) Two way Repeated-measures ANOVA with Geisser-Greenhouse correction for sphericity and Tukey’s post hoc correction for multiple-testing (GraphPad Prism 8) was applied.
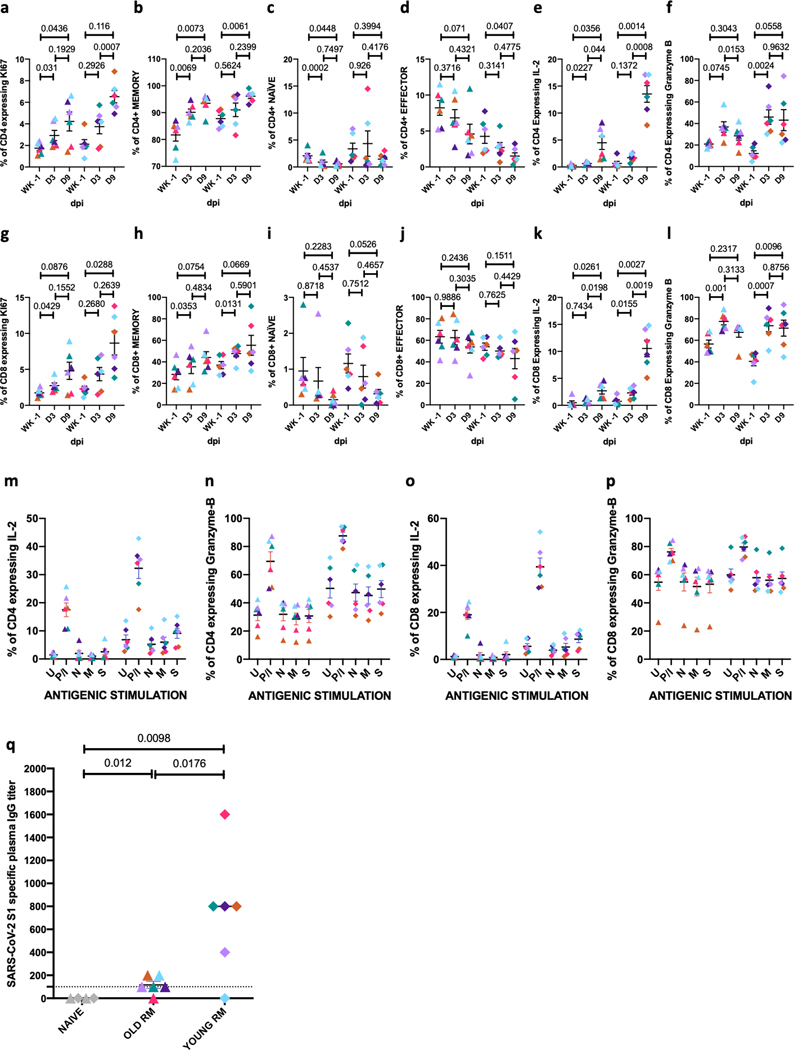
To extrapolate from phenotype to function, we explored proliferation, immune mediator production, and memory phenotypes. BAL CD4+ and CD8+ T cells exhibiting proliferative (Fig 6a, g) and memory markers (Fig 6b, h) were significantly increased after infection whereas those expressing naïve (Fig 6c, i) and effector (Fig 6d, j) phenotypes were significantly reduced. The percentage of CD4+ (Fig 6e) and CD8+ (Fig 6k) T cells expressing IL-2 and Granzyme-B (GZMB) (Fig 6f, l) were significantly elevated. No significant effect of age was observed, although IL-2 expression on T cells was higher for young compared to old macaques. These results suggest that induction of robust T cell immune responses (both CD4+ and CD8+ T cells) are generated in the lung (BAL) as early as day 3 and maintained at 9 dpi in many instances. Following ex vivo re-stimulation of T cells from BAL at 9 dpi with CoV-specific peptide pools, CD4+ and CD8+ T cells expressing IL-2, GZMB, IFN-γ, IL-17 and TNF-α were not significantly elevated beyond baseline values until day 12 (Fig 6).
Figure 6.
Memory T cells in BAL of infected rhesus macaques. BAL Frequencies of CD4+ T cell subsets expressing Ki67 (a), Memory (b), Naïve (c), Effector (d), IL-2 (e) and Granzyme B (f). Frequencies of CD8+ T cell subsets expressing KI67 (g), Memory (h), Naïve (i), Effector (j), IL-2 (k) and Granzyme B (l). BAL cells were stimulated overnight (12–14 hours) with either Mock control (U); PMA-Ionomycin (P/I) or SARS-CoV-2 -specific peptide pools of the nucleocapsid (N), membrane (M) and spike (S) proteins. Antigen specific cytokine secretion in T cells was estimated by flow cytometry. Fraction of CD4+ T cells secreting IL-2 (m), Granzyme B (n); CD8+ T cells secreting IL-2 (o) and Granzyme B (p). Coloring scheme – (Old-Triangle, Young Diamonds, Colors represent individual animals, Supplementary Table 1). (n=12). Data is represented as mean+ SEM. Two way Repeated-measures ANOVA with Geisser-Greenhouse correction for sphericity and Tukey’s post hoc correction for multiple-testing (GraphPad Prism 8) was applied. SARS-CoV-2 spike (S) protein specific antibody titer in plasma of rhesus macaques at endpoint (q). Coloring scheme – Naïve control 38, (Old-Triangle, Young Diamonds, Colors represent individual animals, Supplementary Table 1). Data is represented as mean± SEM. (n=4,6,6) Ordinary one-way ANOVA with Dunnett’s post hoc test (GraphPad Prism 8) was applied.
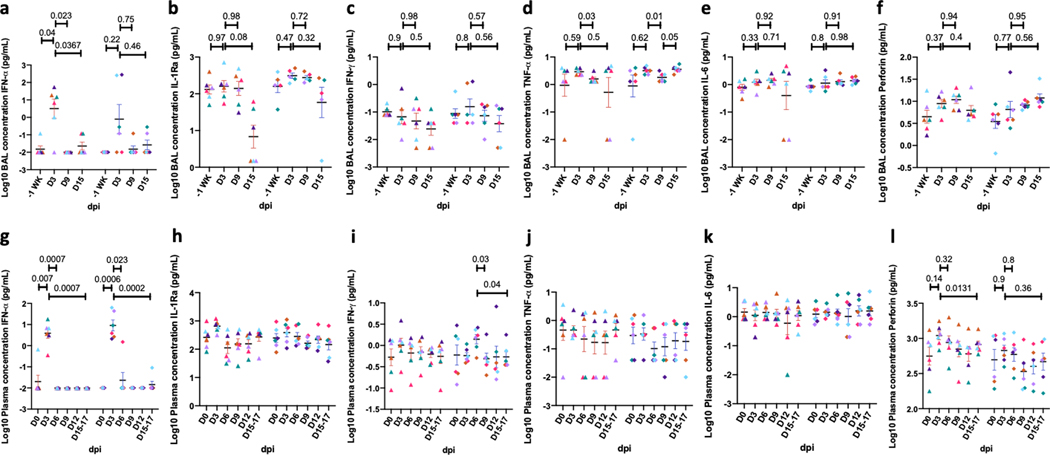
Immunophenotyping results were confirmed by studying cytokine production in BAL and plasma longitudinally (Extended Data Figure 10)19 and spike protein-specific antibodies at necropsy (Fig 6q). IFN-α, IL-1Ra, and IL-6 (Extended Data Figure 10a–c) were elevated in BAL following infection, but levels rapidly normalized after the 3 dpi peak. IFN-α levels were also induced in plasma, but not those of the other cytokines studied (Extended Data Figure 8g). Overall, the longitudinal study immunological results were consistent with the acute infection study in the expression of Type I pro-inflammatory cytokines (IFN-α) and IL-6. Plasma of these macaques contained high levels of viral spike protein-specific IgG at necropsy (Fig 6q). The levels were significantly higher in young versus old animals. Altered antibody production, coupled with T cell exhaustion, in the setting of chronic Type I IFN signaling, has been reported earlier for other chronic viral infections 20–22. In the face of chronic T cell exhaustion, IL-10 responses may result in poor downstream antibody formation, as observed in our results.
Since pulmonary pathology was significantly higher in baboons compared to rhesus macaques (Fig 1u), we studied the expression of various pro-inflammatory and protective cytokines and chemokines in BAL fluid derived from both young and old baboons. MIF, IL-6, CRP and IP-10 (Supplementary Figure 4a–d) expression was significantly induced with the magnitude greater in old animals (Supplementary Figure 4a–d). BAL and serum levels of several other cytokines, chemokines and inflammatory markers were also increased (Supplementary Figure 4e–n, S5), including IL1Ra, perforin, and IL-8. Plasma IP-10, RANTES, and IFN-α levels were elevated (Supplementary Figure 5a–d). The higher persistence of vRNA in some compartments (Fig 1i–l), coupled with greater inflammation severity in the lungs (Fig 1u), suggests that baboons, especially older ones, develop more severe and longer-lasting disease than macaques which is supported by the higher levels of pro-inflammatory cytokines in the BAL of old relative to young baboons (Supplementary Figure 4a–d).
Discussion
Rhesus macaques, baboons and marmosets can all be infected with SARS-CoV-2 but show differential progression to COVID-19. Whereas older marmosets have a mild infection, macaques developed moderate progressive pneumonia that resolves, accompanied by a marked reduction in lung and nasal viral loads. Baboons have the most severe lung pathology, and the greatest viral load in RS. SARS-CoV-2 infection is associated with dynamic lung influxes of specific myeloid cell subsets, particularly IMs, neutrophils and pDCs, and viral proteins can be detected in these cells. This helps explain development of COVID-19 pneumonia and also subsequent control via expression of a strong Type I IFN response. Control of infection is accompanied by resolution of viremia and radiological lesions but viral antigens and remnant histopathological lesions persist over the course of two weeks. Integration of state-of-the-art CT scanning and innovative algorithms to assess the extent of lung involvement with viral loads in NS and BAL have enabled reproducible and quantifiable metrics of infection. Our experimental model have been useful for preclinical testing of candidate vaccines23 and therapies24 for COVID-19.
We were unable to detect replicative virus from the lungs using either plaque assays or subgenomic PCR after two weeks of infection, although live virus was readily recovered after 3 dpi using both methods. However, various SARS-CoV-2 protein antigens were detected after two weeks in the tissues of NHPs, suggesting antigenic but not viral persistence. This is supported by the finding of correlation of PD-1 expression on CD8+ T cells with vRNA in BAL and lack of induction of antigen-specific immune effector cytokine production by these cells might also be due to the comparatively shorter duration of the study since longer studies have clearly established a protective T cell immunity in SARS CoV2 infection25,26. Although there was viral clearance and improvement in radiological scores over the course of the study, inflammation parameters studied and histology were more protracted resulting in a limited correlation between endpoint histological and radiological scores. Furthermore, pathways related to angiogenesis and thrombosis are enriched in lungs of infected macaques compared to healthy macaques9. Histopathology was performed at 3dpi and 12/14 dpi; we expect that radiologic lesions at 6dpi are a combination of the features described above.
As COVID-19 disproportionately affects older humans, we included age as an independent variable in our studies. Age-related effects were more pronounced in baboons than macaques. Baboons developed more severe inflammatory lesions compared to macaques. Baboons are also a preferred model for cardiovascular and metabolic diseases including diabetes 27–29; therefore, further development of the baboon model may prove especially useful for the study of such co-morbidities with COVID-19.
Age-related differences during infection in macaques was striking. Older animals generated substantially reduced amounts of SARS-CoV-2-specific antibodies than young macaques. Despite comparable viral replication and immune responses, the effect of age on neutralizing immunity may be a factor in the more pronounced COVID-19 disease in the elderly population. We propose that old macaques could be a useful model for testing therapies and vaccines for elderly humans.
Online Methods
Study approval.
All of the infected animals were housed in Animal Biosafety Level 3 or 4 (ABSL3, ABSL4) at the Southwest National Primate Research Center where they were treated per the standards recommended by AAALAC International and the NIH Guide for the Care and Use of Laboratory Animals. Sham controls were housed in ABSL2. The animal studies in each of the species were approved by the Animal Care and Use Committee of the Texas Biomedical Research Institute and as an omnibus Biosafety Committee protocol.
Animal studies and clinical evaluations.
16 (eight young and eight old, see Supplementary Table 1 for details) Indian-origin rhesus macaques (Macaca mulatta), and six African-origin baboons (Papio hamadryas) all from SNPRC breeding colonies, were exposed via multiple routes (ocular, 100 μL; intranasal, 200 μL - using a MADgic Intranasal Mucosal Atomization Device (Teleflex); intratracheal, 200 μL - using a pediatric-size Laryngo-tracheal Mucosal Atomization Device (Teleflex) of inoculation to 500 μL of an undiluted stock of SARS-CoV-2, which had a titer of 2.1E+06 pfu/mL, resulting in the administration of 1.05×10⁶ pfu SARS-CoV-2. SARS-CoV-2 generated from isolate USA-WA1/2020 was used for animal exposures. A fourth cell-culture passage (P4) of SARS-CoV-2 was obtained from Biodefense and Emerging Infections Research Resources Repository (BEI Resources, catalog number NR-52281, GenBank accession number MN985325.1) and propagated at Texas Biomed. The stock virus was passaged for a fifth time in Vero E6 cells at a multiplicity of infection (MOI) of approximately 0.001. This master stock was used to generate a sixth cell culture passage exposure stock by infecting VeroE6 cells at a MOI of 0.02. The resulting stock had a titer of 2.10E+06 PFU/mL and was attributed the Lot No. 20200320. The exposure stock has been confirmed to be SARS-CoV-2 by deep sequencing and was identical to published sequence (MN985325). strain USA-WA1/2020 (BEI Resources, NR-52281, Manassas, VA). Six Brazilian-origin common marmosets (Callithrix jacchus) were also infected via the combined routes (80μL intranasal; 40μL ocular [20μL/eye]; 40μL oral performed twice for a total of 160μL intranasal, 80μL ocular; 80μL oral and 100μL IT) of the same stock. The total target dose presented to marmosets was 8.82E+05 pfu/mL. We included sham-infected animals which underwent all procedures (with the exception of necropsy) to control for the impact of multiple procedures over the course of this study (Supplementary Table 1). Four macaques, baboons and marmosets each were sham-infected with DMEM-10 media (the storage vehicle of the virus), to be used as procedural controls. Infected animals were euthanized for tissue collection at necropsy, and control animals were returned to the colony. Macaques were enrolled from a specific pathogen-free colony maintained at the SNPRC and were tested free from SPF-4 (simian retrovirus D, SIV, STLV-1 and herpes B virus). All animals including the baboons and the marmosets were also free of Mycobacterium tuberculosis. Animals were monitored regularly by a board-certified veterinary clinician for rectal body temperature, weight and physical examination. Collection of blood, BAL, nasal swab, and urine, under tiletamine-zolazepam (Telazol) anesthesia was performed as described (Supplementary Table 1), except that BAL was not performed in marmosets. Four macaques were sampled daily until euthanized at 3dpi. All other macaques and all the baboons were sampled at 0, 3, 6, 9, 12 dpi and at euthanasia (BAL performed weekly). Blood was collected for complete blood cell analysis and specialized serum chemistries. Animals were observed daily to record alert clinical measurements. Nasal (longitudinal) or nasopharyngeal (acute) swabs and BALs were obtained to measure viral loads in a longitudinal manner, as described earlier 14. Briefly, in a sitting position, the larynx was visualized and a sterile feeding tube inserted into the trachea and advanced until met with resistance. Up to 80ml of warm sterile saline was instilled, divided into multiple aliquots. Fluid was aspirated and collected for analysis.
Chest X-Rays.
Clinical radiographic evaluation was performed as following: The lungs of all animals were imaged by conventional (chest radiography, CXR), as previously described 30. Three view thoracic radiographs (ventrodorsal, right and left lateral) were performed at all sampling time points. High-resolution computed tomography (CT) was performed daily through 3 dpi in 4 infected macaques and on 6 and 12 dpi in 3 young and 3 old macaques as described in the next section. Images were evaluated by a board-certified veterinary radiologist and scored as normal, mild moderate or severe disease. The changes were characterized as to location (lung lobe) and distribution (perivascular/peribronchial, hilar, peripheral, diffuse, multifocal/patchy).
CT Imaging and quantitative analysis of lung pathology.
The animals were anesthetized using Telazol (2–6mg/kg) and maintained by inhaled isoflurane delivered through Hallowell 2002 ventilator anesthesia system (Hallowell, Pittsfield, MA). Animals were intubated to perform end-inspiratory breath-hold using a remote breath-hold switch. Lung field CT images were acquired using Multiscan LFER150 PET/CT (MEDISO Inc., Budapest, Hungary) scanner. Image analysis was performed using 3D ROI tools available in Vivoquant (Invicro, Boston, MA). Percent change in lung hyperdensity was calculated to quantify lung pathology (1, 2). The lung volume involved in pneumonia, was quantified as follows: briefly, lung segmentation was performed using a connected thresholding feature, to identify lung ROI by classifying all the input voxels of scan in the range of −850 HU to −500 HU. Smoothing filters were used to reassign every ROI voxel value to the mode of the surrounding region with defined voxel radius and iterations to reconstruct the Lung ROI. Thereafter, global thresholding was applied to classify the voxels within Lung ROI in the range of −490 HU to +500 HU to obtain Lung hyperdensity ROI. The resultant ROIs were then rendered in the maximum intensity projection view using the VTK feature.
Viral RNA determination.
Viral RNA from plasma/sera, BAL, urine, saliva, and swabs (nasal/nasopharyngeal, oropharyngeal, rectal) and lung homogenates was determined by RT-qPCR and viral RNA isolation as previously described for MERS-CoV and SARS-CoV (12, 27, 28). RNA extraction from fluids was performed using the EpMotion M5073c Liquid Handler (Eppendorf) and the NucleoMag Pathogen kit (Macherey-Nagel). 100 μL of test sample were mixed with 150 μL of 1X DPBS (Gibco) and 750 μL TRIzol LS. Inactivation controls were prepared with each batch of samples to ensure no cross contamination occurred during inactivation. Samples were thawed at room temperature and then, for serum, swabs and urine samples 10μg yeast tRNA was added, along with 1E+03 pfu of MS2 phage (Escherichia coli bacteriophage MS2, ATCC). DNA LoBind Tubes (Eppendorf) were prepared with 20 μL of NucleoMag B-Beads (NucleoMag Pathogen kit, Macherey-Nagel) and 975 μL of Buffer NPB2 (NucleoMag Pathogen kit, Macherey-Nagel). After centrifugation, the upper aqueous phase of each sample was transferred to the corresponding new tube containing NucleoMag B-Beads and Buffer NPB2. The samples were mixed using HulaMixer (Thermo Fisher Scientific Inc.) rotating for 10 min at room temperature. Samples were then transferred to the sample rack on EpMotion M5073c Liquid Handler (Eppendorf) for further processing according to NucleoMag Pathogen kit instructions. For viral RNA determination from tissues, 100mg of tissue was homogenized in 1mL Trizol Reagent (Invitrogen, Grand Island, NY, USA) with a Qiagen (Germantown, MD, USA) steel bead and Qiagen Stratagene TissueLyser. For detection of infectious virus, briefly, tissues were homogenized 10% w/v in viral transport medium using Polytron PT2100 tissue grinders (Kinematica). After low-speed centrifugation, the homogenates were frozen at −70°C until they were inoculated on Vero E6 cell cultures in 10-fold serial dilutions. The SARS-CoV-2 RT-qPCR was performed using a CDC-developed 2019-nCoV_N1 assay with the TaqPath™ 1-Step RT-qPCR Master Mix, CG (ThermoFisher). The assays were performed on a QuantStudio 3 instrument (Applied Biosystems) with the following cycling parameters: Hold stage 2 min at 25°C, 15 min at 50°C, 2 min at 95°C. PCR stage 45 cycles of 3 s at 95°C, 30 s at 60°C. Primer and probe info: 2019-nCoV_N1-F: GACCCCAAAATCAGCGAAAT (500nM); 2019-nCoV_N1-R: TCTGGTTACTGCCAGTTGAATCTG (500 nM); 2019-nCoV_N1-P FAM/MGB probe: ACCCCGCATTACGTTTGGTGGACC (125nM).
RNA extraction for Subgenomic viral RNA determination via RT-qPCR
Samples were inactivated using TRIzol LS Isolation Reagent (Invitrogen): 250 μL of test sample were mixed with 750 μL TRIzol LS. Inactivation controls were prepared with each batch of samples. Prior to extraction, 1e+03 pfu of MS2 phage (Escherichia coli bacteriophage MS2, ATCC) was added to each sample to assess extraction efficiency RNA extraction was performed using the EpMotion M5073c Liquid Handler (Eppendorf) and the NucleoMag Pathogen kit (Macherey-Nagel). Extraction controls were prepared with each batch of samples. After processing, the presence of the eluate was confirmed and the extracted RNA was stored at - 80°C±10°C.
Determination of Viral load via RT-qPCR
RNA sample (5 μL) was taken to duplex RT-qPCR reaction detecting both SARS-CoV-2 and MS2 phage. Two assays were used to assess SARS-CoV-2 present in the samples. The CDC-developed 2019-nCoV_N1 assay was used to target a region of the N gene. SARS-CoV-2_N1 probe (ACCCCGCATTACGTTTGGTGGACC) is labeled with 6-FAM fluorescent dye. The forward primer sequence is: GACCCCAAAATCAGCGAAAT, and the reverse primer sequence is: TCTGGTTACTGCCAGTTGAATCTG. A secondary qPCR assay to measure subgenomic RNA was also performed to target a region of E (Envelope)31,32. The probe is also labeled with 6-FAM fluorescent dye (ACACTAGCCATCCTTACTGCGC TTCG). The forward primer sequence is: CGATCTCTTGTAGATCTGTTCTC, and the reverse primer sequence is: ATATTGCAGCAGTACGCACACA. The MS2 probe is labeled with VIC fluorescent dye. Both assays used the TaqPath™ 1-Step RT-qPCR Master Mix, CG (ThermoFisher) and were performed on a QuantStudio 3 instrument (Applied Biosystems). QuantStudio Design and Analysis Software (Applied Biosystems) was used to run and analyze the results. Cycling parameters were set as follows: Hold stage 2 min at 25°C, 15 min at 50°C, 2 min at 95°C. PCR stage: 45 cycles (N1 assay) or 40 cycles (E assay) of 3 sec at 95°C, 30 sec at 60°C. The average Ct value for MS2 phage was calculated for all processed samples and SARS-CoV-2 quantification only performed in samples in which the MS2 Ct value was lower than Average MS2 + 5%.
Pathology.
Animals were euthanized and complete necropsy was performed. Gross images (lung, spleen, liver) and organ weights (lymph nodes, tonsil, spleen, lung, liver, adrenal glands) were obtained at necropsy. Representative samples of lung lymph nodes (inguinal, axillary, mandibular and mediastinal), tonsil, thyroid gland, trachea, heart, spleen, liver, kidney, adrenal gland, digestive system (stomach, duodenum, jejunum, ileum, colon, and rectum), testes or ovary, brain, eye, nasal tissue, and skin were collected for all animals. Tissues were fixed in 10% neutral buffered formalin, processed to paraffin, sectioned at 5 um thickness, stained with hematoxylin and eosin utilizing standard methods, and evaluated by a board-certified veterinary pathologist.
Tissue processing, flow cytometry, multiplex cytokine analyses, immunohistochemistry, multicolor confocal microscopy and SARS-CoV-2 specific-antibody response detection for immune evaluations.
Flow cytometry was performed as previously described14,33 on blood and BAL samples collected on time points days 3, 6, 9, 12, and at endpoint, which occurred at 14–17 dpi for various animals. A comprehensive list of antibodies used in these experiments is provided in Supplementary Table 8. For evaluations on peripheral blood, PBMC were prepared as previously described. Briefly, Cellular phenotypes were studied using antibodies: CD3 (clone SP34–2), CD4 (clone L200), CD69 (clone FN50), CD20 (2H7), CD95 (clone DX2), KI67 (B56), CCR5 (3A9), CCR7(clone 3D12), CD28 (clone CD28.2), CD45 (clone D058–1283), CXCR3 (clone 1C6/CXCR3), HLA-DR (clone L243), CCR6 (clone 11A9), LAG-3 (Polyclonal, R&D Systems, Minneapolis, MN, USA), CD123 (clone 7G3), CD14 (clone M5E2), CD206 (clone 206), CD16 (clone 3G8), CD163 (GHI/61), CD66abce (Clone TET2, Miltenyi Biotech, USA), CD40 (clone 5C3), IL-2(clone MQ1–17H12), Granzyme-B (clone GB11) all purchased from BD Biosciences (San Jose, CA, USA) unless specified. CD8 (clone RPA-T8), CD11c (clone 3.9), TNF-alpha (clone MAb11), IFN-gamma (clone B27), IL-17 (clone BL168) and PD-1 (clone EH12.2H7) were purchased from BioLegend, San Diego, CA, US. For antigenic stimulation cells were cultured overnight with SARS-CoV-2 specific peptide pools of the nucleocapsid (N), membrane (M) and spike (S) proteins (PepTivator SARS-CoV-2 peptide pool, Miltenyi Biotech, USA). A detailed gating strategy for detection and enumeration of various cellular phenotypes is described (Supplementary Figure 6).
Immuno-histochemistry was performed on 4 μm thick sections of lung, nasal cavity and tonsils. The sections were baked at 65°C for 30 min followed by de-paraffinization using Xylene and subsequent hydration with decreasing gradations of ethanol as described 14,34. Heat induced antigen retrieval was performed using Sodium citrate buffer (10mM, pH 6.0) followed by blocking (3 % BSA in TBST for 1 h at 37°C). For SARS CoV-2 detection, specimens were incubated with rabbit SARS CoV-2 spike (S) antibody (ProSci, USA, 1:200, 37°C for 2 h) or anti-SARS CoV-2 nucleocapsid (N) antibody (Sino Biologicals, USA, 1:100, 2h at 37°C). Antihuman ACE-2 (R&D Systems, USA, 1:50, 2h at 37°C) was used for identification of ACE-2. Mouse anti-human CD66abce-PE conjugated (Miltenyi Biotech, USA, 1:20, 2 h at 37°C) was used for identification of neutrophils; mouse CD68 (Thermo Fisher Scientific, USA, 1:100, 2 h at 37°C) for macrophages and pDC’s were identified by co-staining of PE conjugated mouse anti-human CD123 (BD Biosciences, USA, 1:20, 37°C for 2h) and mouse anti-human HLA-DR antibody (Thermo Fisher Scientific, USA, 1:100, 2 h at 37°C). Also, mouse anti-Ki67 (BD Biosciences, USA, 1:50, 2 h at 37°C) was used for detection of actively proliferating cells. Pan-cytokeratin mouse Monoclonal Antibody (AE1/AE3), Alexa Fluor 488 (Thermo Fisher Scientific, USA, 1:50, 2 h at 37°C) was used to detect Type-1 Pneumocytes and epithelial cells and TTF-1 mouse monoclonal antibody (Thermo Fisher Scientific, USA, 1:200, 2 h at 37°C) was used for detection of Type-2 pneumocytes. Chicken anti-rabbit IgG (H+L), Alexa Fluor 488 conjugate; goat anti-mouse IgG (H+L), Alexa Fluor 647 conjugate; donkey anti-mouse IgG (H+L), Alexa-Fluor 555 conjugate; donkey anti Goat IgG (H+L), Alexa Fluor 555; Goat anti Mouse IgG1 Secondary Antibody, Alexa Fluor 555 (Thermo Fisher Scientific, USA, 1:400, 1 h at 37°C) were used for labelling Spike and Nucleocapsid; Ki67 and HLA-DR; CD68; ACE-2; and TTF-1 primary antibodies respectively.
Tissue sections were then stained with DAPI (Thermo Fisher Scientific, USA, 1:5000, 5 min at 37°C) with subsequent mounting with Prolong Diamond Antifade mountant (Thermo Fisher Scientific, USA). Ziess LSM 800 confocal microscope was used to visualize the stained sections (10X, 20X and 63X magnification). RNA was isolated for qPCR and data analyzed as described 19.
Antibody response against SARS-CoV-2 was measured by an enzyme-linked immunosorbent assay (ELISA) using SARS-CoV-2 Spike S1 subunit protein (Sino Biological) as the capture antigen. Each well of a 96-well microtiter plate (Corning, catalog # 2592) was coated with 100 ng of protein in 100 μl carbonate-bicarbonate buffer (pH 9.6) and incubated overnight at 4’c. Next day, plate was washed twice with 1X PBS containing 0.05% tween 20 (PBST) followed by blocking with 5% non-fat dry milk in PBST at room temperature for 2 hours. Two-fold serially diluted heat inactivated plasma from infected and control macaques was added to duplicate wells and incubated at 37’c for 1 hour. After 5 washes with 1X PBST, 100 μl of rabbit antimonkey IgG peroxidase conjugate antibody (1:5000 dilution in blocking buffer) was added to each well and incubated at 37’c for 1 hours. Plate was washed 5 times with 1X PBST. SureBlue TMB peroxidase substrate (100 μl) was then added to each well and incubated at room temperature for 10 minutes. Reaction was stopped by adding 100 μl TMB stop solution and the plate was immediately read at 450nm. The endpoint ELISA titer of binding antibodies was defined as the reciprocal of the serum dilution that resulted in positive optical density (OD) reading, which is at least two times the mean OD reading with no plasma control wells. The detection limit of the ELISA was considered to be the starting dilution (1:100) of the test sera.
Statistical analyses.
Graphs were prepared and statistical comparisons applied using GraphPad Prism version 8 (La Jolla, CA). Various statistical comparisons were performed viz. 2-tailed Student’s t-test, ordinary analysis of variance (ANOVA) or one-way or two-way repeated measure analysis of variance (rmANOVA) with Geisser-Greenhouse correction for sphericity and Tukey’s post hoc correction for multiple-testing (GraphPad Prism 8) was applied wherever applicable and as described in the figure legends. For Correlation analysis, Spearman’s rank test was applied. Statistical differences between groups were reported significant when the p-value is less than or equal to 0.05. The data are presented in mean ± SEM.
Extended Data
Extended Data Fig. 1. Longitudinal viral RNA determination following SARS-CoV-2 infection in rhesus macaques.
Viral RNA (log10 copies/mL measured by RT-PCR in buccopharyngeal (a) swab, plasma (b) and urine (c) of rhesus macaques longitudinally 39. Subgenomic viral RNA (log10 copies/gram of lung tissue was measured at endpoint in rhesus macaques and (d) and Baboons (e). (Rhesus: Old-Triangle, Young-Diamonds; Baboon: Old-Inverted triangle, Young-Square, Colors represent individual animals, Supplementary Table 1). (n=12). Data are represented as mean± SEM. Two way Repeated-measures ANOVA with Geisser-Greenhouse correction for sphericity and Tukey’s post hoc correction for multiple-testing (GraphPad Prism 8) was applied. Correlations with Spearman’s rank test between Log10 viral RNA copy number in Lung with BAL and NS (f) and corresponding values for Spearman’s rank correlation coefficient (g) and P values (h). Coloring scheme for f – BAL (magenta circle), NS (teal square).
Extended Data Fig. 2. Gross and histopathologic findings of young and aged male and female Rhesus macaques experimentally exposed to SARS-CoV-2 – 14-17 dpi.
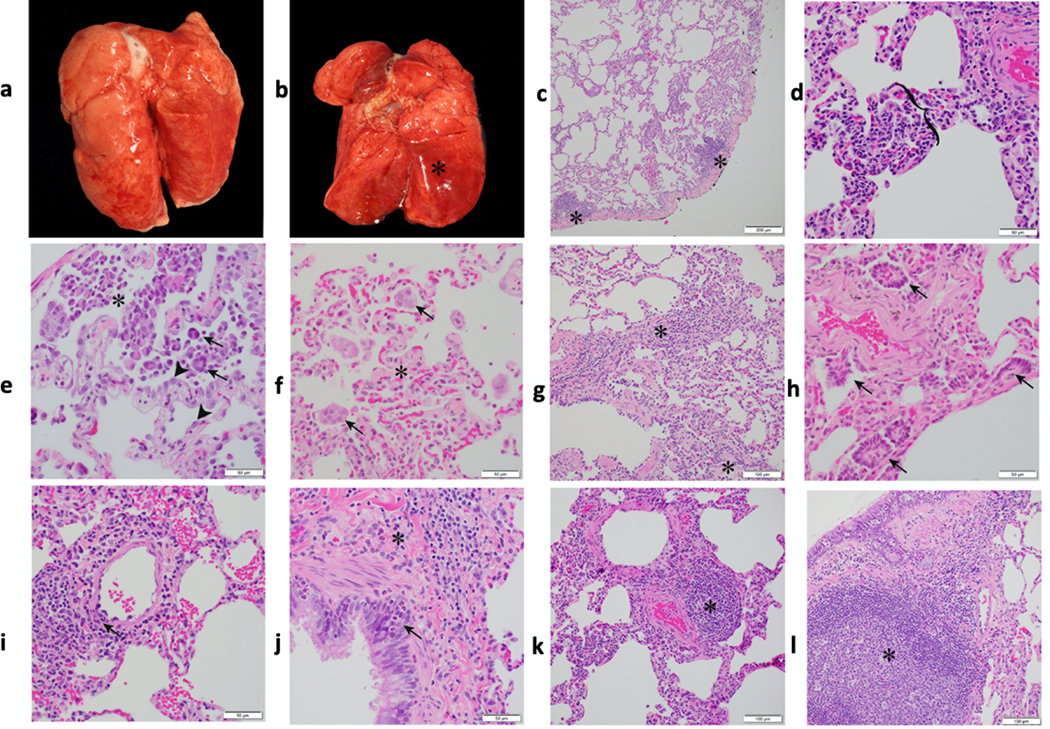
Young male Rhesus macaque. Lung was grossly unremarkable (a). Aged male Rhesus macaque. The dorsal aspect of the lungs was mottled red (b). Young male Rhesus macaque. Lung. Subgross image showing multifocal areas of minimal interstitial pneumonia (*) (c). Young female Rhesus macaque. Lung. Mild lymphocytic interstitial pneumonia with alveolar septa (bracket) expanded by mononuclear cells (lymphocytes and macrophages) (d). Aged female Rhesus macaque. Lung. Mild lymphocytic interstitial pneumonia with increased alveolar macrophages and few syncytial cells (arrow) within the alveolar lumen (*; a neutrophil is just to the left of the *) and type II pneumocytes lining alveoli (arrowhead) (e). Aged female Rhesus macaque. Lung. Minimal interstitial pneumonia with alveolar septa expanded by fibrosis (*) and few syncytial cells (arrow) within alveoli (f). Young male Rhesus macaque. Lung. Alveolar septa expanded by fibrosis (*) and lymphocyte infiltrates (g). Aged male Rhesus macaque. Lung. Areas of bronchiolization (arrows) (h). Young female Rhesus macaque. Lung. Vasculitis. Vascular wall disrupted by infiltrates of mononuclear cells and lesser neutrophils (arrow) (i). Young female Rhesus macaque. Lung. Bronchitis. Bronchial epithelium infiltrated by eosinophils (arrow). Fibrosis adjacent to bronchus (*) (j). Young female Rhesus macaque. Lung. Area of perivascular lymphocyte infiltrates (*) (k). Young female Rhesus macaque. Lung. Area of bronchiolar associated lymphoid tissue (BALT) (*) (l). All slides were stained with H&E. Multiple random fields across all sections from all macaques (n=12, Supplementary Table 2) were analyzed.
Extended Data Fig. 3. Gross and histopathologic findings of young and aged male and female baboons experimentally exposed to SARS-CoV-2 – 14-17 dpi.
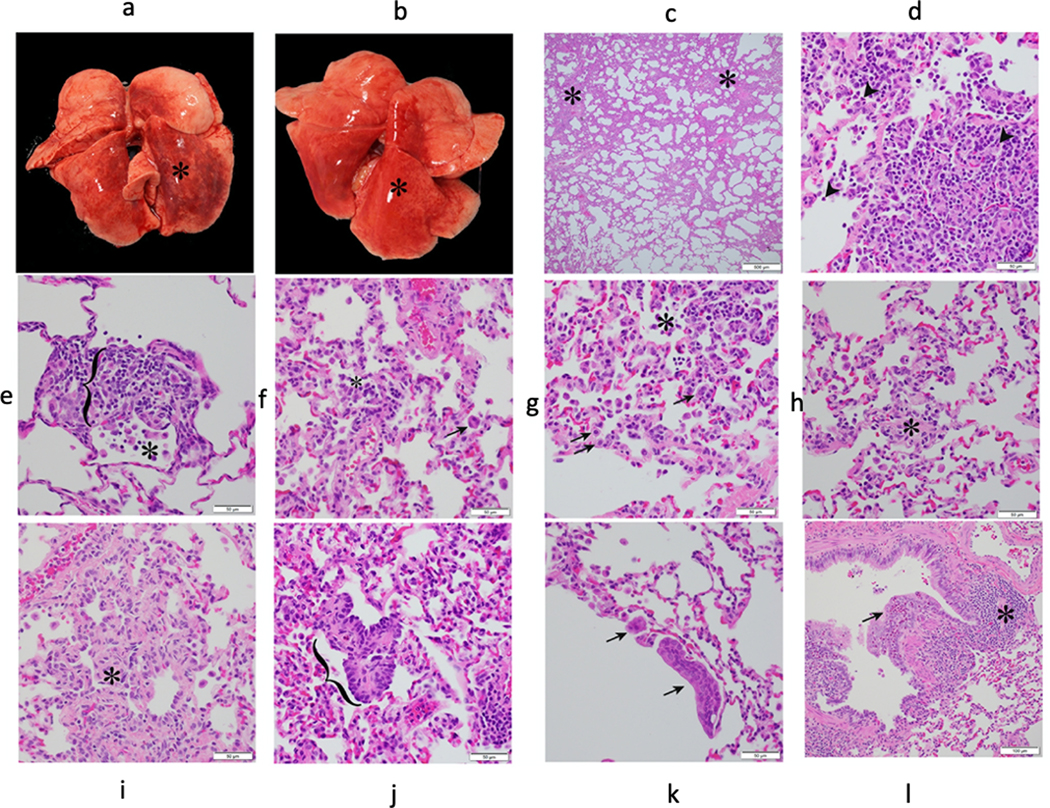
Young male baboon. The dorsal aspect of the lungs was mottled red (*) (a). Young female baboon. The dorsal aspect of the lungs was mottled red (*) (b). Young male baboon. Lung. Subgross image showing areas of consolidation (*) (c). Young female baboon. Moderate lymphocytic interstitial pneumonia with scattered neutrophils (arrowhead) (d). Young female baboon. Moderate lymphocytic interstitial pneumonia with alveolar septa (bracket) markedly expanded by mononuclear cells (lymphocytes and macrophages) and increased alveolar macrophages within the alveolar lumen (*) (e). Young male baboon. Lung. Mild lymphocytic interstitial pneumonia with increased alveolar macrophages and few syncytial cells (arrow) within the alveolar lumen (*) (f). Young female baboon. Mild lymphocytic interstitial pneumonia with scattered type II pneumocytes (arrows) and increased alveolar macrophages and neutrophils within the alveolar lumen (*) (g). Young male baboon. Lung. Alveolar septa expanded by fibrosis (*) (h). Young male baboon. Lung. Alveolar septa expanded by fibrosis (*) (i). Young female baboon. Area of bronchiolization (bracket) (j). Young male baboon. Lung. Syncytial cells within airways (arrows) (k). Young male baboon. Lung. Bronchitis. Bronchial wall expanded by infiltrates of eosinophils that expand and disrupt the epithelium (arrow). Area of bronchiolar associated lymphoid tissue (BALT) (*) (l). All slides were stained with H&E. Multiple random fields across all sections from all baboons (n=12, Supplementary Table 3) were analysed.
Extended Data Fig. 4. Representative CT scan images for rhesus macaques infected with SARS-CoV-2 over two weeks.
Representative CT scan in axial view showing lesion characteristics in rhesus macaques infected with SARS-CoV-2 from Day 6–12 dpi. As seen in panel a, b, d, e and f patchy alveolar patterns, nodular and/or multifocal ground glass opacities (red arrow) seen on Day 6 dpi show dramatic resolution by Day 12 dpi, whereas panel c shows persistent patchy ground glass opacity on Day 6 dpi and Day 12 dpi.
Extended Data Fig. 5. Clinical correlates in short-term (0–3 dpi) rhesus macaques.
Serum levels of tCO2 (D-mmol/L) (a), and whole blood levels of Red Blood Cells (RBCs) (million/mL) (b), reticulocytes (K/mL) (c), White Blood Cells (WBCs) (K/mL) (d), platelets (K/uL) (e), Neutrophils (K/mL) (f), percentage of Neutrophils (g), percentage of monocytes (h). Viral RNA (log10 copies/mL were measured by RT-PCR in saliva (i), and rectal swab (j) of rhesus macaques over 0–3 dpi (Circles, Colors represent individual animals, Supplementary Table 1) Data are represented as mean± SEM (n=4). One way Repeated-measures ANOVA with Geisser-Greenhouse correction for sphericity and Tukey’s post hoc correction for multiple-testing (GraphPad Prism 8) was applied.
Extended Data Fig. 6. Gross and histopathologic findings of young and aged male and female Rhesus macaques experimentally exposed to COVID19 – 3 dpi.
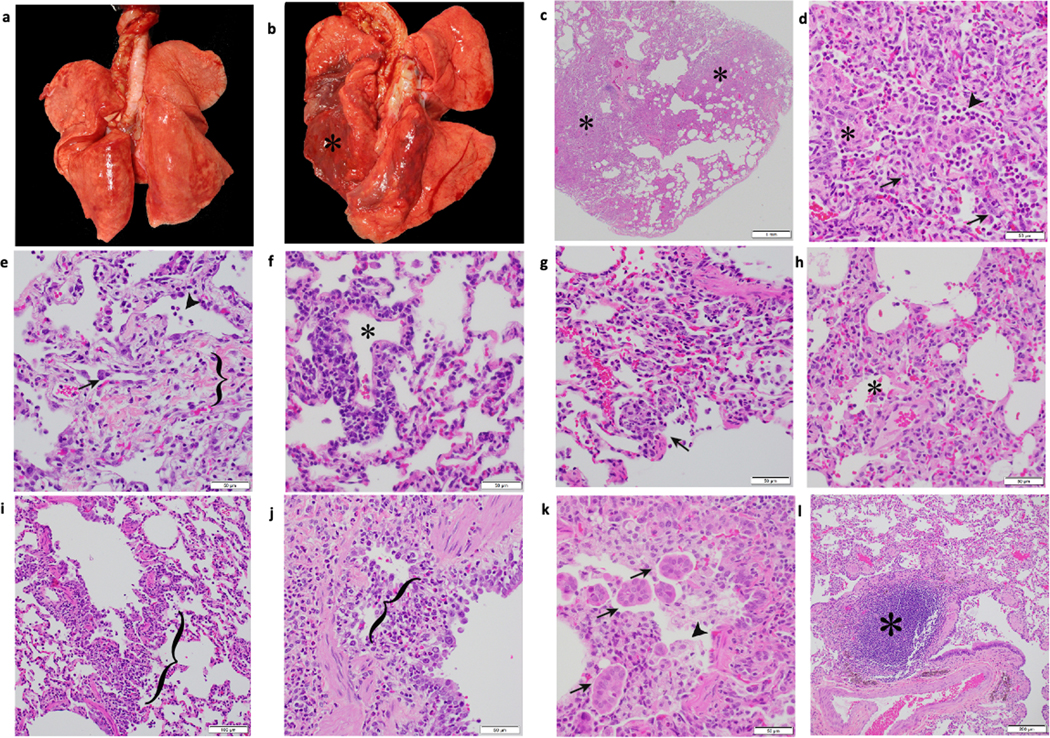
Young male Rhesus macaque. Lung was grossly unremarkable (a). Aged male Rhesus macaque. Lung. The dorsal aspect of the lungs was mottled red (*) (b). Aged male Rhesus macaque. Lung. Sub gross image showing extensive areas of consolidation (*) (c). Aged male Rhesus macaque. Lung. Moderate interstitial pneumonia with scattered type II pneumocytes (arrow), neutrophils (arrowhead), and intra-alveolar fibrin deposition (*) (d). Aged female Rhesus macaque. Lung. Mild interstitial pneumonia with scattered syncytial cells (arrow), neutrophils (arrowhead), and expansion of alveolar walls by fibrosis (bracket) (e). Young female Rhesus macaque. Lung. Vasculitis. Vascular wall disrupted by infiltrates of mononuclear cells and lesser neutrophils. Vessel lumen marked by (*) (f). Young female Rhesus macaque. Lung. Mild interstitial pneumonia. Alveolar spaces contain neutrophils and cellular debris (necrosis, arrow) (g). Young female Rhesus macaque. Lung. Mild interstitial pneumonia. Alveolar spaces (*) contain neutrophils and eosinophilic fluid (edema) (h). Young female Rhesus macaque. Lung. Bronchiolitis. Bronchiolar wall expanded by infiltrates of lymphocytes and macrophages (bracket) (i). Young male Rhesus macaque. Lung. Bronchitis. Bronchial wall expanded by infiltrates of eosinophils that expand and disrupt the epithelium and smooth muscle (bracket) (j). Young female Rhesus macaque. Lung. Bronchitis. Bronchial lumen contains macrophages (arrowhead), cellular debris, and syncytial cells (arrow) (k). Aged female Rhesus macaque. Lung. Area of bronchiolar associated lymphoid tissue (BALT) (*) (l). All slides were stained with H&E. Multiple random fields across all sections from all macaques (n=4, Supplementary Table 7) were analyzed.
Extended Data Fig. 7. Radiology of Rhesus macaques experimentally exposed to COVID19 – 3 dpi.
CXR Radiographs showing ventro-dorsal and right lateral views(a). Day 0: Normal, Day 1: Mild left caudal interstitial opacity with minimal diffuse right interstitial opacity, Day 2: Mild multifocal interstitial pattern (red arrow), Day 3: Mild multifocal interstitial pattern with patchy region in left caudal lobe (red arrow). CT scan axial view showing lesion characteristics in rhesus macaques infected with SARS-CoV-2 (b) at baseline and Day 1–3 dpi. As seen in (b) ground glass opacity seen on Day 2 dpi intensified on Day 3 dpi. (c) and (d) show lesions that appear on Day 1 show gradual resolution on Day 2–3 dpi whereas lesion in panel (e) observed on Day 1 dpi showed only minimal changes on Day 2. Red arrow point towards lung lesions with high attenuation.
Extended Data Fig. 8. SARS-CoV-2 induced cytokines in plasma.
Simultaneous analysis of multiple cytokines by Luminex technology in the plasma of rhesus macaques over 0–3 dpi. Levels of IL-6 (a), IFN-a (b), IFN-g (c), IL-8 (d), perforin (e), IP-10 (f), MIP1a (g), MIP1b (h), IL-12p40 (i), IL-18 (j), TNF-a (k) and IL-1Ra (l)are expressed in Log10 concentration in picogram per mL of plasma for rhesus macaques over 0–3 dpi (Circles, Colors represent individual animals, Supplementary Table 1). (n=4) Data are represented as mean± SEM. One way repeated-measures ANOVA with Geisser-Greenhouse correction for sphericity and Tukey’s post hoc correction for multiple-testing (GraphPad Prism 8) was applied.
Extended Data Fig. 9. Detection of SARS-CoV-2 signal in host lung cells by confocal microscopy.
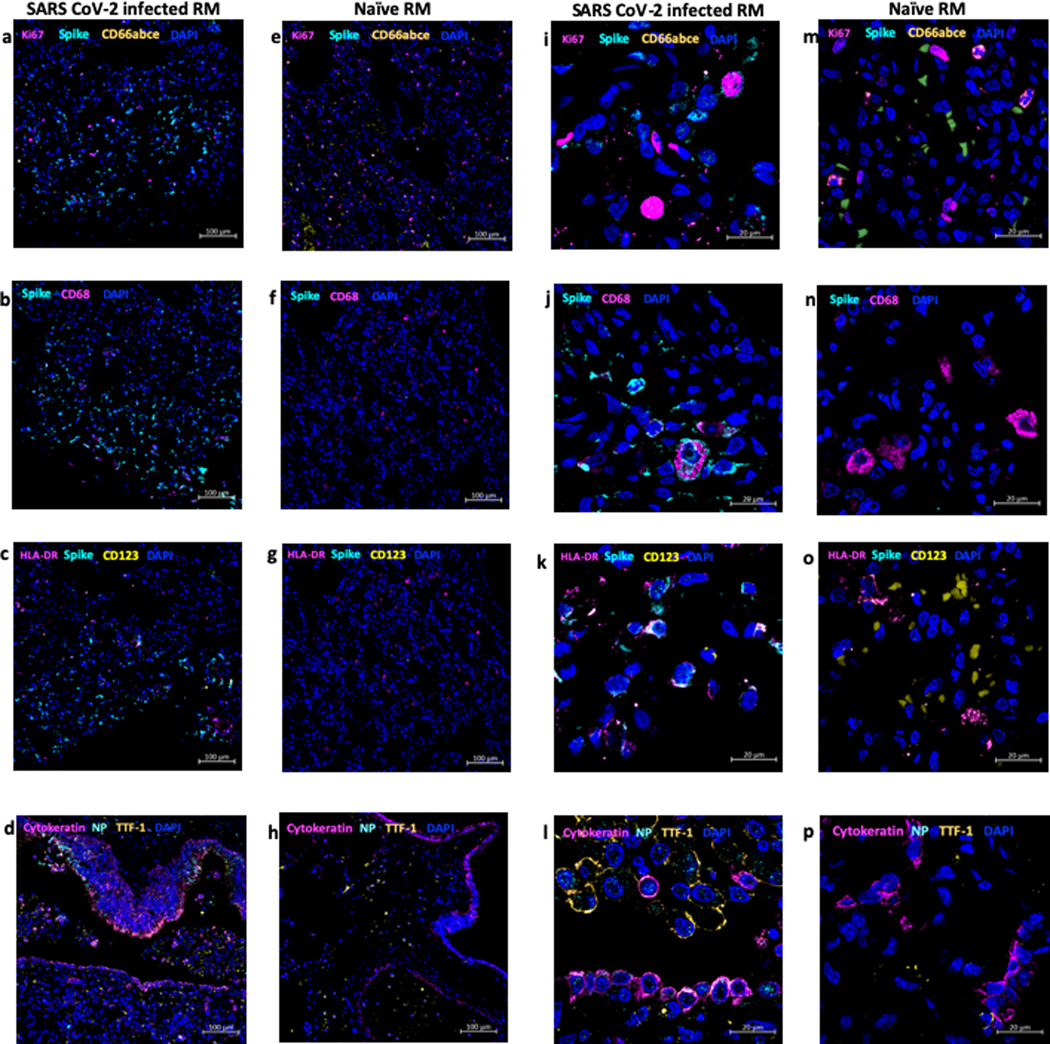
Multilabel confocal immunofluorescence microscopy of a high viral titer lung lobe from SARS CoV-2 infected Rhesus macaque at 3 dpi with SARS CoV-2 Spike specific antibody (turquoise), Ki67 (magenta), neutrophil marker CD66abce (yellow) and DAPI (blue)- (10X-a, 63X-i) vs the naïve control lungs (10X-e, 63X-m). SARS CoV-2 Spike (turquoise), pan-macrophage marker CD68 (magenta) and DAPI (blue) in infected lungs (10X-b and 63X-j) vs the naïve control lungs (10X-f, 63X-n). SARS CoV-2 Spike (turquoise), HLA-DR (magenta), pDC marker CD123 (yellow) and DAPI (blue) specific staining in infected lungs (10X-c, 63X-k) vs naïve control lungs (10X-g, 63X-o). SARS CoV-2 Nucleocapsid (turquoise), Type-1 pneumocytes and epithelial marker pan-cytokeratin (magenta), Type-2 pneumocyte marker TTF-1 (yellow) and DAPI (blue) in infected lungs (10X-d, 63X-l) vs naïve control lungs (10X-h, 63X-p). Micrographs are representative of 6 random fields across 3 animals.
Extended Data Fig. 10. Longitudinal changes in SARS-CoV-2 induced cytokines in BAL fluid and plasma following SARS-CoV-2 infection in rhesus macaques over two weeks.
Simultaneous analysis of multiple cytokines by Luminex technology in the BAL fluid and plasma of rhesus macaques over 0–15 dpi. Levels of IFN-a (a), IL-1Ra (b), IFN-g (c), TNF-a (d), IL-6 (e), Perforin (f) are expressed in Log10 concentration in picogram per mL of BAL fluid. Levels of IFN-a (g), IL-1Ra (h), IFN-g (i), TNF-a (j), IL-6 (k), Perforin (l) are expressed in Log10 concentration in picogram per mL of BAL fluid. Coloring scheme – young (blue), old (red). Data are represented as mean± SEM. (n=12) Two way Repeated-measures ANOVA with Geisser-Greenhouse correction for sphericity and Tukey’s post hoc correction for multiple-testing (GraphPad Prism 8) was applied. (Rhesus macaques: Old-Triangle, Young Diamonds, Colors represent individual animals, Supplementary Table 1).
Supplementary Material
Acknowledgments.
We acknowledge exceptional work by our SNPRC veterinary technical and care staff (especially the veterinary technical/animal care groups headed by Tyneshia Camp, Wade Hodgkins, Manuel Aguilar, David Vandenberg and Laura Rumpf) as well as the entire SNPRC and Texas Biomedical Research Institute administrative staff, especially Helen Hawn, for assistance with this study, especially during trying times.
Competing interest statement: “RC, Jr is funded by Regeneron, Inc, while, AO, DKA, RC, AB, and CK are employed by Regeneron. This funder had no role, however, in the design and execution of the experiments and the interpretation of data. The authors declare that no other financial conflict of interest exists.”
Financial support. This work was primarily supported by a philanthropic award to Texas Biomed Coronavirus Working Group; a SNPRC Pilot study award to LDG, RC, Jr, JP, LM and JBT; an award to RC, Jr from Regeneron Pharmaceuticals, (contract # 2020_004110) in part with federal funds from the Department of Health and Human Services; Office of the Assistant Secretary for Preparedness and Response; Biomedical Advanced Research and Development Authority, under Contract No. HHSO100201700020C; institutional NIH awards P51OD111033 and U42OD010442, and a supplemental award to R01AI134236–04 (PI: Khader, Shabaana) / COVID Grant Number: 3R01AI134236 – 04W. The views expressed here are those of the authors and do not necessarily represent the views or official position of the funding agencies.
Data availability statement.
All the data that support the findings of this study are available within the current manuscript and associated supplement. Any additional data can be requested from the corresponding authors upon reasonable request.
References
- 1.Rockx B et al. Comparative pathogenesis of COVID-19, MERS, and SARS in a nonhuman primate model. Science, doi: 10.1126/science.abb7314 (2020). [DOI] [PMC free article] [PubMed] [Google Scholar]
- 2.Munster VJ et al. Respiratory disease in rhesus macaques inoculated with SARS-CoV-2. Nature, doi: 10.1038/s41586-020-2324-7 (2020). [DOI] [PMC free article] [PubMed] [Google Scholar]
- 3.Yu J et al. DNA vaccine protection against SARS-CoV-2 in rhesus macaques. Science, doi: 10.1126/science.abc6284 (2020). [DOI] [PMC free article] [PubMed] [Google Scholar]
- 4.Chandrashekar A et al. SARS-CoV-2 infection protects against rechallenge in rhesus macaques. Science, doi: 10.1126/science.abc4776 (2020). [DOI] [PMC free article] [PubMed] [Google Scholar]
- 5.Lu S et al. Comparison of nonhuman primates identified the suitable model for COVID-19. Signal Transduct Target Ther 5, 157, doi: 10.1038/s41392-020-00269-6 (2020). [DOI] [PMC free article] [PubMed] [Google Scholar]
- 6.Blair RV et al. Acute Respiratory Distress in Aged, SARS-CoV-2 Infected African Green Monkeys but not Rhesus Macaques. Am J Pathol, doi: 10.1016/j.ajpath.2020.10.016 (2020). [DOI] [PMC free article] [PubMed] [Google Scholar]
- 7.Hoffmann M et al. SARS-CoV-2 Cell Entry Depends on ACE2 and TMPRSS2 and Is Blocked by a Clinically Proven Protease Inhibitor. Cell 181, 271–280 e278, doi: 10.1016/j.cell.2020.02.052 (2020). [DOI] [PMC free article] [PubMed] [Google Scholar]
- 8.Matsuyama S et al. Enhanced isolation of SARS-CoV-2 by TMPRSS2-expressing cells. Proc Natl Acad Sci U S A 117, 7001–7003, doi: 10.1073/pnas.2002589117 (2020). [DOI] [PMC free article] [PubMed] [Google Scholar]
- 9.Rosa BA et al. IFN signaling and neutrophil degranulation transcriptional signatures are induced during SARS-CoV-2 infection. bioRxiv, doi: 10.1101/2020.08.06.239798 (2020). [DOI] [PMC free article] [PubMed] [Google Scholar]
- 10.Cockrell AS et al. A spike-modified Middle East respiratory syndrome coronavirus (MERS-CoV) infectious clone elicits mild respiratory disease in infected rhesus macaques. Sci Rep 8, 10727, doi: 10.1038/s41598-018-28900-1 (2018). [DOI] [PMC free article] [PubMed] [Google Scholar]
- 11.Mantlo E, Bukreyeva N, Maruyama J, Paessler S & Huang C Antiviral activities of type I interferons to SARS-CoV-2 infection. Antiviral Res 179, 104811, doi: 10.1016/j.antiviral.2020.104811 (2020). [DOI] [PMC free article] [PubMed] [Google Scholar]
- 12.Nile SH et al. COVID-19: Pathogenesis, cytokine storm and therapeutic potential of interferons. Cytokine Growth Factor Rev, doi: 10.1016/j.cytogfr.2020.05.002 (2020). [DOI] [PMC free article] [PubMed] [Google Scholar]
- 13.Cai Y et al. In vivo characterization of alveolar and interstitial lung macrophages in rhesus macaques: implications for understanding lung disease in humans. J Immunol 192, 2821–2829, doi: 10.4049/jimmunol.1302269 (2014). [DOI] [PMC free article] [PubMed] [Google Scholar]
- 14.Bucsan AN et al. Mechanisms of reactivation of latent tuberculosis infection due to SIV co-infection. J Clin Invest, doi: 10.1172/JCI125810 (2019). [DOI] [PMC free article] [PubMed] [Google Scholar]
- 15.Gautam US et al. In vivo inhibition of tryptophan catabolism reorganizes the tuberculoma and augments immune-mediated control of Mycobacterium tuberculosis. Proc Natl Acad Sci U S A 115, E62–E71, doi: 10.1073/pnas.1711373114 (2018). [DOI] [PMC free article] [PubMed] [Google Scholar]
- 16.Munster VJ et al. Respiratory disease in rhesus macaques inoculated with SARS-CoV-2. Nature 585, 268–272, doi: 10.1038/s41586-020-2324-7 (2020). [DOI] [PMC free article] [PubMed] [Google Scholar]
- 17.Schaefer IM et al. In situ detection of SARS-CoV-2 in lungs and airways of patients with COVID-19. Mod Pathol 33, 2104–2114, doi: 10.1038/s41379-020-0595-z (2020). [DOI] [PMC free article] [PubMed] [Google Scholar]
- 18.Kuroda MJ et al. High Turnover of Tissue Macrophages Contributes to Tuberculosis Reactivation in Simian Immunodeficiency Virus-Infected Rhesus Macaques. J Infect Dis, doi: 10.1093/infdis/jix625 (2018). [DOI] [PMC free article] [PubMed] [Google Scholar]
- 19.Ahmed M et al. Immune correlates of tuberculosis disease and risk translate across species. Sci Transl Med 12, doi: 10.1126/scitranslmed.aay0233 (2020). [DOI] [PMC free article] [PubMed] [Google Scholar]
- 20.Charles ED & Dustin LB Hepatitis C virus-induced cryoglobulinemia. Kidney Int 76, 818–824, doi: 10.1038/ki.2009.247 (2009). [DOI] [PMC free article] [PubMed] [Google Scholar]
- 21.Haas A, Zimmermann K & Oxenius A Antigen-dependent and -independent mechanisms of T and B cell hyperactivation during chronic HIV-1 infection. J Virol 85, 12102–12113, doi: 10.1128/JVI.05607-11 (2011). [DOI] [PMC free article] [PubMed] [Google Scholar]
- 22.Hunziker L et al. Hypergammaglobulinemia and autoantibody induction mechanisms in viral infections. Nat Immunol 4, 343–349, doi: 10.1038/ni911 (2003). [DOI] [PubMed] [Google Scholar]
- 23.Vogel AB et al. A prefusion SARS-CoV-2 spike RNA vaccine is highly immunogenic and prevents lung infection in non-human primates. bioRxiv, 2020.2009.2008.280818, doi: 10.1101/2020.09.08.280818 (2020). [DOI] [Google Scholar]
- 24.Baum A et al. REGN-COV2 antibody cocktail prevents and treats SARS-CoV-2 infection in rhesus macaques and hamsters. bioRxiv, 2020.2008.2002.233320, doi: 10.1101/2020.08.02.233320 (2020). [DOI] [PMC free article] [PubMed] [Google Scholar]
- 25.Deng W et al. Primary exposure to SARS-CoV-2 protects against reinfection in rhesus macaques. Science 369, 818–823, doi: 10.1126/science.abc5343 (2020). [DOI] [PMC free article] [PubMed] [Google Scholar]
- 26.Chandrashekar A et al. SARS-CoV-2 infection protects against rechallenge in rhesus macaques. Science 369, 812–817, doi: 10.1126/science.abc4776 (2020). [DOI] [PMC free article] [PubMed] [Google Scholar]
- 27.Cox LA et al. Nonhuman Primates and Translational Research-Cardiovascular Disease. ILAR J 58, 235–250, doi: 10.1093/ilar/ilx025 (2017). [DOI] [PMC free article] [PubMed] [Google Scholar]
- 28.Rincon-Choles H et al. Renal histopathology of a baboon model with type 2 diabetes. Toxicol Pathol 40, 1020–1030, doi: 10.1177/0192623312444025 (2012). [DOI] [PMC free article] [PubMed] [Google Scholar]
- 29.Cole SA, Laviada-Molina HA, Serres-Perales JM, Rodriguez-Ayala E & Bastarrachea RA The COVID-19 Pandemic during the Time of the Diabetes Pandemic: Likely Fraternal Twins? Pathogens 9, doi: 10.3390/pathogens9050389 (2020). [DOI] [PMC free article] [PubMed] [Google Scholar]
- 30.Kaushal D et al. Mucosal vaccination with attenuated Mycobacterium tuberculosis induces strong central memory responses and protects against tuberculosis. Nat Commun 6, 8533, doi: 10.1038/ncomms9533 (2015). [DOI] [PMC free article] [PubMed] [Google Scholar]
- 31.Wolfel R et al. Virological assessment of hospitalized patients with COVID-2019. Nature 581, 465–469, doi: 10.1038/s41586-020-2196-x (2020). [DOI] [PubMed] [Google Scholar]
- 32.Corman VM et al. Detection of 2019 novel coronavirus (2019-nCoV) by real-time RT-PCR. Euro Surveill 25, doi: 10.2807/1560-7917.ES.2020.25.3.2000045 (2020). [DOI] [PMC free article] [PubMed] [Google Scholar]
- 33.Ganatra SR et al. Anti-retroviral therapy does not reduce tuberculosis reactivation in a tuberculosis-HIV co-infection model. J Clin Invest, doi: 10.1172/JCI136502 (2020). [DOI] [PMC free article] [PubMed] [Google Scholar]
- 34.Mehra S et al. Granuloma correlates of protection against tuberculosis and mechanisms of immune modulation by Mycobacterium tuberculosis. J Infect Dis 207, 1115–1127, doi: 10.1093/infdis/jis778 (2013). [DOI] [PMC free article] [PubMed] [Google Scholar]
- 35.Joosten SA et al. Mycobacterium tuberculosis peptides presented by HLA-E molecules are targets for human CD8 T-cells with cytotoxic as well as regulatory activity. PLoS Pathog 6, e1000782, doi: 10.1371/journal.ppat.1000782 (2010). [DOI] [PMC free article] [PubMed] [Google Scholar]
- 36.Singh DK et al. SARS-CoV-2 infection leads to acute infection with dynamic cellular and inflammatory flux in the lung that varies across nonhuman primate species. bioRxiv, 2020.2006.2005.136481, doi: 10.1101/2020.06.05.136481 (2020). [DOI] [Google Scholar]
- 37.Raju RM et al. Post-translational regulation via Clp protease is critical for survival of Mycobacterium tuberculosis. PLoS Pathog 10, e1003994, doi: 10.1371/journal.ppat.1003994 (2014). [DOI] [PMC free article] [PubMed] [Google Scholar]
- 38.Lindestam Arlehamn CS et al. Memory T cells in latent Mycobacterium tuberculosis infection are directed against three antigenic islands and largely contained in a CXCR3+CCR6+ Th1 subset. PLoS Pathog 9, e1003130, doi: 10.1371/journal.ppat.1003130 (2013). [DOI] [PMC free article] [PubMed] [Google Scholar]
Associated Data
This section collects any data citations, data availability statements, or supplementary materials included in this article.


