Abstract
Background
To compare the difference in central corneal thickness (CCT) measurements in normal eyes between a rotating Scheimpflug camera combined with a Placido-disk corneal topographer (Sirius, CSO, Italy) and ultrasound pachymetry (USP).
Methods
A systematic literature search was conducted for relevant studies published on PubMed, Medline, EMBASE, and the Cochrane Library and ClinicalTrials.gov from inception to August 1st, 2019. Primary outcome measures were CCT measurements between Sirius and USP. A random effects model was used to pool CCT measurements.
Results
A total of twelve studies involving 862 eyes were included in this meta-analysis. The meta-analysis found CCT measurements between Sirius and USP to be statistically significantly different (P < 0.0001). The mean difference between Sirius and USP was −11.26 μm with a 95% confidence interval (CI) (−16.92 μm, −5.60 μm). The heterogeneity was I2 = 60% (P = 0.004).
Conclusion
CCT measurements with the Sirius Scheimpflug-Placido topographer were statistically significantly lower than USP. However, it may be argued that the mean difference of 11.26 μm is not a clinically significant difference.
Keywords: Meta-analysis, Central corneal thickness, Scheimpflug-Placido topographer, Ultrasound Pachymetry
Background
The precise measurement of central corneal thickness (CCT) is important in daily ophthalmic practice, in particular in the fields of corneal refractive surgery, corneal diseases and glaucoma [1–4]. Ultrasound pachymetry (USP) is still a widely used technique to measure CCT. User-friendly, low prices and understandable principle make it acceptable to clinicians. However, USP has some disadvantages. Its use requires topical anaesthesia, which may affect corneal thickness (corneal oedema). As it involves corneal contact, there is a small risk of infection. Its outcomes depend largely on the expertness of users and the probe must be aligned perpendicularly to the centre of the cornea [5]. The measurement will be at the point of contact, hence may not measure CCT accurately.
The Sirius anterior segment analysis system (CSO, Florence, Italy) utilizes a single 360-degree rotating Scheimpflug camera combined with a Placido-disk topographer of 22 rings acquiring 25 radial sections of the cornea. A blue light-emitting diode (LED) light with a wavelength of 475 nm measures 35,632 points on the anterior cornea and 30,000 points on the posterior cornea. The scanning process obtains 25 tomographic Scheimpflug images and one Placido corneal curvature in a single measurement [6, 7]. It has been reported that Sirius has high repeatability and reproducibility in measuring CCT [8–10].
Some previous studies have compared CCT measurements directly between Sirius and USP [9, 11–21]. Some have found that Sirius CCT measurements are lower than USP [11, 13–21], whereas others have found thicker measurements with the Sirius [9, 12]. The aim of this meta-analysis is to integrate all comparative studies to determine the difference of CCT measurement between Sirius and USP.
Materials and methods
Search methods
This meta-analysis was conducted under the guidance of the Preferred Reporting Items for Systematic Review and Meta-Analysis (PRISMA) guidelines [22]. Prospective comparative studies related to CCT measurements between Sirius and USP were identified through a systematic search by two researchers (Y.L.J. and Y.R.W.) independently using the following databases: PubMed, EMBASE, Cochrane Library and ClinicalTrail.gov. The following search terms were used: (“Ultrasonography”[Mesh] or “Ultrasonics”[Mesh] or USP or US or pachymet* or ultraso*) AND (Sirius or Scheimpflug or topograph* or tomograph*) AND (“Corneal Pachymetry”[Mesh] OR “Corneal Topography”[Mesh] OR corneal pachymet* or corneal thickness). The cut-off date was August 1st, 2019, and the language was not restricted.
Study selection
Two independent researchers (Y.L.J. and Y.R.W.) performed the article screening; any discrepancies were resolved by focused discussion or consultation with an additional researcher (B.H.S.). Studies meeting the following inclusion criteria were included in this meta-analysis: a) Adults 18 years or older without any eye diseases or systemic diseases; b) CCT measurements were acquired both with Sirius and USP by the same clinician within 30 min; c) Compared CCT measurements directly between Sirius and USP; d) Original research. The excluded criteria were studies with incomplete data or duplicate data. The full text was obtained and reviewed with articles whose abstracts are not clear to ensure we did not leave out any article that was eligible.
Data extraction
For all selected studies, we designed a datasheet with the following information to collect data: first author and year of publication, country of the study, sample size, number of eyes, mean and standard deviation (SD) of patient age, gender ratio, refractive error, mean and SD of CCT measured by Sirius and USP, and device manufacturer.
Qualitative assessment
The Quality Assessment of Diagnostic Accuracy Studies (QUADAS) [23–25] scale was utilized. The primary scale comprises 14 items. As items 1, 12, 13, and 14 were not related to the present meta-analysis, they were excluded and the new scale including 10 items was used (Table 1).
Table 1.
The refined scale of the quality assessment of diagnostic accuracy studies scale (QUADAS)
| Kara [13] 2012 | Huang [9] 2013 | Jorge [12] 2013 | Maresca [15] 2014 | Bayhan [11] 2014 | Yildirim [18] 2015 | Simsek [17] 2016 | Pierro [16] 2016 | Kumar [14] 2017 | Kuddusi [19] 2017 | Mustafa [20] 2018 | Nesrin [21] 2018 | |
|---|---|---|---|---|---|---|---|---|---|---|---|---|
| Were selection criteria clearly described? | Y | Y | Y | Y | Y | Y | Y | Y | Y | Y | Y | Y |
| Is the reference standard likely to correctly classify the target condition? | Y | Y | Y | Y | Y | Y | Y | Y | Y | Y | Y | Y |
| Is the time period between reference standard and index test short enough to be reasonably sure that the target condition did not change between the two tests? | Y | Y | Y | Y | Y | Y | Y | Y | Y | Y | Y | Y |
| Did the whole sample or a random selection of the sample, receive verification using a reference standard of a diagnosis? | Y | Y | Y | Y | Y | Y | Y | Y | Y | Y | Y | Y |
| Did the patients receive the same reference standard regardless of the index test result? | Y | Y | Y | Y | Y | Y | Y | Y | Y | Y | Y | Y |
| Was the reference standard independent of the index test? | Y | Y | Y | Y | Y | Y | Y | Y | Y | Y | Y | Y |
| Was the execution of the index test described in sufficient detail to permit replication of the test? | Y | Y | Y | Y | Y | Y | Y | Y | Y | Y | Y | Y |
| Was the execution of the reference standard described in sufficient detail to permit its replication? | Y | Y | Y | Y | Y | Y | Y | Y | Y | Y | Y | Y |
| Were the index test results interpreted without knowledge of the results of the reference standard? | Y | Y | Y | Y | Y | Y | Y | Y | Y | Y | Y | Y |
| Were the reference standard results interpreted without knowledge of the results of the index test? | U | Y | Y | Y | Y | Y | U | Y | U | Y | Y | Y |
Y = yes, N = no, U = unclear
Outcomes
The measurement results of the CCT by Sirius and USP were compared in normal eyes.
Statistical analysis
Statistical analysis was performed with Review Manager (version 5.3, Cochrane Collaboration, Oxford, UK) statistical analysis software. As CCT is a continuous outcome, weighted mean differences (WMD) with 95% confidence intervals (CI) were calculated and the difference was defined as CCT measurement of Sirius minus USP. The fixed effects model was used to analyse the data initially. Heterogeneity was assessed by the I2 parameter. I2 is a statistic for quantifying inconsistency and is calculated as follows: I2 = (Q − df/Q) × 100%, where Q is the Chi-squared statistic and df is the degrees of freedom. In other words, I2 quantifies the percentage variability due to heterogeneity rather than by chance [26]. If the I2 was > 50%, the random effects model was used to pool the data for the relatively higher variance in clinical characteristics and sample sizes. A P-value of less than 0.05 was considered to be statistically significant. Sensitivity analysis was performed by omitting one study at a time and re-evaluating the effect of different statistical models (fixed effects model or random effects model). Ultrasonic velocity was likely to be one of the sources of heterogeneity, so we analysed the heterogeneity based on whether the ultrasonic velocity was reported and the reported speed. Subgroup analysis was carried out based on the different races included in studies. A funnel plot is a scatter plot to assess for publication bias. The x-axis of the funnel plot signifies the mean result (e.g., mean difference, odds ratio, risk ratio) whereas the y-axis signifies the index of precision (e.g., standard error) or sample size. One would expect to observe an even scattering around the true result, however when significant publication bias exists, an asymmetry in the scatter is observed [27].
Results
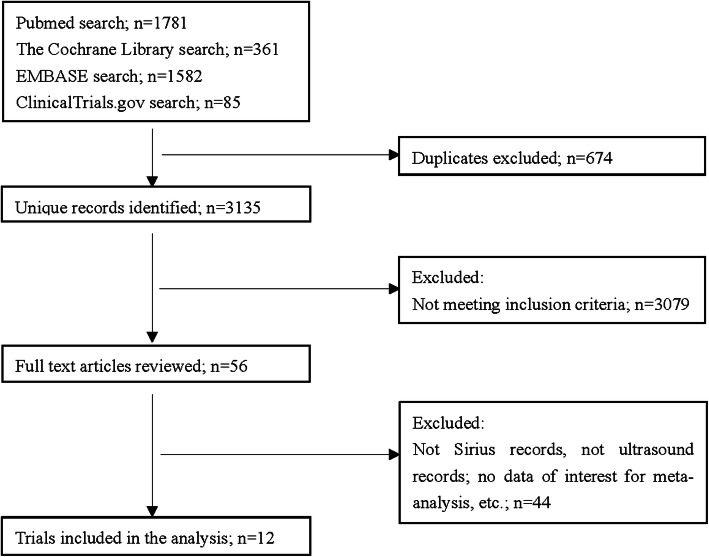
The systematic search flowchart is showed in Fig. 1. After duplication was excluded, 3135 articles conformed to our terms. Three thousand seventy-nine articles were excluded through screening their title and abstract. The full text of the remaining 56 articles were obtained and 44 were excluded since 39 did not record CCT measurements for Sirius or USP, two studies compared patients with keratoconus, two studies compared patients following laser in situ keratomileusis (LASIK), one study involved patients with acne vulgaris. There were 12 final studies that met our criteria [11]. The enrolled studies and basic data are presented in Table 2. A total of 862 eyes were included in the meta-analysis.
Fig. 1.
Selection flowchart of the studies included in the meta-analysis
Table 2.
Basic study information
| Author | Year | Country | Patients/Eyes | Mean age ± SD (years) |
Gender ratio (M/F) | Device manufacturer | |
|---|---|---|---|---|---|---|---|
| Sirius | Ultrasound | ||||||
| Kara et al. [13] | 2012 | Turkey | 30/30 | 28.0 ± 10.0 | 14/16 | Sirius (CSO, Florence, Italy) | DGH-550 (DGH Technology Inc., Exton, PA) |
| Huang et al. [9] | 2013 | China | 43/43 | 27.5 ± 7.6 | 16/27 | Sirius (CSO, Florence, Italy) | SP-3000 (Tomey Corp.) |
| Jorge et al. [12] | 2013 | Portugal | 50/50 | 36.7 ± 4.8 | 28/22 | Sirius (CSO, Florence, Italy) | SP100 (Tomey, Nagoya, Japan) |
| Bayhan et al. [11] | 2014 | Turkey | 50/50 | 29.8 ± 5.0 | 23/27 | Sirius (CSO, Florence, Italy) | (Pacline, Optikon) |
| Maresca et al. [15] | 2014 | Italy | 35/35 | 25.9 ± 6.7 | 10/25 | Sirius (CSO, Florence, Italy) | P-1 (Takagi Seiko Co., Ltd., Nagano, Japan) |
| Yildirim et al. [18] | 2015 | Turkey | 34/34 | 23.2 ± 7.6 | 16/18 | Sirius (CSO, Florence, Italy) | DGH-550 (DGH Technology Inc., Exton, PA). |
| Pierro et al. [16] | 2016 | Italy | 28/28 | 44.0 ± 10.6 | 8/20 | Sirius (CSO, Florence, Italy) | Pachmate DGH55 (DGH Instruments Inc., Exton, PA) |
| Simsek et al. [17] | 2016 | Turkey | 128/256 | 33.2 ± 13.0 | 84/44 | Sirius (CSO, Florence, Italy) | OcuScan RxP Ophthalmic Ultrasound System (Alcon Laboratories) |
| Kumar et al. [14] | 2017 | India | 46/46 | 24.1 ± 5.0 | 24/22 | Sirius (CSO, Florence, Italy) | SP-3000 (Tomey Corp.) |
| Kuddusi et al. [19] | 2017 | Turkey | 76/76 | 38.6 ± 12.5 | 33/43 | Sirius (CSO, Florence, Italy) | Echoscan US-500 |
| Mustafa et al. [20] | 2018 | Turkey | 32/64 | 23.8 | 25/7 | Sirius (CSO, Florence, Italy) | Aviso A/B (Quantel Medical, France) |
| Nesrin et al. [21] | 2018 | Turkey | 150/150 | 42.5 ± 17.0 | 67/83 | Sirius (CSO, Florence, Italy) | iPac ultrasonic pachymeter |
SD = standard deviation, CCT = central corneal thickness
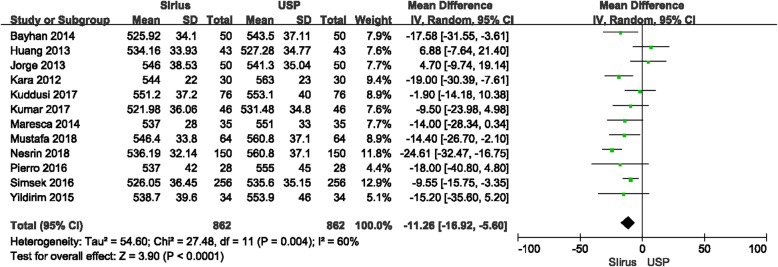
CCT measurements between Sirius and USP were statistically significantly different (P < 0.0001), with the forest plot displayed in Fig. 2. The mean difference between Sirius and USP was −11.26 μm with the 95% CI (−16.92 μm, −5.60 μm). The heterogeneity (I2) was 60% (P = 0.004). Since two studies [17, 20] included both eyes, in order to rule out the impact of the similarity of the both eyes on the meta-analysis, we excluded these two studies and performed another analysis. The results showed that in a total of 542 eyes, the mean difference between Sirius and USP was −11.00 μm with 95% CI (−18.42 μm, −3.58 μm), and the I2 was 66% (Fig. 3). There was no significant difference with the overall group. These studies were carefully examined to find the source of the heterogeneity. When using a fixed effects model, the mean difference was −11.98 μm with 95% CI of −15.22 μm to −8.73 μm (P < 0.00001) which is no different than the random effects model. The primary heterogeneity was high, so a sensitivity analysis was performed by excluding each study in turn. When the study by Gokcinar et al. [21] was excluded, the heterogeneity decreased from 60% to 37%. Reviewing this article carefully, there were slight differences in the inclusion criteria. The refractive error was in a range of −5.00 D to +5.00 D; the corrected distance visual acuity (CDVA) was better than 20/25 (not 20/20 akin to other studies); and contact lens wear was permitted up to 72 h prior to measurement, whereas other studies have reported contact lens wear was ceased a least month prior to measurements. Three other studies [9, 12, 14] with these different inclusion criteria were excluded and the heterogeneity decreased to 0%, the mean difference was −11.95 μm with the 95% CI were −15.99 μm to −7.91 μm (P < 0.00001) with the fixed effects model. The difference which excluded three articles has no difference with the primary group. In addition, we extracted studies which reported the ultrasonic velocity of USP were extracted. Five studies with 216 eyes reported ultrasonic sound velocity, all were 1640 m/s. The difference between Sirius and USP was −9.19 μm with 95% CI from −15.80 μm to 2.59 μm (P = 0.006), I2 = 38% (Fig. 4), suggesting that the CCT measured by Sirius was lower than that of USP, which is consistent with the primary analysis.
Fig. 2.
Comparison of central corneal thickness (CCT) measurements with the Sirius and ultrasound pachymetry (USP). df = degree of freedom; I2 = extent of inconsistency; Z = overall effect
Fig. 3.
Comparison of central corneal thickness (CCT) measurements with the Sirius and ultrasound pachymetry (USP) (excluded both-eyes studies). df = degree of freedom; I2 = extent of inconsistency; Z = overall effect
Fig. 4.
Comparison of central corneal thickness (CCT) measurements with the Sirius and ultrasound pachymetry (USP) that reported ultrasonic speed. df = degree of freedom; I2 = extent of inconsistency; Z = overall effect
Subgroup analysis
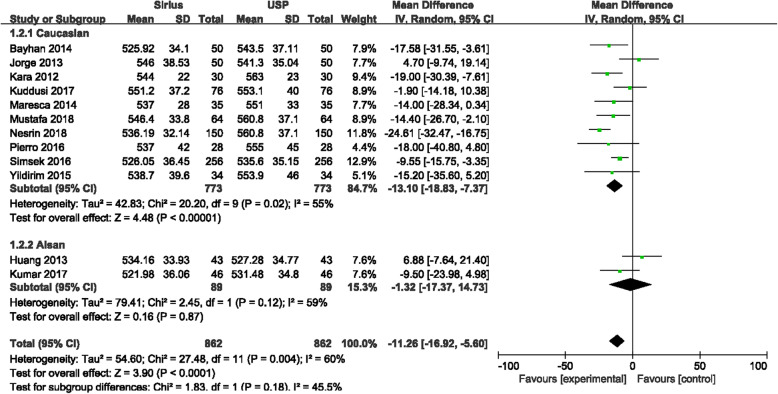
According to the different races of the subjects included in these studies, they were divided into two groups of Caucasians [11–13, 15–21] and Asians [14, 28] for analysis (Fig. 5). It was found that in Caucasians, the mean difference of CCT measurements between Sirius and USP was −13.10 μm with 95% CI from −18.83 μm to −7.37 μm (P < 0.0001), which was not significantly different to the overall group; while the mean difference in the Asian group was −1.32 μm with 95% CI from −17.37 μm to 14.73 μm (P = 0.87).
Fig. 5.
Subgroup analysis (Caucasian or Asian) of central corneal thickness (CCT) measurements with the Sirius and ultrasound pachymetry (USP).df = degree of freedom; I2 = extent of inconsistency; Z = overall effect
Publication Bias
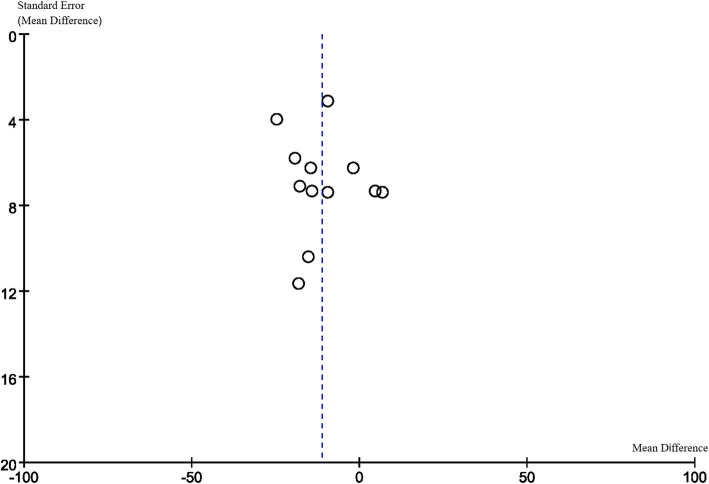
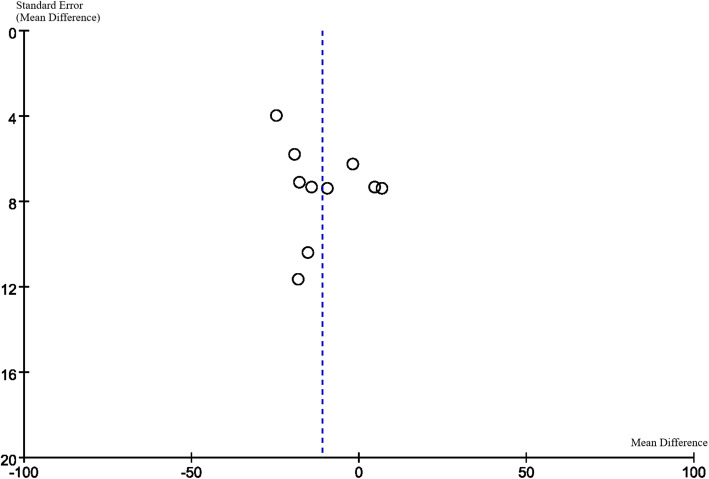
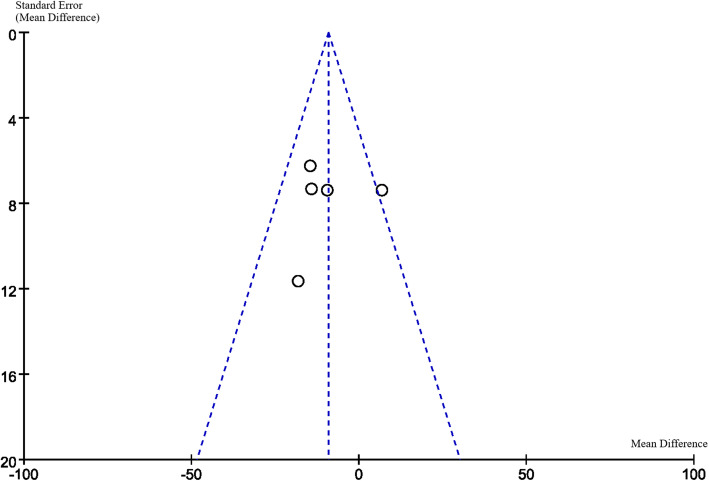
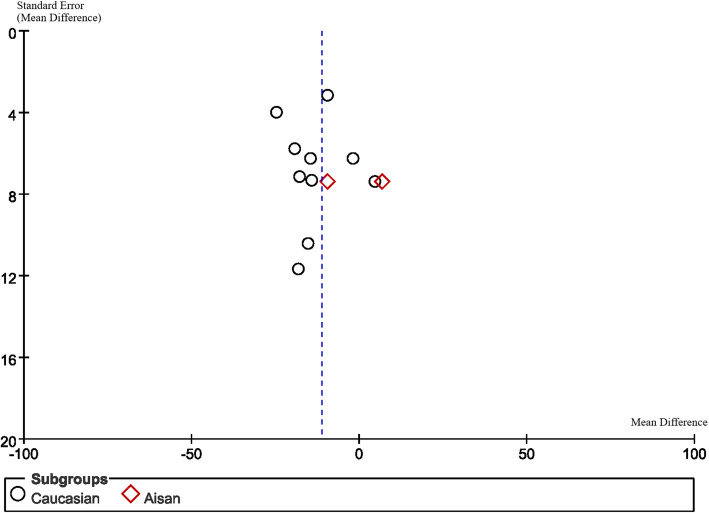
Funnel plots are displayed in Figs. 6, 7, 8 and 9. The funnel plots are symmetrical except for the Asian group, suggesting this subgroup may have publication bias.
Fig. 6.
Funnel plot of overall group
Fig. 7.
Funnel plot of excluded both-eyes studies
Fig. 8.
Funnel plot of reported ultrasonic speed studies
Fig. 9.
Funnel plot of subgroup (Caucasian or Asian)
Discussion
To the best of our knowledge, this study is the first meta-analysis to compare the Sirius with USP in terms of CCT measurements in normal healthy corneas. Most of the included studies have sample sizes ranging from 30 to 60 eyes. Our meta-analysis analysed 862 eyes by combining results of the included studies, which provides great statistical power than that of each study alone [29].
Our study suggests that, in normal healthy eyes, CCT measured with the Sirius were statistically lower than that measured with USP; the mean difference was −11.26 μm. A previous study [9] found that the 95% LoA with CCT measurements between Sirius and USP was −6.39 μm to 20.14 μm indicating an acceptable level of agreement in normal healthy eyes. Bayhan et al. [11] found that the mean difference of CCT measurement between Sirius and USP was −17.58 μm with the 95% CI (−19.89 μm to −15.27 μm), which was consistent with the present meta-analysis. The mean difference in the study by Dogan et al. [20] was −14.4 μm, again, similar to the present study. Similar results were also obtained by Pierro et al. [16] with a mean difference of −18 μm. Teberik et al. [19] found a mean difference of only −1.9 μm, in which the Sirius only marginally underestimated the CCT in comparison to USP. Gao et al. [30] reported that eye drops could substantially increase corneal thickness by more than 20 μm in 63% of patients. Topical anaesthesia can interfere with the integrity of the tear film, causing corneal oedema, making the ultrasound speed set and the exact sound speed in the corneal tissue inconsistent. As an optical biometer, Sirius does not have this issue as long as the clinician instructs the patient to blink and keep the tear film intact. In addition, the accuracy of USP depends largely on the experience of the observer; the probe must perpendicularly align to the centre of the cornea. Supposing the probe is not perpendicular, the ultrasound wave would enter the cornea tilted and could increase the value of corneal thickness. In addition, differences may occur due to incorrectly locating the probe at the exact corneal centre. The Sirius selects the corneal vertex normal as the reference centre. USP identifies the posterior reflection point located between Descemet membrane and the anterior chamber. Choosing the posterior reflection point closer to the anterior chamber may result in an overestimation [28].
Other Scheimpflug based devices (namely Pentacam and Galilei) were not included in this meta-analysis as a previous meta-analysis has been published comparing the Pentacam to USP, and only three articles compared the Galilei to USP. Wu et al. [29] conducted a meta-analysis comparing the Pentacam and USP (19 studies, 1908 eyes). It was reported that the difference between the Pentacam and USP for CCT measurement was 1.47 μm (95% CI −2.32 to 5.27 μm, P = 0.45). Subsequent studies reported a CCT difference between the two between 0.05 μm and 4.7 μm [31–33]. Menassa et al. [34] evaluated the difference between the Galilei and USP, with a reported difference of 6.8 ± 9.8 μm for CCT. Subsequent similar studies have reported differences between 0.55 μm and 0.7 μm [35, 36]. However, the results from a study Hosseini et al., reported a difference of 11.96 μm between the two [37].
After reading the full text of articles carefully, we found that the difference in the refractive error of the sample may be one of the reasons for the heterogeneity. In the study by Huang et al. [9], the refractive error range was −0.50 D to −12.0 D; the refractive error of the population included in Gokcinar et al. [21] was between −5.00 D and +5.00 D. In the study by Kumar et al. [14], it was between −6.00 D and +6.00 D. Other studies included samples with refractive errors between −2.00 D and +2.00 D. Five studies did not report refractive error. Pedersen et al. [38], using an optical low-coherence reflectometry pachymeter, reported thinner CCT in patients with high myopia (> −6.00 D) compared to those with emmetropia; 527.7 μm versus 538.6 μm, respectively. Chang et al., Wang et al. and Kunert et al. [39–41] reported differing CCT across patients from different ethnicities. Many studies [42–44] have shown that wearing contact lenses will significantly change CCT, short-term wear makes CCT thicker, long-term wear makes CCT thinner and increases corneal surface irregularities. A period of approximately 1 month is needed for CCT to return to normal. Since we are unable to know the number of samples and the length of time of wearing the contact lens, the heterogeneity of including such samples is unpredictable. We found that the I2 decreased to 38% when analysing specifically studies which reported ultrasonic velocity. The ultrasonic velocity was 1640 m/s in all these studies and the results had no difference with the primary group, and we could not determine its specific effect because other studies have not reported the exact ultrasonic velocity. We are still unclear about the causes of heterogeneity in CDVA differences [45]. A possible explanation is that subjects with decreased CDVA have potential eye diseases that can alter CCT, which increases the heterogeneity of the included samples. This may partly explain the high heterogeneity in the meta-analysis and the rapid decline in heterogeneity after exclusion of these studies.
CCT is an important step in preoperative screening and preoperative planning for corneal refractive surgery. Studies have shown that in order to avoid corneal ectasia, the absolute CCT needs to be greater than 450 μm or a residual stromal bed thickness after ablation of > 250 μm [46]. A previous study [47] investigated subjects who wanted to undergo refractive surgery and found that 55.1% of the subjects were unable to undergo refractive surgery because of insufficient corneal thickness. As the mean difference found in our meta-analysis between the two techniques was 11.26 μm, this is lower than the diurnal variation and hence we assert this difference, although statistically significant, is not clinically significant.
A large number of studies [48–50] have shown that the IOP is highly correlated with CCT. Foster et al.51 used an optical corneal pachymeter and a Goldmann applanation tonometer to analyse the correlation between CCT and IOP in the Mongolian population. It was found that for every 10 μm increase in CCT, the IOP only increased by 0.12 mmHg to 0.31 mmHg, but inter-individual difference may produce an IOP difference of 2.3 mmHg to 3.1 mmHg. Wolfs et al. [49] reported that each 10 μm increase in CCT caused an increase in IOP of 0.09 to 0.28 mmHg. Doughty et al. [50] indicated that a 10% change in CCT would only cause a difference in the IOP measurement with applanation tonometry of 1.1 ± 0.6 mmHg, which is not clinically significant. The current meta-analysis shows that the healthy human CCT measured by Sirius is 11.26 μm lower than the USP, which is much smaller than 10% of the thickness of a normal cornea. In view of the clinically common non-contact tonometer instead of applanation tonometer, the IOP correction error caused by the difference in CCT measurement between the two does not cause clinical misunderstanding of IOP.
There are several limitations in the current meta-analysis. First, we only included normal healthy adult populations and did not evaluate a variety of more complex situations such as children, cataracts, and keratoconus. This was mainly due to the lack of studies outside normal healthy eyes. Second, we did not include unpublished articles, such as posters or abstracts from conferences. Third, various USP devices were used in the studies included in this meta-analysis, although we assessed heterogeneity for studies reporting ultrasonic velocity. These USP devices are likely to vary in their precision (repeatability and reproducibility) which can have a knock-on effect on the agreement with the Sirius.
Conclusions
In summary, the present meta-analysis suggests that there are statistically significant differences in the measurement of CCT between the Sirius Scheimpflug-Placido topographer and USP in normal adult eyes and the value of Sirius is lower than the value of USP. This difference is small and below normal diurnal variation and is not considered clinically significant.
Acknowledgements
None.
Authors’ contributions
YJ and JH carried out the meta-analysis and drafted the manuscript. JH conceived the study and its design. JH, DW, QW and SC provided guidance and revised the manuscript. CM and YS polished the manuscript. YJ, YW and BS performed the systemic search and study selection. JY and KF participated in data collection. All authors read and approved the final manuscript.
Funding
This work was supported in part by the Foundation of Wenzhou City Science & Technology Bureau (Y2020037); Medical and Health Science and Technology Program of Zhejiang Province (2019KY111); Zhejiang Provincial & Ministry of Health Research Fund for Medical Sciences (WKJ-ZJ-2134); Zhejiang Provincial High-level Talents Program (2017–102). The funders had no role in study design, data collection and analysis, decision to publish, or preparation of the manuscript.
Availability of data and materials
The datasets supporting the conclusions of this article are included within the article and its additional file.
Ethics approval and consent to participate
Not applicable.
Consent for publication
Not applicable.
Competing interests
The author(s) have no proprietary or commercial interest in any materials discussed in this article.
Contributor Information
Shihao Chen, Email: chenle@rocketmail.com.
Jinhai Huang, Email: vip999vip@163.com, Email: vip9999vip@wmu.edu.cn.
References
- 1.McAlinden C. Corneal refractive surgery: past to present. Clin Exp Optom. 2012;95(4):386–398. doi: 10.1111/j.1444-0938.2012.00761.x. [DOI] [PubMed] [Google Scholar]
- 2.Wen D, Song B, Li Q, Tu R, Huang Y, Wang Q, et al. Comparison of epithelium-off versus transepithelial corneal collagen cross-linking for keratoconus: a systematic review and meta-analysis. Cornea. 2018;37(8):1018–1024. doi: 10.1097/ICO.0000000000001632. [DOI] [PubMed] [Google Scholar]
- 3.Guber I, Mcalinden C, Majo F, Bergin C. Identifying more reliable parameters for the detection of change during the follow-up of mild to moderate keratoconus patients. Eye Vis (Lond) 2017;4:24. doi: 10.1186/s40662-017-0089-3. [DOI] [PMC free article] [PubMed] [Google Scholar]
- 4.Belovay GW, Goldberg I. The thick and thin of the central corneal thickness in glaucoma. Eye (Lond). 2018;32(5):915–23. [DOI] [PMC free article] [PubMed]
- 5.Lackner B, Schmidinger G, Pieh S, Funovics MA, Skorpik C. Repeatability and reproducibility of central corneal thickness measurement with Pentacam, Orbscan, and ultrasound. Optom Vis Sci. 2005;82(10):892–899. doi: 10.1097/01.opx.0000180817.46312.0a. [DOI] [PubMed] [Google Scholar]
- 6.Caglar C, Kocamis SI, Demir E, Durmus M. Comparison of the measurements of a novel optical biometry: Nidek AL-scan with Sirius and a ultrasound biometry. Int Ophthalmol. 2017;37(3):491–498. doi: 10.1007/s10792-016-0284-6. [DOI] [PubMed] [Google Scholar]
- 7.Chen W, McAlinden C, Pesudovs K, Wang Q, Lu F, Feng Y, et al. Scheimpflug-Placido topographer and optical low-coherence reflectometry biometer: repeatability and agreement. J Cataract Refract Surg. 2012;38(9):1626–1632. doi: 10.1016/j.jcrs.2012.04.031. [DOI] [PubMed] [Google Scholar]
- 8.Savini G, Naeser K, Schiano-Lomoriello D, Ducoli P. Total corneal astigmatism measurements: agreement between 2 rotating Scheimpflug cameras. Cornea. 2017;36(4):463–9. [DOI] [PubMed]
- 9.Huang J, Savini G, Hu L, Hoffer KJ, Lu W, Feng Y, et al. Precision of a new Scheimpflug and Placido-disk analyzer in measuring corneal thickness and agreement with ultrasound pachymetry. J Cataract Refract Surg. 2013;39(2):219–224. doi: 10.1016/j.jcrs.2012.10.034. [DOI] [PubMed] [Google Scholar]
- 10.Savini G, Carbonelli M, Sbreglia A, Barboni P, Deluigi G, Hoffer KJ. Comparison of anterior segment measurements by 3 Scheimpflug tomographers and 1 Placido corneal topographer. J Cataract Refract Surg. 2011;37(9):1679–1685. doi: 10.1016/j.jcrs.2011.03.055. [DOI] [PubMed] [Google Scholar]
- 11.Bayhan HA, Aslan Bayhan S, Can I. Comparison of central corneal thickness measurements with three new optical devices and a standard ultrasonic pachymeter. Int J Ophthalmol. 2014;7(2):302–308. doi: 10.3980/j.issn.2222-3959.2014.02.19. [DOI] [PMC free article] [PubMed] [Google Scholar]
- 12.Jorge J, Rosado J, Diaz-Rey J, González-Méijome J. Central corneal thickness and anterior chamber depth measurement by Sirius(®) Scheimpflug tomography and ultrasound. Clin Ophthalmol. 2013;7:417–22. [DOI] [PMC free article] [PubMed]
- 13.Kara N, Yildirim Y, Demircan A, Cankaya I, Kutlubay Z, Engin B, et al. Topographic and biomechanical evaluation of cornea in patients with ichthyosis vulgaris. Cont Lens Anterior Eye. 2012;35(5):208–212. doi: 10.1016/j.clae.2012.05.002. [DOI] [PubMed] [Google Scholar]
- 14.Kumar M, Shetty R, Jayadev C, Rao HL, Dutta D. Repeatability and agreement of five imaging systems for measuring anterior segment parameters in healthy eyes. Indian J Ophthalmol. 2017;65(4):288–94. [DOI] [PMC free article] [PubMed]
- 15.Maresca N, Zeri F, Palumbo P, Calossi A, et al. Agreement and reliability in measuring central corneal thickness with a rotating Scheimpflug-Placido system and ultrasound pachymetry. Cont Lens Anterior Eye. 2014;37(6):442–446. doi: 10.1016/j.clae.2014.07.009. [DOI] [PubMed] [Google Scholar]
- 16.Pierro L, Iuliano L, Gagliardi M, Ambrosi A, Rama P, Bandello F. Central corneal thickness reproducibility among ten different instruments. Optom Vis Sci. 2016;93(11):1371–1379. doi: 10.1097/OPX.0000000000000974. [DOI] [PubMed] [Google Scholar]
- 17.Şimşek A, Bilak Ş, Güler M, Çapkin M, Bilgin B, Reyhan AH. Comparison of central corneal thickness measurements obtained by RTVue OCT, Lenstar, Sirius topography, and ultrasound pachymetry in healthy subjects. Semin Ophthalmol. 2016;31(5):467–72. [DOI] [PubMed]
- 18.Yildirim Y, Olcucu O, Agca A, Karakucuk Y, Alagoz N, Mutaf C, et al. Topographic and biomechanical evaluation of corneas in patients with ocular rosacea. Cornea. 2015;34(3):313–317. doi: 10.1097/ICO.0000000000000350. [DOI] [PubMed] [Google Scholar]
- 19.Teberik K, Eski MT, Kaya M, Ankaralı H. Comparison of central corneal thickness with four different optical devices. Int Ophthalmol. 2018;38(6):2363–2369. doi: 10.1007/s10792-017-0736-7. [DOI] [PubMed] [Google Scholar]
- 20.Doğan M, Ertan E. Comparison of central corneal thickness measurements with standard ultrasonic pachymetry and optical devices. Clin Exp Optom. 2019;102(2):126–30. [DOI] [PubMed]
- 21.Gokcinar NB, Yumusak E, Ornek N, Yorubulut S, Onaran Z. Agreement and repeatability of central corneal thickness measurements by four different optical devices and an ultrasound pachymeter. Int Ophthalmol. 2019;39(7):1589–1598. doi: 10.1007/s10792-018-0983-2. [DOI] [PubMed] [Google Scholar]
- 22.Moher D, Liberati A, Tetzlaff J, Altman DG, PRISMA Group Preferred reporting items for systematic reviews and meta-analyses: the PRISMA statement. PLoS Medicine. 2009;6(7):e1000097. doi: 10.1371/journal.pmed.1000097. [DOI] [PMC free article] [PubMed] [Google Scholar]
- 23.Whiting P, Rutjes AW, Reitsma JB, Bossuyt PM, Kleijnen J. The development of QUADAS: a tool for the quality assessment of studies of diagnostic accuracy included in systematic reviews. BMC Med Res Methodol. 2003;3:25. doi: 10.1186/1471-2288-3-25. [DOI] [PMC free article] [PubMed] [Google Scholar]
- 24.Whiting P, Rutjes AW, Dinnes J, Reitsma J, Bossuyt PM, Kleijnen J. Development and validation of methods for assessing the quality of diagnostic accuracy studies. Health Technol Assess. 2004;8(25):iii 1-234. 10.3310/hta8250. [DOI] [PubMed]
- 25.Huang J, McAlinden C, Huang Y, Wen D, Savini G, Tu R, et al. Meta-analysis of optical low-coherence reflectometry versus partial coherence interferometry biometry. Sci Rep. 2017;7:43414. doi: 10.1038/srep43414. [DOI] [PMC free article] [PubMed] [Google Scholar]
- 26.Higgins JP, Thompson SG, Deeks JJ, Altman DG. Measuring inconsistency in meta-analyses. BMJ. 2003;327(7414):557–560. doi: 10.1136/bmj.327.7414.557. [DOI] [PMC free article] [PubMed] [Google Scholar]
- 27.Ahmed I, Sutton AJ, Riley RD. Assessment of publication bias, selection bias, and unavailable data in meta-analyses using individual participant data: a database survey. BMJ. 2012;344:d7762. doi: 10.1136/bmj.d7762. [DOI] [PubMed] [Google Scholar]
- 28.Huang J, Lu W, Savini G, Hu L, Pan C, Wang J, et al. Evaluation of corneal thickness using a Scheimpflug-Placido disk corneal analyzer and comparison with ultrasound pachymetry in eyes after laser in situ keratomileusis. J Cataract Refract Surg. 2013;39(7):1074–1080. doi: 10.1016/j.jcrs.2013.01.038. [DOI] [PubMed] [Google Scholar]
- 29.Wu W, Wang Y, Xu L. Meta-analysis of Pentacam vs. ultrasound pachymetry in central corneal thickness measurement in normal, post-LASIK or PRK, and keratoconic or keratoconus-suspect eyes. Graefes Arch Clin Exp Ophthalmol. 2014;252(1):91–99. doi: 10.1007/s00417-013-2502-5. [DOI] [PubMed] [Google Scholar]
- 30.Gao L, Fan H, Cheng AC, Wang Z, Lam DS. The effects of eye drops on corneal thickness in adult myopia. Cornea. 2006;25(4):404–407. doi: 10.1097/01.ico.0000214205.29823.f6. [DOI] [PubMed] [Google Scholar]
- 31.Yu A, Zhao W, Savini G, Huang Z, Bao F, Lu W, et al. Evaluation of central corneal thickness using corneal dynamic scheimpflug analyzer Corvis ST and comparison with Pentacam rotating Scheimpflug system and ultrasound pachymetry in normal eyes. J Ophthalmol. 2015;2015:767012. doi: 10.1155/2015/767012. [DOI] [PMC free article] [PubMed] [Google Scholar]
- 32.Emerah S, ELZakzouk E, Farag M. Comparison of central corneal thickness measurements by pentacam and ultrasound pachymetry in normal myopic patients. Electron Physician. 2016;8(12):3441–3444. doi: 10.19082/3441. [DOI] [PMC free article] [PubMed] [Google Scholar]
- 33.Gharieb HM, Ashour DM, Saleh MI, Othman IS. Measurement of central corneal thickness using Orbscan 3, Pentacam HR and ultrasound pachymetry in normal eyes. Int Ophthalmol. 2020;40(7):1759–1764. doi: 10.1007/s10792-020-01344-1. [DOI] [PubMed] [Google Scholar]
- 34.Menassa N, Kaufmann C, Goggin M, Job OM, Bachmann LM, Thiel M, et al. Comparison and reproducibility of corneal thickness and curvature readings obtained by the Galilei and the Orbscan II analysis systems. J Cataract Refract Surg. 2008;34(10):1742–1747. doi: 10.1016/j.jcrs.2008.06.024. [DOI] [PubMed] [Google Scholar]
- 35.Ladi JS, Shah NA. Comparison of central corneal thickness measurements with the Galilei dual Scheimpflug analyzer and ultrasound pachymetry. Indian J Ophthalmol. 2010;58(5):385–388. doi: 10.4103/0301-4738.67045. [DOI] [PMC free article] [PubMed] [Google Scholar]
- 36.Al-Mohtaseb ZN, Wang L, Weikert MP. Repeatability and comparability of corneal thickness measurements obtained from dual Scheimpflug analyzer and from ultrasonic pachymetry. Graefes Arch Clin Exp Ophthalmol. 2013;251(7):1855–1860. doi: 10.1007/s00417-013-2280-0. [DOI] [PubMed] [Google Scholar]
- 37.Jahadi Hosseini HR, Katbab A, Khalili MR, Abtahi MB. Comparison of corneal thickness measurements using Galilei, HR Pentacam, and ultrasound. Cornea. 2010;29(10):1091–1095. doi: 10.1097/ICO.0b013e3181cf98e5. [DOI] [PubMed] [Google Scholar]
- 38.Pedersen L, Hjortdal J, Ehlers N. Central corneal thickness in high myopia. Acta Ophthalmol Scand. 2005;83(5):539–542. doi: 10.1111/j.1600-0420.2005.00498.x. [DOI] [PubMed] [Google Scholar]
- 39.Chang SW, Tsai IL, Hu FR, Lin LL, Shih YF. The cornea in young myopic adults. Br J Ophthalmol. 2001;85(8):916–920. doi: 10.1136/bjo.85.8.916. [DOI] [PMC free article] [PubMed] [Google Scholar]
- 40.Wang X, Dong J, Wu Q. Corneal thickness, epithelial thickness and axial length differences in normal and high myopia. BMC Ophthalmol. 2015;15:49. doi: 10.1186/s12886-015-0039-6. [DOI] [PMC free article] [PubMed] [Google Scholar]
- 41.Kunert KS, Bhartiya P, Tandon R, Dada T, Christian H, Vajpayee RB. Central corneal thickness in Indian patients undergoing LASIK for myopia. J Refract Surg. 2003;19(3):378–379. doi: 10.3928/1081-597X-20030501-18. [DOI] [PubMed] [Google Scholar]
- 42.Holden BA, Sweeney DF, Vannas A, Nilsson KT, Efron N. Effects of long-term extended contact lens wear on the human cornea. Invest Ophthalmol Vis Sci. 1985;26(11):1489–1501. [PubMed] [Google Scholar]
- 43.Liu Z, Pflugfelder SC. The effects of long-term contact lens wear on corneal thickness, curvature, and surface regularity. Ophthalmology. 2000;107(1):105–111. doi: 10.1016/s0161-6420(99)00027-5. [DOI] [PubMed] [Google Scholar]
- 44.Yeniad B, Yiğit B, Işsever H, Közer Bilgin L. Effects of contact lenses on corneal thickness and corneal curvature during usage. Eye Contact Lens. 2003;29(4):223–9. [DOI] [PubMed]
- 45.van der Heijde GL, Weber J. Accommodation used to determine ultrasound velocity in the human lens. Optom Vis Sci. 1989;66(12):830–833. doi: 10.1097/00006324-198912000-00005. [DOI] [PubMed] [Google Scholar]
- 46.Sharma N, Singhvi A, Sinha R, Vajpayee RB. Reasons for not performing LASIK in refractive surgery candidates. J Refract Surg. 2005;21(5):496–498. doi: 10.3928/1081-597X-20050901-13. [DOI] [PubMed] [Google Scholar]
- 47.Nangia V, Jonas JB, Sinha A, Matin A, Kulkarni M. Central corneal thickness and its association with ocular and general parameters in Indians: the Central India Eye and Medical Study. Ophthalmology. 2010;117(4):705–10. [DOI] [PubMed]
- 48.Wolfs RC, Klaver CC, Vingerling JR, Grobbee DE, Hofman A, de Jong PT. Distribution of central corneal thickness and its association with intraocular pressure: the Rotterdam Study. Am J Ophthalmol. 1997;123(6):767–72. [DOI] [PubMed]
- 49.Doughty MJ, Zaman ML. Human corneal thickness and its impact on intraocular pressure measures: a review and meta-analysis approach. Surv Ophthalmol. 2000;44(5):367–408. doi: 10.1016/s0039-6257(00)00110-7. [DOI] [PubMed] [Google Scholar]
- 50.Foster PJ, Baasanhu J, Alsbirk PH, Munkhbayar D, Uranchimeg D, Johnson GJ. Central corneal thickness and intraocular pressure in a Mongolian population. Ophthalmology. 1998;105(6):969–973. doi: 10.1016/S0161-6420(98)96021-3. [DOI] [PubMed] [Google Scholar]
Associated Data
This section collects any data citations, data availability statements, or supplementary materials included in this article.
Data Availability Statement
The datasets supporting the conclusions of this article are included within the article and its additional file.


