

Summary
Craniosynostosis results from premature fusion of the cranial suture(s), which contain mesenchymal stem cells (MSCs) that are crucial for calvarial expansion in coordination with brain growth. Infants with craniosynostosis have skull dysmorphology, increased intracranial pressure, and complications such as neurocognitive impairment that compromise quality of life. Animal models recapitulating these phenotypes are lacking, hampering the development of urgently needed innovative therapies. Here we show that Twist1+/− mice with craniosynostosis have increased intracranial pressure and neurocognitive behavioral abnormalities, recapitulating features of human Saethre-Chotzen syndrome. Using a biodegradable material combined with MSCs, we have successfully regenerated a functional cranial suture that corrects skull deformity, normalizes intracranial pressure and rescues neurocognitive behavior deficits. The regenerated suture creates a niche into which endogenous MSCs migrated, sustaining calvarial bone homeostasis and repair. MSC-based cranial suture regeneration offers a paradigm shift in treatment to reverse skull and neurocognitive abnormalities in this devastating disease.
Keywords: Mesenchymal stem cells, suture regeneration, Twist1, neurocognitive abnormalities, calvarial deformity
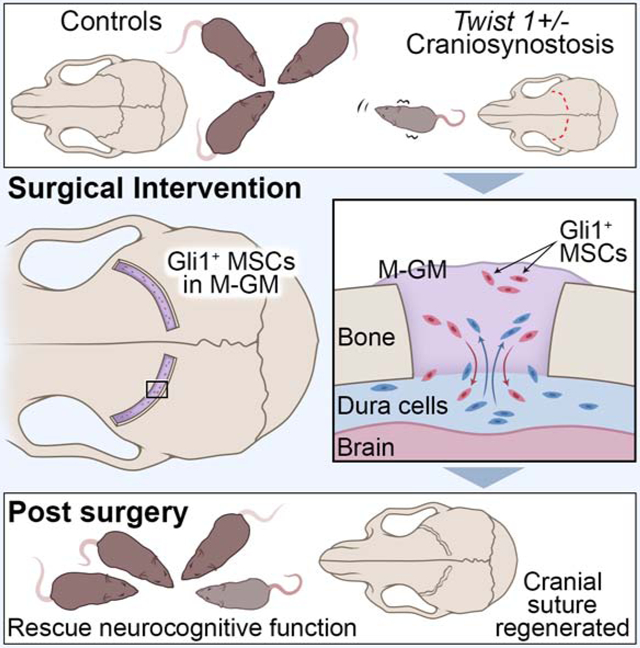
Graphical Abstract
In Brief:
Yu et al., develop a platform for cranial suture regeneration using a biodegradable material combined with mesenchymal stem cells in a mouse model of craniosynostosis that reverses increased intracranial pressure, skull and neurocognitive abnormalities.
Introduction
Craniosynostosis is a common disorder in which one or more calvarial sutures, the fibrous joints that separate the skull bones, fuse prematurely in infancy. This causes abnormal skull growth, increased intracranial pressure (ICP), delayed brain development, and often impaired cognitive functions (Morriss-Kay and Wilkie, 2005; Twigg and Wilkie, 2015). Calvarial suture patency is crucial for allowing the skull to compress during childbirth and accommodating its extensive postnatal growth in concert with the developing brain, which continues into adulthood. Currently, the only treatment for craniosynostosis is complex surgery to correct the skull deformity and prevent its sequelae (Wolfswinkel et al., 2017). In many cases, the bones resynostose, necessitating re-operation. There is an immense need for better treatment of craniosynostosis and prevention of resynostosis.
Patients with craniosynostosis often exhibit neurocognitive dysfunctions and intellectual disabilities (Gripp et al., 2000; Reardon et al., 1997; Speltz et al., 2015; Zechi-Ceide et al., 2012). For example, patients with Saethre-Chotzen syndrome have mutations in TWIST1 and show preferential loss of the coronal suture. Large deletions including the TWIST1 locus have been associated with learning disabilities and neurocognitive impairment (Gripp et al., 2000; Zechi-Ceide et al., 2012). Gain-of-function mutations in ZIC1 or FGFR lead to craniosynostosis and learning disabilities (Reardon et al., 1997; Twigg and Wilkie, 2015). Although neurocognitive deficits are more commonly associated with syndromic craniosynostosis, some patients with nonsyndromic single-suture craniosynostosis may develop intellectual disability and developmental delays that vary in severity (Speltz et al., 2015;Wallace et al., 2016; Collett et al., 2017). These studies highlight the heterogeneity of these deficits and provide evidence that craniosynostosis alone may cause neurocognitive dysfunction. Overall, premature suture fusion can adversely impact neurocognition, likely due to increased ICP and neuroanatomical changes (Morriss-Kay and Wilkie, 2005). However, ICP and neurocognition have not been investigated in animal models of craniosynostosis, resulting in a gap in our understanding of this devastating disease. It therefore also remains unknown whether restoring suture patency can improve neurocognitive function.
Mesenchymal stem cells (MSCs) can self-renew and differentiate into an array of different cell types for tissue regeneration (Chan et al., 2018; Mao et al., 2006), and have been used to regenerate calvarial bone (Cowan et al., 2004; Liu et al., 2011; Maruyama et al., 2016). We recently reported that Gli1+ cells are an indispensable MSC source within the cranial sutures (Zhao et al., 2015). They support craniofacial bone turnover, repair and regeneration in adult mice (Guo et al., 2018; Park et al., 2016; Zhao et al., 2015). Importantly, we have demonstrated there is premature loss of Gli1+ cells prior to coronal suture fusion in Twist1+/− mice (Zhao et al., 2015). These studies suggest that restoring MSCs represents a potential therapeutic approach for cranial suture regeneration in craniosynostosis. However, this approach presents substantial technical challenges. Previous studies have shown that the method of MSC delivery and the biomaterial(s) used in the defect area are crucial (Zhao and Chai, 2015). It is not well understood how MSCs may participate in the cranial suture regeneration process or what are the ideal biomaterials to support them.
In this study, we show that premature fusion of the coronal suture led to increased ICP and neurocognitive abnormalities in Twist1+/− mice, recapitulating symptoms of Saethre-Chotzen syndrome in humans. Using this clinically highly relevant mouse model, we demonstrated that Gli1+ MSCs combined with modified GelMA can support coronal suture regeneration. Endogenous MSCs migrated to the regenerated suture area to sustain its function in calvarial tissue homeostasis and repair. Significantly, suture regeneration reduced ICP, partially alleviated calvarial deformity, and improved neurocognitive function. As TWIST1 haploinsufficiency is associated with craniosynostosis in patients with Saethre-Chotzen syndrome, our discovery is highly relevant for clinical translation and offers a unique approach for improving the quality of life for craniosynostosis patients.
Results
Twist1+/− mice with craniosynostosis exhibit increased ICP and neurocognitive abnormalities
To investigate whether craniosynostosis can lead to intracranial hypertension and neurocognitive behavioral abnormalities in Twist1+/− mice, as reported in humans (Millichap, 2015), we first measured the ICP in Twist1+/− mice with craniosynostosis (referred to as MUT) and wildtype (WT) littermate controls (Figure 1A) at two months of age. Twist1+/− mice had significantly increased ICP compared to WT (Figures 1B, 1C). Then we conducted a battery of cognitive behavioral tests. Data from both male and female mice were combined for the statistical analyses as no sex-biased preference was observed (Figures S1B-S1G). In open field and elevated plus maze tests, Twist1+/− mice spent comparable time in the center area of the open field arena (Figure S1I) and similar time and entries in the open arms of the elevated plus maze as their WT littermates (Figures S5E-S5G), which indicated that Twist1+/− mice did not have unusual levels of anxiety.
Figure 1. Twist1+/− mice with craniosynostosis exhibit increased intracranial pressure and cognitive behavioral abnormalities.

(A) Diagram depicting the intracranial pressure measurement setup.
(B, C) Representative intracranial pressure (ICP) traces (B) and quantification (C) of ICP values (WT, n=8; MUT, n=6 mice).
(D, F, I) Schematics of rotarod test (D), novel object test (F), and three chamber test (I).
(E) Rotarod performance scored as time (seconds) on the rotarod.
(G, J) Representative animal tracks in novel object test (G) and three chamber test (J).
(H, K) Preference indices in novel object test (H) and sociability and social novelty tests (K).
WT, wild type mice, n=20; MUT, Twist1+/− mice with bilateral suture fusion, n=20.
Data are mean ± s.e.m. (C, E, H, K). *P < 0.05, **P < 0.01, ***P < 0.001, ****P < 0.0001, NS, not significant calculated by two-tailed unpaired t-test.
In the novel object test (Figure 1F), the preference for a novel object was significantly impaired in Twist1+/− mice with craniosynostosis compared to WT controls (Figures 1G, 1H), suggesting a hippocampus-dependent spatial memory deficit. To assess social cognition, a three-chamber test was performed (Figure 1I). The preferences for investigating the mouse versus empty cage and novel versus familiar mouse were significantly decreased in Twist1+/− mice with craniosynostosis (Figures 1J, 1K), indicating impaired sociability and social novelty. To exclude the possibility that the impaired cognitive functions in Twist1+/− mice with craniosynostosis may be caused by olfactory dysfunctions, we performed an odor discrimination/habituation test (Figure S5H) and found that Twist1+/− mice with craniosynostosis could distinguish among and habituate to nonsocial and social odors to the same degree as their WT littermates, which suggested they had normal olfaction (Figure S5I). We examined motor learning ability using a rotarod test (Figure 1D). WT control mice exhibited an increased latency to falling off the accelerating rotarod (4-40 rpm in 5 min) over four consecutive days, indicating active learning (Figure 1E). In contrast, Twist1+/− mice with craniosynostosis did not exhibit obvious improvement, suggesting a significant motor learning deficit. We next measured motor functions and did not find an obvious difference in grip strength (Figure S5D) or total distance traveled in the open field arena (Figure S1H), which suggested normal motor strength of Twist1+/− mice with suture fusion. Together, these results suggested that Twist1+/− mice have neurocognitive dysfunctions. We suspected that these deficits were mediated by their elevated ICP, as Twist1 expression is not detected in the brain in adult mice, so its haploinsufficiency is unlikely to have a direct effect on neurocognition (Figure S1A).
Modified GelMA provides a favorable environment for suture MSCs
To optimize the formulation of a scaffold for Gli1+ cells to support the regeneration of a new coronal suture in Twist1+/− mice with craniosynostosis, we compared several different biomaterials. Briefly, we tested different formulations of methacrylated gelatin (GelMA) modified with Matrigel and collagen I (COL-I). GelMA has excellent biocompatibility and is easy to use in a surgical setting as it conforms to defects and can be light-cured in seconds (Noshadi et al., 2017). The addition of Matrigel promotes the spread of cells inside the scaffold, while collagen I helps form a suitable suture space as shown below. Before settling on the final formulation, we tested some variations: (1) pure GelMA, (2) GelMA:Matrigel at a ratio of 5:1, (3) GelMA:Matrigel at 2:1, (4) GelMA:Matrigel at 1:1, (5) GelMA:Matrigel at 1:2, and (6) pure Matrigel. Pure GelMA and GelMA:Matrigel (5:1) had a higher compressive modulus than the other materials (Figure S2A), which would better maintain the space between bones after surgery for suture regeneration. The tensile strength was also tested, and there was no significant difference between pure GelMA and GelMA:Matrigel (5:1), while the remaining four groups were too soft to be measured. After being soaked/rinsed for three weeks, the remaining mass of pure GelMA and GelMA:Matrigel (5:1) remained higher than those of other groups (i.e. they had the lowest degradation rate), which would also help prevent suture refusion after surgery (Figure S2B). Diffusional permeability testing showed that the pure GelMA and GelMA:Matrigel (5:1) had the lowest diffusional ability, which may help to block the intrusion of cytokines, such as angiogenesis factors that could promote bone formation and suture refusion (Figure S2C). Using pure Matrigel, which had the highest diffusional permeability, suture refusion occurred in as soon as one month (Figure S3J). The swelling ratio showed similar results to the diffusional permeability testing, which suggested that a solution like blood could more easily get into the pure Matrigel and promote bone formation, while there was no significant difference between the other five groups (Figure S2D). Taking all these properties into account, we concluded that pure GelMA and GelMA:Matrigel at a 5:1 ratio have the most favorable properties for suture regeneration. It is important to note that Matrigel, a mouse tumor matrix preparation, may be limited in its application for patient use.
We compared GelMA:Matrigel:COL-I at a ratio of 10:2:1 (M-GM) to pure GelMA (GM) and GelMA:Matrigel at a ratio of 5:1 (GM-Ma). Both SEM (Figure S2F) and cellular viability staining (Figure S2G) showed that cells could spread more easily in GM-Ma and M-GM in three-dimensional culture. After six months, M-GM with MSCs formed a regenerated suture more similar to a natural one (Figures S2H-S2L), which suggested COL-I could attract osteo-related cells in later stages to form a suitable space (Figures S2J, S2L). None of the crucial material properties were significantly changed by adding COL-I to GM-Ma (Figures S2M-S2P). Ultimately, these results suggested that M-GM provides a suitable environment for MSC-mediated suture regeneration.
To investigate whether the Gli1+ MSCs retained their stemness after 10 days of culture in vitro, a colony-forming assay was performed. Gli1+ MSCs formed colonies (Figure S2E) and could differentiate towards osteogenic, chondrogenic and adipogenic lineages (Zhao et al., 2015), confirming their stemness.
Suture MSCs in M-GM support the regeneration of cranial sutures in Twist1+/− mice
To test whether Gli1+ MSCs combined with M-GM can support coronal suture regeneration in Twist1+/− mice with bilateral coronal suture fusion (Figures 2A, 2C), we generated a rectangular defect 0.3-0.4 mm wide over each of the fused coronal sutures (Figures 2B, 2D). Gli1+ cells with M-GM (M-GM+SCs) were implanted into the defect on the right side (Figures 2E, 2F). The defect on the opposite side was either (1) left empty or filled with (2) pure M-GM, (3) suture mesenchymal cells from Gli1-CreERT2;ROSA26LoxP-STOP-LoxP-DTA GFP mice mixed with M-GM (M-GM+DTA cells), (4) heat-inactivated Gli1+ cells mixed with M-GM (M-GM+H-SCs), or (5) Gli1+ cells mixed with Matrigel (Ma+SCs).
Figure 2. Suture MSCs and M-GM can support the regeneration of a cranial suture.

(A-F) Overview of the calvarial surgery showing the calvaria before surgery (A, C) and after surgery (B, D). MicroCT of calvaria (C, D). White arrowheads indicate the residual hallmark of the fused suture (A, C, D). The defect on one side of the calvaria was filled with pure M-GM or left empty as a control, and the defect on the other side was filled with M-GM plus Gli1+ cells (E, F). Scale bar, 2 mm.
(G-L) MicroCT images (3-D reconstruction and slice) for controls (G1, I1, K1 for blank, and H1, J1, L1 for pure M-GM) and M-GM plus suture MSCs (M-GM+SCs; H2, J2, L2) at one, three, and six months post-surgery. Dotted lines (white) outline the original surgical defects. Scale bar, 2 mm.
(M) HE staining of blank control (left), M-GM (middle) and M-GM+SC (right) groups at one, three, and six months post-surgery. Outlined areas in M-GM+SC group are separately shown in right panels. Black arrowheads indicate the positions of initial defects, and asterisk shows suture-like structure in M-GM+SCs six months post-surgery. Scale bar, 200 μm.
(N) Immunofluorescence staining for M-GM+SCs at one month (left), three months (middle), and six months post-surgery (right). Red fluorescently labeled cells were harvested from one-month-old Gli1-CreERT2;tdTfl/+ mice. White arrowheads indicate donor cells (red) in surrounding tissues; white dotted lines show boundaries of bones. Scale bar, 200 μm in upper panel; 25 μm in lower panel.
One month after surgery, there was already new bone formation in the blank controls (Figures 2G, 2G1), whereas spaces were found between the two bones filled with M-GM alone or with M-GM+SCs (Figures 2H, 2H1, 2H2). The bone matured in the blank controls three months post-surgery (Figures 2I, 2I1), and the lateral bony edges of defects began to meet in the M-GM group (Figures 2J, 2J1). In contrast, the bone edges remained separated in the M-GM+SC group (Figures 2J, 2J2). Six months post-surgery, when the defect was left empty or filled only with M-GM, the suture sites had re-fused (Figures 2K1, 2L1). At the same time point, the bones were still separated in defects filled with M-GM+SCs (Figures 2K, 2L). Even after one year, this regenerated suture remained patent (Figure S3G). All of the other groups experienced resynostosis, including those filled with M-GM+DTA cells (Figure S3H), heat-inactivated M-GM+H-SCs (Figure S3I), and Ma+SCs (Figure S3J), clearly indicating the crucial roles played by live Gli1+ MSCs cells and M-GM in successful suture regeneration.
Histological analysis (Figure 2M) confirmed the disappearance of the coronal suture as well as the presence of thicker bone in the empty defects one month post-surgery. In defects filled with M-GM alone, fibrous tissue with some bony islands formed, whereas suture-like tissue could be seen between bone edges in the MGM+SC group. Three months post-surgery, the porous bone structure of the empty defects was replaced by lamellar bone. The bony margins began to connect in the M-GM group and became thicker six months post-surgery. In the M-GM+SC group, the gap between the bones remained and new fibrous suture formed within six months post-surgery (Figure 2M).
Next we investigated how implanted Gli1+ MSCs may contribute to suture regeneration in Twist1+/− mice (Figure 2N). One month post-surgery, the majority of implanted Gli1+ MSCs were present in the center of the defect while a few appeared in the osteogenic fronts, periosteum, and dura (Figure 2N, left). Interestingly, in defects filled with M-GM+SCs three months post-surgery, large numbers of tdTomato-labeled cells were detectable in the osteogenic fronts, periosteum, and dura mater near the suture (Figure 2N, middle). A few labeled osteocytes were detected near the osteogenic fronts, while some remained in the center of the regenerated suture. Six months post-surgery (Figure 2N, right), progeny of implanted Gli1+ MSCs were detectable in the periosteum, dura, and osteocytes of calvaria further away from the defect (white arrowhead), and there were some endogenous Gli1+ MSCs (in green) in the middle of the regenerated suture. Nearly one year post-surgery, the majority of the implanted Gli1+ MSCs took part in the formation of the nearby tissues, with only a few Gli1+ cells remaining in the center of the suture (Figure S3G). In the defects left empty or filled with M-GM alone, the suture had nearly or totally re-fused, and Runx2+ cells were numerous at all stages (Figures S3E, S3F). These results suggest that the implanted Gli1+ MSCs in the regenerated suture may contribute to the turnover of the osteogenic fronts, periosteum, and dura to support calvarial tissue homeostasis.
Dura mater cells contribute to suture regeneration in Twist1+/− mice
As shown in Figures 2N and S3G, some Gli1+ cells (in green) were present in addition to the implanted Gli1+ MSCs (tdTomato+) in the regenerated suture. The ratio of endogenous to implanted labeled cells increased over time, which suggests that the endogenous stem/progenitor cells also played roles in sustaining suture regeneration and function. To investigate the source of these cells, the dura mater under the defect was labeled with FITC prior to the implantation of Gli1+ MSCs and M-GM in Twist1+/− mice with craniosynostosis (Figure 3A). Exogenous and endogenous Gli1+ cells were both present in the suture region four weeks post-surgery (Figures 3B-3D). To confirm whether MSCs from the dura contributed to the newly regenerated suture, a Parafilm membrane with 10 nm pores was placed between the dura and the calvarial bone to block the migration of endogenous MSCs into the suture (Figure 3E). Six weeks post-surgery, the suture area was almost re-fused in the group with the Parafilm membrane (asterisks in Figures 3F-3F3), in contrast to the group without the Parafilm membrane, in which the suture space was maintained (Figure 2). Kidney capsule transplantation of calvarial explants also indicated that M-GM+MSCs cannot regenerate a suture following the removal of the dura. The defect in the explanted bone was filled with bone six weeks post-transplantation (Figures 3G, 3H, 3H1-2). These data clearly suggest that endogenous Gli1+ MSCs, in conjunction with implanted Gli1+ MSCs, help to sustain the regenerated suture in Twist1+/− mice (Figure 3I).
Figure 3. Dura mater cells contribute to the regenerated sutures in Twist1+/− mice.

(A-D) Qtracker FITC (green) labeled dura mater cells migrate from the dura at day 0 (A) to the regenerated suture at four weeks post-surgery (B-D). Donor cells fluorescently labeled in red were harvested from one-month-old Gli1-CreERT2;tdTfl/+ mice. Gli1+ cells were labeled with Alexa-647 and arrowheads indicate the co-labeled signals (C, D). Scale bar, 50 μm in inset in (A), 200 μm in (A); 100 μm in (B); 50 μm in (D).
(E) Schematic of dura mater blockage surgery.
(F) MicroCT images (3-D reconstruction and slice), HE and immunofluorescence staining of the defects six weeks post-dura mater blocking. Black dotted lines in (F) outline the original surgical defects. (F2, F3) Asterisks indicate the Parafilm membrane (yellow dotted lines in F3); arrowheads indicate the dura mater. Scale bars, 500 μm in (F) and (F1); 100 μm in (F2) and (F3).
(G, H) 3-D reconstructed microCT images of bone defects filled with M-GM+MSCs for kidney capsule transplantation one day (G) or six weeks post-surgery (H). HE and immunofluorescence staining of the explant are shown in the right panel. Scale bars, 1 mm in (H); 200 μm in (H1) and (H2).
(I) Schematic drawing shows that M-GM+SCs might provide a niche that recruits endogenous dura mater cells into the regenerated suture, while donor cells also contribute to the self-renewal of surrounding tissues. Bone boundaries are outlined by brown lines.
Although Twist1 is known to maintain cranial suture MSCs and suture patency during embryonic development, its role in regulating postnatal MSCs in the cranial suture remains unclear. To test the functional requirement of Twist1 in regulating suture MSC fate in adults, we generated Gli1CreER;Twist1fl/fl mice. Loss of Twist1 in Gli1+ cells did not lead to craniosynostosis in adult Gli1CreER;Twist1fl/fl mice (Figures S3O, S3P). This suggests that Twist1’s postnatal functions are not essential, which may partially explain why implanted Gli1+ MSCs, together with endogenous dura-derived Twist1+/− MSCs, can regenerate a sustainable cranial suture and prevent resynostosis in adult Twist1+/− mice.
Regenerated suture functions similarly to natural cranial suture
To evaluate how functionally similar coronal sutures regenerated by implanted MSCs and M-GM are to natural sutures, we performed RNA sequencing to compare the gene expression profiles of coronal sutures from WT mice, Twist1+/− mice with bilateral coronal suture fusion (MUT), and the endogenous cells from Twist1+/− mice with regenerated sutures (REG). The WT and MUT groups had distinct gene expression profiles, while the endogenous cells from the REG group had a gene expression profile more similar to that of a WT coronal suture (Figure 4A). t-SNE analysis confirmed that the gene distributions of the WT and endogenous cells from the REG group were closer to each other than to the MUT group (Figure 4B). The WT group and endogenous cells in the REG group both had ~3000 upregulated genes and ~6000 (WT)/~11000 (REG) downregulated genes relative to the MUT group, while there were only 800-900 differentially expressed genes between the WT group and endogenous cells in the REG group (Figure 4C). Putative marker genes of suture mesenchymal stem/progenitor cells such as Gli1, Prrx1, and Axin2 all showed increased expression in the endogenous cells of the REG group in comparison to the MUT group (Figure 4D). Msx2, a gene implicated in osteogenesis (Liu et al., 2019), and Ostn, which is specifically expressed in osteoblasts and osteocytes in adult bone (Bord et al., 2005), were both upregulated in the MUT group and restored in the endogenous cells of the REG group compared to the WT group (Figure 4D). These results suggested that suture regeneration partially restored the normal suture gene expression profile, and that exogenous MSCs induced endogenous cells from the dura to play an important role in restoring a normal gene expression profile.
Figure 4. Regenerated sutures show similar gene expression profile and function to natural cranial sutures.

(A-D) RNAseq analysis of normal sutures (WT), fused sutures (MUT), and the endogenous cells from regenerated sutures (REG). Gene expression profiles are shown with heatmap (A), t-SNE visualization of color-coded regions for the three groups (B), volcano plots indicating the number of differentially expressed genes (C), and gene signatures of Gli1, Prrx1, Axin2, Msx2, and Ostn based on the relative expression levels of WT, MUT, and REG (D).
(E) The osteogenic (upper panel, alizarin red staining in inset), chondrogenic (middle panel, whole mount immunostaining and section staining in inset), and adipogenic (lower panel) differentiation ability of cells in the regenerated suture.
(F-K) The ability of the regenerated suture to repair bone at one day (F-H) or three months post-injury (I-K). MicroCT slices of blank (G, J) and M-GM+SCs (H, K) sides. Red fluorescently labeled cells were from donor mice (K1, K2). Asterisks indicate injuries in parietal bones (G, H, J, K); arrowheads in (H, K) indicate the regenerated sutures. Scale bars, 2 mm in (F), (I); 1 mm in (G), (H), (J) and (K); 100 μm in (J1, J2) and (K1, K2).
(L-S) Visualization one day (L-N) and three months (O-Q) after transplantation of regenerated sutures or parietal bones without sutures (non-suture transplant) dissected from CAG-EGFP mice. MicroCT slices of non-suture transplant group (M, P) and transplants with sutures (N, Q). (Q1) Green fluorescently labeled tissues were from CAG-EGFP mice, while red cells were from donor Gli1-CreERT2;tdTfl/+ mice. Arrowheads indicate the regenerated sutures (L, N, O, Q). (R) White dotted lines outline the original size of the transplants, while yellow dotted lines indicate the boundary of the regenerated tissue (R). (S), Quantification of the fold change of the transplant surface area from (R).
Scale bars, 2 mm in (L), (O), (R); 1 mm in (M), (N), (P) and (Q); 200 μm in (Q1). Data are mean ± s.e.m. (S). **P < 0.01, calculated by independent two-tailed Student’s t-test.
To investigate molecular mechanisms underlying suture regeneration, we examined Wnt signaling, which plays an important role in craniosynostosis (Yu et al., 2005). Most genes in the Wnt family were upregulated in the MUT group compared to both the endogenous part of the REG group and the WT group (Figure S4C), including Wnt1, Wnt2, Wnt3, Wnt3a, Wnt5a, Wnt9b, while a few were downregulated in the MUT group, such as Wnt5b, Wnt7b, and Wnt10b. Axin2, a negative regulator of Wnt signaling, was downregulated in Twist1+/− mice, and its expression was reversed by MSC implantation. These results suggest that Twist1+/− cranial sutures exhibited upregulation of Wnt signaling that was reversed by MSC implantation. To examine cellular effects of Wnt signaling upregulation, we assessed the osteogenic differentiation ability of suture mesenchymal cells after treating them with a Wnt activator (Wnt agonist 1) or GSK3 inhibitor (activator of Wnt signaling, LY2090314). Runx2 and OPN expression levels were significantly increased after Wnt signaling was enhanced (Figures S4A and S4B). The expression levels of Wnt-related genes could be restored by suture regeneration (Figure S4C). These results suggested that Wnt signaling upregulation promotes osteogenic differentiation of suture mesenchymal cells and contributes to craniosynostosis, all of which were reversed by MSC implantation.
To test the stemness of MSCs in the regenerated cranial suture, we harvested suture mesenchymal cells from coronal sutures six months post-surgery and demonstrated that these cells were capable of osteogenic, chondrogenic, and adipogenic differentiation (Figure 4E). Interestingly, the tdTomato-labeled donor cells performed poorly in adipogenic differentiation, which implied these cells were more committed towards osteochondrogenic lineages.
To evaluate the ability of the regenerated suture to repair bone after injury, we created a defect in the parietal bone next to the regenerated coronal suture six months after the first surgery (M-GM+SCs group), while on the other side of the calvaria, an identical defect was generated in the parietal bone next to the refused coronal suture (where the defect was left empty) (Figures 4F-4H). Three months later, both implanted Gli1+ MSCs and endogenous MSCs contributed to the bone regeneration (Figures 4K1, 4K2). The defects initially treated with M-GM+SCs were completely healed (Figure 4I and white asterisk in Figure 4K), whereas the blank controls did not fully heal (white asterisks in Figures 4J, 4J2). These results suggested that regenerating a suture restores its important ability to support tissue regeneration.
To confirm the regeneration and turnover ability of the regenerated suture, we also transplanted calvarial bone containing newly regenerated suture into another Twist1+/− mouse after six months (Figures 4L, 4N). Calvarial bone with refused sutures taken from the blank control side of Twist1+/− mice with bilateral craniosynostosis was also transplanted as a control (Figures 4L, 4M). Three months later, transplants containing regenerated suture connected with the host bone (Figures 4O, 4Q). The newly regenerated tissue grew rapidly and doubled in surface area (Figures 4Q1, 4R, 4S). In contrast, the transplants without sutures failed to grow and did not connect with the host bone after three months (Figures 4O, 4P). These results indicated that the regenerated suture possesses the important ability to support calvarial bone turnover and homeostasis.
Suture regeneration rescues skull deformity in Twist1+/− mice
To investigate whether regenerating the suture can correct the skull malformations in Twist1+/− mice, we compared the skull shapes of controls (WT), Twist1+/− mice with bilateral coronal suture fusion (MUT), and Twist1+/− mice with bilateral suture regeneration (REG). Established anatomical landmarks (Ho et al., 2015; Figures S4D-S4F) were used to analyze the shape of the top of the calvarium (T-calvarium shape, Figure 5B) and the lateral portion of the calvarium (L-calvarium shape, Figure 5D) of each group. Skulls of WT control and REG mice were significantly longer in the anterior-posterior direction than those of MUT mice (Figures 5A, 5C). PCA analysis revealed that the WT and REG groups were more similar to each other than to the MUT group in both T- and L-calvarial shape (Figures 5E, 5F). Though the REG group had a different T-calvarium shape than WT (Figure 5E2, Procrustes distance = 0.0501; P < 0.05), the differences between the MUT and WT/REG groups were greater (Figure 5E1, Procrustes distance = 0.1138; P < 0.01, or Figure 5E3, Procrustes distance = 0.0853; P < 0.01). The first principal component (PC1) of L-calvarium shape, which accounted for 52.101% of the total variation in the sample, placed the REG mice between the other two groups (Figures 5F and 5F1-5F3). These results indicated that suture regeneration partially rescued head shape deformity in Twist1+/− mice with craniosynostosis.
Figure 5. Regenerated sutures rescue skull deformity in Twist1+/− mice with craniosynostosis.

(A, C) Colored dots indicate landmarks (shown in Figures S7A-S7C) of the top calvarium (T-Calvarium) and lateral calvarium (L-Calvarium) shape in all three groups: multiple skull views of normal mice (WT, n=7, blue), Twist1+/− mice with bilateral coronal suture fusion (MUT, n=6, red), and Twist1+/− mice with bilateral coronal suture regeneration (REG, n=5, green).
(B, D) Wireframe deformations representing the shape differences between WT, MUT and REG groups for each region.
(E, F) Total variation between WT, MUT and REG groups was determined by principal component analysis (PCA) for both shape regions. Results of discriminant function analysis (DFA) of three groups for each shape region: top calvarium (E1-E3) and lateral calvarium (F1-F3). Procrustes distance (PD) and P-value (*P < 0.05, **P < 0.01) were analyzed for every comparison.
Suture regeneration improves neurocognitive functions in Twist1+/− mice with craniosynostosis
To test whether suture regeneration rescues neurocognitive dysfunctions in Twist1+/− mice with craniosynostosis, we first created a comparison group by performing bilateral suture regeneration surgery on WT mice on postnatal day 14. The suture structure was recovered at six weeks post-surgery (Figure S7A) in these mice. We then measured ICP and performed behavioral tests. We did not detect significant changes in ICP (Figure S7B), social recognition (Figures S7C-S7E), motor learning (Figure S7F), or anxiety-related behaviors (Figures S7G, S7H) in recovered WT mice. These results confirmed that the surgical procedure per se does not introduce behavioral changes.
We next confirmed that elevated ICP in Twist1+/− mice was restored after suture regeneration (Figures 6A, 6B). We subjected WT and Twist1+/− mice with or without suture regeneration to a battery of behavioral tests. The novel object test revealed that the impaired preference for novel objects in Twist1+/− mice was restored after suture regeneration (Figures 6D, 6E). The three-chamber test showed that suture regeneration also significantly rescued the sociability and social novelty deficits in Twist1+/− mice (Figures 6F-6H). Despite a trend towards improvement, motor learning was not significantly rescued after suture regeneration (Figure 6C). We did not detect changes in general locomotion (Figures S5A, S5B), grip strength (Figure S5D) or olfaction (Figures S5H, S5I), or obvious anxiety-related behaviors (Figures S5C, S5E-S5G).
Figure 6. Suture regeneration normalizes intracranial pressure and partially restores neurocognitive function in Twist1+/− mice with craniosynostosis.

(A, B) Representative intracranial pressure (ICP) traces (A) and quantification (B) of ICP values (WT, n=7; MUT, n=5; REG, n=5 mice).
(C) Rotarod performance scored as time (seconds) on the rotarod (WT, n=10; MUT, n=12; REG, n=10 mice).
(D, E) Representative animal tracks (D) and preference index (E) of novel object test (WT, n=11; MUT, n=12; REG, n=17 mice).
(F, G, H) Representative animal tracks (F) and preference indices of sociability (G) and social novelty (H) in the three-chamber test (WT, n=10; MUT, n=12; REG, n=12 mice).
(I, J, K) ICP values plotted against preference indices in novel object test (I), sociability (J) and social novelty (K) in the three-chamber test (WT, n=7; MUT, n=6; REG, n=6 mice). Data are mean ± s.e.m. (B, C, E, G, H).
*P < 0.05, **P < 0.01, ***P < 0.001, NS, not significant calculated by one-way ANOVA (B, E, G) with Tukey post hoc tests and two-tailed unpaired t-test (C).
We performed correlation analyses between ICP and cognitive behaviors, including novel object preference, sociability, and social novelty, which were impaired in Twist1+/− mice. There was a positive correlation between ICP elevation and behavioral deficits, which was reversed by MSC-mediated suture regeneration (Figures 6I-6K). Together, these results suggested that suture regeneration rescued neurocognitive dysfunctions in Twist1+/− mice, likely through reduction of ICP.
To evaluate the importance of surgery timing, we performed suture regeneration surgery on Twist1+/− mice at postnatal 8 weeks, which corresponds to an adult human ~20 years old (Semple et al., 2013). Behavioral studies did not detect significant rescue of neurocognitive deficits when surgery was performed at this later age (Figures S6A-S6F), suggesting the timing of suture regeneration surgery is crucial.
Suture regeneration restores brain volume and neural numbers in Twist1+/− mice with craniosynostosis
In humans, untreated craniosynostosis can lead to microcephaly (Blount et al., 2007; Kabbani et al., 2004; Lane, 1892), correlating with high risk of impaired intelligence, speech and learning as well as behavioral problems (Shim et al., 2016). To investigate the mechanisms underlying rescue of neurocognitive functions by suture regeneration, we measured brain volume using magnetic resonance imaging (MRI). Consistent with microcephaly in craniosynostosis patients, whole-brain volume was reduced in Twist1+/− mice with craniosynostosis, but this was reversed by suture regeneration (Figures 7A-7B). We then examined specific brain regions involved in behaviors altered in Twist1+/− mice with craniosynostosis. The cortical mantle, hippocampus, and corpus callosum volumes were significantly reduced in Twist1+/− mice, and were restored after suture regeneration (Figures 7A, 7C-7E), while the thalamic volume was not significantly changed in Twist1+/− mice (Figures 7A, 7F).
Figure 7. Suture regeneration surgery performed at postnatal day 14 restores brain morphology in Twist1+/− mice with craniosynostosis.

(A) Representative magnetic resonance images (MRI) of WT, MUT and REG mouse brains. Hippocampus (Hipp), cortex (Ctx), corpus callosum (Cc) and thalamus (Th) are outlined by yellow or cyan dotted lines. Scale bar, 2 mm.
(B-F) Quantifications of volume of whole brain (B), cortex (C), hippocampus (D), corpus callosum (E) and thalamus (F). (WT, n=5; MUT, n=5; REG, n=5 mice).
(G-I) Representative images of Cux1+ (G), Ctip2+ (H), Tbr1+ (I) cells in somatosensory cortex. Scale bar, 50 μm.
(J-L) Quantification of Cux1+ (J), Ctip2+ (K), and Tbr1+ (L) cells in somatosensory cortex with 300 μm width (WT, n=4; MUT, n=4; REG, n=4 mice).
*P < 0.05, **P < 0.01, ***P < 0.001, NS, not significant calculated by one-way ANOVA with Tukey post hoc tests.
To investigate the cellular basis of brain volume changes, we examined neural numbers in different cortical layers, including Cux1-labeled layer II–IV neurons and Ctip2- and Tbr1-labeled layer V–VI neurons (Leone et al., 2008; Molyneauxet al., 2007). IHC staining showed that Cux1+, Ctip2+, and Tbr1+ neurons were all reduced in Twist1+/− mice (Figures 7G-7L) and restored after suture regeneration (Figures 7G-7L). This may indicate restored neurogenesis following suture regeneration in Twist1+/− mice with craniosynostosis, but could also result from reduced cell death. Focusing on the neuronal activation maker c-Fos, we examined prelimbic and perirhinal cortical regions, which are implicated in social and object recognition, respectively (Rinaldi et al., 2008; Krueger et al., 2009; Buckley et al., 2006). IHC staining showed that the numbers of c-Fos+ cells were increased in Twist1+/− mice, and were restored to normal levels after suture regeneration (Figure S6G). Together, these results suggest that suture regeneration restored neural numbers and brain volume reduced in Twist1+/− mice, providing crucial insights into the mechanisms underlying the impairment and restoration of neurocognitive functions.
Discussion
By combining MSCs with biomaterials and establishing a mouse model of neurocognitive defects associated with craniosynostosis, we have discovered that Gli1+ MSC-based cranial suture regeneration restores not only skull dysmorphology, but also neurocognitive dysfunctions in the Twist1+/− mouse model of craniosynostosis. These findings represent a research paradigm shift and provide a MSC-based therapeutic strategy for treating craniosynostosis with potential beneficial impacts on clinical practice.
Mutant animal models have been instrumental in elucidating the molecular and cellular etiology of craniosynostosis. Many of these models phenocopy the synostoses seen in patients with the same genetic mutation, making them highly valuable (Twigg and Wilkie, 2015). However, nearly all studies have focused exclusively on cranial suture defects; analysis of the ICP and neurocognitive functions of these models has been lacking. Here, we established Twist1+/− mice to model neuroanatomic and cognitive dysfunctions in craniosynostosis patients. These findings will promote future research into neurocognitive dysfunctions in other craniosynostosis mouse models and lay the foundation for investigating the molecular, cellular, and circuit mechanisms that underlie them. Our discoveries also facilitate the design and evaluation of future therapeutic interventions since both syndromic and non-syndromic craniosynostosis lead to increased ICP and altered brain morphology, which may in turn cause significant changes in neurocognitive function (Bellew et al., 2005; Brooks et al., 2018; Renier et al., 1982; Sidoti et al., 1996). We have developed an effective treatment in which Gli1+ MSCs and modified GelMA support cranial suture regeneration and correct skull dysmorphology in Twist1+/− mice with craniosynostosis. These findings have significant potential clinical value.
Surgical correction of craniosynostosis is routinely performed within the first year of life. Whole-vault cranioplasty and endoscopic synostectomy followed by skull molding helmet therapy are the most common treatments currently (Brooks et al., 2018). However, these procedures are invasive and are associated with resynostosis and other complications. An improved treatment option is needed to ensure long-term quality of life for these young patients. Our successful MSC-based suture regeneration depends on a uniquely modified GelMA (M-GM) scaffold that is biocompatible with Gli1+ MSCs, biodegradable, and provides excellent support for suture regeneration. Our therapeutic strategy regenerates cranial sutures that remain patent for at least one year and continue to function similarly to a natural cranial suture in injury repair and maintaining tissue homeostasis. Our results suggest that MSCs implanted with M-GM present a less invasive and sustainable biological solution for patients with craniosynostosis.
Our studies provide cellular and molecular insights into the cranial suture regeneration and maintenance processes. We have established the importance and inter-dependence of exogenously implanted Gli1+ MSCs and endogenous MSCs derived from the dura mater in cranial suture regeneration in Twist1+/− mice. This is consistent with the crucial role of multipotent progenitors within the dura mater in calvarial tissue homeostasis (Gagan et al., 2007; Kwan et al., 2008; Ogle et al., 2004). MSC grafts can recruit endogenous stem cells to regeneration sites (Xing et al., 2014), likely facilitated by Wnt3a, PDGF, and VEGF (Shin and Peterson, 2013). At the molecular level, haploinsufficiency of Twist1 leads to compromised Axin2 and elevated Wnt signaling (Yu et al., 2005). Implantation of exogenous MSCs restored Wnt signaling to a level comparable to control samples, preventing resynostosis. Furthermore, our data show that Twist1’s postnatal functions are not essential, as loss of Twist1 in Gli1+ MSCs does not lead to craniosynostosis in adult mice. This result also partially explains how implanted MSCs, along with recruited endogenous Gli1+ MSCs, can regenerate a patent cranial suture despite haploinsufficiency of Twist1. Collectively, our findings suggest that implanted MSCs establish a conducive niche into which there is dynamic recruitment and integration of endogenous MSCs to support the regeneration of a functional and sustainable cranial suture.
One major discovery is that restoration of suture patency not only rescues skull deformity but also normalizes ICP and restores neurocognitive function. Patients with craniosynostosis often have learning disabilities (Kilcoyne et al., 2019; Twigg and Wilkie, 2015; Zechi-Ceide et al., 20l2). Non-syndromic craniosynostosis affecting different cranial sutures may have differential effects on neurocognitive function (Sun et al., 2019). Our suture regeneration approach rescued several behavioral abnormalities in Twist1+/− mice, including deficits in novel object recognition, sociability, and social novelty. Our studies suggest that elevated ICP causes, at least in part, neurocognitive dysfunctions which are rescued by suture regeneration in Twist1+/− mice with craniosynostosis. Our MRI and histological studies indicate that changes in neural numbers and brain volume contribute to neurocognitive dysfunctions in Twist1+/− mice, and these changes are restored following suture regeneration. Our studies provide important insights into the mechanisms underlying improvement of neurocognitive functions by suture regeneration. Twist1 is not expressed in the adult mouse brain and Twist1+/− mice without craniosynostosis have normal ICP and neurocognitive function, suggesting that Twist1 does not have a direct role in regulating the development and function of brain structures. In humans, however, TWIST1 is expressed in the cerebral cortex during fetal development and upper layer excitatory neurons in adults (Sousa et al., 2017; Zhu et al., 2018). Future studies will elucidate the molecular mediators or neural circuits leading to the selective cognitive dysfunctions and restorations in different synostosis models.
In summary, our study demonstrates that MSCs combined with M-GM can regenerate a cranial suture, restore normal ICP, and rescue neurocognitive function in a highly clinically relevant craniosynostosis model. For clinical implementation of this approach, there are still challenges, such as identifying the optimal timing of surgery and the ideal source and dosage of MSCs, that will need to be investigated further in order to maximize therapeutic efficacy. Nevertheless, our cranial suture regeneration approach offers an effective and less invasive treatment option for craniosynostosis, bringing new hope for patients who suffer from this devastating disease.
STAR Methods
RESOURCE AVAILABILITY
Lead Contact
Additional information and requests for resources and reagents should be directed to and will be fulfilled in a timely fashion by the Lead Contact, Yang Chai (ychai@usc.edu).
Materials Availability
Twist1+/− and Twist1fl/fl mice are available upon request, subject to approval from the laboratory where these mice were originally generated, and may require a Materials Transfer Agreement. This study did not generate new unique reagents.
Data and Code Availability
RNA sequencing data from seven-month-old control (WT), Twist1+/− mice (MUT), and Twist1+/− mice at six months post-surgery (suture regeneration group, REG) have been deposited at GEO (GSE155562) [NCBI tracking system #21160175].
EXPERIMENTAL MODEL AND SUBJECT DETAILS
Animals
Twist1+/− and Twist1fl/fl mice were obtained from Dr. Robert Maxson (University of Southern California; Chen and Behringer, 1995; Bildsoeet al., 2009). The following strains were purchased from the Jackson Laboratory: Gli1-CreERT2 (JAX no. 007913), ROSA26LoxP-STOP-LoxP-tdTomato (JAX no. 007905), CAG-EGFP (JAX no. 006567), ROSA26LoxP-STOP-LoxP-eGFP-DTA (JAX no. 006331), and C57BL/6J (JAX no. 000664). For the aged group, mice of both sexes were purchased at about six months of age, and the younger group were two months of age. Mouse experiments were approved by the University of Southern California Institutional Animal Care and Use Committee and performed following the regulations for animal experiments. All mice were housed under a 12 h light/dark cycle in pathogen-free conditions with free access to food and water, in accordance with the Guide for Care and Use of Laboratory Animals of the National Institutes of Health. All mice used in our study were healthy and were not involved in previous procedures. All the mice were identified by ear tags. Ear biopsies were lysed at 55 ° overnight in DirectPCR solution (Viagen, 102-T) followed by 85 ° heat inactivation for 1 hour and PCR-based genotyping (GoTaq Green Master Mix, Promega, and C1000 Touch Cycler, Bio-rad). Mice were euthanized by carbon dioxide overdose and then decapitation.
For all experiments, mice of both sexes were used. For the experiments in Figures 1 and S1, two-month-old C57BL/6J mice and Twist1+/− mice were used for ICP and behavioral assays, and one-month-old C57BL/6J mice were used for in situ hybridization of Twist1. For the experiments in Figures 2-4 and S2H-S2L, S3E-S3J, surgeries were performed on Twist1+/− mice with bilateral coronal suture fusion at one month of age. Fusion was assessed prior to surgery by live micro-CT (Figures S3K-S3N). For experiments in Figures 4F-4K, a second calvarial defect was made on both sides of the parietal bones six months after suture regeneration in the same Twist1+/− mice. For experiments in Figures 4L-4S, suture and bone transplants were obtained from CAG-GFP;Twist1+/− mice six months after suture regeneration and transplanted into one-month-old Twist1+/− mice with bilateral coronal suture fusion. For the experiments in Figures 5-7, S5, and S6G, the suture regeneration surgeries were performed on Twist1+/− mice at about two weeks of age after scanning with micro-CT to confirm bilateral coronal suture fusion. For the experiments in Figures S6A-S6F, the suture regeneration surgeries were performed on Twist1+/− mice with bilateral coronal suture fusion at about two months of age. For the experiments in Figure S7, two-month-old C57BL/6J mice with defect-producing surgeries at two weeks of age were used as the sham-operated group. Cells from one-month-old C57BL/6J mice were used for 2, 3-D culturing (Figures S2E-S2G) and Western blot (Figures S4A, S4B). One-month-old Gli1-CreERT2;ROSA26LoxP-STOP-LoxP-tdTomato or Gli1-CreERT2;ROSA26LoxP-STOP-LoxP-DTA GFP mice were used for cell acquisition and surgery one day post-tamoxifen induction (Figures S3A-S3D). For experiments in Figure S3P, one-month-old Gli1-CreERT2;Twist1fl/fl mice were induced with tamoxifen and the coronal suture was collected one month post-induction. Tamoxifen (Sigma, T5648) was suspended in corn oil (Sigma, C8267) at 20 mg/ml and 1.5 mg/10 g body weight was injected intraperitoneally (i.p.) daily for 2 days.
Cell culture, sorting and colony-forming assay
The suture mesenchymal cells were harvested as shown in previous studies (James et al., 2008). Briefly, sagittal and coronal sutures of one-month-old wild type, Gli1-CreERT2;ROSA26LoxP-STOP-LoxP-tdTomato or Gli1-CreERT2;ROSA26LoxP-STOP-LoxP-eGFP-DTA mice were meticulously excised within 0.5 mm of abutting bones on both sides under a dissecting microscope (Leica, M60), while great care was taken to exclude tissue from the posterofrontal and lambdoid sutures. The overlying periosteum and underlying dura mater were removed carefully. The suture tissues were then washed with PBS and αMEM with 100 U/ml penicillin and 100 μg/ml streptomycin several times and were minced into tiny pieces and transferred into a T25 dish (Nest, 705001) at 37 ° in an atmosphere of 5% carbon dioxide. Our cell culture medium was formulated following an established protocol for mouse MSCs (Liu et al., 2011) and contained αMEM (Gibco, 2065542) supplemented with 20% FBS (Gibco, 2100184), 2 mM L-glutamine (Contained in antibiotics), 55 μM 2-mercaptoethanol (Gibco, 2090354), 100 U/ml penicillin and 100 μg/ml streptomycin (Gibco, 2019321). After 5-6 days, cells were digested with TrypLE (Gibco, 1897328) and the tissues were removed by passing through a 70 μm cell strainer (Falcon, 352350), then the cells were incubated for another 3-4 days before use.
P1 cultured suture mesenchymal cells from Gli1-CreERT2;ROSA26LoxP-STOP-LoxP-tdTomato mice were dissociated by TrypLE and resuspended in 500-1000 μl medium. Cells were then filtered with a 40 μm cell strainer (Falcon, 352340) to remove the remaining cell mass and sorted for tdTomato+ cells via flow cytometry in a FACS Aria system using FACS Diva software. After sorting, the tdTomato+ cells were centrifuged for colony-forming assay and suture regeneration. After 7 days, the 24-well culture plates (seeded with 2500 tdTomato+ cells/well) were stained overnight with a mixture solution of 0.1% toluidine blue and 2% paraformaldehyde.
METHOD DETAILS
Intracranial pressure measurement
Intracranial pressure was measured in two-month-old wild type and Twist1+/− mice with bilateral suture fusion and six months after coronal suture regeneration surgery at two weeks of age or four and a half months after surgery at two months of age. The procedure was performed as described previously (Murtha et al., 2012) with minor modifications. Briefly, mice were anaesthetized with 2% isoflurane and placed in a stereotaxic setup. A hole was drilled into the right parietal bone that was 2 mm lateral and 2 mm posterior from the Bregma. A 10 μl pipette tip (cut to 5 mm in length) used as the sensor guide was inserted into the hole and fixed with dental cement. After the dental cement dried, the sensor guide was filled with sterile PBS and the fiber-optic intracranial pressure probe (FISO Technologies) was inserted until the tip of the probe touched the dura. Caulking material was applied around the probe and the head of the sensor guide to form an airtight seal. Intracranial pressure was recorded with Evolution software (FISO Technologies).
Behavioral assays
Behavioral characterization of wild type and Twist1+/− mice with bilateral suture fusion was carried out at 8-12 weeks of age. As for suture regenerated mice, behavioral assays were performed six months after coronal suture regeneration surgery at two weeks of age or four and a half months after surgery at two months of age; age-matched wild type and Twist1+/− mice with bilateral suture fusion were also tested. In all experiments, mice were acclimated to the behavior room at least 60 minutes before the first trial began. Experimenters were blinded to animal genotypes during behavioral tests and data analyses.
Novel object test: This test was performed as described previously (Leger et al., 2013) with minor modifications. Briefly, this test consists of habituation, familiarization, and test phases. In the habituation phase, subject mice were placed in the center of a clean, empty cage and allowed to explore freely for 5 min. After 24 hours, the familiarization phase was performed. Two identical objects were taped to floor along the long axis, 10 cm away from the south and north walls. The mouse was placed in the center of the cage facing the east or west wall and allowed to explore for 10 min. The test phase was performed 3 or 24 hours after the familiarization phase. One of the identical objects was replaced with a novel object with a different shape but similar size. The mouse was placed in the center of the cage facing the east or west wall and allowed to explore for 10 min. The apparatus and objects were thoroughly cleaned with 75% ethanol to remove the olfactory cues between each trial. The entire test phase was videotaped and the travel of the subject mouse was manually documented. The preference index was calculated as (Tn − Tf)/(Tn + Tf) × 100%, where Tn and Tf represent the time spent exploring novel and familiar objects, respectively.
Three-Chamber Social Interaction Test: The test apparatus was a Plexiglas box containing three compartments connected by small openings that allow the mice free access to each compartment. The subject mouse was first placed in the middle chamber with the side doors closed for 5 min, after which the doors were opened to allow the mouse to explore the three empty chambers. After 10 min of habituation, the mouse was gently guided to the middle chamber and side doors were closed. A stranger mouse was placed in an inverted wire cup in one side chamber and an empty wire cup was placed in the other side chamber. Then the side doors were opened and the subject mouse was allowed to freely explore the chambers for 10 min. After this period, the subject mouse was again guided to the middle chamber and the doors were closed. A second stranger mouse was placed in the previously empty wire cup. The side doors were opened, and the subject mouse was allowed to freely explore for another 10 min. The amount of time that the subject mouse spent sniffing each wire cup was quantified and the preference index was calculated as (Ts1 − Te)/(Ts1 + Te) × 100% and (Ts2 − Ts1)/(Ts2 + Ts1) × 100%. Here, Te, Ts1 and Ts2 represent the time spent exploring the empty, Stranger 1 and Stranger 2 wire cups, respectively. The apparatus and wire cups were thoroughly cleaned with 75% ethanol to remove the olfactory cues between tests for each mouse.
Rotarod test: The rotarod test consists of training and test phases. Mice were first trained by placing them on a rotating rod (Panlab, Havard Apparatus) at a constant speed of 4 rpm until they were able to stay on the rotating rod for 60 seconds. The test phase was performed 24 hours after the training phase. The rotarod apparatus was set to accelerate from 4 to 40 rpm in 300 seconds, and mice were placed on the rod initially rotating at 4 rpm. The latency (time) to falling off the rod was determined. Each mouse was tested three times a day at 15 min intervals for four consecutive days.
Open field: The subject mouse was placed in an empty arena (40 cm × 40 cm) and allowed to freely explore for 15 min. The total traveled distance and time spent in the center zone were recorded and automatically measured using Smart v3.0 (Panlab, Havard Apparatus). The arena was thoroughly cleaned with 75% ethanol between tests for each mouse.
Forelimb grip strength test: This test was performed as described previously (Cabe et al., 1978; Smith et al., 1995). A Grip Strength Meter (Bioseb, BIO-GS3) was used to measure the forelimb grip strength. The gauge was reset and stabilized to 0 g before testing each mouse. A mouse was allowed to grasp the bar mounted on the force gauge and the mouse’s tail was slowly pulled back. The peak pull force in grams was recorded on a digital force transducer.
Elevated plus maze test: This test was performed as described previously (Holmes et al., 2002a, 2002b) with minor modifications. Briefly, the elevated plus maze apparatus (Panlab, Havard Apparatus) consisted of two open arms and two closed arms (29.5 × 6 cm). The entire maze was elevated 40 cm from the floor. Mice were individually placed in the center of the maze, facing towards the open arm, and allowed to freely explore the apparatus for 10 min. The open and closed arm entries (all four paws in an arm) and the time spent in the open arms were recorded using Smart v3.0 (Panlab, Havard Apparatus).
Odor discrimination and habituation test: This test was performed as described previously (Arbuckle et al., 2015) with minor modifications. Each mouse was habituated for one hour to a clean new cage before test. Then the animal was presented five odors in a row delivered on cotton swabs in the following order: water, almond flavor, banana flavor, social odor 1 and social odor 2. The almond and banana odors were prepared by diluting almond and citrus extracts (McCormick) in distilled water (1:100). Each social odor was prepared by wiping a cotton swab for 15 s in a zigzag fashion across the bottom of dirty cage which was used to keep mice of the same sex as the test subject. Each odor was presented three times in a row for 2 min each time with approximately 1 min inter-trial interval. For every non-social odor exposure, the cotton swab was freshly prepared by applying 50 μl of diluted odorant. The cumulative time spent sniffing the odor (the animal’s nose was oriented towards the cotton tip at a distance less than 2 cm) was manually recorded.
Gel synthesis and testing
Methacrylated gelatin (GelMA) was synthesized as in the previously described (Van Den Bulcke et al., 2000). Briefly, methacrylic anhydride (MA) was added at a rate of 0.4~0.5 ml/min to a 10% gelatin/PBS (w/v) solution at pH 9 under stirring, to achieve a final MA-to-gelatin ratio of 0.3 ml/g. After allowing the reaction to proceed at 50 ° for 2.5~3 h, the reacted solution was dialyzed against distilled water at 40 ° for 7 days to remove the excessive methacrylic acid and anhydride, then filtered through a 0.22 μm membrane, freeze-dried and stored at −80 ° for later use. The substitution degree of GelMA was measured as described previously (Habeeb, 1966), and was found to be approximately 48%. The freeze-dried GelMA was dissolved in αMEM at 5% (w/v) containing 0.5% (w/v) lithium phenyl-2, 4, 6-trimethylbenzoylphosphinate (LAP) to obtain a solution. The GelMA was modified (creating what we refer to here as modified GelMA, or M-GM) by mixing 5% GelMA solution with Matrigel (Corning, 8015323) and 3 mg/mL collagen I (Gibco, A10483-01) at 4 ° with a volume ratio of 10: 2: 1. The M-GM solution was cured with a 365 nm UV light source for few seconds to completely crosslink the hydrogels. Concentration-matched (1) pure GelMA, (2) GelMA:Matrigel at a ratio of 5:1 (creating what we refer to here as GM-Ma), (3) GelMA:Matrigel at 2:1, (4) GelMA: Matrigel at 1:1, (5) GelMA:Matrigel at 1:2, and (6) pure Matrigel were also tested.
Mechanical properties: The mechanical properties of gels were characterized by compression and uniaxial tensile tests using a dynamic mechanical analysis instrument (Instron 5542, Instron, Norwood, MA). For unconfined compression tests, the hydrogels were cured in disks (3 mm thick, diameter as 12 mm) by being exposed to 365 nm UV light (1 W/cm2) for 2 min. Each sample was placed between two compression plates and compressed at a displacement rate of 1 mm/min. The samples were cut into 2 × 4 × 5 mm3 strips after photo-cross-linking and stretched at a rate of 1 mm/min to explore the tensile properties. The compression modulus and Young’s modulus were calculated as the slope of the linear region in the 0-10% strain range of the stress-strain curves.
Degradation: The natural degradation properties of the hydrogels were determined in PBS at 37 ° for 1, 2, 3, and 4 weeks. At each time point, remaining hydrogel was washed with distilled water, all liquid was removed and gels were lyophilized. The original dry weight was denoted Wo and the dry weight after incubation was Wd. The extent of degradation was determined gravimetrically as the percent weight loss according to following equation: Remaining weight (%) = (Wo - Wd)/Wd × 100.
Diffusion properties: FRAP measurements were performed using confocal laser scanning microscopy (Leica SP8, Germany) to analyze diffusion properties of solutes within the gels as previously reported (Kang et al., 2012; Kaemmerer et al., 2014). Briefly, the gels were loaded with 1 mg/ml FITC-BSA (Invitrogen, A23015). The half time of recovery (τ1/2) and diffusion coefficient were calculated from the experimental recovery curve by fitting of the appropriate FRAP model. All FRAP analyses were performed with MatlabR2019b (Mathworks, Natick, MA, USA). A circular bleach area with a diameter of 50 μm was used throughout all FRAP recordings.
Swelling test: All the gels were photo-cross-linked into a disk shape (thickness = 1 mm, diameter = 12 mm). Then, the gel disks with different compositions were immersed into 2 ml of PBS at 37 °C for 24 h to reach equilibrium swelling. After being removed from PBS, the gel disks were gently blotted with a Kimwipe to remove the residual liquid, and the swollen weight of each disk was recorded (Ws). The samples were subsequently lyophilized and weighed again to determine the dry weight of each disk (Wd). The swelling ratio was then calculated as Q = (Ws - Wd)/Wd.
Morphology and viability of cells in hydrogels
To characterize the cell morphology in hydrogels, the P1 cultured suture mesenchymal cells were gently mixed with the hydrogel (5×10⁵ cells/ml) until uniform and cured with UV light. After 1 or 5 days, samples were fixed with 2.5% glutaraldehyde overnight, washed with PBS three times and fixed with 1% OsO4 for 1 h. After three more washes, they were dehydrated by a graded series of ethanol (30%, 50%, 70%, 80%, 90%, 95%) for 15 min each and 100% ethanol twice for 20 min each, then transferred to isoamyl acetate twice for 15 min each time. Finally, the samples were carefully moved to a critical point dryer (Leica EM CPD300, Germany) for dehydration. The cross-sections of the samples were exposed and coated with Au/Pd using a sputter coater (Leica EM ACE600, Germany), while the morphology of cells inside the hydrogels was observed using scanning electron microscopy (Nova Nano SEM450, FEI, America).
Cellular viability was detected with a live/dead staining kit (Invitrogen, MP 34958). Briefly, suture mesenchymal cells from sagittal and coronal sutures of one-month-old wild type mice were mixed with hydrogel at a density of 5×10⁵ cells/ml, cured as above, and cultured in αMEM-based medium as described above for 1 or 5 days. Then, the samples were stained with calcein-AM and ethidium homodimer-1 for 30 min. Images were obtained on a Zeiss LSM 710 inverted confocal microscope with a scanning thickness of 3 μm for each layer. The overlaid 2D pictures were analyzed using Leica LAS AF software.
Calvarial defect generation
One-month-old, two-month-old, or two-week-old Twist1+/− mice with bilateral coronal suture fusion were chosen for surgery after confirming the fusion via CT scanning. A midline sagittal incision was made on the calvaria under general anesthesia, and the bilateral coronal sutures and the surrounding bones were exposed by elevating the scalp. The overlying periosteum was removed carefully from the exposed area by curette. Then a dental round burr (Brasseler, H52.11. 003) was used to create a rectangular defect with 0.3-0.4 mm width by referencing the residual hallmark of the fused suture (white arrowheads in Figures 2A, 2C, 2D) and the landmark for a normal coronal suture (BRG and SQU in Figures S4D-S4F), while carefully avoiding damage to the underlying dura mater. A strip of bone 0.3-0.4 mm wide was preserved between the defect and the sagittal suture. Three types of cells (tdTomato+ cells, heat-inactivated tdTomato+ cells, and cells from Gli1-CreERT2;ROSA26LoxP-STOP-LoxP-eGFP-DTA mice) were uniformly mixed with M-GM at a density of 5×10⁷ cells/ml and 2 μl of the solution was added to the defect. As controls, tdTomato+ cells were mixed with pure GelMA, GM-Ma or Matrigel on ice and then transferred to the defect, or defects were filled with pure M-GM or left empty. All the groups with M-GM were then cured with UV light with a wavelength of 365 nm for a few seconds. The scalp was then sutured closed with 5.0 polyglactin stitches (Figures S3A-S3D).
Suture width: Each calvarial defect was measured six months after surgery to determine the width of the regenerated sutures, and age-matched wild type mice were used as a control. The distance between the two bones was calculated as the width of the suture, and three points along each suture were selected (the most medial, the most lateral and the middle points of each coronal suture). All measurements were included in the analysis.
Dura mater blocking
After a defect of 0.3-0.4 mm width was generated as above, a Parafilm membrane with 10 nm diameter pores (Thermo Fisher Scientific) was carefully placed between the internal surface of calvaria and the dura mater, while carefully avoiding damage to the dura. Then the defects were filled with M-GM+cells and cured by UV light as outlined above. The calvarial bone together with Parafilm membrane was harvested six weeks later.
Kidney capsule transplantation
We implanted M-GM plus MSCs into the calvarial bone of Twist1+/− mice following the removal of the fused coronal suture. One day after this suture regeneration procedure, we removed a 2 mm × 2 mm square area of bone containing M-GM and MSCs. Then we carefully removed the periosteum and dura mater while protecting the M-GM and donor MSCs under a microscope. The explant was then grafted under the kidney capsule of a host mouse as previously described (Xu et al., 2005). The explant was harvested after six weeks.
MicroCT imaging
The calvarial bones and kidney capsules containing calvarial explants were radiographed in live mice using a micro-CT (Ct Lab In-vivo 90) device. Images were collected using a 70 KVp and 114 μA X-ray source. All the 3D reconstructions and sections were analyzed using AVIZO 9.4.0 (Thermo Fisher Scientific).
Immunofluorescence staining and in situ hybridization (ISH)
Suture samples were fixed with 4% paraformaldehyde (PFA) in PBS overnight at 4 °, followed by decalcification in EDTA for about 2 weeks, dehydration with a graded sucrose solutions (15% and 30% sucrose for 2 hours each at room temperature, and 30% sucrose with 50% OCT overnight at 4 °) and immediately embedded in OCT (Sakura Finetek, 4583). Frozen tissue blocks were sectioned at 8 μm on a cryostat (Leica) and mounted on SuperFrost Plus slides (Fisher) for staining.
For brain sample sectioning, animals were intracranially perfused with PBS and 4% PFA, and the brain was dissected out, post-fixed with 4% PFA overnight at 4 °, and dehydrated in 30% sucrose solution for 2 days. The dehydrated samples were embedded in OCT and sectioned at 40 μm on a cryostat (Leica).
Sections were permeabilized with blocking buffer containing 1% BSA, 2% goat serum and 0.3% TritonX-100 in PBS for 1 h at room temperature and then incubated with the following primary antibodies: anti-Gli1 (Novus Biological NBP1-78259, 1:20), anti-Runx2 (Cell signaling technology 12556, 1:100), anti-Sp7 (Abcam ab22552, 1:100), anti-FABP4, anti-Collagen II, anti-Osteopontin (R&D systems SC010, 10μg/ml), anti-Cux1 (Santa Cruz Biotechnology SC514008, 1:200), anti-Ctip2 (Abcam ab18465, 1:200), anti-Tbr1 (Abcam ab31940, 1:200), or anti-c-Fos (Cell Signaling Technology 2250, 1:400) overnight at 4 °. The following day, sections were incubated with fluorescently conjugated secondary antibodies: Alexa Fluor 488 goat anti-rabbit IgG (Invitrogen A11008, 1:150), Alexa Fluor 488 donkey anti-goat IgG (Invitrogen A32814, 1:150), Alexa Fluor 488 donkey anti-sheep IgG (Invitrogen A11015, 1:150), Alexa Fluor 647 donkey anti-rabbit IgG (Invitrogen A32795, 1:150) or Alexa Fluor 488 goat anti-chicken IgG (Invitrogen A11039, 1:150) together with DAPI (Thermo Fisher Scientific 62248, 1:1000) for 1 h at room temperature and mounted with Vectashield mounting medium (H-1000, Vector Laboratories). Images were captured by a Leica DMI3000 B fluorescence microscope and a Leica DMI6000 CS confocal microscope using Leica LAS AF software.
To observe the source of Gli1+ cells in regenerated sutures, the dura mater right under the coronal suture defect region was labeled very carefully using a Qtracker Cell Labeling kit (Thermo Fisher Scientific, Q25041MP), avoiding surrounding tissues. After staining for 30 min, excess was washed off with PBS, and then the defects were filled with M-GM+MSCs or left empty as mentioned above.
The expression of Twist1 in the brain and coronal suture of one-month-old wild type mice was assayed using an RNAscope 2.5 HD Chromogenic Assay (Single-plex, Advanced Cell Diagnostics). Sections were acquired as mentioned above, after which ISH was performed according to the manufacturer’s instructions.
Western blot analysis
Suture mesenchymal cells from one-month-old C57BL/6J mice were cultured with 20 μM Wnt agonist 1 (Selleck, S8178) or 100 nM LY2090314 (Selleck, S7063) for one or two weeks in αMEM. Medium was changed every other day. Total protein was extracted using a solution of loading buffer (Cell Signaling Technology, 7723S), protease inhibitor (Thermo Fisher Scientific, 1861278) and DTT (Cell Signaling Technology, 7723S), then separated by 10% SDS-PAGE and transferred to PVDF membranes (Millipore, ISEQ00005). Membranes were blocked with 5% non-fat dry milk dissolved in TBST for 2 hours at room temperature with gentle shaking, and then incubated with primary antibodies: anti-Runx2 (Cell signaling technology 12556, 1:1000), anti-OPN (Abcam ab63856, 1:500), and anti-βactin (Abcam ab20272, 1:1000) at 4 ° overnight followed by corresponding horseradish-peroxidase (HRP)-conjugated secondary antibodies. Protein expression was detected by Bio-Rad ChemiDoc Touch (Bio-Rad) and intensities of bands were quantitated by Image J software.
RNA sequencing analysis
To determine the differentially expressed genes between seven-month-old C57BL/6J mice (wild type group, WT), seven-month-old Twist1+/− mice (mutant group, MUT), and seven-month-old Twist1+/− mice at six months post-surgery (suture regeneration group, REG), RNA sequencing analysis was performed. After removing the periosteum and dura mater, the coronal sutures of WT and REG groups were excised along with less than 0.2 mm of abutting bone on each side under a microscope. A bone sample of the same size was acquired from the coronal suture region of the MUT group. To acquire endogenous cells (tdTomato-negative) from the REG group, 3 mg/ml collagenase type I (Worthington, LS004194) and 4 mg/ml dispaseII (Roche, 04942078001) were used for 1 hour after mincing the regenerated sutures into tiny pieces. Cells were then filtered with a 40 μm cell strainer (Falcon, 352340) to remove the remaining tissue mass and sorted for tdTomato− cells via flow cytometry in a FACS Aria system using FACS Diva software. RNA was extracted using the RNeasy Micro Kit (Qiagen, 74004). The quality of RNA samples was determined using an Agilent 2100 Bioanalyzer and all groups had RNA integrity (RIN) numbers > 7.0. cDNA library preparation and sequencing were performed at the University of California, Los Angeles Technology Center for Genomics & Bioinformatics. The paired-end reads with 1×75 bp read length were generated on NextSeq500 High Output equipment for three pairs from each group. Raw reads were trimmed, aligned using Partek Flow with the mm10 genome, and normalized using RPKM. Differential expression was estimated by selecting transcripts with a significance of p < 0.05. A two-way hierarchical clustering heat map using Euclidean distance and average linkage was used to display differentially expressed genes from the three groups.
Confirmation of suture MSC stemness
To assay the multipotential differentiation of the regenerated suture cells, cells from Twist1+/− mice were acquired six months after surgery and cultured following the method described for suture MSCs above. After amplification to sufficient density, the cells were seeded into a 24-well culture plate (Corning, CLS3527) or 15 ml conical tube (Thermo fisher, 362695) and analyzed using a functional identification kit for mouse mesenchymal stem cells (R&D systems, SC010) following the manufacturer’s instructions. Osteogenic, adipogenic, and chondrogenic differentiation were performed according to the manufacturer’s protocol.
Calvarial injury model
A calvarial injury model was established by creating two circular lesions in the parietal bone using a micro-drill; the periosteum was not removed. The lesions were created bilaterally with a size of ~0.8 mm diameter, 1 mm away from the middle of the coronal suture. The left side was left empty to serve as a control while the right side was filled with M-GM plus donor cells six months after the first suture regeneration surgery. Samples were acquired after three months.
Suture transplantation
The suture transplantation surgery was performed as described in our previous work (Zhao et al., 2015). Six months after suture regeneration in CAG-EGFP;Twist1+/− mice with bilateral coronal suture fusion, donor mice were euthanized and a 2 mm × 2 mm square area of bone containing regenerated suture (or for the control group, an equivalent sample of the coronal suture region) was immediately removed under a microscope and kept on ice for later use. The periosteum and dura mater were carefully preserved. One-month-old Twist1+/− mice with bilateral coronal suture fusion were used as the recipient mice. A midline sagittal incision was made over the calvaria under anesthesia, and the coronal suture region and surrounding bones were exposed by elevating the scalp. The periosteum in the fused suture area was carefully removed and a 2.2-2.5 mm defect was made in the fused coronal suture region of both sides using a dental round burr (Brasseler, H52. 11. 003) without damaging the underlying dura mater. The suture transplant was placed over the recipient calvarial defect with the dura side facing inside. The scalp was then sutured closed with 5.0 polyglactin suture. Samples were acquired three months later.
Craniofacial shape analysis
Discriminant function analysis (DFA) was established for 3 groups using MorphoJ 1.07a (Klingenberg, 2011) referencing previous work (Parsons et al., 2014). The groups compared were WT (6.5-month-old C57BL/6J mice), MUT (6.5-month-old Twist1+/− mice with bilateral coronal suture fusion), and REG (6.5-month-old Twist1+/− mice six months after bilateral suture regeneration). The coordinates of each shape were subjected to Procrustes superimposition to place the landmark configurations into a common space using a standard geometric morphometric approach. Subsets of landmarks were used to individually analyze the differences in shape of two distinct regions of the skull (top of calvarium and lateral portion of calvarium). Principal component analysis was used to identify the variation between different groups in both these distinct regions. The landmark subsets are indicated in Figures 6A-6C, and the analysis included a 1,000-round permutation test for Procrustes distance.
MRI analysis
To determine the global and regional brain volume differences between 6.5-month-old C57BL/6J mice (wild type group, WT), 6.5-month-old Twist1+/− mice (mutant group, MUT), and 6.5-month-old Twist1+/− mice at six months post-surgery (suture regeneration group, REG), all mice were anesthetized with 4% isoflurane and intracardially perfused with 30 ml of 0.1 M PBS containing 10 U/ml heparin (Sigma, H3149) and 2 mM ProHance (a Gadolinium contrast agent), followed by 30 ml of 4% paraformaldehyde (PFA) containing 2 mM ProHance. Then the mice were decapitated, and brains with skulls were incubated in 4% PFA + 2 mM ProHance overnight at 4 ° then transferred to 0.1 M PBS containing 2 mM ProHance and 0.02% sodium azide for 10 days before MRI scanning (Gompers et al., 2017). Magnetic resonance images were acquired on a MRSolutions 7 Tesla MRI scanner (Guildford, UK). Three-dimensional anatomical Fast Spin Echo (FSE) images were acquired to encompass the whole brain. Imaging parameters were as follows: TEeffective/TR = 26ms/400ms, 4 averages, echo train length = 4, field of view = 16 mm × 16 mm × 25.6 mm, matrix size = 160 × 256 × 256, and flip angle = 90°. Total acquisition time was 280 minutes.
The brain region-of-interest boundaries were manually drawn for each slice using ImageJ and a mouse brain anatomical atlas (Allen Mouse Brain Atlas). The measured areas for the whole brain, cortical mantle, hippocampus, thalamus, corpus callosum, and cerebellum were multiplied by slice thickness to calculate final volumes (mm3).
For all experiments, the number of replicates is stated in the subsection on Quantification and Statistical Analysis (see below) or in the Results section. For sample-size determination, we performed power calculations, in which a p value less than 0.05 was considered as statistically significant difference. For behavioral analyses, based on our preliminary data we determined that the studies required a sample size of n ≅ 10 per genotype of each sex.
Inclusion and exclusion criteria for mouse behavioral test
Criteria for exclusion of mice were predetermined. A preliminary observation of general health and home cage behaviors was conducted for each mouse. Preliminary inspections were used to exclude grossly abnormal mice including mice that lie immobile, do not react to action challenges, do not look to be thriving, or are severely ill. In the rotarod test, mice that could not maintain on the rotarod after the training session or jumped and escaped from the rod or testing bench area were excluded from the analysis. In the novel object test, mice that had less than 15 seconds of the total sniffing time for both the familiar and novel object were removed from the analysis. In elevated plus maze, mice that made less than three entries into both open and closed arms or fell off of the maze were removed from the analysis. In the open field, three-chamber and odor discrimination/habituation tests, mice that did not engage in the tested behaviors throughout the entire period of behavioral testing were excluded from the analysis.
QUANTIFICATION AND STATISTICAL ANALYSIS
Statistics and reproducibility
SPSS software version 26.0 was used for statistical analysis. Significance was assessed by using independent two-tailed Student’s t-tests or analysis of variance (ANOVA). P values equal to or lower than 0.05 were considered statistically significant. All of the statistical details of the experiments can be found in the figure legends. Figures S2A-S2D, S2M-S2P and S4A, S4B show three replicates with independent gels/cells. The experiments in Figures 4E and S2E-S2G were repeated five times with independent cells. Figures S3K-S3N show representative data from over 200 Twist1+/− mice. Figures 2G-2R, and S3E-S3G show representative data from 10-15 independent experiments. Figures 3A-3H, 4F-4S, and S1A, S2H-S2L (three points for each sample), S3H-S3J, and S3O, S3P, show representative data from 5 independent experiments. Each experiment (WT, REG, MUT) in Figures 4A-4D and S4C was repeated three times with sutures/endogenous cells from regenerated sutures/bones from five mice per group. The numbers of mice used in Figures 1, 5-7, S1B-S1I, and S5-S7 are shown in the figure legends. No methods were used to determine whether the data met assumptions of the statistical approach.
Supplementary Material
Figure S1. Analyses of Twist1 expression, cognitive and motor learning-related behavior in adult mice. Related to Figure 1
Twist1 is expressed in the cranial suture mesenchyme but is absent from the brain in adult mice. Cognitive- and motor learning-related behavioral deficits of Twist1+/− mice are not sex-biased.
(A) In situ hybridization of Twist1 gene transcripts of WT brain (left) and coronal suture (right) of one-month-old C57BL/6J mice. Red signal indicates positive Twist1 expression.
(B-D) Preference indices for novel object (B), sociability (C) and social novelty (D) during the three-chamber test.
(E) Rotarod performance scored as time on the rotarod.
(F, G) Total traveled distance (F) and time spent in the center area (G) during the open field test (Male, n=7; Female, n=11 mice).
(H, I) Total traveled distance (H) and time spent in the center area (I) during the open field test (WT, n=20; Mut, n=20 mice).
Data are mean ± s.e.m. (A-J).*P < 0.05, ****P < 0.0001, NS, not significant calculated by two-tailed unpaired t-test.
Figure S2. GelMA:Matrigel:Col-I at a ratio of 10:2:1 (M-GM) provides a suitable material for suture regeneration. Related to STAR Methods
(A-D) Material properties of (1) pure GelMA (5:0), (2) GelMA:Matrigel at a ratio of 5:1, (3) GelMA:Matrigel at 2:1, (4) GelMA:Matrigel at 1:1, (5) GelMA:Matrigel at 1:2, and (6) pure Matrigel, including compressive modulus (A), degradation rate (B), diffusional permeability (C), and mass swelling ratio (D). Data are expressed as mean ± s.e.m.,*P < 0.05, **P < 0.01, not significant calculated by one-way ANOVA with Tukey post hoc test.
(E) Toluidine blue staining for colony-forming assay of Gli1+ cells cultured 7 days in vitro. Scale bar, 2 mm.
(F) Morphology of cells in pure GelMA (GM) (left), GelMA:Matrigelas 5:1 (GM-Ma) (middle), and M-GM (right) assessed by SEM 1 and 5 days after culturing. Arrowheads indicate pseudopodia. Scale bar, 10 μm in upper panel; 5 μm in lower panel.
(G) Cellular viability detected with live/dead staining kit after 3-D culturing for 1 and 5 days in GM (left), GM-Ma (middle), and M-GM (right). Immunocytochemistry with Calcein-AM (green) for living cells, Ethidium Homodimer-1 (red) for dead cells. Scale bar, 200 μm.
(H-K) Representative microCT images (upper panel, 3-D reconstruction; lower panel, slice) of GM plus suture MSCs (GM+SCs; H), GM-Ma plus suture MSCs (GM-Ma+SCs; I), M-GM plus suture MSCs (M-GM+SCs; J) at six months post-surgery, and the coronal suture of seven-month-old control (K). Dotted lines (white) outline the original surgical defects. Scale bar, 200 μm.
(L) Quantification of suture width (H-K). Data are expressed as mean ± s.e.m. (L). ****P < 0.0001, calculated by one-way ANOVA with Tukey post hoc tests.
(M-P) Comparison of material properties of GM-Ma (5:1) and M-GM (5:1:0.5): compressive modulus/tensile strength (M), degradation rate (N), diffusional permeability (O), and mass swelling ratio (P). Data are expressed as mean ± s.e.m., not significant calculated by two-tailed unpaired t-test.
Figure S3. Schematic of suture regeneration. Gli1+ cells and M-GM are required for long-term suture patency. Twist1+/− mice show coronal suture fusion with variations. Twist1 in coronal suture of adult mice. Related to Figure 2
Schematic of suture regeneration surgery
(A) One-month-old Gli1-CreERT2;ROSA26LoxP-STOP-LoxP-tdTomato mice after two days of injection with tamoxifen.
(B) Coronal and sagittal sutures were excised from the mice and minced into tiny pieces for cell culture.
(C) After 10 days of expansion in vitro, tdTomato+ cells were acquired from suture mesenchymal cells by cell sorting.
(D) After generating defects in the region of the fused sutures, cells mixed with carrier gel biomaterial was placed in the defects and gel was cured with UV light. The wound was then closed carefully.
Implantation of Gli1+ cells and M-GM can maintain long-term suture patency
(E, F) Immunofluorescence staining for blank (A, one and three months post-surgery), and M-GM (F, one, three and six months post-surgery) groups. Scale bar, 100 μm.
(G-J) MicroCT imaging (upper panel), HE (middle panel) and immunofluorescence (lower panel) staining of M-GM+SCs one year post-surgery (G), M-GM plus suture mesenchymal cells from one-month-old Gli1-CreERT2;ROSA26LoxP-STOP-LoxP-eGFP-DTA mice one month post-surgery (M-GM+DTA cells; 1M PS) (H), M-GM plus heat-activated suture MSCs at one month (M-GM+H-SCs; 1M PS) or three months (M-GM+H-SCs; 3M PS) post-surgery (I), matrigel plus Gli1+ MSCs at one month (MG+SCs; 1M PS) or three months (MG+SCs; 3M PS) post-surgery (J). Red fluorescently labeled cells were from one-month-old donor Gli1-CreERT2;tdTfl/+ mice (G, J). Insets show CT slices of different regions. Dotted lines in 3-D reconstructed images outline the initial defects. All other white dotted lines represent boundaries of bones.
Scale bars, 1 mm in insets in (G-J); 2 mm in upper panel of (G-J); 100 μm elsewhere.
Twist1+/− mice show coronal suture fusion with variations
(K-N) 3-D reconstructed microCT images of calvaria of one-month-old Twist1+/− mice with different coronal suture phenotypes: non-fusion (K), partial fusion (L), unilateral fusion (M), and bilateral fusion (N); arrows in (L, M) point to fused sutures. Scale bar, 2 mm.
Twist1 is not required to support suture patency in adult mice
(O) RNAscope of Twist1 (red) in the coronal suture of one-month-old wild type mouse. Scale bar, 100 μm.
(P) 3-D reconstruction (left), microCT slice images (middle), and HE staining (right) of two-month-old Gli1-CreERT2;Twist1fl/fl mice after three days of tamoxifen injection at one month. The arrowhead indicates the coronal suture. White dotted lines indicate boundaries of bones. Scale bars, 2 mm in left, 1 mm in middle and 100 μm in right panel.
Figure S4. Wnt signaling analysis in craniosynostosis and suture regeneration. Landmarks for analyzing head shape. Related to Figures 4 and 5
Wnt signaling is upregulated in craniosynostosis and regenerating suture restores the normal expression of Wnt-related genes
(A) Western blot analyses of Runx2 and OPN expression in suture mesenchymal cells after Wnt activator (Wnt agonist 1) or GSK3 inhibitor (activator of Wnt signaling, LY2090314) treatment for one or two weeks.
(B) Quantification of Runx2 and OPN expression after Wnt agonist 1/LY2090314 or vehicle treatment. Data are expressed as mean ± s.e.m., *P < 0.05, **P < 0.01, ***P < 0.001, ****P < 0.0001, not significant calculated by two-tailed unpaired t-test.
(C) Signatures of Wnt-related genes based on the relative expression levels of WT, MUT, and endogenous cells from REG.
Landmarks for analyzing head shape
(D) Table of landmark descriptions for analyzing head shape.
(E, F) Superior (E) and lateral views (F) of landmark locations.
Figure S5. Analyses of locomotion, grip strength, olfactory function, and anxiety-related behaviors. Related to Figure 6
(A) Representative tracks of the open field test.
(B, C) Total traveled distance (B) and time spent in the center area (C) during the open field test (WT, n=11; MUT, n=12; REG, n=17 mice).
(D) Comparison of grip strength (WT, n=12; MUT, n=11; REG, n=13 mice).
(E-G) Rate of time spent in open arms (E), number of open entries (F) and total entries (G) during elevated plus maze test (WT, n=12; MUT, n=11; REG, n=13 mice).
(H) Schematic of odor discrimination/habituation test.
(I) Time spent sniffing non-social odors (upper left panel) and social odors (upper right panel) during odor discrimination and habituation test. The lower panel shows the total sniffing time per olfactory cue (WT, n=12; MUT, n=11; REG, n=13 mice).
Data are mean ± s.e.m. (B, C, D, E, F, G, I). **P < 0.01, ***P < 0.001, ****P < 0.0001, NS, not significant calculated by one-way ANOVA with Tukey’s test.
Figure S6. Rescue of cognitive and motor learning defects of Twist1+/− mice with craniosynostosis is age dependent. c-Fos expression analysis. Related to Figures 6 and 7
Suture regeneration surgery performed at two months of age fails to rescue cognitive and motor learning defects of Twist1+/− mice with craniosynostosis
(A, D) Representative animal tracks in novel object test (A) and three chamber test (D).
(B, E, F) Preferential indices in novel object test (B), sociability (E) and social novelty (F) in three-chamber test.
(C) Rotarod performance scored as time (seconds) on the rotarod.
WT, wild-type mice, n=10; MUT, Twist1+/− mice with bilateral suture fusion, n=12; REG8 wks, Twist1+/− mice with suture regeneration surgery performed at two months of age, n=13. Data are mean ± s.e.m. (B, C, E, F). *P < 0.05, **P < 0.01, ***P < 0.001, ****P < 0.0001, NS, not significant calculated by one-way ANOVA (B, E, F) with Tukey post hoc tests and two-tailed unpaired t-test (C).
c-Fos expression analysis
(G) c-Fos is activated at an increased level in the prelimbic and perirhinal cortex in Twist1+/− mice, and could be reduced by suture regeneration.
Left panel, schematics of brain coronal sections. Prelimbic cortex (PrL), and perirhinal cortex (PRH) are highlighted with red. The number on the right bottom corner of each panel indicates the distance (mm) from bregma.
Middle panel, representative images of c-Fos expression in PrL (top panel) and PRH (bottom panel). Dotted lines indicate the boundaries of PrL, and PRH. Scale bar, 50 μm.
Right panel, quantification of c-Fos expression in PrL (top panel), and PRH (bottom panel) (WT, n=4; MUT, n=4; REG, n=4 mice). *P < 0.05, **P < 0.01, ***P < 0.001, NS, not significant calculated by one-way ANOVA with Tukey’s post hoc test.
Figure S7. Calvarial injury surgery does not cause elevated ICP or behavioral abnormalities. Related to Figure 6
(A) MicroCT images (3-D reconstruction and slice) for wild type mice at two-weeks-old age before or six weeks post-surgery. Scale bars, 1 mm in inset; 2 mm in (A).
(B) Quantification of ICP values (WT, n=8; Sham, n=7 mice).
(C-E) Preference indices of novel object test (C), sociability (D) and social novelty (E) during the three-chamber test.
(F) Rotarod performance scored as time (seconds) on the rotarod (WT, n=20; Sham, n=18 mice).
(G, H) Total traveled distance (G) and time (seconds) spent in the center area (H) during the open field test (WT, n=20; Sham, n=20 mice).
Data are mean ± s.e.m. (B-H). NS, not significant calculated by two-tailed unpaired t-test.
Highlights:
Twist1+/− craniosynostosis mice exhibit elevated ICP and cognitive deficits.
Suture MSCs and resorbable biomaterials can support regeneration of patent suture.
Suture regeneration normalizes Twist1+/− ICP, skull shape, and cognitive function.
Suture regeneration offers a biological solution for craniosynostosis patients.
Acknowledgements
We thank Dr. Bridget Samuels for critical reading of the manuscript. We thank Drs. Robert Maxson, Pedro Sanchez and Scott Fraser for Twist1+/− and Twist1fl/fl mice and discussion. This study was supported by grants from the National Institute of Dental and Craniofacial Research, National Institute of Health R01 DE026339; R01 DE012711; R01 DE022503; U24 026914 to Y.C. and from the National Institute of Neurological Disorders and Stroke, National Institute of Health R01 NS097231 to J.C.
Footnotes
Publisher's Disclaimer: This is a PDF file of an unedited manuscript that has been accepted for publication. As a service to our customers we are providing this early version of the manuscript. The manuscript will undergo copyediting, typesetting, and review of the resulting proof before it is published in its final form. Please note that during the production process errors may be discovered which could affect the content, and all legal disclaimers that apply to the journal pertain.
Competing financial interests
The authors declare no competing financial interests.
References
- Arbuckle EP, Smith GD, Gomez MC, and Lugo JN (2015). Testing for Odor Discrimination and Habituation in Mice. J. Vis. Exp 99, e52615. [DOI] [PMC free article] [PubMed] [Google Scholar]
- Bellew M, Chumas P, Mueller R, Liddington M, and Russell J (2005). Pre- and postoperative developmental attainment in sagittal synostosis. Arch Dis Child.90, 346–350. [DOI] [PMC free article] [PubMed] [Google Scholar]
- Bildsoe H, Loebel DA, Jones VJ, Chen YT, Behringer RR, and Tam PP (2009). Requirement for Twist1 in frontonasal and skull vault development in the mouse embryo. Dev Biol. 331, 176–188. [DOI] [PubMed] [Google Scholar]
- Blount JP, Louis RG, Tubbs RS, and Grant JH (2007). Pansynostosis: a review. Childs Nerv. Syst 23, 1103–1109. [DOI] [PubMed] [Google Scholar]
- Bord S, Ireland DC, Moffatt P, Thomas GP, and Compston JE (2005). Characterization of osteocrin expression in human bone. J. Histochem. Cytochem 53, 1181–1187. [DOI] [PubMed] [Google Scholar]
- Brooks ED, Beckett JS, Yang J, Timberlake AT, Sun AH, Chuang C, and Persing JA (2018). The Etiology of Neuronal Development in Craniosynostosis: A Working Hypothesis. J. Craniofac. Surg 29, 49–55. [DOI] [PubMed] [Google Scholar]
- Buckley MJ, and Gaffan D (2006). Perirhinal cortical contributions to object perception. Trends Cogn. Sci 10, 100–107. [DOI] [PubMed] [Google Scholar]
- Cabe PA, Tilson HA, Mitchell CL and Dennis R (1978). A simple recording grip strength device. Pharmacol. Biochem. Behav 8, 101–102. [DOI] [PubMed] [Google Scholar]
- Chan CKF, Gulati GS, Sinha R, Tompkins JV, Lopez M, Carter AC, Ransom RC, Reinisch A, Wearda T, Murphy M, et al. (2018). Identification of the Human Skeletal Stem Cell. Cell 175, 43–56 e21. [DOI] [PMC free article] [PubMed] [Google Scholar]
- Chen ZF, and Behringer RR (1995). Twist is required in head mesenchyme for cranial neural tube morphogenesis. Genes Dev. 9, 686–699. [DOI] [PubMed] [Google Scholar]
- Collett BR, Kapp-Simon KA, Wallace E, Cradock MM, Buono L, and Speltz ML (2017). Attention and executive function in children with and without single-suture craniosynostosis. Child Neuropsychol. 23, 83–98. [DOI] [PMC free article] [PubMed] [Google Scholar]
- Cowan CM, Shi YY, Aalami OO, Chou YF, Mari C, Thomas R, Quarto N, Contag CH, Wu B, and Longaker MT (2004). Adipose-derived adult stromal cells heal critical-size mouse calvarial defects. Nat. biotechnol 22, 560–567. [DOI] [PubMed] [Google Scholar]
- Gagan JR, Tholpady SS, and Ogle RC (2007). Cellular dynamics and tissue interactions of the dura mater during head development. Birth defects Res. C. Embryo Today 81, 297–304. [DOI] [PubMed] [Google Scholar]
- Gompers A, Su-Feher L, Ellegood J, Copping NA, Riyadh MA, Stradleigh TW, Pride MC, Schaffler MD, Wade AA, Catta-Preta R, et al. (2017). Germline Chd8 haploinsufficiency alters brain development in mouse. Nat Neurosci. 20, 1062–1073 [DOI] [PMC free article] [PubMed] [Google Scholar]
- Gripp KW, Zackai EH, and Stolle CA (2000). Mutations in the human TWIST gene. Hum. Mutat 15, 479. [DOI] [PubMed] [Google Scholar]
- Guo Y, Yuan Y, Wu L, Ho TV, Jing J, Sugii H, Li J, Han X, Feng J, Guo C, and Chai Y (2018). BMP-IHH-mediated interplay between mesenchymal stem cells and osteoclasts supports calvarial bone homeostasis and repair. Bone Res. 6, 30. [DOI] [PMC free article] [PubMed] [Google Scholar]
- Habeeb AF (1966). Determination of free amino groups in proteins by trinitrobenzenesulfonic acid. Anal.Biochem 14, 328–336. [DOI] [PubMed] [Google Scholar]
- Ho TV, Iwata J, Ho HA, Grimes WC, Park S, Sanchez-Lara PA, and Chai Y (2015). Integration of comprehensive 3D microCT and signaling analysis reveals differential regulatory mechanisms of craniofacial bone development. Dev. Biol 400, 180–190. [DOI] [PMC free article] [PubMed] [Google Scholar]
- Holmes A, Wrenn CC, Harris AP, Thayer K, and Crawley JN (2002a). Behavioral profiles of inbred strains on novel, olfactory, spatial and emotional tests for reference memory in mice. Genes Brain Behav. 1: 55–69. [DOI] [PubMed] [Google Scholar]
- Holmes A, Yang RJ, and Crawley JN (2002b). Evaluation of an anxiety-related phenotype in galanin overexpressing transgenic mice. J. Mol. Neurosci 18: 151–165. [DOI] [PubMed] [Google Scholar]
- James AW, Xu Y, Wang R, and Longaker MT (2008). Proliferation, osteogenic differentiation, and fgf-2 modulation of posterofrontal/sagittal suture-derived mesenchymal cells in vitro. Plast. Reconstr. Surg 122, 53–63. [DOI] [PubMed] [Google Scholar]
- Kabbani H, and Raghuveer TS (2004). Craniosynostosis. Am. Fam. Physician 69, 2863–2870. [PubMed] [Google Scholar]
- Kaemmerer E, Melchels FP, Holzapfel BM, Meckel T, Hutmacher DW, and Loessner D (2014). Gelatinemethacrylamide-based hydrogels: an alternative three-dimensional cancer cell culture system. Acta. Biomater 10, 2551–2562. [DOI] [PubMed] [Google Scholar]
- Kang M, Day CA, Kenworthy AK, and DiBenedetto E (2013). Simplified equation to extract diffusion coefficients from confocal FRAP data. Traffic 13, 1589–1600. [DOI] [PMC free article] [PubMed] [Google Scholar]
- Kilcoyne S, Luscombe C, Scully P, Jayamohan J, Magdum S, Wall S, Johnson D, and Wilkie AOM (2019). Language Development, Hearing Loss, and Intracranial Hypertension in Children With TWIST1-Confirmed Saethre-Chotzen Syndrome. J. Craniofac. Surg 30, 1506–1511. [DOI] [PubMed] [Google Scholar]
- Klingenberg CP (2011). MorphoJ: an integrated software package for geometric morphometrics. Mol. Ecol. Resour 11, 353–357. [DOI] [PubMed] [Google Scholar]
- Krueger F, Barbey AK, and Grafman J (2009). The medial prefrontal cortex mediates social event knowledge. Trends Cogn. Sci 13, 103–109. [DOI] [PubMed] [Google Scholar]
- Kwan MD, Wan DC, Wang Z, Gupta DM, Slater BJ, and Longaker MT (2008). Microarray analysis of the role of regional dura mater in cranial suture fate. Plast. Reconstr. Surg 122, 389–399. [DOI] [PubMed] [Google Scholar]
- Lane LC (1892). Pioneer Craniectomy for Relief of Mental Imbecility Due to Premature Sutural Closure and Microcephalus. JAMA 18, 49–50. [Google Scholar]
- Leger M, Quiedeville A, Bouet V, Haelewyn B, Boulouard M, Schumann-Bard P, and Freret T (2013). Object recognition test in mice. Nat. Protoc 8, 2531–2537. [DOI] [PubMed] [Google Scholar]
- Leone DP, Srinivasan K, Chen B, Alcamo E, and McConnell SK (2008). The determination of projection neuron identity in the developing cerebral cortex. Curr Opin Neurobiol. 18, 28–35. [DOI] [PMC free article] [PubMed] [Google Scholar]
- Liu H, Chen B, and Li Y (2019). microRNA-203 promotes proliferation, differentiation, and migration of osteoblasts by upregulation of Msh homeobox 2. J. Cell Physiol 234, 17639–17648. [DOI] [PubMed] [Google Scholar]
- Liu Y, Wang L, Kikuiri T, Akiyama K, Chen C, Xu X, Yang R, Chen W, Wang S, and Shi S (2011). Mesenchymal stem cell-based tissue regeneration is governed by recipient T lymphocytes via IFN-gamma and TNF-alpha. Nat. Med 17, 1594–1601. [DOI] [PMC free article] [PubMed] [Google Scholar]
- Mao JJ, Giannobile WV, Helms JA, Hollister SJ, Krebsbach PH, Longaker MT, and Shi S (2006). Craniofacial tissue engineering by stem cells. J. Dent. Res 85, 966–979. [DOI] [PMC free article] [PubMed] [Google Scholar]
- Maruyama T, Jeong J, Sheu TJ, and Hsu W (2016). Stem cells of the suture mesenchyme in craniofacial bone development, repair and regeneration. Nat. Commun 7, 10526. [DOI] [PMC free article] [PubMed] [Google Scholar]
- Millichap JG (2015). Cognitive Development of Children with Craniosynostosis. Pediatr. Neurol. Briefs 29, 47. [DOI] [PMC free article] [PubMed] [Google Scholar]
- Molyneaux BJ, Arlotta P, Menezes JR, and Macklis JD (2007).Neuronal subtype specification in the cerebral cortex. Nat Rev Neurosci. 8, 427–437. [DOI] [PubMed] [Google Scholar]
- Morriss-Kay GM, and Wilkie AO (2005). Growth of the normal skull vault and its alteration in craniosynostosis: insights from human genetics and experimental studies. J. Anat 207, 637–653. [DOI] [PMC free article] [PubMed] [Google Scholar]
- Murtha L, McLeod D, and Spratt N (2012). Epidural intracranial pressure measurement in rats using a fiber-optic pressure transducer. J. Vis. Exp 62, e3689. [DOI] [PMC free article] [PubMed] [Google Scholar]
- Noshadi I, Hong S, Sullivan KE, Shirzaei Sani E, Portillo-Lara R, Tamayol A, Shin SR, Gao AE, Stoppel WL, Black LD III, Khademhosseini A, and Annabi N (2017). In vitro and in vivo analysis of visible light crosslinkable gelatin methacryloyl (GelMA) hydrogels. Biomater. Sci 5, 2093–2105. [DOI] [PMC free article] [PubMed] [Google Scholar]
- Ogle RC, Tholpady SS, McGlynn KA, and Ogle RA (2004). Regulation of cranial suture morphogenesis. Cells Tissues Organs 176, 54–66. [DOI] [PubMed] [Google Scholar]
- Park S, Zhao H, Urata M, and Chai Y (2016). Sutures Possess Strong Regenerative Capacity for Calvarial Bone Injury. Stem Cells Dev. 25, 1801–1807. [DOI] [PMC free article] [PubMed] [Google Scholar]
- Parsons TE, Weinberg SM, Khaksarfard K, Howie RN, Elsalanty M, Yu JC, and Cray JJ (2014). Craniofacial shape variation in Twist1+/− mutant mice. Anat. Rec 297, 826–833. [DOI] [PubMed] [Google Scholar]
- Reardon W, Wilkes D, Rutland P, Pulleyn LJ, Malcolm S, Dean JC, Evans RD, Jones BM, Hayward R, Hall CM, et al. (1997). Craniosynostosis associated with FGFR3 pro250arg mutation results in a range of clinical presentations including unisutural sporadic craniosynostosis. J. Med. Genet 34, 632–636. [DOI] [PMC free article] [PubMed] [Google Scholar]
- Renier D, Sainte-Rose C, Marchac D, and Hirsch JF (1982). Intracranial pressure in craniostenosis. J. Neurosurg 57, 370–377. [DOI] [PubMed] [Google Scholar]
- Rinaldi T, Perrodin C, and Markram H (2008). Hyper-connectivity and hyper-plasticity in the medial prefrontal cortex in the valproic Acid animal model of autism. Front. Neural Circuits 2, 4. [DOI] [PMC free article] [PubMed] [Google Scholar]
- Semple BD, Blomgren K, Gimlin K, Ferriero DM, and Noble-Haeusslein LJ (2013). Brain development in rodents and humans: Identifying benchmarks of maturation and vulnerability to injury across species. Prog. Neurobiol 106-107, 1–16. [DOI] [PMC free article] [PubMed] [Google Scholar]
- Shin L, and Peterson DA (2013). Human mesenchymal stem cell grafts enhance normal and impaired wound healing by recruiting existing endogenous tissue stem/progenitor cells. Stem Cells Transl. Med 2, 33–42. [DOI] [PMC free article] [PubMed] [Google Scholar]
- Shim KW, Park EK, Kim JS, Kim YO, and Kim DS (2016). Neurodevelopmental Problems in Non-Syndromic Craniosynostosis. J. Korean Neurosurg. Soc 59, 242–246. [DOI] [PMC free article] [PubMed] [Google Scholar]
- Sidoti EJ Jr., Marsh JL, Marty-Grames L, andNoetzel MJ (1996). Long-term studies of metopic synostosis: frequency of cognitive impairment and behavioral disturbances. Plast. Reconstr. Surg 97, 276–281. [DOI] [PubMed] [Google Scholar]
- Smith JP, Hicks PS, Ortiz LR, Martinez MJ and Mandler RN (1995). Quantitative measurement of muscle strength in the mouse. J. Neurosci. Methods 62, 15–19. [DOI] [PubMed] [Google Scholar]
- Speltz ML, Collett BR, Wallace ER, Starr JR, Cradock MM, Buono L, Cunningham M, and Kapp-Simon K (2015). Intellectual and academic functioning of school-age children with single-suture craniosynostosis. Pediatrics 135, e615–623. [DOI] [PMC free article] [PubMed] [Google Scholar]
- Sun AH, Eilbott J, Chuang C, Yang JF, Brooks ED, Beckett J, Steinbacher DM, Pelphrey K, and Persing JA (2019). An Investigation of Brain Functional Connectivity by Form of Craniosynostosis. J. Craniofac. Surg 30, 1719–1723. [DOI] [PMC free article] [PubMed] [Google Scholar]
- Sousa AMM, Zhu Y, Raghanti MA, Kitchen RR, Onorati M, Tebbenkamp ATN, Stutz B, Meyer KA, Li M, Kawasawa YI, Liu F, et al. , (2017) Molecular and cellular reorganization of neural circuits in the human lineage. Science, 358, 1027–1032. [DOI] [PMC free article] [PubMed] [Google Scholar]
- Twigg SR, and Wilkie AO (2015). A Genetic-Pathophysiological Framework for Craniosynostosis. Am. J. Hum. Genet 97, 359–377. [DOI] [PMC free article] [PubMed] [Google Scholar]
- Van Den Bulcke AI, Bogdanov B, De Rooze N, Schacht EH, Cornelissen M, and Berghmans H (2000). Structural and rheological properties of methacrylamide modified gelatin hydrogels. Biomacromolecules 1, 31–38. [DOI] [PubMed] [Google Scholar]
- Visuomotor Function in School-Age Children with Single-Suture Craniosynostosis. J. Dev. Behav. Pediatr 37, 483–490. [DOI] [PMC free article] [PubMed] [Google Scholar]
- Wallace ER, Collett BR, Kapp-Simon K, Starr JR, Birgfeld C, and Speltz ML (2016). [DOI] [PMC free article] [PubMed] [Google Scholar]
- Wolfswinkel EM, Howell LK, Fahradyan A, Azadgoli B, McComb JG, and Urata MM (2017). Is Postoperative Intensive Care Unit Care Necessary following Cranial Vault Remodeling for Sagittal Synostosis? Plast. Reconstr. Surg 140, 1235–1239. [DOI] [PubMed] [Google Scholar]
- Xing J, Hou T, Jin H, Luo F, Change Z, Li Z, Xie Z, and Xu J (2014). Inflammatory microenvironment changes the secretory profile of mesenchymal stem cells to recruit mesenchymal stem cells. Cell Physiol. Biochem 33, 905–919. [DOI] [PubMed] [Google Scholar]
- Xu X, Bringas P Jr., Soriano P, and Chai Y (2005). PDGFR-alpha signaling is critical for tooth cusp and palate morphogenesis. Dev.Dyn 232, 75–84. [DOI] [PubMed] [Google Scholar]
- Yu HM, Jerchow B, Sheu TJ, Liu B, Costantini F, Puzas JE, Birchmeier W, and Hsu W (2005). The role of Axin2 in calvarial morphogenesis and craniosynostosis. Development 132, 1995–2005. [DOI] [PMC free article] [PubMed] [Google Scholar]
- Zechi-Ceide RM, Rodrigues MG, Jehee FS, Kokitsu-Nakata NM, Passos-Bueno MR, and Guion-Almeida ML (2012). Saethre-Chotzen phenotype with learning disability and hyper IgE phenotype in a patient due to complex chromosomal rearrangement involving chromosomes 3 and 7. Am. J. Med. Genet. A 158A, 1680–1685. [DOI] [PubMed] [Google Scholar]
- Zhao H, and Chai Y (2015). Stem Cells in Teeth and Craniofacial Bones. J. Dent. Res 94, 1495–1501. [DOI] [PMC free article] [PubMed] [Google Scholar]
- Zhao H, Feng J, Ho TV, Grimes W, Urata M, and Chai Y (2015). The suture provides a niche for mesenchymal stem cells of craniofacial bones. Nat. Cell Biol 17, 386–396. [DOI] [PMC free article] [PubMed] [Google Scholar]
- Zhu Y, Sousa AMM, Gao T, Skarica M, Li M, Santpere G, Esteller-Cucala P, Juan D, Ferrández-Peral L, Gulden FO et al. , (2018) Spatiotemporal transcriptomic divergence across human and macaque brain development. Science, 362, published online Epub Dec 14 ( 10.1126/science.aat8077). [DOI] [PMC free article] [PubMed] [Google Scholar]
Associated Data
This section collects any data citations, data availability statements, or supplementary materials included in this article.
Supplementary Materials
Figure S1. Analyses of Twist1 expression, cognitive and motor learning-related behavior in adult mice. Related to Figure 1
Twist1 is expressed in the cranial suture mesenchyme but is absent from the brain in adult mice. Cognitive- and motor learning-related behavioral deficits of Twist1+/− mice are not sex-biased.
(A) In situ hybridization of Twist1 gene transcripts of WT brain (left) and coronal suture (right) of one-month-old C57BL/6J mice. Red signal indicates positive Twist1 expression.
(B-D) Preference indices for novel object (B), sociability (C) and social novelty (D) during the three-chamber test.
(E) Rotarod performance scored as time on the rotarod.
(F, G) Total traveled distance (F) and time spent in the center area (G) during the open field test (Male, n=7; Female, n=11 mice).
(H, I) Total traveled distance (H) and time spent in the center area (I) during the open field test (WT, n=20; Mut, n=20 mice).
Data are mean ± s.e.m. (A-J).*P < 0.05, ****P < 0.0001, NS, not significant calculated by two-tailed unpaired t-test.
Figure S2. GelMA:Matrigel:Col-I at a ratio of 10:2:1 (M-GM) provides a suitable material for suture regeneration. Related to STAR Methods
(A-D) Material properties of (1) pure GelMA (5:0), (2) GelMA:Matrigel at a ratio of 5:1, (3) GelMA:Matrigel at 2:1, (4) GelMA:Matrigel at 1:1, (5) GelMA:Matrigel at 1:2, and (6) pure Matrigel, including compressive modulus (A), degradation rate (B), diffusional permeability (C), and mass swelling ratio (D). Data are expressed as mean ± s.e.m.,*P < 0.05, **P < 0.01, not significant calculated by one-way ANOVA with Tukey post hoc test.
(E) Toluidine blue staining for colony-forming assay of Gli1+ cells cultured 7 days in vitro. Scale bar, 2 mm.
(F) Morphology of cells in pure GelMA (GM) (left), GelMA:Matrigelas 5:1 (GM-Ma) (middle), and M-GM (right) assessed by SEM 1 and 5 days after culturing. Arrowheads indicate pseudopodia. Scale bar, 10 μm in upper panel; 5 μm in lower panel.
(G) Cellular viability detected with live/dead staining kit after 3-D culturing for 1 and 5 days in GM (left), GM-Ma (middle), and M-GM (right). Immunocytochemistry with Calcein-AM (green) for living cells, Ethidium Homodimer-1 (red) for dead cells. Scale bar, 200 μm.
(H-K) Representative microCT images (upper panel, 3-D reconstruction; lower panel, slice) of GM plus suture MSCs (GM+SCs; H), GM-Ma plus suture MSCs (GM-Ma+SCs; I), M-GM plus suture MSCs (M-GM+SCs; J) at six months post-surgery, and the coronal suture of seven-month-old control (K). Dotted lines (white) outline the original surgical defects. Scale bar, 200 μm.
(L) Quantification of suture width (H-K). Data are expressed as mean ± s.e.m. (L). ****P < 0.0001, calculated by one-way ANOVA with Tukey post hoc tests.
(M-P) Comparison of material properties of GM-Ma (5:1) and M-GM (5:1:0.5): compressive modulus/tensile strength (M), degradation rate (N), diffusional permeability (O), and mass swelling ratio (P). Data are expressed as mean ± s.e.m., not significant calculated by two-tailed unpaired t-test.
Figure S3. Schematic of suture regeneration. Gli1+ cells and M-GM are required for long-term suture patency. Twist1+/− mice show coronal suture fusion with variations. Twist1 in coronal suture of adult mice. Related to Figure 2
Schematic of suture regeneration surgery
(A) One-month-old Gli1-CreERT2;ROSA26LoxP-STOP-LoxP-tdTomato mice after two days of injection with tamoxifen.
(B) Coronal and sagittal sutures were excised from the mice and minced into tiny pieces for cell culture.
(C) After 10 days of expansion in vitro, tdTomato+ cells were acquired from suture mesenchymal cells by cell sorting.
(D) After generating defects in the region of the fused sutures, cells mixed with carrier gel biomaterial was placed in the defects and gel was cured with UV light. The wound was then closed carefully.
Implantation of Gli1+ cells and M-GM can maintain long-term suture patency
(E, F) Immunofluorescence staining for blank (A, one and three months post-surgery), and M-GM (F, one, three and six months post-surgery) groups. Scale bar, 100 μm.
(G-J) MicroCT imaging (upper panel), HE (middle panel) and immunofluorescence (lower panel) staining of M-GM+SCs one year post-surgery (G), M-GM plus suture mesenchymal cells from one-month-old Gli1-CreERT2;ROSA26LoxP-STOP-LoxP-eGFP-DTA mice one month post-surgery (M-GM+DTA cells; 1M PS) (H), M-GM plus heat-activated suture MSCs at one month (M-GM+H-SCs; 1M PS) or three months (M-GM+H-SCs; 3M PS) post-surgery (I), matrigel plus Gli1+ MSCs at one month (MG+SCs; 1M PS) or three months (MG+SCs; 3M PS) post-surgery (J). Red fluorescently labeled cells were from one-month-old donor Gli1-CreERT2;tdTfl/+ mice (G, J). Insets show CT slices of different regions. Dotted lines in 3-D reconstructed images outline the initial defects. All other white dotted lines represent boundaries of bones.
Scale bars, 1 mm in insets in (G-J); 2 mm in upper panel of (G-J); 100 μm elsewhere.
Twist1+/− mice show coronal suture fusion with variations
(K-N) 3-D reconstructed microCT images of calvaria of one-month-old Twist1+/− mice with different coronal suture phenotypes: non-fusion (K), partial fusion (L), unilateral fusion (M), and bilateral fusion (N); arrows in (L, M) point to fused sutures. Scale bar, 2 mm.
Twist1 is not required to support suture patency in adult mice
(O) RNAscope of Twist1 (red) in the coronal suture of one-month-old wild type mouse. Scale bar, 100 μm.
(P) 3-D reconstruction (left), microCT slice images (middle), and HE staining (right) of two-month-old Gli1-CreERT2;Twist1fl/fl mice after three days of tamoxifen injection at one month. The arrowhead indicates the coronal suture. White dotted lines indicate boundaries of bones. Scale bars, 2 mm in left, 1 mm in middle and 100 μm in right panel.
Figure S4. Wnt signaling analysis in craniosynostosis and suture regeneration. Landmarks for analyzing head shape. Related to Figures 4 and 5
Wnt signaling is upregulated in craniosynostosis and regenerating suture restores the normal expression of Wnt-related genes
(A) Western blot analyses of Runx2 and OPN expression in suture mesenchymal cells after Wnt activator (Wnt agonist 1) or GSK3 inhibitor (activator of Wnt signaling, LY2090314) treatment for one or two weeks.
(B) Quantification of Runx2 and OPN expression after Wnt agonist 1/LY2090314 or vehicle treatment. Data are expressed as mean ± s.e.m., *P < 0.05, **P < 0.01, ***P < 0.001, ****P < 0.0001, not significant calculated by two-tailed unpaired t-test.
(C) Signatures of Wnt-related genes based on the relative expression levels of WT, MUT, and endogenous cells from REG.
Landmarks for analyzing head shape
(D) Table of landmark descriptions for analyzing head shape.
(E, F) Superior (E) and lateral views (F) of landmark locations.
Figure S5. Analyses of locomotion, grip strength, olfactory function, and anxiety-related behaviors. Related to Figure 6
(A) Representative tracks of the open field test.
(B, C) Total traveled distance (B) and time spent in the center area (C) during the open field test (WT, n=11; MUT, n=12; REG, n=17 mice).
(D) Comparison of grip strength (WT, n=12; MUT, n=11; REG, n=13 mice).
(E-G) Rate of time spent in open arms (E), number of open entries (F) and total entries (G) during elevated plus maze test (WT, n=12; MUT, n=11; REG, n=13 mice).
(H) Schematic of odor discrimination/habituation test.
(I) Time spent sniffing non-social odors (upper left panel) and social odors (upper right panel) during odor discrimination and habituation test. The lower panel shows the total sniffing time per olfactory cue (WT, n=12; MUT, n=11; REG, n=13 mice).
Data are mean ± s.e.m. (B, C, D, E, F, G, I). **P < 0.01, ***P < 0.001, ****P < 0.0001, NS, not significant calculated by one-way ANOVA with Tukey’s test.
Figure S6. Rescue of cognitive and motor learning defects of Twist1+/− mice with craniosynostosis is age dependent. c-Fos expression analysis. Related to Figures 6 and 7
Suture regeneration surgery performed at two months of age fails to rescue cognitive and motor learning defects of Twist1+/− mice with craniosynostosis
(A, D) Representative animal tracks in novel object test (A) and three chamber test (D).
(B, E, F) Preferential indices in novel object test (B), sociability (E) and social novelty (F) in three-chamber test.
(C) Rotarod performance scored as time (seconds) on the rotarod.
WT, wild-type mice, n=10; MUT, Twist1+/− mice with bilateral suture fusion, n=12; REG8 wks, Twist1+/− mice with suture regeneration surgery performed at two months of age, n=13. Data are mean ± s.e.m. (B, C, E, F). *P < 0.05, **P < 0.01, ***P < 0.001, ****P < 0.0001, NS, not significant calculated by one-way ANOVA (B, E, F) with Tukey post hoc tests and two-tailed unpaired t-test (C).
c-Fos expression analysis
(G) c-Fos is activated at an increased level in the prelimbic and perirhinal cortex in Twist1+/− mice, and could be reduced by suture regeneration.
Left panel, schematics of brain coronal sections. Prelimbic cortex (PrL), and perirhinal cortex (PRH) are highlighted with red. The number on the right bottom corner of each panel indicates the distance (mm) from bregma.
Middle panel, representative images of c-Fos expression in PrL (top panel) and PRH (bottom panel). Dotted lines indicate the boundaries of PrL, and PRH. Scale bar, 50 μm.
Right panel, quantification of c-Fos expression in PrL (top panel), and PRH (bottom panel) (WT, n=4; MUT, n=4; REG, n=4 mice). *P < 0.05, **P < 0.01, ***P < 0.001, NS, not significant calculated by one-way ANOVA with Tukey’s post hoc test.
Figure S7. Calvarial injury surgery does not cause elevated ICP or behavioral abnormalities. Related to Figure 6
(A) MicroCT images (3-D reconstruction and slice) for wild type mice at two-weeks-old age before or six weeks post-surgery. Scale bars, 1 mm in inset; 2 mm in (A).
(B) Quantification of ICP values (WT, n=8; Sham, n=7 mice).
(C-E) Preference indices of novel object test (C), sociability (D) and social novelty (E) during the three-chamber test.
(F) Rotarod performance scored as time (seconds) on the rotarod (WT, n=20; Sham, n=18 mice).
(G, H) Total traveled distance (G) and time (seconds) spent in the center area (H) during the open field test (WT, n=20; Sham, n=20 mice).
Data are mean ± s.e.m. (B-H). NS, not significant calculated by two-tailed unpaired t-test.
Data Availability Statement
RNA sequencing data from seven-month-old control (WT), Twist1+/− mice (MUT), and Twist1+/− mice at six months post-surgery (suture regeneration group, REG) have been deposited at GEO (GSE155562) [NCBI tracking system #21160175].