

Summary
Live observation of biological phenomena in the context of living organisms can provide important insights in the mechanisms of these phenomena. However, the spatially complex and dynamic physiology of multicellular organisms can be a challenging environment to make observations with fluorescence microscopy. Due to the illumination of out‐of‐focus planes, confocal and particularly widefield fluorescence microscopy suffer from low signal‐to‐background ratio (SBR), photo toxicity and bleaching of fluorescent probes. In light‐sheet microscopy (LSM), solely the focal plane of the detection objective is illuminated, minimising out‐of‐focus fluorescence and photobleaching, thereby enhancing SBR, allowing for low laser intensities and longer acquisition periods. Here we present a straightforward light‐sheet microscope with a 1.0‐NA detection objective and a fast sample‐positioning stage that allows for four degrees of freedom. By imaging the sensory cilia and nervous system of living young adult C. elegans, we demonstrate that the instrument is well suited for relatively fast, volumetric imaging of larger (hundreds of micrometres cubed) living samples. These experiments demonstrate that such an instrument provides a valuable addition to commonly used widefield and confocal fluorescence microscopes.
Lay description
In fluorescence microscopy, sharp images can only be obtained when the light obtained from the section of the image that is in focus is not overwhelmed by light emerging from elsewhere. In this paper, we present a light‐sheet fluorescence microscope, based on the OpenSPIM initiative, with a magnification of 90× and a sensitive sample positioning stage that allows for fast controlled linear movement and rotation. In a light‐sheet microscope (LSM), the sample is illuminated from the side, compared to the direction of detection, limiting illumination only to the part of the sample that is imaged in the focal plane (general resources: Wikipedia or MicroscopyU). This does not only limit background noise, but also reduces damage to the sample due to phototoxicity. This makes a LSM particularly suitable for imaging living samples at high resolution, in three dimensions, over long periods of time.
Our instrument was specifically designed for imaging adult C. elegans nematodes. We show here how the instrument compares to a standard epifluorescence microscope, imaging neuronal structures in the animals. The instrument proved well suited for fast volumetric imaging of larger cellular structures such as C. elegans neuronal cell bodies. Our experiments show that the instrument provides a valuable addition to widefield and confocal fluorescence microscopes commonly used to image adult C. elegans.
Keywords: Biophysics, C. elegans, fluorescence microscopy, IFT, light‐sheet microscopy
Introduction
Capturing dynamic processes in biological specimens provides great insight into the mechanisms of the ever‐changing physiology of the cell. Imaging the spatially complex and dynamic physiology in the four dimensions of space‐time simultaneously comes with challenges. Widefield and confocal fluorescence imaging can provide high‐resolution images and fast acquisition in two dimensions, but in three dimensions there is a tradeoff in speed or resolution. 1 These widely used techniques illuminate the entire sample along the axis of the (detection) objective, which can create undesired out‐of‐focus background fluorescence, photobleaching and results in phototoxicity. In light‐sheet microscopy [LSM; also called Selective Plane Illumination Microscopy (SPIM)], the sample is illuminated only in the focal plane of the detection objective, creating a higher signal‐to‐background ratio (SBR), allowing lower illumination intensities and enabling rapid image acquisition in three dimensions. 2 The optical advantages of LSM make it ideal to study multicellular organisms, including Arabidopsis, Drosophila, C. elegans, organoids and the beating heart of Danio rerio embryos, providing insights in the mechanisms of, for example, gastrulation, cell lineage, endocytosis, and organelle morphology and dynamics. 3 , 4 , 5 , 6 , 7 , 8 , 9
In many implementations of LSM, two perpendicularly oriented objectives are used: one for light‐sheet illumination, the other for fluorescence emission detection. The physical size of the objectives and the aqueous nature of most living specimens make the practical implementation of illuminating the sample perpendicular to the detection objective a challenge. Most light‐sheet microscopes therefore use water‐dipping objectives with long working distances to accommodate the illumination objective and mounted sample. 10 These objectives often have a low numerical aperture (NA ≪ 1) and magnification, limiting fluorescence collection efficiency, reducing sensitivity and resolution. These limitations have partly been overcome in newer approaches. Lattice light‐sheet microscopy employs a lattice of nondiffracting Bessel beams that is used to perform structured‐illumination microscopy, creating a thin and deep penetrating light sheet. 11 Another method to ensure deep penetration of the sheet is to use two opposing light sheets. In combination with two detection paths, this is known as isotropic light‐sheet microscopy. 4 These techniques, however, require complicated and costly optics and extensive computational processing of the acquired images.
Here, we present a uncomplicated LSM, based on the design of the OpenSPIM initiative, 12 but with a higher‐magnification, higher‐NA detection objective, and a faster and more accurate sample positioning stage. The instrument was designed for volumetric imaging of multicellular organisms, in particular C. elegans, and as a valuable addition to commonly used widefield or spinning disk confocal fluorescence microscopes. We demonstrate the capabilities of this instrument by imaging the sensory cilia and nervous system of living, young adult C. elegans nematodes. Because of the enhanced SBR, combined with the four degrees of freedom in the sample positioning, the instrument is well suited for relatively fast, volumetric imaging of larger (hundreds of micrometres cubed) living samples, ideal for organisms like C. elegans.
Material and methods
Design of the setup
Our design for a microscope to image live, adult C. elegans is based on the Open‐SPIM platform. 12 This open‐source platform provides comprehensive descriptions and tutorials on the construction of a basic LSM. In Figure 1, the design, optimised for our applications, is shown (see also Fig. S1). Detailed notes on the assembly and alignment, including a list of components, of the instrument can be found in the supplementary information (Table S1). To allow for dual colour imaging, the beams of a 488 nm (Coherent Sapphire, 488‐150 CW CDRH) and a 561 nm (Cobolt Jive, 0561‐04‐01‐0025‐300) wavelength continuous‐wave laser are combined using a dichroic mirror (Semrock, LM01‐503‐25). To make full use of the NA of the illumination objective, and thereby creating a light sheet as thin as the objective allows, the excitation laser beam is expanded ∼7× to create a beam diameter of ∼5 mm (1/e 2). Next, a cylindrical lens is used to focus the light along one axis, creating the light sheet. To create evenly distributed illumination and suppress speckle, a rotating diffuser (SUSS MicroOptics SA) was placed in the convergent image plane of the telescope. The light sheet is focused on the back focal plane of a 10× illumination water‐dipping objective (Nikon, Plan Fluor, NA: 0.3). The aluminium outer structure of a custom‐designed objective holder (Fig. S1A) allows mounting the stage and up to four objectives. Inside this aluminium structure, the tips of the objectives are installed in the watertight openings of an acrylic immersion fluid basin. Since the positions of the objectives are fixed, the area of the sample illuminated by the light sheet and imaged using the detection objective, has to be positioned by moving the sample with a stage. We use one open‐loop rotation and three closed‐loop linear piezo‐motor stages, allowing for motion with four degrees of freedom (PI Q‐51.230 as y‐stage, and two PI Q‐51.130s as x‐ and z‐stage, and a PI Q‐622.900 as rotational stage). The four stages are mounted on a custom‐made holder that slides on top of the objective holder with dowel pins (Figs. 1 and S1). The light emitted by the sample is collected by a 60× water‐dipping objective (Nikon, NIR Apo, NA: 1.00). We tried a higher NA objective (Nikon, Plan Achromat 100×, NA: 1.1), but this objective performed substantially worse due to inferior aberration correction. The fluorescence light was subsequently filtered by a band‐pass (525/30) and a multiband rejection filter (405/488/532/635), and finally focused on an EMCCD camera (Andor iXon3 897) by a tube lens (TL, f = 300 mm, Thorlabs AC254‐300‐A‐ML). This tube lens provides an additional 1.5× magnification of the region of interest. Micromanager is used as a user interface to control the linear stages and camera. 13
Fig. 1.
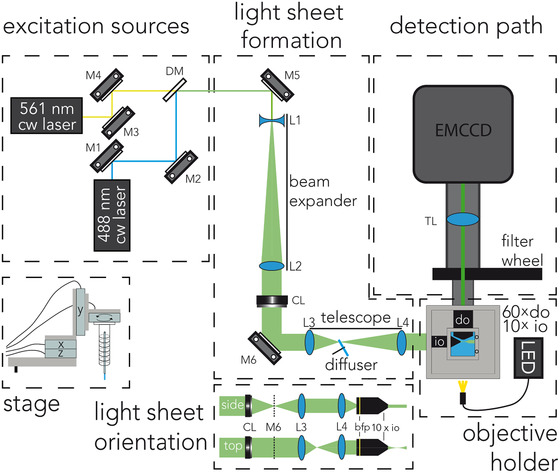
Diagram of the light‐sheet microscope. Mirrors (M1–M6), dichroic mirror (DM), lenses of the beam expander (L1 and L2) and telescope (L3 and L4), cylindrical lens (CL), illumination and detection objectives (io and do) and tube lens (TL).
Sample preparation
One of the challenges in live imaging in multicellular organisms like young adult C. elegans is to keep them alive and healthy during the time of acquisition. The perpendicular configuration of the illumination and detection objectives in our instrument and their water‐dipping nature have as consequence that samples cannot be mounted in the classical configuration between a microscope slide and a cover slip. Here we describe how the sample is mounted to allow four degrees of freedom while keeping optical aberrations to a minimum.
C. elegans are grown using standard procedures. 14 Strain information is provided in Table S2. To keep the nematodes alive and minimise optical aberrations due to the mounting, they are embedded in an agarose cylinder attached to the positioning stage (Fig. S1). To achieve this, healthy, young adult C. elegans expressing a fluorescently labelled protein of interest are placed in a droplet of 5 mM Levamisole, an acetylcholine receptor agonist that immobilises the nematodes. Levamisole is specific for neuromuscular junctions, and does not influence sensory neurons. 15 After 10 min incubation, the worms are carefully spun down, and as much Levamisole as possible is removed without losing worms. Low‐melting point agarose (Sigma, A9414, 2% W/V in M9) is first heated to dissolve, and subsequently cooled down just above room temperature in order to not harm the worms. We have observed before that above 30˚C, there is no distal segment anymore, and IFT particles slow down, 16 which was not observed in our current experiments. The liquid agarose is sucked into a glass capillary (Brand, d = 1.8 mm, BR701910) and partially pipetted onto the worm pellet. After mixing agarose with worms, the mixture is sucked back in the glass capillary and allowed to solidify. Once solid, the bottom ∼1 cm of agarose is pushed out of the capillary. We refrained from imaging through the glass capillary, as this results in too strong optical aberrations. 17 The other, open, end of the capillary is then sealed off with VaLaP (equal parts of vaseline, lanolin and paraffin) to prevent upwards capillary action, which slowly suck the agarose cylinder back in to the capillary, or downward motion due to gravity. Next, the capillary is mounted in a cut plastic syringe using two plungers and mounted to the stages using a custom‐made holder (Fig. S1). Finally, the stage holder is placed on top of the objective holder such that the capillary is submerged in the immersion medium close to the objectives. To prevent osmotic stress, the standard C. elegans buffer M13 (30 mM Tris–HCl, pH 7.0, 100 mM NaCl, 10 mM KCl in water) is used as immersion medium.
Epifluorescence microscopy
As reference point for our results obtained with LSM, we obtained images on our custom‐built epifluorescence microscope. As described before, 18 , 19 the key components of the microscope, built around a Nikon Eclipse Ti inverted microscope body, are the following: Excitation illumination is provided by a continuous‐wave laser (Cobolt Calypso 50 491nm DPSS). Excitation light is focused on the sample and emission light is collected by a 60× water‐immersion objective (Nikon, CFI PlanApo IR WI, NA: 1.27). Excitation and emission light is separated using a dichroic mirror (Semrock, Brightline dual‐edge laserflat, Di01‐R488/561‐25 × 36) and emission light filtered by a band‐pass filter (Semrock, 525/50nm Brightline, FF03‐525/50‐25) before being imaged on an EMCCD camera (Andor, iXon 897, DU‐897E‐COO‐#BV).
Results
Specifications of the setup
To visualise the thickness profile of the light sheet in along the x‐axis of the FOV, we added 9.7 nM fluorescein (Trotec GmbH & Co.) to the immersion water and turned the light sheet 90° by rotating the cylindrical lens (Figs. 2A, C). At the edges of the field of view (91 µm × 91 µm) the light sheet was 19.0 ± 0.7 µm (FWHM) wide and in the centre of the field of view 12.3 ± 0.2 µm. The thickness of the light sheet along the y‐axis and in centre of the FOV was measured with a gold mirror placed at 45° in the light sheet to image it directly on the camera (Fig. 2C). We measured a FWHM of 2.08 ± 0.01 µm (SD of single scan) for the 488 nm laser. To determine the optical resolution inside the agarose cylinder holding our specimens, 45 nm yellow‐green fluorescent beads (Invitrogen, F10720‐COMPONENTA) were imaged (Figs. 2D, E). For resolution determination, line scans across beads were plotted as a function of position (axial and lateral) and fitted with Gaussian functions. The average axial resolution obtained from two different beads is 1.7 ± 0.6 µm (SEM). The lateral resolution (n = 15 beads) is 541 ± 9 nm (SEM). To be able to perform fast scans through the sample, the stage must be able to move to a new position and stabilise quickly. Figure 2(F) shows the set and actual stage position, illustrating the stage response time, overlaid by the exposure time of the camera. Typically, the axial stage reaches the desired position within 15 ms. For most volumetric imaging experiments, an exposure time of 5 ms and a frame rate of 3 Hz was used.
Fig. 2.
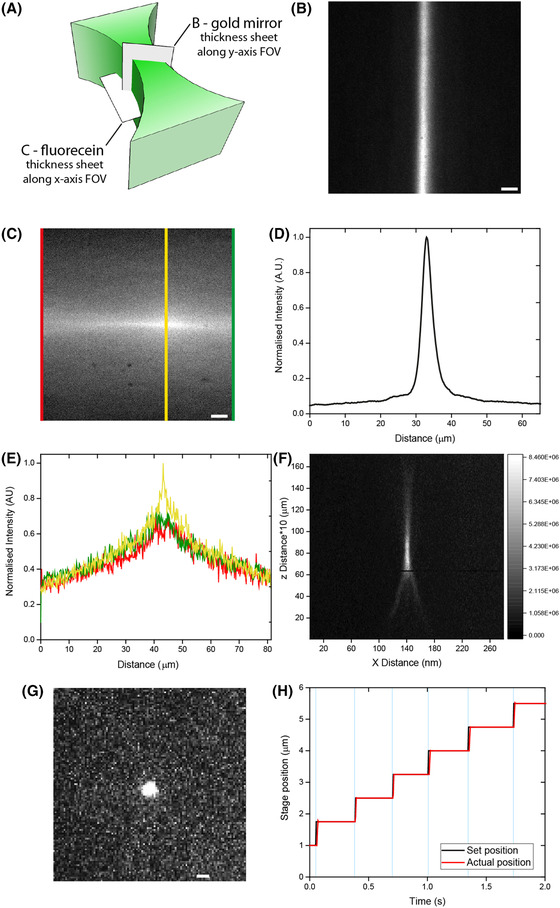
Setup specifications. (A), (B) Light sheet imaged via a mirror in the focal plane (scale bars 10 µm). (A), (C) Visualisation of the light sheet by fluorescein in the propagation direction. (D) Line scan of sheet thickness of B. (E) Line scans were performed at the three coloured lines to calculate the thickness [at edges (red and green) 19.0 ± 0.7 µm (FWHM) wide and in the centre of the field of view (yellow) 12.3 ± 0.2 µm wide]. (F) Images of a 45 nm fluorescent bead with an axial resolution of 2.27 ± 0.01 µm (G) and lateral resolution of 518 ± 8 nm (scale bar 2 µm). (H) The set position (black) and actual position (red) of the axial stage during a measurement. The exposure time (cyan areas) is 5 ms and frame rate is 3 Hz.
We noted that in our instrument, with one‐sided illumination, a thin light sheet can only be obtained in the first 100 µm of a worm sample embedded in an agarose cylinder. Deeper penetration of the light sheet in the agarose results in scattering of the light sheet and optical aberrations. We overcame this limitation by positioning the worms to be imaged in such a way that the path lengths of excitation and emission through the agarose were minimised.
Single‐plane static imaging
One of the mayor disadvantages of epi‐illuminated widefield fluorescence imaging is out‐of‐focus emission and auto‐fluorescence. The orientation of the illumination plane with respect to the detection objective in LSM should enhance SBR in comparison to widefield illumination. To test this, we imaged the two pairs of phasmid cilia of the nematode C. elegans. These phasmid cilia protrude from the ends of the dendrites of chemosensory neurons in the tail region of the worm and are chemosensory hubs. 20 For these experiments, we used two worm strains endogenously expressing cilium‐specific proteins (see Table S2). In one strain, EJP76, the protein OSM‐6, a component of the cilium‐specific intraflagellar transport (IFT) machinery, is fused with EGFP. IFT is essential for cilium assembly, maintenance and function. In IFT, so‐called IFT trains transport cargo from ciliary base to tip and back again. These IFT trains consist of many copies of two protein complexes, IFT‐A and IFT‐B, to which motor proteins and cargo bind. OSM‐6 is a component of the IFT‐B complex. 18 In another strain, EJP401, the cilium‐specific β‐tubulin TBB‐4 is fused with EGFP.
As can be seen in Figure 3(A), for both C. elegans strains, the two pairs of phasmid cilia are situated close to the cuticle at the left and right side in the tail of the nematode. We used colour coding (magenta and cyan) to indicate different depths. The two pairs are separated by ∼5 µm. Depending on the orientation of the worm, the two pairs can overlap in the axial direction. In this case, it is our experience that in epi‐illuminated widefield fluorescence microscopy, out‐of‐focus fluorescence from one of the pairs hampers proper, high signal‐to‐background imaging of the other. In the single‐plane LSM images of Figure 3(A) individual pairs of cilia with minimal fluorescence background from other planes can be observed, even in case the two pairs are on top of each other (in the axial direction, as is the case for the TBB‐4::EGFP worm in Fig. 3A).
Fig. 3.
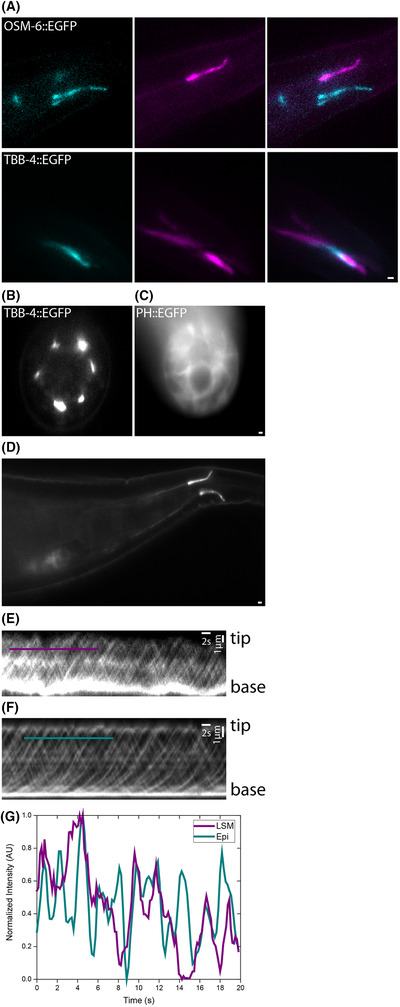
Single plane static and live imaging in adult C. elegans. (A) Phasmid cilia expressing OSM‐6::EGFP and TBB‐4:EGFP. Scale bar 2 µm. Colours represent different positions in the axial direction. (B) Cross section of worms expressing TBB‐4::EGFP and (C) PH::GFP. Scale bar 2 µm. (D) Single‐plane image of the phasmid cilia expressing OSM‐6::EGFP. Scale bar 1 µm. Kymographs of OSM‐6::EGFP dynamics in the phasmid cilia using LSM (E), or epifluorescence microscopy. (F) Scale bars: vertical: distance, scale bar 1 µm. Horizontal: time, scale bar 2 s. Coloured lines in (E) and (F) indicate the positions of the line scans in (G), showing IFT‐train tracks.
Imaging of the phasmid cilia of worms in the proper orientation works well with epi‐illuminated widefield fluorescence microscopy, since it only involves two pairs of cilia. 18 For more complex, 3‐dimensional structures this is, however, not possible and confocal approaches are typically used. To test how well our LSM performs on such structures, we imaged neuronal microtubules (using the TBB‐4::EGFP strain) inside the head region of C. elegans. The neurites are positioned in six bundles stretching from the cilia next to the mouth of the worm to the axons about 100 µm posterior of this. As can be seen in Figure 3(B), the cross sections of the bundles do not reveal any influence of out‐of‐focus fluorescence. Next, a cell‐membrane marker (PH::EGFP), which is expressed in all cells, consequently resulting in much more densely labelled worms, was imaged (Fig. 3C). Although the images are less clear and clearly suffer from some out‐of‐focus background fluorescence (for example, in the top left of the image, the rest of the worm is visible as an out‐of‐focus haze), individual cells can still be discerned in a cross section. In this cross section, the lumen of the intestine and gonad can be seen.
Single‐plane dynamic imaging
We next performed an experiment to assess whether SBR, contrast and resolution of the LSM are sufficient for quantitative live imaging of dynamic processes. To this end, we imaged the dynamics of EGFP labelled OSM‐6, which is a part of the IFT transport machinery, inside the phasmid cilia of C. elegans (Fig. 3D). We then made kymographs from the obtained image sequences to visualise the OSM‐6::EGFP dynamics (Fig. 3E, Movie S1). 21 We compared the kymographs to those obtained with epi‐illuminated widefield fluorescence imaging of the same strain. 19 The observed IFT velocities are similar on both instruments and similar to previously observed values. 18 Although the kymographs obtained with LSM show clear tracks due to IFT dynamics, the individual tracks are much harder to distinguish than is the case for kymographs obtained with the epi‐illuminated fluorescence microscope (Figs. 3E–G). This is most likely due to the decreased spatial resolution and lower sensitivity of the long‐working‐distance detection objective used in our LSM instrument, which has a substantially lower NA than the objective used in the epi‐illuminated fluorescence microscope (1.00 instead of 1.27). Increasing the excitation intensity will not increase the contrast in the kymographs, since SNB appears comparable. Thus, although the out‐of‐focus background fluorescence can be substantially reduced by using the LSM instrument, the resolution and sensitivity of the instrument are lower than that of a high‐NA epifluorescence microscope, which makes the light‐sheet microsope less suitable for high‐resolution applications.
Volumetric imaging of static structures
One of the major advantages of using a multicellular organism as a model system is to be able to observe molecular processes in their natural cellular context. To test how our LSM performs in static volumetric imaging, we imaged the microtubule network in the head region of live adult C. elegans expressing EGFP‐labelled tubulin (TBB‐4::EGFP). We imaged 115 slices, separated by 0.75 µm in order to image the entire diameter of the worm in the head region (Fig. 4A and Movie S2). As can be seen, the head of the worm is slightly tilted to the bottom left. The two pharyngeal bulbs are visible as the microtubules are situated around them, with the second bulb, on the right, located next to the neuronal cell bodies. In Figure 4(B), a single slice of the stack is shown, demonstrating that optical sectioning is very effective. For comparison, we imaged the same region of a worm using epifluorescence microscopy. As is evident from Figure 3(C) and Movie S2, only in the tip of the worm's head, structures can be discerned (e.g. the amphid cilia on the left). More to the right, where the worm's body is substantially thicker, sharp features are swamped by out‐of‐focus background fluorescence. These results confirm the expectation that LSM is far superior to epifluorescence microscopy for live, 3D imaging of structures of the order of tens of micrometres, because of its efficient reduction of out‐of‐focus background signals.
Fig. 4.
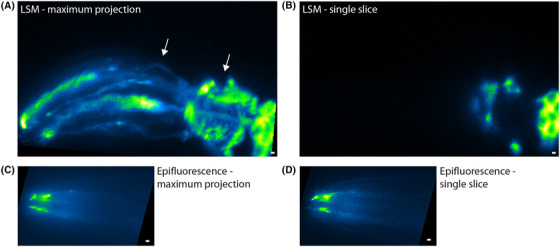
Volumetric imaging of amphid neurons expressing TBB‐4::EGFP. (A) Maximum projection of 115 slices of each 0.75 µm of TBB‐4::EGFP in the head region of C. elegans from anterior to posterior and (B) a single slice obtained with LSM. Scale bars 2 µm. Neurites going around the two pharyngal bulbs are indicated with arrows. (C) Maximum projection of a z‐stack of 15 slices, each separated 1 µm of TBB‐4::EGFP in the head region of another specimen of C. elegans and (D) a single slice obtained on our epifluorescence microscope. Scale bars 2 µm. Arrows indicate the two bundles of amphid cilia.
Volumetric imaging of dynamic processes
LSM has been shown to be very suitable for long time‐scale imaging of live processes such as development, because of its gentle illumination conditions. To test this for our instrument, we imaged neuronal activity by Ca2+ imaging with the Ca2+‐sensitive probe GCaMP in living C. elegans. 22 To this end, we used a C. elegans strain (AML32) expressing GCaMP in the nucleus of all neurons. First, we scanned through the head region of the nematode to get a 3D image of the nuclei, containing 43 slices, each separated 0.75 µm. GCaMP expression is high in these worms, resulting in a bright fluorescence signal, allowing illumination times as short as 5 ms per slice (Fig. 3F). A maximum projection, colour coded for depth, is shown in Figure 5(A) (see Movie S4 for a 3D rendering). Similar to the volumetric images of tubulin, one can appreciate the bulb of the pharynx, which does not contain neuronal somas. Somas can be seen below (cyan), around (yellow) and on top of the pharynx (white).
Fig. 5.
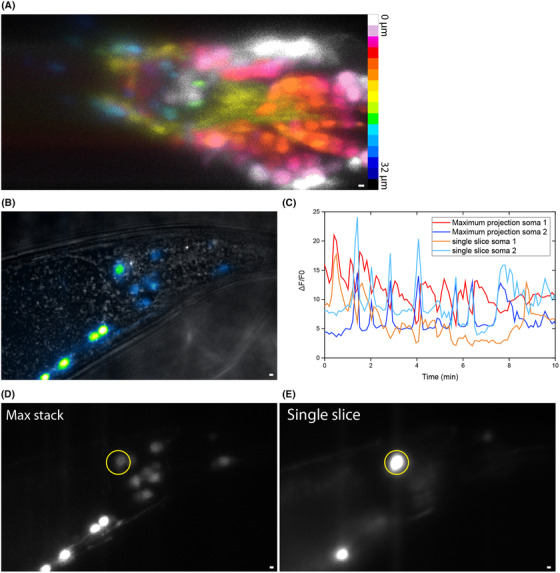
Imaging of GCaMP activity. (A) Somas in the head region with colour coded depth. (B) Volumetric fluorescence image of the tail region, overlaid with a brightfield transmitted‐light image. (C) Activity of two somas, indicated with yellow circle, (D) from the maximum projection (E) and a single slice. Scale bars 2 µm.
Next, we used this approach to image neuronal activity in living C. elegans. We note that neuronal firing in C. elegans is slow and takes place on a time scale of minutes, 22 , 24 , 25 ; confirmed by our own epifluorescence experiments, Figs. S3A–B. This shows that our LSM volumetric imaging approach (∼0.5–1 s per z‐stack) is fast enough. We performed long term (1–2 h) imaging of a GCaMP expressing worm, to confirm that LSM imaging does not causes substantial bleaching, phototoxicity or loss of SBR (Fig. S3C).
We focus here on the tail region of a worm expressing GCaMP (Movie S5). For effective visualisation of the location of the somas in context of the location in the worm, we merged a z‐stack fluorescence image of GCaMP with a brightfield image (Fig. 5B). To visualise the dynamics, we generated a movie of maximum projections of each z‐stack (Movie S5). Time traces of the fluorescence intensity of a soma, measured in the maximum‐projection movie and in a movie containing only the slice with that soma, are shown in Figure 5(C). Not all peaks occur in the intensity traces obtained from the maximum projection and the single slice, however. This could be due to some drift causing the soma to drift in and out of the single slice that was selected. Despite this, the use of a maximum projection instead of all slices of the movie reduces data processing time and leads to an acceptable loss of information (Figs. 5D, E). Taken together, our data on neuronal activity show that our LSM instrument is very well suited for dynamic 3D imaging of live, adult C. elegans on a time scale of several minutes to 1–2 h.
Discussion
LSM has greatly advanced the imaging toolbox for the life sciences, in particular with respect to long‐term imaging of sensitive specimens on the hundreds of micrometre scale. A key advantage over widefield epifluorescence microscopy is that out‐of‐focus background fluorescence is effectively suppressed. Here, we have presented an uncomplicated LSM design, with a 60× detection objective, a fast and accurate sample positioning stage, optimised for live imaging of young adult C. elegans nematodes. The instrument is excellent for long‐term (1–2 h) volumetric imaging on the cellular scale with a temporal resolution of a few seconds. On the subcellular scale, however, resolution and contrast suffer from the substantially lower NA of the detection objective compared to that of an epifluorescence microscope.
The high number and tight configuration of cilia in the head region of C. elegans makes this a challenging area to distinguish them. Our initial goal with the LSM instrument was to image the dynamics of IFT in this region, as this requires a high SBR, which our epi‐illuminated microscope does not provide sufficiently. The detection objective we used, 60× NA 1.0, allowed sharp imaging with a good SBR. Nevertheless, the resolution turned out to be insufficient to image IFT in the head of young adult C. elegans. This might be improved by the use of a higher‐NA detection objective, and/or the implementation of adaptive optics. 23
For larger structures, such as somas and cell membranes, the instrument does provide a substantial improvement in SBR compared to widefield epi‐illuminated microscopy. The incorporation of accurate closed‐loop positioning stages and open‐loop rotation stage allowed us to position the worms in the most favourable way and enables making volumetric movies. Another advantage of the selective illumination is that lower laser intensities and an overall lower illumination of the sample are required, leading to less photo bleaching and photo toxicity compared to widefield epi‐illuminated microscopy. Furthermore, the embedding in agarose and subsequent immersion in the immersion medium prevents dehydration of the nematodes. This allows one to image for hours, making the lack of available food the biggest time limitation.
In summary, the enhanced SBR, compared to epifluorescence imaging, and four degrees of freedom makes the instrument well suited for relatively fast volumetric imaging of larger living samples like C. elegans. With that, it is a straightforward and valuable addition to commonly used microscopes such as epifluorescence and spinning‐disc confocal.
Author contributions
EJGP and JvK contributed to the conception and design of the study. JvK and KHT built the setup and performed experiments. KHT performed alignment and tested sample‐preparation methods. JvK wrote the first draft of the manuscript. All authors contributed to manuscript revision, read and approved the submitted version.
Supporting information
Fig. S1. The light‐sheet microscope.
Fig. S2. High‐time resolution imaging using epifluorescence microscopy demonstrates that spontaneous neuronal firing in C. elegans is a process on the time scale of a minute.
Fig. S3. Long‐term (69 min) LSM imaging of spontaneous neuronal activity in adult C. elegans.
Table S1. List of components.
Table S2. Strains used in this study.
Movie S1. IFT dynamics IFT dynamics of OSM‐6::EGFP, an IFT‐B particle complex component, in the phasmid cilia of C. elegans, imaged with light‐sheet microscopy. Related to Figure 2(D).
Movie S2. Head region neurons with light‐sheet microscopy Movie of z‐stack of neuronal microtubules, visualised with TBB‐4::EGFP, imaged with light‐sheet microscopy. Related to Figure 3(A).
Movie S3. Head region neurons with epifluorescence microscopy Movie of z‐stack of neuronal microtubules, visualised with TBB‐4::EGFP, imaged with epifluorescence microscopy. Related to Figure 3(C).
Movie S4. Neuronal cell bodies in the head region 3D visualisation of z‐stack of GCaMP, imaged with light‐sheet microscopy. Related to Figure 4(A).
Movie S5. Neuronal activity in the tail region neuronal activity visualised with GCaMP in the tail region, imaged with light‐sheet microscopy. Related to Figures 4(B)–(E).
Acknowledgements
We would like to thank N.D.M. van Harlingen and J. Kos of the fine mechanics and engineering group at the Vrije Universiteit for help with the design, and for making the objective holder. We thank prof. dr. S. van den Heuvel for providing the SV1677 strain and the CGC for the AML32 strain. We thank N. Danné for help with data analysis. We acknowledge financial support from the Netherlands Organization for Scientific Research (NWO) via the Foundation for Fundamental Research on Matter program grant (‘The Signal is the Noise’) and from the European Research Council under the European Union's Horizon 2020 research and innovation programme (Grant agreement no. 788363; ‘HITSCIL’).
References
- 1. Stephens, D.J. & Allan, V.J. (2003) Light microscopy techniques for live cell imaging. Science (80‐.) 300, 82–86. [DOI] [PubMed] [Google Scholar]
- 2. Reynaud, E.G. , Peychl, J. , Huisken, J. & Tomancak, P. (2014) Guide to light‐sheet microscopy for adventurous biologists. Nat. Methods 12, 30–34. [DOI] [PubMed] [Google Scholar]
- 3. Huisken, J. , Swoger, J. , Bene, F.D. , Wittbrodt, J. & Stelzer, E.H.K. (2004) Optical sectioning deep inside live embryos by selective plane illumination microscopy. Science (80‐.) 305, 1–3. [DOI] [PubMed] [Google Scholar]
- 4. Chhetri, R.K , Amat, F. , Wan, Y. et al (2015) Whole‐animal functional and developmental imaging with isotropic spatial resolution. Nat. Methods 12, 1171–1178. [DOI] [PubMed] [Google Scholar]
- 5. Liu, T.L , Upadhyayula, S. , Milkie, D E. et al (2018) Observing the cell in its native state: imaging subcellular dynamics in multicellular organisms. Science (80‐.) 360, 1–13. [DOI] [PMC free article] [PubMed] [Google Scholar]
- 6. Candeo, A. , Doccula, F.G. , Valentini, G. , Bassi, A. & Costa, A. (2017) Light sheet fluorescence microscopy quantifies calcium oscillations in root hairs of Arabidopsis thaliana . Plant Cell Physiol. 58, 1161–1172. [DOI] [PMC free article] [PubMed] [Google Scholar]
- 7. Valm, A.M , Cohen, S. , Legant, W R. et al (2017) Applying systems‐level spectral imaging and analysis to reveal the organelle interactome. Nature 546, 162–167. [DOI] [PMC free article] [PubMed] [Google Scholar]
- 8. Wu, Y , Ghitani, A. , Christensen, R. et al (2011) Inverted selective plane illumination microscopy (iSPIM) enables coupled cell identity lineaging and neurodevelopmental imaging in Caenorhabditis elegans. Proc. Natl. Acad. Sci. 108, 17708–17713. [DOI] [PMC free article] [PubMed] [Google Scholar]
- 9. Wang, H. , Zhao, Y. , Ezcurra, M. et al (2018) A parthenogenetic quasi‐program causes teratoma‐like tumors during aging in wild‐type C. elegans . NPJ Aging Mech. Dis. 4, 1–12. [DOI] [PMC free article] [PubMed] [Google Scholar]
- 10. Power, R.M. & Huisken, J. (2017) A guide to light‐sheet fluorescence microscopy for multiscale imaging. Nat. Methods 14, 360–373. [DOI] [PubMed] [Google Scholar]
- 11. Chen, B.C , Legant, W R. , Wang, K. et al (2014) Lattice light‐sheet microscopy: imaging molecules to embryos at high spatiotemporal resolution. Science (80‐.) 346, 1257998‐1–1257998‐12. [DOI] [PMC free article] [PubMed] [Google Scholar]
- 12. Pitrone, P.G , Schindelin, J. , Stuyvenberg, L. et al (2013) OpenSPIM: an open‐access light‐sheet microscopy platform. Nat. Methods 10, 598–599. [DOI] [PMC free article] [PubMed] [Google Scholar]
- 13. Edelstein, A. , Amodaj, N. , Hoover, K. , Vale, R. & Stuurman, N. (2010) Computer control of microscopes using manager. Curr. Protoc. Mol. Biol., 92, 1–17. [DOI] [PMC free article] [PubMed] [Google Scholar]
- 14. Brenner, S. (1974) The genetics of Caenorhabditis elegans . Genetics 77, 71–94. [DOI] [PMC free article] [PubMed] [Google Scholar]
- 15. Boulin, T , Gielen, M. , Richmond, J. E. et al (2008) Eight genes are required for functional reconstitution of the Caenorhabditis elegans levamisole‐sensitive acetylcholine receptor. Proc. Natl. Acad. Sci. U. S. A. 105, 18590–18595. [DOI] [PMC free article] [PubMed] [Google Scholar]
- 16. Mijalkovic, J. (2018) The effect of temperature on chemosensory cilia and intraflagellar transport in C. elegans Ensemble and single‐molecule dynamics of intraflagellar transport in C. elegans. 84–97. [Google Scholar]
- 17. Bourgenot, C. , Saunter, C.D. , Taylor, J.M. , Girkin, J.M. & Love, G.D. (2012) 3D adaptive optics in a light sheet microscope. Opt. Express 20, 13252. [DOI] [PubMed] [Google Scholar]
- 18. Prevo, B. , Mangeol, P. , Oswald, F. , Scholey, J.M. & Peterman, E.J.G. (2015) Functional differentiation of cooperating kinesin‐2 motors orchestrates cargo import and transport in C. elegans cilia. Nat. Cell Biol. 17, 1536–1545. [DOI] [PubMed] [Google Scholar]
- 19. van Krugten, J. & Peterman, E.J.G. (2018) Single‐molecule fluorescence microscopy in living Caenorhabditis elegans. Single Mol. Anal. 145–154. [DOI] [PubMed] [Google Scholar]
- 20. Bae, Y.‐K. & Barr, M.M. (2008) Sensory roles of neuronal cilia: cilia development, morphogenesis, and function in C. elegans Young‐Kyung. Front. Biosci. 13, 5959–5974. [DOI] [PMC free article] [PubMed] [Google Scholar]
- 21. Mangeol, P. , Prevo, B. & Peterman, E.J.G . (2016) KymographClear and KymographDirect : two tools for the automated quantitative analysis of molecular and cellular dynamics using kymographs. Mol. Biol. Cell 27, 1948–1957. [DOI] [PMC free article] [PubMed] [Google Scholar]
- 22. Tian, L. , Hires, S.A. , Mao, T. et al (2009) Imaging neural activity in worms, flies and mice with improved GCaMP calcium indicators. Nat. Methods 6, 875–881. [DOI] [PMC free article] [PubMed] [Google Scholar]
- 23. Ji, N . (2017) Adaptive optical fluorescence microscopy. Nat. Methods 14, 374–380. [DOI] [PubMed] [Google Scholar]
- 24. Hara‐Kuge, S , Nishihara, T. , Matsuda, T. et al (2018) An improved inverse‐type Ca2+ indicator can detect putative neuronal inhibition in Caenorhabditis elegans by increasing signal intensity upon Ca2+ decrease. PLoS One 13, 1–15. [DOI] [PMC free article] [PubMed] [Google Scholar]
- 25. Tanimoto, Y. , Yamazoe‐Umemoto, A. , Fujita, K. et al (2017) Calcium dynamics regulating the timing of decision‐making in C. Elegans . Elife 6, 1–30. [DOI] [PMC free article] [PubMed] [Google Scholar]
Associated Data
This section collects any data citations, data availability statements, or supplementary materials included in this article.
Supplementary Materials
Fig. S1. The light‐sheet microscope.
Fig. S2. High‐time resolution imaging using epifluorescence microscopy demonstrates that spontaneous neuronal firing in C. elegans is a process on the time scale of a minute.
Fig. S3. Long‐term (69 min) LSM imaging of spontaneous neuronal activity in adult C. elegans.
Table S1. List of components.
Table S2. Strains used in this study.
Movie S1. IFT dynamics IFT dynamics of OSM‐6::EGFP, an IFT‐B particle complex component, in the phasmid cilia of C. elegans, imaged with light‐sheet microscopy. Related to Figure 2(D).
Movie S2. Head region neurons with light‐sheet microscopy Movie of z‐stack of neuronal microtubules, visualised with TBB‐4::EGFP, imaged with light‐sheet microscopy. Related to Figure 3(A).
Movie S3. Head region neurons with epifluorescence microscopy Movie of z‐stack of neuronal microtubules, visualised with TBB‐4::EGFP, imaged with epifluorescence microscopy. Related to Figure 3(C).
Movie S4. Neuronal cell bodies in the head region 3D visualisation of z‐stack of GCaMP, imaged with light‐sheet microscopy. Related to Figure 4(A).
Movie S5. Neuronal activity in the tail region neuronal activity visualised with GCaMP in the tail region, imaged with light‐sheet microscopy. Related to Figures 4(B)–(E).