Abstract
Noninvasive, objective measurement of rod function is as significant as that of cone function, and for retinal diseases such as retinitis pigmentosa and age-related macular degeneration, rod function may be a more sensitive biomarker of disease progression and efficacy of treatment than cone function. Functional imaging of single human rod photoreceptors, however, has proven difficult because their small size and rapid functional response pose challenges for the resolution and speed of the imaging system. Here, we describe light-evoked, functional responses of human rods and cones, measured noninvasively using a synchronized adaptive optics optical coherence tomography (OCT) and scanning light ophthalmoscopy (SLO) system. The higher lateral resolution of the SLO images made it possible to confirm the identity of rods in the corresponding OCT volumes.
In vivo imaging of stimulus-evoked responses of human photoreceptors is an emerging field, with compelling potential applications in basic science, translational research, and clinical management of retinal disease. It is now commonly believed that photoreceptor outer segments (OS) deform in response to visible stimuli. The earliest evidence of this potential biomarker of photoreceptor function was provided by X ray diffraction imaging of rods in dark- and light-adapted retinal explants from frogs [1,2], and its first measurements in the living eye were done using common path interferometry with adaptive optics (AO) [3,4] and optical coherence tomography (OCT). OCT permits axial localization of backscattering material as well as information about the phase of the backscattered light. The phase of the light permits detection of deformations much smaller than its axial resolution [5], and this capability has been leveraged to measure light-evoked OS deformation in cones with digital aberration correction [6] and hardware AO [7,8]. Conventional OCT without AO has been used to observe light-evoked rod elongation in rodents [9,10] and its converse, rod OS shortening during dark adaptation in human [11]. Functional imaging of single rod photoreceptors, however, has been proven challenging because their small size and rapid functional response place extraordinary demands on the resolution and speed of the imaging system. At present the fastest swept-source systems have wavelengths above 1 μm, which provides insufficient lateral resolution for resolving rods. Alternatives such as full-field OCT may provide sufficient speed and resolution but have not yet been used to image rods.
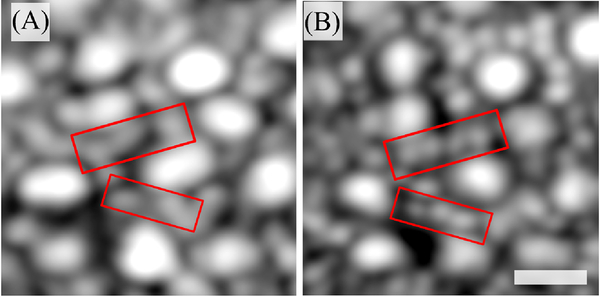
In this work, we employed a combined AO-SLO-OCT (SLO, scanning light ophthalmoscopy) to detect light-evoked elongation of rod and cone photoreceptors. The SLO’s superior lateral resolution, afforded by its shorter wavelength and sub-Airy disk pinhole, was used to confirm the location and type of photoreceptors in the OCT volume (see Fig. 1). The details of the combined system can be found elsewhere [12]. Briefly, the OCT system was based on a Fourier-domain mode-locked (FDML) swept-source laser (λc=1060nm; Δλ=80nm) with an A-scan rate of 1.64 MHz [13,14]. Three 50:50 fiber couplers in a form of Michelson interferometer were used to split the light between the sample and reference arm and recombine them to be detected with a balanced detector. The measured sensitivity of the OCT system was −85dB. SLO illumination was generated with a superluminescent diode (SLD) (λc=840nm; Δλ=10nm). Optical power measured at the cornea was 1.8 mW (OCT) and 150 μW (SLO), together below the maximum permissible exposure specified by the latest laser safety standard [15]. OCT volumes and SLO frames were acquired at 6 Hz, a rate deemed sufficient for measuring expected OS elongation velocities without intraframe phase wrapping, given the planned stimulus intensities. The AO subsystem was operating in a closed-loop at a rate of 10 Hz using a subband of the SLD illumination for wavefront sensing. By measuring and correcting aberrations over a 6.75 mm pupil, it provided a theoretical diffraction-limited lateral resolution of 2.5 μm and 3.2 μm for the SLO and OCT imaging channels, respectively. Residual error (σW) in all subjects indicated diffraction-limited imaging by the Maréchel criterion, with σW<λ/14
Fig. 1.
Example of simultaneously acquired AO-SLO-OCT images at 6° temporal to the fovea. Rods are not as well resolved in the OCT en face projection, as shown in (A), as they are in the SLO image, as shown in (B). The scale bar is 10 μm.
After obtaining informed consent, two normal subjects, free of known retinal disease, were imaged. Each subject’s eye was dilated and cyclopleged with drops of 2.5% phenylephrine and 1% tropicamide. Subjects were dark-adapted for 30 min and imaged for 10–15 s, with a 10 ms flash of 555 nm light delivered at 2 s with power between 150 nW and 100 μW, which bleached between 0.007% and 4.0% of rod photopigment, or 0.03% and 15% of cone photopigment [16,17]. The stimulus light overfilled the 1° imaging field of view, delivering light over an area of 3.8° by 1.7°. The dose-response (photon-photoisomerization) curves over this range of stimuli were approximately linear for rods and cones, with cone bleaching about 4 times higher than rod bleaching, for a given dose. All procedures were in accordance with the tenets of the Declaration of Helsinki and were approved by the University of California, Davis Institutional Review Board. Using images of the calibration grid, sinusoidal distortions were removed using linear interpolation and nearest neighbor interpolation in the SLO and OCT images, respectively. Nearest neighbor interpolation was used for the OCT volumes to prevent phase errors caused by linear interpolation between wrapped phase measurements. Acquired SLO frames were registered using a strip-based approach [5,18,19], and the resulting trace of eye movements was used to register the simultaneously acquired OCT volumes. Cones and rods were automatically identified in the registered images and axially segmented in the OCT volumes, providing 3D tracking of photoreceptors over time. Time-series of the complex axial signal (M-scans) of each photoreceptor were recorded, and the phase differences between inner segment/outer junction (IS/OS) and cone outer segment tips (COST) and also IS/OS and rod outer segment tips (ROST) were measured as functions of time [5,7].
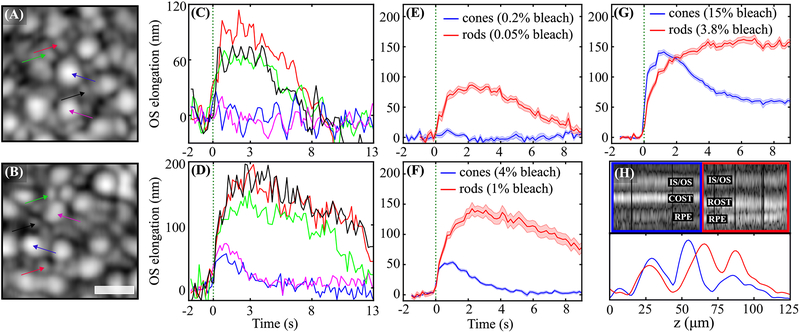
Volumetric OCT images clearly revealed cones, as shown in Figs. 2(A) and 2(B) (purple and blue arrows). These were surrounded by rods (black, green, and red arrows), which were not as well resolved in the OCT. After a stimulus flash is delivered to the retina, elongation is observable in individual rods and cones, as shown in Figs. 2(C) and 2(D), as well as in corresponding ensemble averages of 10–20 cells, shown in Figs. 2(E) and 2(F), and the average response to a much brighter flash, shown in Fig. 2(G). Although L and M cone photopigments are 4 times more sensitive to 555 nm light, the rods were observed to respond to smaller doses than cones. Single rods show an elongation between 70 nm and 100 nm to a flash that bleaches 0.05% of rod photopigment, as shown in Fig. 2(C). The same flash bleaches 0.2% of cone photopigment, but no elongation was observed [Figs. 2(C) and 2(E)]. When the flash intensity was increased to bleach 1% of rod photopigment and 4% of cone photopigment, elongation was observed in cones, and substantially more was observed in rods, as shown in Figs. 2(D) and 2(F). In the averaged responses, especially those shown in Fig. 2(G), it appears that the elongation velocity over the first 1–2 s is higher in cones than rods. Cell types were confirmed in the higher resolution SLO frames, and also by the differences in axial morphology visible in M-scans and axial reflectance profiles shown in Fig. 2(H). While comparisons between these optoretinographic findings and corresponding electroretinographic measurements are premature, it is noteworthy that the larger, slower response of rods is consistent with their established higher sensitivity and lower temporal bandwidth than their cone counterparts.
Fig. 2.
(A) and (B) show the OCT en face projections acquired 6° temporal to the fovea in two trials of different stimulus intensities, while (C) and (D) show plots of the corresponding elongation of select rods and cones in the field, and (E) and (F) show the corresponding averaged responses of 10–20 cones and rods. In (A), (C), and (E), the flash bleached 0.2% and 0.05% of L/M photopigment and rod pigment, respectively, while the brighter flash in (B), (D), and (F) bleached 4.0% and 1.0%, respectively. No cone elongation is visible in response to the dimmer flash in (C) and (E), whereas a clear rod response is visible. In response to the brighter flash in (D) and (F), both rods and cones elongate, with the elongation of rods having several times higher amplitude. The averaged cone and rod responses to a still brighter flash, which bleached 15% and 3.75%, are shown in (G), where the cone response appears to have a higher initial slope and the rod response appears to saturate. Together these results are consistent with key fundamental differences between the cells—that cone responses are faster but less sensitive than those of rods. M-scans of a single cone and rod from the field are shown in (H), along with plots of their time-averaged axial reflectance profiles. The longer OS of the rod and corresponding distal displacement of its OS tip are clearly visible. This morphological difference aids in classification of the cells, and also guards against cross talk of their responses due to lateral blur. Colors of arrows in (A) and (B) correspond to line colors in (C) and (D), and shaded regions in (E)–(G) represent the standard error of the mean (±SEM). The scale bar is 10 μm.
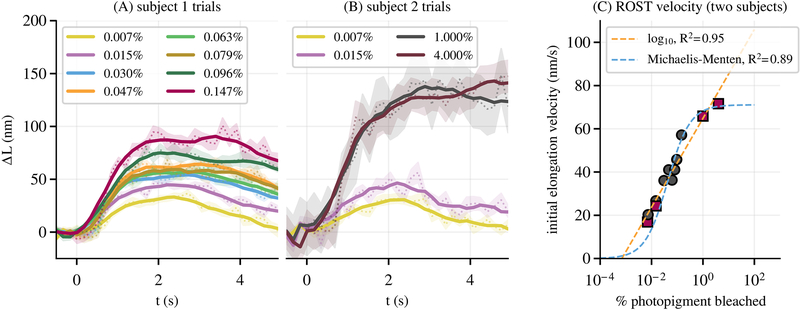
All chosen flash intensities were sufficient to elicit responses in rods, even those bleaching as little as 0.007% of rod pigment, and a number of these from the two subjects are shown in Figs. 3(A) and 3(B). Multiple features of the curves, such as initial elongation velocity and maximum excursion, appeared to depend on bleaching percentage. The former is evident in Fig. 3(C), where measured elongation velocity from both subjects is plotted as a function of log bleaching percentage. The data were fitted with two models using a weighted nonlinear least squares approach. The first was a simple log-linear model,
| (1) |
where vOS(b) is initial elongation velocity and b is bleaching percentage, and the free parameters were determined to be k=64.8nm/s and a=20.5nm/s, with a goodness of fit of R2=0.95. While Eq. (1) is a good predictor of elongation velocity within the experimental bleaching range, it has some undesirable properties outside of this range—at 0% and 100% bleaching, for instance. We fit the data with a second model, a sigmoidal Michaelis–Menten equation,
| (2) |
where the free parameters were determined to be vm=69.6nm/s and b0=0.032%, with a goodness of fit of R2=0.89. The models described in Eqs. (1) and (2) are plotted, with yellow and blue dashed lines, respectively, along with the measured initial velocities in Fig. 3(C). As mentioned above, other aspects of the responses appeared to depend on bleaching percentage. We fitted maximum excursion ΔLmax(b)—defined as the average of the three highest values in ΔL(t)—with both models as well. For the log-linear model [Eq. (1)], we found k=121.2nm and a=43.4nm, with a goodness of fit of R2=0.95. For the sigmoidal model [Eq. (2)], we found vm=137.0nm and b0=0.059%, with a goodness of fit of R2=0.86.
Fig. 3.
(A) shows the averaged response of 30–50 rods for each of eight flash intensities in subject 1. (B) shows the same for each of the four flash intensities in subject 2. In each plot, the dashed line and shaded area show the average response and ±SEM. The solid lines are the result of local smoothing by rolling average. Various characteristics of the response curves—such as initial velocity and maximum excursion—appear qualitatively related to bleaching percentage. (C) shows a plot of elongation velocity, averaged over 1.5 s post-flash, as a function of bleaching percentage for both subjects; each marker on the plot represents one of the curves in (A) and (B). These were fit with two models, a log-linear model and a sigmoidal Michaelis–Menten function, both of which fit the data well (R2≥0.89).
While the mechanisms of light-evoked deformation of rods are not known, both features of the response were fitted well with both models, and suggest the possibility of building a normative rod ORG database and, potentially, of observing deficits in patients with photoreceptor disease.
Previously, we reported appearance and/or movement of an extra band between IS/OS and COST in cones subsequent to the stimulus flash, and also a change in the appearance of the subretinal space and retinal pigment epithelium (RPE) [7]. These phenomena were observed again in cones, as indicated by red and yellow arrows, respectively, in Fig. 4(B). The RPE band appears to split, with its apical portion moving inward, toward COST. As shown in Fig. 4(A), the same phenomena were observed in rods as well, when bleaching as little as 4% of photopigment. The appearance and/or movement of the extra band near IS/OS could be explained by an abrupt change in disc spacing or concentration of a visual cycle enzyme or intermediate, either of which could lead to an abrupt refractive index mismatch. The observed changes in the subretinal space are consistent with previous observations in animal models [20], thought to originate from melanosome movement into the apical part of the RPE cell [21]. Further experiments are required to investigate both.
Fig. 4.
M-scans of rods [shown in (A)] and cones [shown in (B)] for photopigment bleaching percentages of 4% and 15%, respectively, reveal similar changes in the apparent axial morphology of the cells. As shown by red arrows, appearance of an extra band between IS/OS and ROST (COST) was observed in most of the rods (cones). The reflectivity of this extra band and also its axial distance from IS/OS seem to be proportional to the bleaching light intensity. The yellow arrow indicates changes observed in the RPE and subretinal space.
In this work, we have shown that AO-OCT can measure light-evoked optical responses of rod and cone photoreceptors in the living human eye, and that the magnitude of the response scales with the strength of the stimulus flash. This suggests that the AO-OCT optoretinogram may represent a uniquely sensitive measure of disease-related dysfunction and effectiveness of experimental therapeutic interventions. The ability to measure these responses in rods and foveal cones could have significant translational impact, due respectively to their putative earlier susceptibility to disease and critical role in normal vision.
Acknowledgment
The authors gratefully acknowledge the assistance of Susan Garcia, additional funding from the UC Davis Eye Center, and a generous donation by Dixie Henderson.
Funding
National Eye Institute (R00-EY-026068, R01-EY-024239, R01-EY-026556).
Footnotes
Disclosures
The authors declare no conflicts of interest.
REFERENCES
- 1.Corless JM, Nature 237, 229 (1972). [DOI] [PubMed] [Google Scholar]
- 2.Chabre M and Cavaggioni A, Nature 244, 118 (1973). [DOI] [PubMed] [Google Scholar]
- 3.Jonnal RS, Rha J, Zhang Y, Cense B, Gao W, and Miller DT, Opt. Express 15, 16141 (2007). [DOI] [PMC free article] [PubMed] [Google Scholar]
- 4.Cooper RF, Tuten WS, Dubra A, Brainard DH, and Morgan JI, Biomed. Opt. Express 8, 5098 (2017). [DOI] [PMC free article] [PubMed] [Google Scholar]
- 5.Jonnal RS, Kocaoglu OP, Wang Q, Lee S, and Miller DT, Biomed. Opt. Express 3, 104 (2012). [DOI] [PMC free article] [PubMed] [Google Scholar]
- 6.Hillmann D, Spahr H, Pfäffle C, Sudkamp H, Franke G, and Hüttmann G, Proc. Natl. Acad. Sci. USA 113, 13138 (2016). [DOI] [PMC free article] [PubMed] [Google Scholar]
- 7.Azimipour M, Migacz JV, Zawadzki RJ, Werner JS, and Jonnal R, Optica 6, 300 (2019). [DOI] [PMC free article] [PubMed] [Google Scholar]
- 8.Zhang F, Kurokawa K, Lassoued A, Crowell JA, and Miller DT, Proc. Natl. Acad. Sci. USA 116, 7951 (2019). [DOI] [PMC free article] [PubMed] [Google Scholar]
- 9.Zhang P, Zawadzki RJ, Goswami M, Nguyen PT, Yarov-Yarovoy V, Burns ME, and Pugh EN, Proc. Natl. Acad. Sci. USA 114, E2937 (2017). [DOI] [PMC free article] [PubMed] [Google Scholar]
- 10.Srinivasan VJ, Wojtkowski M, Fujimoto JG, and Duker JS, Opt. Lett 31, 2308 (2006). [DOI] [PubMed] [Google Scholar]
- 11.Lu CD, Lee B, Schottenhamml J, Maier A, Pugh EN, and Fujimoto JG, Invest. Ophthalmol. Visual Sci 58, 4632 (2017). [DOI] [PMC free article] [PubMed] [Google Scholar]
- 12.Azimipour M, Jonnal RS, Werner JS, and Zawadzki RJ, Opt. Lett 44, 4219 (2019). [DOI] [PMC free article] [PubMed] [Google Scholar]
- 13.Huber R, Wojtkowski M, and Fujimoto JG, Opt. Express 14, 3225 (2006). [DOI] [PubMed] [Google Scholar]
- 14.Migacz JV, Gorczynska I, Azimipour M, Jonnal R, Zawadzki RJ, and Werner JS, Biomed. Opt. Express 10, 50 (2019). [DOI] [PMC free article] [PubMed] [Google Scholar]
- 15.“American national standard for safe use of lasers,” ANSI Z136.1 (Laser Institute of America, 2014). [Google Scholar]
- 16.Rushton W and Henry G, Vis. Res 8, 617 (1968). [DOI] [PubMed] [Google Scholar]
- 17.Sabesan R, Hofer H, and Roorda A, PLoS ONE 10, e0144891 (2015). [DOI] [PMC free article] [PubMed] [Google Scholar]
- 18.Stevenson S and Roorda A, Proc. SPIE 5688, 145 (2005). [Google Scholar]
- 19.Azimipour M, Zwadzki RJ, Gorczynska I, Migacz JV, Werner JS, and Jonnal RS, PLoS ONE 113, 13138 (2018). [DOI] [PMC free article] [PubMed] [Google Scholar]
- 20.Bizheva K, Pflug R, Hermann B, Povazay B, Sattmann H, Qiu P, Anger E, Reitsamer H, Popov S, Taylor JR, Unterhuber A, Ahnelt P, and Drexler W, Proc. Natl. Acad. Sci. USA 103, 5066 (2006). [DOI] [PMC free article] [PubMed] [Google Scholar]
- 21.Zhang Q-X, Lu R-W, Messinger JD, Curcio CA, Guarcello V, and Yao X-C, Sci. Rep 3, 2644 (2013). [DOI] [PMC free article] [PubMed] [Google Scholar]


