

Abstract
Background
The cytochromes P450 are a superfamily of enzymes that control the synthesis of the biologically active form of vitamin D, 1,25‐dihydroxyvitamin D3. These enzymes contribute to the formation of 1,25‐dihydroxyvitamin D3, which starts with a 25‐hydroxylation by CYP2R1 and CYP27A1 and a subsequent 1α‐hydroxylation via CYP27B1.
Methods
By using quantitative real‐time polymerase chain reaction (qRT‐PCR), we analyzed the expression ratio of CYP2R1, CYP27A1 and CYP27B1 genes within the vitamin D metabolic pathway in a total of 75 colorectal cancer (CRC) tissues compared to the adjacent tissues. Furthermore, we evaluated the association of CYP27B1 rs4646536 and CYP2R1 rs12794714 and rs10766196 polymorphisms with CRC risk in a total of 490 subjects, including 245 CRC patients and 245 non‐cancer controls. The genotyping was performed using tetra‐primer amplification refractory mutation system polymerase chain reaction (TP‐ARMS–PCR) method.
Results
The results indicated 2.3 and 2.7 upregulation of CYP2R1 and CYP27B1 genes in colorectal cancer tissues compared to the adjacent tissues, respectively. Rs12794714 AG genotype increased the risk of CRC (P = .03). Furthermore, a significant association was observed under the dominant inheritance model (P = .039).
Conclusion
CYP2R1 and CYP27B1 genes were over‐expressed in CRC samples compared to the adjacent control tissues. Furthermore, CYP2R1 rs12794714 variant was associated with the risk of CRC in the studied samples. CYP2R1 rs10766196 and CYP27B1 rs4646536 are not responsible for CYP2R1 and CYP27B1 genes expression alteration, respectively, but CYP2R1 rs12794714 polymorphism may be the reason of CYP2R1 upregulation and increased the risk of CRC.
Keywords: colorectal cancer, CYP27B1, CYP2R1, single‐nucleotide polymorphism, vitamin D
Patients and controls were recruited into this case‐control study, from Gastroenterology and Liver Diseases Research Center. Then, for the first step, total RNA was extracted from fresh frozen CRC tissues and the noncancerous tissues and the qRT‐PCR reaction was performed in 96‐well plates. The qRT‐PCR amplification efficiency was assessed using LinRegPCR software. In the second step, Genomic DNA was extracted from peripheral blood and SNPs frequencies were carried out by TP ARMS PCR. Analysis of inheritance models was performed using the online software.

1. INTRODUCTION
According to the global cancer project estimation, colorectal cancer (CRC) is the second leading cause of cancer‐related death worldwide, accounting for around 1.8 million new cases and 860 000 deaths in 2018. 1 The Iranian National Cancer Registry (IACR) Report shows that the incidence of CRC has increased during the last 25 years. 2 Genetic factors, epigenetic alterations, and environmental factors may be associated with CRC progression. 3 , 4 Vitamin D is a steroid hormone and is involved in cell proliferation and differentiation. 5 Multiple lines of evidence have shown the vitamin D pathway dysregulation in different types of cancer, for instance, cytochrome P450 (CYP) genes such as CYP2R1, CYP27A1, and CYP27B1. 6 , 7 , 8 In summary, vitamin D synthesis is as follows: CYP2R1 and CYP27A1 convert vitamin D to circulating 25(OH)D. Then, CYP27B1 converts 25(OH)D to 1, 25‐dihydroxyvitamin D, which is the biologically active form of the vitamin D. 9 Increased concentrations of CYP27A1 had been reported in the nuclei of normal colonic epithelia, aberrant crypt foci (ACF), and adenomatous polyps. 7 The primary site of CYP27B1 expression is in the proximal tubule of the kidney, but it is also expressed in other tissues such as the colon. 10 , 11 CYP2R1 is expressed in colon; however, liver is the primary site of CYP2R1 expression. 12 , 13 On the other hand, single‐nucleotide polymorphisms (SNPs) could modify the gene expression and, consequently, influence the risk of cancer. 14 Additionally, numerous studies suggested that SNPs in the CYP2R1 and CYP27B1 were found to be associated with CRC risk. 15 , 16 Gong et al have shown the association between intronic CYP27B1 rs4646536, located at the long arm of chromosome 12, and CRC risk. However, Dong et al did not find any significant association between this polymorphism and colon cancer. 15 , 17 Nam et al 18 hypothesized that the CYP2R1 rs12794714 and rs10766196 variants, both located at the CpG island, may modulate the gene transcription and were associated with the risk of developing type 1 diabetes. Furthermore, CYP2R1 rs12794714 was found to significantly associate with CRC and serum level of 25(OH)D3. 16 While several studies have investigated CYP27B1 and CYP2R1 expression and genetic association separately in CRC, only a few of them have simultaneously investigated the expression and genetic association of CYP27B1 and CYP2R1 with CRC. Hence, the current study aimed to investigate the relation between CYP2R1, CYP27B1, and CYP27A1 expressions and CRC. We also intended to assess the contribution of CYP2R1 and CYP27B1 polymorphisms in the pathogenesis of CRC in a sample of Iranian population.
2. MATERIALS AND METHODS
2.1. Study population
Colorectal cancer patients were identified in endoscopy, oncology, or surgery clinics from July 2012 to December 2015. For DNA extraction, blood samples were obtained from 245 patients with sporadic colorectal cancer and 245 age‐ and sex‐matched cancer‐free controls and collected in ethylene‐diamine tetra acetic acid (EDTA) tubes. Patients with a history of hereditary or malignant diseases, and diseases affecting the digestive system were excluded from the study. For expression analysis, a total of 75 CRC fresh colorectal cancer tissues and adjacent control tissues were obtained from the Institute for Gastroenterology and Liver Diseases (Shahid Beheshti University of Medical Sciences). All specimens were immediately stored at −80°C until RNA extraction. Patients who had undergone radiotherapy or chemotherapy were excluded from expression analysis. This case‐control study was approved by the Gastroenterology and Liver Diseases Research Center Ethics Committee (Code: IR.SBMU.RCGLD.REC.1397.006). Written informed consent was obtained from all participants before entering the study.
2.2. RNA isolation and reverse transcription
Total RNA was extracted from fresh‐frozen CRC tissues and the noncancerous tissues using a GeneAll Hybrid‐R™ RNA purification kit (Geneall Biotechnology Co. Ltd) according to the manufacturer's protocol. The quantity and the quality of the total extracted RNA were estimated using NanoDrop® ND‐1000 spectrophotometer (Thermo Fisher Scientific). The RNA purity was evaluated according to the A260/A280 ratio. The integrity of RNA was assessed by electrophoresis on a denaturing 1% agarose gel. Complementary DNA (cDNA) was reversely transcribed from 0.5 to 1 μg of DNase I‐treated RNA using a Revert Aid First‐Strand cDNA Synthesis Kit according to manufacturer instruction (Thermo Fisher Scientific).
2.3. Quantitative real‐time PCR
The quantitative real‐time PCR (qRT‐PCR) reaction was performed in 96‐well plates using 2.0X RealQ‐PCR Master Mix® with SYBR Green (Ampliqon) on ABI StepOnePlus™ Real‐Time PCR Detection System (Applied Biosystems). All qRT‐PCR primers were designed by Allele ID 6 software (Premier Biosoft) and described in Table 1. Each reaction mixture consisted of 1 µL cDNA (10 ng), 10 µL 2X RealQ‐PCR Master Mix®, 1 µL (10 pmol/µL) of both forward and reverse primers, and 7 µL of PCR‐grade water, equating to a final volume of 20 µL. The beta‐2 microglobulin (β2M) mRNA was used as the reference gene. β2M was selected as the reference gene according to previous research for identification of housekeeping control genes in colorectal cancer. 19 The thermal profile of the reaction was performed using the following conditions: initial denaturation at 95°C for 15 minutes; followed by 40 cycles at 95°C for 15 seconds and 60°C for 60 seconds followed by melting curve stage assessment. The melting curve profile and agarose gel electrophoresis were performed to verify the specificity of primers and the authenticity of the PCR products.
TABLE 1.
List of primer pairs for qRT‐PCR
| Genes | Forward primer | Reverse primer | Amplicon size (bp) |
|---|---|---|---|
| CYP2R1 | CCGGGGCTGCCATTTATCG | AAACTGAAGATCTCTCCGTACACC | 107 |
| CYP27B1 | GTCCAGACAGCACTCCACTC | ACCACAGGGTACAGTCTTAGC | 137 |
| CYP27A1 | CACGACATCCAACACGCTGAC | CCACAGGGTAGAGACGCAGAG | 185 |
| Beta‐2‐microglogulin | TGTCTTTCAGCAAGGACTGGT | TGCTTACATGTCTCGATCCCAC | 143 |
Abbreviation: bp, base pair.
2.4. DNA extraction and genotyping
Genomic DNA was extracted from peripheral blood leukocytes using the standard salting‐out procedure and stored at −20°C until further use. 20 The primers used to amplify the target DNA sequences, which were designed by using Primer1 online software available from http://primer1.soton.ac.uk/primer1.html, are presented in Table 2. Three single‐nucleotide polymorphisms, including CYP27B1 rs4646536 and CYP2R1 rs12794714 and rs10766196, were amplified using polymerase chain reaction (PCR) contained 2 µL template DNA (100‐200 ng DNA), 12.5 µL Taq DNA Polymerase 2X Master Mix (Amplicon), 1 µL of each primer (10 pmol), and 6.5 µL DNase‐free water in a total volume of 25 µL. PCR cycling was performed on a GeneTouch thermocycler (BIOER). Amplification cycling reactions were carried out under the following conditions: an initial denaturation at 95°C for 5 minutes, followed by 32 cycles at 95°C for 30 seconds, annealing for 50 seconds at different temperatures (Table 2), and extension at 72°C for 1 minute, then a final incubation step at 72°C for 7 minutes. Finally, the products were separated via electrophoresis on 2% agarose gel containing RedSafe stain in 0.5× tris/borate/EDTA (TBE). To confirm the accuracy of genotyping, the randomly selected samples (10%) were re‐genotyped. SNPs had the following characteristics: (a) had a minor allele frequency greater than 10% and (b) were potentially functional predicted by in silico analysis.
TABLE 2.
Primer sequences for CYP27B1 rs4646536 and CYP2R1 rs12794714 and rs10766196 genotyping
| SNP | Primer | Primer Sequence (5′‐3′) | Amplicon size | Ta |
|---|---|---|---|---|
| CYP27B1 rs4646536 | FI primer | CTTCAGCCCCTAGCCTCATCTGGT | 149 bp (C allele) | |
| RI primer | TCTAGGTTGCAAAGCACAAAATGGAGAAAG | 212 bp (T allele) | 58°C | |
| FO primer | GCAACTAGTGGATGGAAGCAGGGAGAT | 307 bp (Control) | ||
| RO primer | TAGGAGAGTGTTTGAGAACAGGGTTGGG | |||
| CYP2R1 rs12794714 | FI primer | TTTCTCATGTAGACATGGGGAAGCGCA | 152 bp (G allele) | |
| RI primer | ATCTATTCCCTGGCAGCCTCAGCC | 205 bp (A allele) | 63°C | |
| FO primer | CATAAGTCCAACCAGGAAGGCCCTG | 307 bp (Control) | ||
| RO primer | CGATGTGGAAGCTTTGGAGAGCTGAAGA | |||
| CYP2R1 rs10766196 | FI primer | CTTGATTTTCCGACAAGCCGCGTTCG | 127 bp (A allele) | |
| RI primer | TCTGCCTCGCAGCTCTGTGGAATCT | 187 bp (G allele) | 63.6°C | |
| FO primer | AGCAAACGCCTACACCAGTCGTTCGTC | 264 bp (Control) | ||
| RO primer | TCCGAGGCGATCCAGTCCTGATTTTCC |
The nucleotide specificity is indicated in parentheses.
Abbreviations: bp, base pair; F, forward; I, inner; O, outer; R, reverse; SNP, single‐nucleotide polymorphism; Ta, annealing temperature.
2.5. Statistical analysis
Analysis of inheritance models and deviations from Hardy‐Weinberg equilibrium were performed using the online SNPStats program available from http://bioinfo.iconcologia.net/SNPstats and MEDCALC online software available from https://www.medcalc.org/calc/odds_ratio. The qRT‐PCR amplification efficiency was assessed using LinRegPCR software (version: 2017.1) and for each sample, the cycle threshold (Ct) and mean PCR efficiencies were determined. All the analyses were performed using SPSS 16.0 unless otherwise specified. The two‐tailed t test was used to analyze the association between the expression levels and the clinicopathological features of the CRC patients. P > .05 was considered statistically significant.
3. RESULTS
3.1. CYP2R1, CYP27B1, and CYP27A1 expression levels in colorectal cancer tissues
We measured CYP27B1, CYP27A1, and CYP2R1 expression levels using qRT‐PCR. Overall, the results indicated that 2.3 and 2.7 upregulation of CYP2R1 and CYP27B1 genes in colorectal cancer tissues compared to the adjacent tissues, respectively. CYP2R1 and CYP27B1 genes' expression was significantly upregulated in CRC tissues compared with adjacent tissues (Figure 1A,B). CYP27A1 gene expression did not show any significant expression alteration when comparing the CRC tissues with adjacent tissues (Figure 1A). The correlations between the expression of CYP2R1, CYP27B1, and CYP27A1 genes and clinicopathological features are shown in Table 3. None of the clinicopathological characteristics were significantly correlated with these genes.
FIGURE 1.
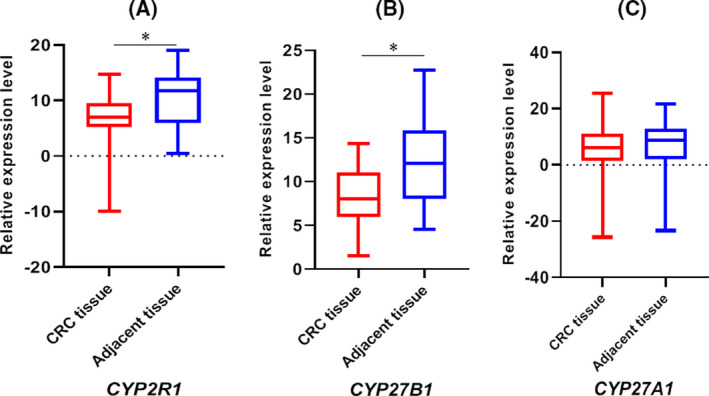
The relative expression levels (ΔCt) of CYP2R1 (A), CYP27B1 (B), and CYP27A1 (C) genes in CRC samples compared to controls. A and B suggest that CYP2R1 and CYP27B1 genes were upregulated in CRC samples compared with controls. The mean ± standard deviation (SD) for CYP2R1 CRC tissues and adjacent tissues were 8.31 ± 6.53 and 12.21 ± 5.85, respectively. The mean ± SD for CYP27B1 CRC tissues and adjacent tissues were 7.78 ± 3.76 and 12.21 ± 5.59, respectively. As shown in C the expression of CYP27A1 gene was not different between the studied groups. The mean ± SD for CYP27A1 CRC tissues and adjacent tissues were 4.01 ± 14.73 and 5.07 ± 13.95, respectively. The relative expression levels comparison between CRC samples and controls was applied by paired t test. The asterisk sign (*) represents P < .05
TABLE 3.
The correlation of CYP2R1, CYP27B1, and CYP27A1 expression levels (ΔCt) and clinicopathological features of the CRC patients
| Factors | No. of patients (%) | CYP2R1 | CYP27B1 | CYP27B1 | |||
|---|---|---|---|---|---|---|---|
| Mean ± SD | P value | Mean ± SD | P value | Mean ± SD | P value | ||
| Age (y) | |||||||
| >60 | 40 (53) | 8.82 ± 3.6 | .35 | 8.03 ± 4.12 | .63 | 5.41 ± 5.15 | .79 |
| ≤60 | 35 (47) | 7.97 ± 4.01 | 7.87 ± 3.20 | 4.37 ± 4.24 | |||
| Gender | |||||||
| Male | 44 (59) | 10.11 ± 3.54 | .22 | 7.92 ± 3.81 | .37 | 6.73 ± 6.22 | .29 |
| Female | 31 (41) | 8.93 ± 3.17 | 6.76 ± 3.43 | 4.06 ± 4.74 | |||
| Stage | |||||||
| I & II | 55 (73) | 8.72 ± 8.45 | .65 | 8.53 ± 4.33 | .42 | 5.44 ± 9.38 | .12 |
| III & IV | 20 (27) | 9.77 ± 8.33 | 7.73 ± 5.84 | 2.75 ± 7.88 | |||
| Location | |||||||
| Colon | 50 (67) | 7.17 ± 6.38 | .48 | 8.64 ± 3.86 | .12 | 4.93 ± 2.26 | .19 |
| Rectum | 25 (33) | 9.74 ± 5.83 | 6.40 ± 4.82 | 5.84 ± 3.08 | |||
3.2. Genotyping
A total of 245 CRC patients (130 males and 115 females) with an average age of 54.87 ± 10.31 years and 245 cancer‐free controls (128 males and 117 females) with a mean age of 53.11 ± 11.22 years were analyzed in our study. All controls were from the same ethnic background (Iranian population). The CRC patients and normal controls were well matched concerning their ages and sex ratio (P > .05). Table 4 describes the demographic variables and clinical characteristics of the studied subjects. Our study investigated the association of CYP27B1 rs4646536 and CYP2R1 rs12794714 and rs10766196 polymorphisms with CRC risk in recessive and dominant inheritance models. Genotype and allelic frequencies of CYP27B1 rs4646536 and CYP2R1 rs12794714 and rs10766196 polymorphisms are shown in Table 5. The genotype distributions of CYP27B1 rs4646536 and CYP2R1 rs12794714 and rs10766196 polymorphisms were in Hardy‐Weinberg equilibrium (P > .05). Regarding the CYP2R1 rs12794714, the AG genotype increased the risk of CRC (P = .03; odds ratio [OR] = 1.55; 95% confidence interval [CI]: 1.03‐2.34). In addition, the genotype frequencies showed significant differences under the dominant model (P = .03; OR = 1.50; 95% CI, 1.02‐2.21). There was no significant association between the CYP27B1 rs4646536 and CYP2R1 rs10766196 alleles and genotypes and CRC risk in any of the inheritance models (Table 5). Figure 2 represents 2% agarose gel electrophoresis for identification of CYP2R1 rs12794714 genotypes.
TABLE 4.
Demographic data and clinical characteristics of the study participants for association study
| Characteristics | CRC (n = 245) patients | non‐cancer controls (n = 245) |
|---|---|---|
| Median age, y | 54.87 ± 10.31 | 53.11 ± 11.22 |
| Gender | ||
| Male | 130 | 128 |
| Female | 115 | 117 |
| Primary tumor location | ||
| Colon | 64% | |
| Rectum | 25% | |
| Cecum | 11% | |
| Differentiation | ||
| Well‐differentiated | 41% | |
| Moderately differentiated | 22% | |
| Poorly differentiated | 8% | |
| Not determined | 29% | |
| Cigarette smoking | ||
| No | 74% | |
| Yes | 26% | |
| Clinical stages, TNM | ||
| I | 16% | |
| II | 48% | |
| III | 30% | |
| IV | 6% | |
TABLE 5.
Allele and genotype frequencies of CYP27B1 rs4646536 CYP2R1 rs12794714 and rs10766196 in CRC patients and controls. The SNPStats and MEDCALC online software were used for descriptive analysis and analysis of single SNPs: dominant and recessive inheritance models
| Genotype/Allele |
Case N (%) |
Control N (%) |
OR (95% CI) | P value |
|---|---|---|---|---|
|
CYP27B1 rs4646536 C>T | ||||
| T/T | 117 (48) | 111 (45) | 1 (reference) | |
| C/T | 96 (39) | 94 (38) | 1.03 (0.70‐1.52) | .87 |
| C/C | 32 (13) | 40 (16) | 1.32 (0.77‐2.24) | .31 |
| T/T vs C/T+C/C | 1.10 (0.77‐1.57) | .59 | ||
| T/T+C/T vs C/C | 1.30 (0.79‐2.15) | .31 | ||
| T | 316 (64) | 330 (67) | 0.88 (0.68‐1.15) | .35 |
| C | 174 (36) | 160 (33) | 1.14 (0.87‐1.48) | .35 |
|
CYP2R rs12794714 G>A | ||||
| G/G | 64 (26.1) | 85 (34.7) | 1 (reference) | |
| A/G | 131 (53.5) | 112 (45.7) | 1.55 (1.03‐2.34) | .03 |
| A/A | 50 (20.4) | 48 (19.6) | 1.38 (0.83‐2.31) | .21 |
| G/G vs A/G‐A/A | 1.50 (1.02‐2.21) | .039 | ||
| G/G‐A/G vs A/A | 1.05 (0.68‐1.64) | .82 | ||
| G | 259 (53) | 282 (58) | 0.83 (0.64‐1.06) | .14 |
| A | 231 (47) | 208 (42) | 1.21 (0.94‐1.56) | .14 |
|
CYP2R rs10766196 A>G | ||||
| A/A | 97 (39.6) | 90 (36.7) | 1 (reference) | |
| A/G | 127 (51.8) | 127 (51.8) | 0.93 (0.64‐1.35) | .39 |
| G/G | 21 (8.6) | 28 (11.4) | 0.70 (0.37‐1.31 | .26 |
| A/A vs A/G‐G/G | 0.89 (0.62‐1.28) | .52 | ||
| A/A‐A/G vs G/G | 0.73 (0.40‐1.32) | .29 | ||
| A | 321 (66) | 307 (63) | 1.13 (0.87‐1.47) | .35 |
| G | 169 (34) | 183 (37) | 0.88 (0.68‐1.15) | .35 |
P < .05 was considered statistically significant.
Abbreviations: CI, confidence interval; OR, odds ratio.
FIGURE 2.

A representative 2% agarose gel electrophoresis of for identification of the CYP2R1 rs12794714 genotypes. Lane L, 100 bp DNA ladder; lanes 1 and 2: AG genotype; lanes 3: AA genotype; and lanes 4: GG genotype
4. DISCUSSION
Vitamin D deficiency is inversely associated with the incidence and mortality of colorectal cancer. 21 Under physiological conditions, CYP27B1 and CYP2R1 genes control the vitamin D synthesis, and vitamin D also controls the expression level of these genes. 9 , 22 CYP2R1 and CYP27B1 are dysregulated in different types of cancer, but the mechanism behind the dysregulation is not clearly defined. 23 , 24 , 25 , 26 In the current study, we first measured the expression levels of CYP27A1, CYP27B1, and CYP2R1 in CRC samples. CYP27B1 and CYP2R1 expression ratios were significantly different when comparing CRC tissues with the adjacent tissues. In comparison with our results, dysregulated expression of CYP2R1 and CYP27B1 genes had been shown in different types of cancer, including oral squamous cell carcinomas and colorectal cancer. 6 , 27 We did not find any correlation between mentioned genes expression levels and clinicopathological characteristics in the studied patients. A number of inconsistent studies have shown that SNPs in both CYP27B1 and CYP2R1 genes may or may not be related to the CRC risk and circulating concentrations of vitamin D metabolites. 15 , 16 , 17 , 28 , 29 , 30 Furthermore, at the protein level, SNPs in the CYP27B1 gene body could alter the CYP27B1 enzymatic activity. 31 To clarify whether variants in the vitamin D metabolism pathway were associated with CRC risk, we conducted a case‐control study to investigate the association between three SNPs in CYP27B1 and CYP2R1 genes and CRC risk. Regarding the CYP2R1 rs12794714 polymorphism, AG genotype increased the risk of CRC in the patients (P = .03; odds ratio [OR] = 1.55; 95% confidence interval [CI], 1.03‐2.34). In addition, we observed that CYP2R1 rs12794714 was associated with the risk of CRC under the dominant model (P = .039 OR = 1.50; 95% CI, 1.02‐2.21). In a previous study, Nam et al 18 showed that the CYP2R1 rs12794714 GG genotype and CYP2R1 rs10766196 AA genotype were associated with the risk of developing type 1 diabetes in Korean children. Dorjgochoo et al 32 also reported no association between CYP2R1 rs12794714 polymorphism and the risk of breast cancer in Chinese women. In African Americans, CYP2R1 rs12794714 was associated with a decreased risk of CRC. 16 The AAGA haplotype of CYP2R1 rs7936142‐rs12794714‐rs2060793‐rs16930609 was associated with a lower 25(OH)D concentration in the healthy Chinese population. 33 Under the additive and recessive models, the exonic variant CYP2R1 rs12794714 was significantly associated with plasma 25(OH)D concentration in northeastern Han Chinese children and people of Arab origin. 31 , 34 According to the HaploReg, 35 RegulomeDB, 36 and PROMO 37 online databases, it is suggested that the CYP2R1 rs12794714 variant may influence the binding affinity of several transcription factors, including ELF1, HNF4, SMARCA4, CDX2, and PEA3 in different cell types such as the Caco‐2 colon cancer cell line. In addition, according to rSNPBase, 38 CYP2R1 rs12794714 may affect the proximal and distal regulation and RNA binding protein‐mediated regulation. These transcription factors have important functions. HNF4α is a highly conserved transcription factor that plays a role as a tumor suppressor gene or an oncogene in colon cancer. 39 CDX2 has a role in the progression of colorectal cancer and nominated as an independent prognostic factor in CRC. Moreover, it serves a clinically useful marker for epithelial neoplasms of the gastrointestinal tract. Previous researches showed that CDX2 might suppress colorectal tumorigenesis. Furthermore, CRC with advanced tumor stage and high tumor grade lost the CDX2 expression. 40 , 41 Pea3 is a prognostic marker in CRC, and the expression of Pea3 promotes the invasive and metastatic potential of colorectal carcinoma. 42 Based on the results of our study, the distributions of CYP27B1 rs4646536 and CYP2R1 rs10766196 were not associated with the risk of CRC in any inheritance model (P > .05). Furthermore, these SNPs showed no significant differences in the allele and genotype frequencies when comparing CRC patients with healthy individuals (P > .05). In agreement with the results of our study, previous researches showed that there is no association between cases and controls in different types of cancer. 43 , 44 Conversely, in contrast to our study, in Chinese population, CYP27B1 rs4646536 CC genotype reduced the risk of colorectal cancer compared with the TT genotype. 15 Penna‐Martinez et al 45 revealed that the rs10877012A/rs4646536T haplotype within the CYP27B1 gene might be protective against papillary thyroid carcinoma. Dong et al 17 suggested a lower risk of distal colon cancer among common allele homozygotes for CYP27B1 rs4646536 T>C in the individuals with at least one copy of the CYP24A1 rs2762942 C>T rare allele.
In conclusion, we showed that CYP2R1 and CYP27B1 genes were upregulated in CRC tissues compared to the adjacent control tissues. Besides, CYP2R1 rs12794714 variant was associated with the risk of CRC in the studied samples. One of the limitations of this study was that the association and expression studies were performed on different samples, and we cannot correlate the tissue expression with the different genotypes. Furthermore, investigations with a larger sample size are recommended to estimate the role of rs12794714 variant in the expression of CYP2R1.
AUTHOR CONTRIBUTIONS
Hossein Sadeghi performed experiments and analyzed the data. Zeeba Kamaliyan, Unes Sahebi, Roohollah Mohseni, and Ehsan Nazemalhosseini‐Mojarad performed experiments. Naser Aghaei, Mohammad Reza Zali, and Hamid Asadzadeh Aghdaei performed bioinformatic analyses and co‐wrote the article. Reza Mirfakhraie supervised the research, designed experiments, and co‐wrote the article. Arfa Moshiri supervised the research, designed experiments, and co‐wrote the article.
ACKNOWLEDGMENTS
The authors would like to thank the “Gastroenterology and Liver Diseases Research Center, Research Institute for Gastroenterology and Liver Diseases of the Shahid Beheshti University of Medical Sciences (RIGLD) (Code: 1037)” for financial support.
Sadeghi H, Kamaliyan Z, Mohseni R, et al. Dysregulation of vitamin D synthesis pathway genes in colorectal cancer: A case‐control study. J Clin Lab Anal.2021;35:e23617 10.1002/jcla.23617
Contributor Information
Reza Mirfakhraie, Email: reza_mirfakhraie@yahoo.com.
Arfa Moshiri, Email: arfa.moshiri@gmail.com.
DATA AVAILABILITY STATEMENT
The data that support the findings of this study are available from the corresponding author upon reasonable request.
REFERENCES
- 1. Bray F, Ferlay J, Soerjomataram I, Siegel RL, Torre LA, Jemal A. Global cancer statistics 2018: GLOBOCAN estimates of incidence and mortality worldwide for 36 cancers in 185 countries. CA Cancer J Clin. 2018;68(6):394‐424. [DOI] [PubMed] [Google Scholar]
- 2. Dolatkhah R, Somi MH, Bonyadi MJ, Asvadi Kermani I, Farassati F, Dastgiri S. Colorectal cancer in Iran: molecular epidemiology and screening strategies. J Cancer Epidemiol. 2015;2015:643020. [DOI] [PMC free article] [PubMed] [Google Scholar]
- 3. Markowitz SD, Bertagnolli MM. Molecular basis of colorectal cancer. N Engl J Med. 2009;361(25):2449‐2460. [DOI] [PMC free article] [PubMed] [Google Scholar]
- 4. Kheirelseid EA, Miller N, Kerin MJ. Molecular biology of colorectal cancer: review of the literature. Am J Mol Biol. 2013;3:72‐80. [Google Scholar]
- 5. González‐Sancho JM, Larriba MJ, Ordóñez‐Morán P, Pálmer HG, Munoz A. Effects of 1α, 25‐dihydroxyvitamin D3 in human colon cancer cells. Anticancer Res. 2006;26(4A):2669‐2681. [PubMed] [Google Scholar]
- 6. Sundaram K, Sambandam Y, Tsuruga E, Wagner CL, Reddy SV. 1α, 25‐dihydroxyvitamin D3 modulates CYP2R1 gene expression in human oral squamous cell carcinoma tumor cells. Horm Cancer. 2014;5(2):90‐97. [DOI] [PMC free article] [PubMed] [Google Scholar]
- 7. Matusiak D, Benya RV. CYP27A1 and CYP24 expression as a function of malignant transformation in the colon. J Histochem Cytochem. 2007;55(12):1257‐1264. [DOI] [PubMed] [Google Scholar]
- 8. Zhalehjoo N, Shakiba Y, Panjehpour M. Gene expression profiles of CYP24A1 and CYP27B1 in malignant and normal breast tissues. Mol Med Rep. 2017;15(1):467‐473. [DOI] [PubMed] [Google Scholar]
- 9. Bikle DD. Vitamin D metabolism, mechanism of action, and clinical applications. Chem Biol. 2014;21(3):319‐329. [DOI] [PMC free article] [PubMed] [Google Scholar]
- 10. Zehnder D, Bland R, Walker EA, et al. Expression of 25‐hydroxyvitamin D3–1α‐hydroxylase in the human kidney. J Am Soc Nephrol. 1999;10(12):2465‐2473. [DOI] [PubMed] [Google Scholar]
- 11. Zehnder D, Bland R, Williams MC, et al. Extrarenal expression of 25‐hydroxyvitamin D3–1α‐hydroxylase. J Clin Endocrinol Metab. 2001;86(2):888‐894. [DOI] [PubMed] [Google Scholar]
- 12. Zhu JG, Ochalek JT, Kaufmann M, Jones G, DeLuca HF. CYP2R1 is a major, but not exclusive, contributor to 25‐hydroxyvitamin D production in vivo. Proc Natl Acad Sci USA. 2013;110(39):15650‐15655. [DOI] [PMC free article] [PubMed] [Google Scholar]
- 13. Wierzbicka J, Binek A, Ahrends T, et al. Differential antitumor effects of vitamin D analogues on colorectal carcinoma in culture. Int J Oncol. 2015;47(3):1084‐1096. [DOI] [PMC free article] [PubMed] [Google Scholar]
- 14. Deng N, Zhou H, Fan H, Yuan Y. Single nucleotide polymorphisms and cancer susceptibility. Oncotarget. 2017;8(66):110635. [DOI] [PMC free article] [PubMed] [Google Scholar]
- 15. Gong C, Long Z, Yu Y, et al. Dietary factors and polymorphisms in vitamin D metabolism genes: the risk and prognosis of colorectal cancer in northeast China. Sci Rep. 2017;7(1):1‐12. [DOI] [PMC free article] [PubMed] [Google Scholar]
- 16. Pibiri F, Kittles RA, Sandler RS, et al. Genetic variation in vitamin D‐related genes and risk of colorectal cancer in African Americans. Cancer Causes Control. 2014;25(5):561‐570. [DOI] [PMC free article] [PubMed] [Google Scholar]
- 17. Dong LM, Ulrich CM, Hsu L, et al. Vitamin D related genes, CYP24A1 and CYP27B1, and colon cancer risk. Cancer Epidemiol Biomarkers Prev. 2009;18(9):2540‐2548. [DOI] [PMC free article] [PubMed] [Google Scholar]
- 18. Nam HK, Rhie YJ, Lee KH. Vitamin D level and gene polymorphisms in Korean children with type 1 diabetes. Pediatr Diabetes. 2019;20(6):750‐758. [DOI] [PubMed] [Google Scholar]
- 19. Kheirelseid EA, Chang KH, Newell J, Kerin MJ, Miller N. Identification of endogenous control genes for normalisation of real‐time quantitative PCR data in colorectal cancer. BMC Mol Biol. 2010;11(1):12. [DOI] [PMC free article] [PubMed] [Google Scholar]
- 20. Miller S, Dykes D, Polesky H. A simple salting out procedure for extracting DNA from human nucleated cells. Nucleic Acids Res. 1988;16:1215. [DOI] [PMC free article] [PubMed] [Google Scholar]
- 21. Morales‐Oyarvide V, Meyerhardt JA, Ng K. Vitamin D and physical activity in patients with colorectal cancer: epidemiological evidence and therapeutic implications. Cancer J. 2016;22(3):223‐231. [DOI] [PMC free article] [PubMed] [Google Scholar]
- 22. Takeyama K‐I, Kato S. The vitamin D3 1alpha‐hydroxylase gene and its regulation by active vitamin D3. Biosci Biotechnol Biochem. 2011;75(2):208‐213. [DOI] [PubMed] [Google Scholar]
- 23. Bises G, Kállay E, Weiland T, et al. 25‐hydroxyvitamin D3–1α‐hydroxylase expression in normal and malignant human colon. J Histochem Cytochem. 2004;52(7):985‐989. [DOI] [PubMed] [Google Scholar]
- 24. Brożyna AA, Jóźwicki W, Jochymski C, Slominski AT. Decreased expression of CYP27B1 correlates with the increased aggressiveness of ovarian carcinomas. Oncol Rep. 2015;33(2):599‐606. [DOI] [PMC free article] [PubMed] [Google Scholar]
- 25. Bennett RG, Wakeley SE, Hamel FG, High RR, Korch C, Goldner WS. Gene expression of vitamin D metabolic enzymes at baseline and in response to vitamin D treatment in thyroid cancer cell lines. Oncology. 2012;83(5):264‐272. [DOI] [PMC free article] [PubMed] [Google Scholar]
- 26. Jacobs ET, Kohler LN, Kunihiro AG, Jurutka PW. Vitamin D and colorectal, breast, and prostate cancers: a review of the epidemiological evidence. J Cancer. 2016;7(3):232‐240. [DOI] [PMC free article] [PubMed] [Google Scholar]
- 27. Cross HS, Bareis P, Hofer H, et al. 25‐Hydroxyvitamin D3–1α‐hydroxylase and vitamin D receptor gene expression in human colonic mucosa is elevated during early cancerogenesis. Steroids. 2001;66(3‐5):287‐292. [DOI] [PubMed] [Google Scholar]
- 28. Hibler EA, Klimentidis YC, Jurutka PW, et al. CYP24A1 and CYP27B1 polymorphisms, concentrations of vitamin D metabolites, and odds of colorectal adenoma recurrence. Nutr Cancer. 2015;67(7):1131‐1141. [DOI] [PMC free article] [PubMed] [Google Scholar]
- 29. Jorde R, Schirmer H, Wilsgaard T, et al. Polymorphisms related to the serum 25‐hydroxyvitamin D level and risk of myocardial infarction, diabetes, cancer and mortality. The Tromsø Study. PloS One. 2012;7(5):e37295. [DOI] [PMC free article] [PubMed] [Google Scholar]
- 30. Elkum N, Alkayal F, Noronha F, et al. Vitamin D insufficiency in Arabs and South Asians positively associates with polymorphisms in GC and CYP2R1 genes. PloS One. 2014;9(11):e113102. [DOI] [PMC free article] [PubMed] [Google Scholar]
- 31. Jacobs ET, Van Pelt C, Forster RE, et al. CYP24A1 and CYP27B1 polymorphisms modulate vitamin D metabolism in colon cancer cells. Cancer Res. 2013;73(8):2563‐2573. [DOI] [PMC free article] [PubMed] [Google Scholar]
- 32. Dorjgochoo T, Delahanty R, Lu W, et al. Common genetic variants in the vitamin D pathway including genome‐wide associated variants are not associated with breast cancer risk among Chinese women. Cancer Epidemiol Biomarkers Prev. 2011;20(10):2313‐2316. [DOI] [PMC free article] [PubMed] [Google Scholar]
- 33. Zhang Z, He JW, Fu WZ, Zhang CQ, Zhang ZL. An analysis of the association between the vitamin D pathway and serum 25‐hydroxyvitamin D levels in a healthy Chinese population. J Bone Mineral Res. 2013;28(8):1784‐1792. [DOI] [PubMed] [Google Scholar]
- 34. Zhang Y, Wang X, Liu Y, et al. The GC, CYP2R1 and DHCR7 genes are associated with vitamin D levels in northeastern Han Chinese children. Swiss Med Weekly. 2012;142:w13636. [DOI] [PubMed] [Google Scholar]
- 35. Ward LD, Kellis M. HaploReg v4: systematic mining of putative causal variants, cell types, regulators and target genes for human complex traits and disease. Nucleic Acids Res. 2016;44(D1):D877‐D881. [DOI] [PMC free article] [PubMed] [Google Scholar]
- 36. Boyle AP, Hong EL, Hariharan M, et al. Annotation of functional variation in personal genomes using RegulomeDB. Genome Res. 2012;22(9):1790‐1797. [DOI] [PMC free article] [PubMed] [Google Scholar]
- 37. Messeguer X, Escudero R, Farré D, Nuñez O, Martínez J, Albà MM. PROMO: detection of known transcription regulatory elements using species‐tailored searches. Bioinformatics. 2002;18(2):333‐334. [DOI] [PubMed] [Google Scholar]
- 38. Guo L, Du Y, Chang S, Zhang K, Wang J. rSNPBase: a database for curated regulatory SNPs. Nucleic Acids Res. 2014;42(D1):D1033‐D1039. [DOI] [PMC free article] [PubMed] [Google Scholar]
- 39. Chellappa K, Robertson GR, Sladek FM. HNF4α: a new biomarker in colon cancer? Biomarkers Med. 2012;6(3):297‐300. [DOI] [PMC free article] [PubMed] [Google Scholar]
- 40. Baba Y, Nosho K, Shima K, et al. Relationship of CDX2 loss with molecular features and prognosis in colorectal cancer. Clin Cancer Res. 2009;15(14):4665‐4673. [DOI] [PMC free article] [PubMed] [Google Scholar]
- 41. Graule J, Uth K, Fischer E, et al. CDX2 in colorectal cancer is an independent prognostic factor and regulated by promoter methylation and histone deacetylation in tumors of the serrated pathway. Clin Epigenetics. 2018;10(1):1‐12. [DOI] [PMC free article] [PubMed] [Google Scholar]
- 42. Mesci A, Taeb S, Huang X, Jairath R, Sivaloganathan D, Liu SK. Pea3 expression promotes the invasive and metastatic potential of colorectal carcinoma. World J Gastroenterol. 2014;20(46):17376. [DOI] [PMC free article] [PubMed] [Google Scholar]
- 43. Schäfer A, Emmert S, Kruppa J, et al. No association of vitamin D metabolism‐related polymorphisms and melanoma risk as well as melanoma prognosis: a case–control study. Arch Dermatol Res. 2012;304(5):353‐361. [DOI] [PMC free article] [PubMed] [Google Scholar]
- 44. Wise LA, Ruiz‐Narváez EA, Haddad SA, Rosenberg L, Palmer JR. Polymorphisms in vitamin D–related genes and risk of uterine leiomyomata. Fertil Steril. 2014;102(2):503‐510.e1. [DOI] [PMC free article] [PubMed] [Google Scholar]
- 45. Penna‐Martinez M, Ramos‐Lopez E, Stern J, et al. Impaired vitamin D activation and association with CYP24A1 haplotypes in differentiated thyroid carcinoma. Thyroid. 2012;22(7):709‐716. [DOI] [PMC free article] [PubMed] [Google Scholar]
Associated Data
This section collects any data citations, data availability statements, or supplementary materials included in this article.
Data Availability Statement
The data that support the findings of this study are available from the corresponding author upon reasonable request.