

SUMMARY
The testis expresses the largest number of genes of any mammalian organ, a finding that has long puzzled molecular biologists. Our single-cell transcriptomic data of human and mouse spermatogenesis provides evidence that this widespread transcription maintains DNA sequence integrity in the male germline by correcting DNA damage through a mechanism we term transcriptional scanning. We find that genes expressed during spermatogenesis display lower mutation rates on the transcribed strand and have low diversity in the population. Moreover, this effect is fine-tuned by the level of gene expression during spermatogenesis. The unexpressed genes, which in our model do not benefit from transcriptional scanning, diverge faster over evolutionary time-scales and are enriched for sensory and immune-defense functions. Collectively, we propose that transcriptional scanning shapes germline mutation signatures and modulates mutation rates in a gene-specific manner, maintaining DNA sequence integrity for the bulk of genes but allowing for faster evolution in a specific subset.
In-brief
The male germline cells in human and mice balance the protection of genomic integrity and the evolutionary benefit of genetic mutations through transcriptional scanning, a mechanism that preferentially coupling efficient DNA damage repair with high transcription activity.
Graphical Abstract

INTRODUCTION
It has been known for many years that the testis is the organ with the most complex transcriptome in terms of the number of expressed genes (Melé et al., 2015; Schmidt and Schibler, 1995; Soumillon et al., 2013). Widespread transcription in the testis has been reported to include over 80% of all protein-coding genes in human as well as in other species (Melé et al., 2015; Soumillon et al., 2013). Several hypotheses have been put forth to explain this observation (Kleene, 2001; Schmidt, 1996). Widespread expression may represent a functional requirement for the gene-products in question (Johnston et al., 2008; Schmidt, 1996). However, other organs containing more cell types – such as the brain – do not exhibit such high numbers of expressed genes (Brawand et al., 2011; Melé et al., 2015; Soumillon et al., 2013). Moreover, recent studies have shown that knocking-out many testis-enriched and evolutionarily-conserved genes does not cause male infertility in mice (Miyata et al., 2016). The notable discordance between the transcriptome and the proteome in the testis (Kleene, 2003; Wang et al., 2019) further supports the notion that the widespread transcription does not exclusively lead to protein production, as the central dogma of molecular biology would suggest.
A second hypothesis implicates leaky transcription during the massive chromatin remodeling that occurs throughout spermatogenesis as the cause of the observed widespread transcription (Necsulea and Kaessmann, 2014; Rathke et al., 2014; Schmidt, 1996). However, this model would predict more expression during later stages of spermatogenesis – when the genome is undergoing the most chromatin changes – in contradiction with previous observations (Naro et al., 2017; Rathke et al., 2014; Soumillon et al., 2013). Additionally, given the high energetic requirements of transcription, one would not expect such high levels of non-functional transcription (Frumkin et al., 2017; Huang et al., 2015; Lynch and Marinov, 2015).
Here we propose the ‘transcriptional scanning’ hypothesis, whereby widespread testis transcription facilitates germline DNA repair and ultimately modulates gene evolution rates. Using single-cell RNA-Seq (scRNA-Seq) data of human and mouse testes, we confirmed that widespread transcription originates from the germ cells. We found that spermatogenesis-expressed genes have lower germline mutation rates in the population compared to the unexpressed genes, and that the signature of transcription-coupled repair (TCR) on these genes could explain the observed pattern of biased germline mutation rates. Our transcriptional scanning model suggests that widespread transcription during spermatogenesis facilitates a DNA scanning process that systematically detects and repairs bulky DNA damage through TCR (Hanawalt and Spivak, 2008; Werner et al., 2015), thus reducing germline mutations rates and, ultimately, the rates of gene evolution. The set of unexpressed genes in the male germline is not random. Rather, they are enriched in sensory and immune/defense system functions, which have evolved faster in recent human evolution (Boehm, 2012; Flajnik and Kasahara, 2010; Singh et al., 2012). However, transcription-coupled damage (TCD) appears to overwhelm the effects of TCR in the small subset of very highly expressed genes, which are enriched in spermatogenesis-related functions, implicating a role for TCD in modulating germline mutation rates (Jinks-Robertson and Bhagwat, 2014). Collectively, our transcriptional scanning model exposes a hitherto under-appreciated aspect of DNA repair in biasing gene mutation rates and evolution rates throughout the genome.
RESULTS
Single-cell RNA-Seq reveals the developmental trajectory of spermatogenesis
To identify gene expression pattern throughout spermatogenesis, we applied single-cell RNA-Seq (scRNA-Seq) to the human and mouse testes (Figure S1A). The resulting data allowed us to distinguish between the genes expressed in the somatic and germline cells, as well as to reveal genes with dynamic expression patterns throughout the developmental process of spermatogenesis, including mitotic amplification, meiotic specification to generate haploid germ cells, and finally, differentiation and morphological transition to mature sperm cells (Figure 1A–B) (Hammoud et al., 2014; Sharma and Agarwal, 2011).
Figure 1. scRNA-Seq reveals a detailed molecular map of human spermatogenesis.
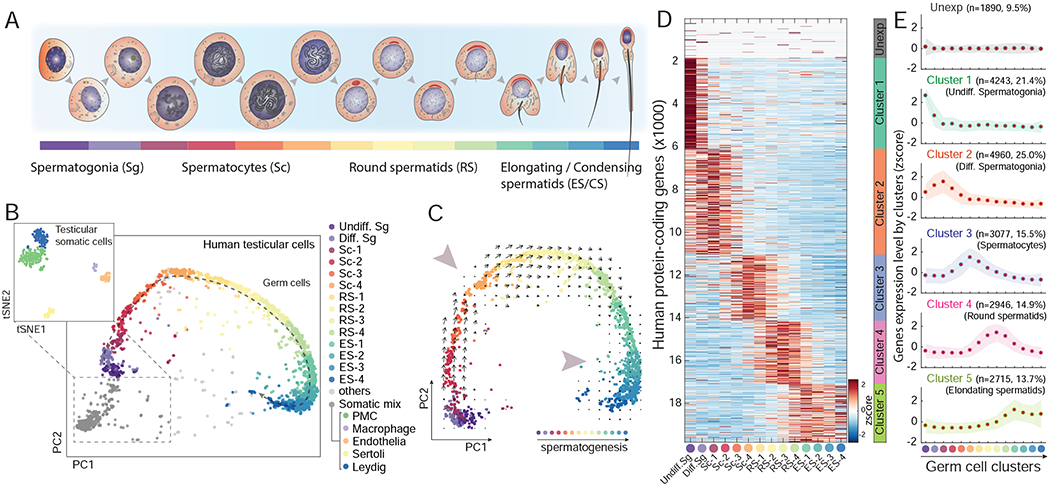
(A) Schematic of developmental stages of human spermatogenesis. (B) Dimension reduction analysis (PCA and tSNE) of human testes scRNA-Seq results. Colors indicate the main spermatogenic stages and somatic cell types (see Figure S1 and SI methods). (C) PCA on the spermatogenic-complement of the single-cell data. Arrows and large arrowheads indicate the RNA velocity algorithm (La Manno et al., 2018) predicted developmental trajectory and transcriptionally inactive stages during spermatogenesis, respectively. (D-E) Heatmap (D) and plots (E) of the expression patterns of all human protein-coding genes throughout spermatogenesis according to k-means method-defined gene clusters (see STAR methods). See also Figure S1, S2 and Table S1, S2 and S3.
Principal component analysis (PCA) and unsupervised clustering on the scRNA-Seq data of human testicular cells revealed 19 clusters composed of cells from different biological and technical replicates (Figure 1B, S1B–C and Table S1, SI methods). We annotated the 5 cell clusters composed of somatic cells – including Leydig cells, Sertoli cells, peritubular myoid cells, testicular endothelial cells and testis-resident macrophages (Sharma and Agarwal, 2011) – using previously determined cell type markers (Figure 1B and S1D–E, see STAR Methods). Excluding the somatic cells, PCA on the 14 clusters of germ cells revealed a continuum suggesting that the order of the cells corresponds to the developmental trajectory of spermatogenesis (Figure 1C). Four independent lines of evidence support this inference. First, the order of expression of known marker genes across the continuous clusters matched their developmental order (Figure S1E). Second, pseudotime analysis using Monocle2 revealed the same cell trajectory (Figure S1E–F) (Qiu et al., 2017). Third, RNA Velocity analysis (La Manno et al., 2018) – examining the relationship between the spliced and unspliced transcriptomes – further supported the developmental progression during spermatogenesis and also identified the previously reported decline of expression during meiosis and late spermiogenesis (Figure 1C) (Rathke et al., 2014; Sharma and Agarwal, 2011). Finally, our scRNA-seq data across the developmental program of spermatogenesis showed high consistency with other recently published human testis scRNA-seq results (Figure S1G) (Guo et al., 2018; Hermann et al., 2018; Sohni et al., 2019; Wang et al., 2018).
Our scRNA-seq data allowed us to test whether the long-observed widespread gene expression in the testis has contributions from both germ and somatic cells, or is mainly from the germ cells. Examining only germ cells, we found that 90.5% of all protein-coding genes are expressed (Figure 1D, SI methods). In contrast, all of the detected somatic cell types collectively express 59.9% of the genes, where >99% overlap with the germ cell-expressed genes. Overall, the spermatocytes and round spermatids clusters have the largest number of expressed genes at the single-cell level, far more than that of testicular somatic cell types (Figure S1H). We further compared the number of expressed protein-coding genes across multiple developmental scRNA-seq datasets, including that of the human developing brain and another human testis study (Guo et al., 2018; Hochane et al., 2019; La Manno et al., 2016; Nowakowski et al., 2017; Pellin et al., 2019) (see STAR Methods). Again, we found that testicular germ cells express the greatest number of protein-coding genes (Table S2). This observation is also supported by bulk RNA-seq results across all complex organs/tissues included in the Genotype-Tissue Expression (GTEx) dataset (Figure S1I) (GTEx Consortium, 2015). Together, our scRNA-seq results and other analyses support the notion that the widespread gene expression in the testis originates in the germ cells.
To further ask whether specific developmental stages are enriched for expression, we clustered all human protein-coding genes into six groups including the unexpressed genes (Figure 1D–E, Table S3). While no single stage alone accounts for the widespread transcription, we can infer that each sperm cell will have expressed ~90.5% of the genes by the end of its maturation.
To test the generality of these results, we repeated the experiments on mouse testes and found that the pattern of transcription during mouse spermatogenesis was broadly comparable to that of human (Figure S2A–D, Table S1 and S4). In terms of genes expressed across the stages, we found an overall highly conserved spermatogenesis gene expression program (Figure S2C–E). A combined principal component analysis of human and mouse germ cells further highlighted this conservation (Figure S2F–G). We also noted that PC2 clearly separates the human and mouse cells (Figure S2H), indicating a species-specific gene expression signature between the two species. These genes include metabolic genes such as GAPDH (Gapdh) (Paoli et al., 2017) and FABP9 (Fabp9) (Selvaraj et al., 2010), chemokine gene CXCL16 (Cxcl16), and sperm motility-related gene SORD (Sord) (Frenette et al., 2006) (Figure S2I). Collectively, these results highlight the conserved gene expression of human and mouse spermatogenesis, but also identify the divergence between the two species.
Reduction of germline mutation rates in spermatogenesis-expressed genes
We hypothesized that widespread transcription during spermatogenesis could lead to two scenarios (Figure 2A): 1) transcription events unwind the double-stranded DNA, leading to an increased likelihood of mutations by transcription-coupled damage (TCD) (Jinks-Robertson and Bhagwat, 2014), and consequently to higher germline mutation rates and diversity within the population; and/or 2) the transcribed regions are subject to transcription-coupled repair (TCR) of DNA damage (Hanawalt and Spivak, 2008), thus reducing germline mutation rates and safeguarding the germline genome, leading to lower population diversity. In both scenarios, differences in expression states may contribute to the pattern of germline mutation rates, and ultimately lead to differential gene evolution rates.
Figure 2. Widespread transcription in spermatogenic cells is associated with reduced germline mutation rates.
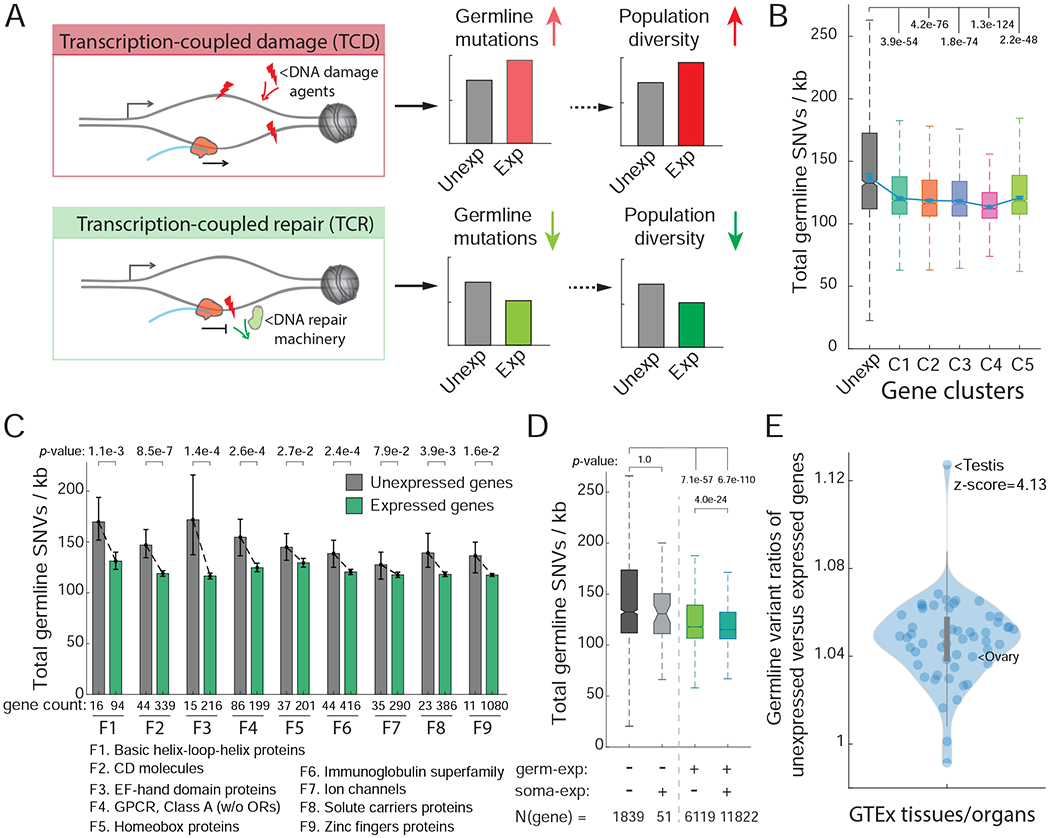
(A) Two possible consequences of widespread transcription in spermatogenic cells: transcription-coupled DNA damage and transcription-coupled repair. (B) Germline SNV rates in the gene body across the gene clusters, as determined in Figure 1D. (C) Germline SNV rates in the gene body of expressed and unexpressed genes across large gene families (see STAR Methods). (D) Germline SNV rates in the gene body across gene sets as determined by binarized expression (expressed versus unexpressed) in testicular germ cells and somatic cells. (E) Ratios of germline SNV rates of unexpressed genes versus the expressed genes determined from diverse human organs and cell types. Points represent individual tissue samples collected by the GTEx-project (GTEx Consortium, 2015). Significance in B-D is computed by the Mann-Whitney test with Bonferroni correction for multiple tests. Error bars indicate 99% confidence intervals calculated by bootstrap method with n=10,000 (see STAR Methods, same for Figures below). See also Figure S3 and Table S3.
Public databases have amassed ~300 million germline variants detected in the human population, providing a rich resource for studying germline mutation rates (Zerbino et al., 2018). Since ~80% of these germline variants are thought to have originated in males (Campbell and Eichler, 2013; Makova and Li, 2002), we used the single nucleotide variations (SNVs) from this dataset to query for germline mutation rates and predicted mutational signatures caused by widespread transcription in the testis (see STAR Methods) (Acuna-Hidalgo et al., 2016; Nei et al., 2010). Interestingly, we found that spermatogenesis-expressed genes, regardless of the timing of their expression (throughout and following meiosis), generally have a lower rate of germline SNVs, relative to the unexpressed genes (Figure 2B). This difference is robust across donors (Figure S3A–C) and gene clustering parameters (Figure S3D). We also confirmed the observation of lower germline SNV rates using only SNVs detected by the 1000 Genome project (Figure S3E).
Previous results have shown that the density of somatic mutations is negatively correlated with genomic features of open chromatin, likely due to greater DNA repair accessibility (Polak et al., 2015; Schuster-Böckler and Lehner, 2012). To test whether lower germline SNV rates in the spermatogenesis-expressed gene sets are confounded by transcription-independent DNA repair favoring open chromatin states of the expressed genes, we asked if the upstream regions of these genes have lower germline SNV rates compared to those of the unexpressed genes. Upstream regions (5kb) of genes are strongly enriched with open chromatin states in expressed genes, relative to unexpressed genes (Buenrostro et al., 2013). However, analyzing the germline SNV rates in the upstream regions revealed minimal differences between the spermatogenesis expressed- and unexpressed-genes (Figure S3F). A similar pattern was also observed for the gene downstream regions (Figure S3G). Together, these results indicate that it is transcription itself – not the associated chromatin state – that leads to lowered germline SNV rates in the spermatogenesis-expressed genes.
To further control for differences in gene family-specific mutation rates, we examined gene families individually according to whether they are expressed (in any stage) or unexpressed during spermatogenesis (see STAR Methods) (Gray et al., 2016). For all large gene families (>100 genes) with at least 10 genes in both categories we found lower germline SNV rates in the spermatogenesis-expressed gene group (Figure 2C). For example, of the 110 genes with a basic helix-loop-helix domain, 94 are expressed in the germ cells, and the expressed subgroup has a ~23% lower germline SNV rate in the population as compared to the unexpressed complement (Mann-Whitney test P<1.1×10⁻³).
We next tested whether this reduction of germline mutation rates in the expressed genes is unique to male germline gene expression profile, relative to that of other cell types. By distinguishing the binarized expression status in both germ cells and testicular somatic cell types, we found that genes expressed exclusively in somatic cells do not exhibit lower germline SNV rates than those of unexpressed genes in the somatic cell types (Figure 2D and S3H, see STAR Methods). This observation was also confirmed by analyzing gene expression across other human developmental systems, including the developing brain (Figure S3I). To study somatic tissues more broadly we turned again to the GTEx dataset which has characterized transcriptional profiles across all major human tissues/organs, including testis (GTEx Consortium, 2015). While not at the single-cell level and thus an average measure of gene expression across cell types, testis expression in this dataset still showed a significant difference relative to all other tissues in its germline variant ratio of expressed and unexpressed genes (Z-score = 4.13; Figure 2E). Interestingly, we found that the ovary transcriptome does not predict such an effect. Collectively, these results support the second explanation of transcription-coupled DNA repair in the male germ cells (Figure 2A), with spermatogenesis-expressed genes showing reduced levels of germline mutations rates.
A TCR-induced germline mutational signature
While we studied the germline mutation rates using SNVs from population-wide whole genome sequencing (WGS), the observed differential mutation rates may also be influenced by natural selection, particularly in the coding regions. To search for a transcription-dependent germline mutational signature and exclude selection, we restricted our analysis to stringently defined intron regions (see STAR Methods). We first repeated our analysis on the differential mutation rates across gene clusters using intronic SNVs. We confirmed that intron SNV rates are lower in the spermatogenesis-expressed genes than that in the unexpressed genes (Figure S3J–K). However, the effect is smaller, suggesting that, in the coding regions, selection also contributes to a lower SNV rate in the spermatogenesis-expressed genes. We used these intronic SNVs in the following analyses to determine the nature of the transcription-dependent germline mutational signatures.
If the reduction of mutations results from a male germ cell TCR-induced process, we would expect an asymmetry between the germline mutation rates of the coding and the template strands in the spermatogenesis-expressed genes (Haradhvala et al., 2016; Mugal et al., 2009), but not in the genes unexpressed during spermatogenesis (Figure 3A). The asymmetry would be such that the template strand retains fewer mutations since, in TCR, DNA damage is detected by the RNA polymerase on the template strand (Hanawalt and Spivak, 2008). To distinguish between mutations occurring on the coding and template strands, we adapted a previous approach for identifying strand-asymmetries in the somatic mutation rate (Figure 3B) (Chen et al., 2017; Haradhvala et al., 2016). Applying this approach to intronic germline SNVs, we inferred a lower mutation rate on the template strands – relative to the coding strands – of genes expressed during spermatogenesis, regardless of their expression pattern along the spermatogenesis stages (Figure 3C). This effect was not apparent in the unexpressed genes (Figure S4B), as exemplified by A-to-T (A>T) transversion mutations in Figure 3C. Notably, we found that the coding strand, which has no transcription or only minimal levels of antisense transcription (Pelechano and Steinmetz, 2013), shows similar level of SNV rates between expressed genes and unexpressed genes (except for A-to-G mutations, which are known to accumulate mutations through transcription-coupled DNA damage in the coding strand) (Haradhvala et al., 2016).
Figure 3. TCR-associated mutation asymmetry scores show bidirectional transcription and extended transcription signatures.
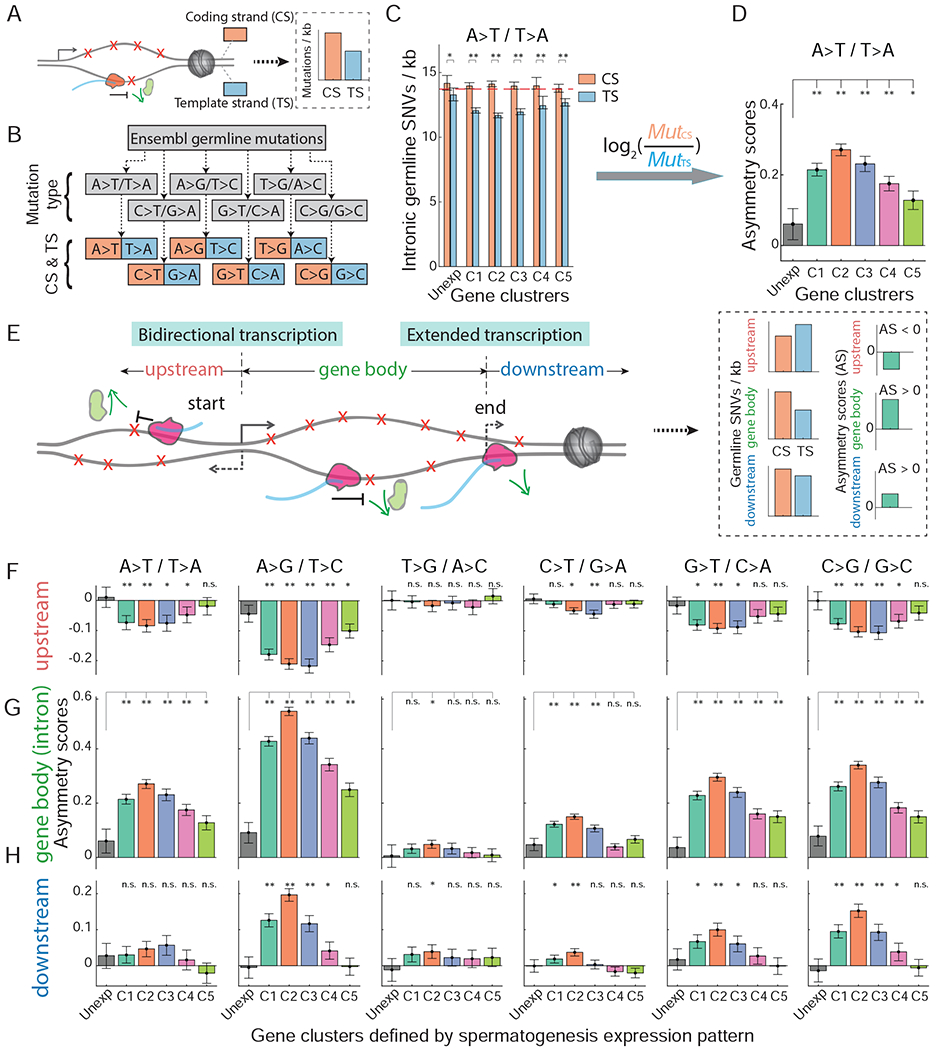
(A) Schematic of a transcribed gene with the template strand containing lower DNA damage and, consequently, a lower mutation rate. (B) Distinguishing germline mutations according to coding and template strands (see STAR Methods). (C) A-to-T transversion mutation rates of the coding and the template strands for the spermatogenic gene categories (paired-sample t-test). Dashed line indicates the average SNV rate in the unexpressed genes. (D) Asymmetry scores throughout spermatogenic gene categories (see STAR Methods). (E) Schematic of gene architecture indicating bidirectional and extended transcription. (F-H) Asymmetry scores in the upstream 5kb region (F), gene body (G), represented by intron regions, and downstream 5kb region (H) across all six mutation types (Mann-Whitney test). Significance p-values were adjusted for multiple tests with Bonferroni method. *, P<0.01; **, P<1.0e−6; n.s., not significant. See also Figure S4 and S5.
We computed an ‘asymmetry score’ to study the difference in mutation rates inferred from the coding and template strands (Figure 3C–D) (Haradhvala et al., 2016). As expected, the expressed gene clusters showed strong asymmetry scores between the coding and template strands (Figure 3D and 3G). As a control, we tested the overall Watson and Crick strands (Figure S4D–E) and did not find such an asymmetry, indicating a transcription-dependent asymmetry. The difference in asymmetry scores between mutation types may reflect differential TCR efficiencies across DNA damages. For example, the A>G mutation type has the strongest asymmetry between coding and template strands, as also observed in cancer mutational signatures (Haradhvala et al., 2016). The asymmetry scores decrease throughout spermatogenesis, correlating with a decreasing expression of transcription-coupled repair genes during spermatogenesis (Figure S4F–G).
We further tested whether male germ cell gene expression is unique in causing asymmetric germline mutation rates between coding and template strands. The unexpressed genes during spermatogenesis have minimal asymmetry score levels, in sharp contrast with the expressed gene clusters (Figure 3D and 3G). As a negative control, we shuffled the gene clustering assignments while maintaining the group sizes and found that difference of asymmetry scores disappeared (Figure S5A–C). To test if this signal is unique to the male germ cells, we compared the asymmetry scores of unexpressed gene sets determined from the male germ cells and from somatic cell types (Figure S5D). We found that only the unexpressed genes from the male germ cells could predict a minimum level of coding-template asymmetry score. These results support the notion that the gene expression pattern during spermatogenesis uniquely generates the asymmetric germline mutation rates between coding and template strands.
Bidirectional transcription signatures of mutation asymmetries
Initiation of gene expression can occur on the opposite strand of gene upstream region and in the inverse direction, leading to bidirectional transcription (Core et al., 2008; Duttke et al., 2015) (Figure 3E). If lower mutation rates on the template strand are indeed maintained by transcription, we predicted that mutation asymmetry scores would display an inverse pattern between the opposite sides of the initiation of bidirectional transcription (Figure 3E). Consistently, we detected an inverse pattern of asymmetry scores between the gene body (intron) and the upstream sequences (Figure 3F–G, S4A–B). Similarly, since transcription may extend beyond the annotated end or polyadenylation site (Figure 3E) (Proudfoot, 2016), we also predicted that the asymmetry scores in the downstream sequences would display a similar, though expectedly weaker pattern compared to that of the gene body (Figure 3E). Again, we found the expected pattern in which the gene body and the downstream sequences have the same pattern of asymmetry scores (Figure 3G–H, S4B–C). We further controlled the bidirectional transcription-induced mutational signature by removing the genes for which the upstream region overlaps with another gene, for example those forming head-to-head pairs (Trinklein et al., 2004) (Table S5 and see STAR Methods). The mutation asymmetry scores on the remaining genes still show consistent bidirectional transcription signatures (Figure S5E), supporting the notion that bidirectional transcription of genes causes the observed asymmetric pattern.
Finally, we also detected evidence that the same TCR influences are manifested in the mouse data (Figure S5F–G). For example, G-to-T (G>T) transversion mutations show strong conserved asymmetric mutation patterns in both the human and mouse data. Since G-to-T mutations come predominantly from endogenous oxidative DNA damage of guanine (Menoni et al., 2018; Tubbs and Nussenzweig, 2017), such conserved asymmetric germline mutation patterns between coding and template strands of genes are consistent with TCR-induced effects on germline mutations.
Sequence contexts of TCR-induced germline mutational signatures
Point mutations are strongly biased by the local sequence context (Helleday et al., 2014; Ségurel et al., 2014). For example, the rate of C-to-T mutations at CpG dinucleoride sites is ~10-fold higher than the same mutation type in CpH (A/C/T) sites (Ségurel et al., 2014). Previous studies in TCGA cancer mutation profiles considering the 5’- and 3’-adjacent bases have revealed ~30 tumor-specific mutational signatures across tumor types (Alexandrov et al., 2013). Similarly, we sought to understand the sequence context specificity of transcription-induced germline mutational signatures (Figure 4 and S6, see STAR Methods). Consistent with earlier results (Nachman and Crowell, 2000), we found that C-to-T mutation rates at the CpG sites are at least 10-fold higher relative to CpH sites or any other mutation types (Figure 4A). Cytosine deamination damage is usually efficiently repaired through the base-excision repair (BER) pathway (Krokan and Bjørås, 2013). Failing to repair the deaminated cytosine in the genome causes C-to-T transition mutation upon DNA replication (Duncan and Miller, 1980), and indeed studying the C-to-T mutation rates according to coding and template strands, we found only a slight mutation asymmetry between the strands at the YpCpH contexts (Y stands for C or T, Figure 4A–B and 4E–F). C-to-T mutation at the CpG sites showed a minimal level of strand asymmetry, indicating that BER function at these sites is not generally influenced by transcription.
Figure 4. TCR-induced mutational signatures considering sequence contexts.

(A) Human intronic germline mutation rates in the spermatogenesis-expressed genes. The mutation rates considered the adjacent bases and distinguished the coding/template strands. (B) Human germline mutation asymmetry scores according to adjacent bases in the spermatogenesis-expressed genes. (C-D) Human asymmetry score pairs distinguished by 3’- (C) or 5’- (D) adjacent bases. For each pair of points in a given mutation type, the asymmetry scores were plotted in a purine (left) – to – pyrimidine (right) fashion in terms of 3’- (C) or 5’- (D) adjacent base. (E-H) Same as shown in A-D, but for mouse germline mutations in the intron regions. Significance in C-D and G-H were computed by paired-sample t-test with Bonferroni correction for multiple tests. See also Figure S6.
Systematically studying all of the mutation types, according to both their sequence contexts and coding/template strands, led us to uncover a pattern of TCR-induced germline mutational signature, which we term the “3’-pyrimidine rule”. First, consistent with our observations in Figure 3, we found that A-to-G mutations have the strongest asymmetric mutation rates between coding and template strands (Figure 4A–B). Other mutation types, including A-to-T, G-to-T and C-to-G mutations, also showed substantial overall levels of mutation asymmetries between the two strands (Figure 4A–B). Studying the mutation subtypes according to their adjacent bases, we found that mutation subtypes with a 3’-pyrimidine (Y) consistently have stronger asymmetry scores than the ones with a 3’-purine (S) (Figure 4B). For example, in A-to-T mutation type, we found that the asymmetry scores predominantly come from the subtypes where the reference A is in the NpApY sites. We further tested this ‘3’-pyrimidine rule’ by controlling the 5’ base, examining NXA-NXT and NXG-NXC pairs, where N is the controlled 5’ base and X is the reference base of a given mutation type (see STAR Methods). We found that the mutation types with strong strand asymmetries (i.e., A-to-T, A-to-G, G-to-T and C-to-G mutation types) exhibited a dramatic and significantly stronger mutation asymmetry scores when the 3’-adjacent base is a pyrimidine (Figure 4C). Similarly, we tested whether the germline mutational signature revealed 5’-adjacent base-associated rules. In this case, we controlled the 3’-adjacent base, generating AXN-TXN and GXN-CXN pairs. We found only a slight 5’-pyrimidine preference in the C-to-T and C-to-G mutation types (Figure 4D), indicating that the 5’-adjacent base has less of an impact on the germline mutational signatures than that of the 3’-adjacent base. Lastly, we repeated our analysis of the 3’-pyrimidine rule using mouse germline mutations, and found that it is largely recapitulated (Figure 4E–H), supporting the notion that TCR-induced mutational signatures are conserved across species.
Transcriptional scanning is tuned by gene-expression level
Our results led us to propose ‘transcriptional scanning’ as a mechanism to systematically reduce DNA damage-induced mutagenesis in the bulk of genes by widespread spermatogenic transcription to safeguard the germline genome sequence integrity (Figure 5A). We predicted that transcriptional scanning would be tuned by different expression levels in the testis. Indeed, examining our total and strand-specific germline SNV rates in the intron regions according to different expression levels (Figure 5B, Table S6 and see STAR Methods), we observed that as expression level increases, the overall mutation rate drops (Figure 5C), and furthermore that this drop can be mostly attributed to the template strand, supporting a transcription-dependent manner of DNA repair (Figure 5D,E). Surprisingly, however, the very highly expressed genes showed the opposite effect: the overall mutation rates and template strand mutation rates all increase, and the mutation rates on the coding strand also substantially increases (Figure 5D). We propose that this pattern indicates that the very highly expressed genes incur transcription-coupled DNA damage (Figure 2A), especially on the coding strand (Figure 5D). This observation is consistent with previous reports from other systems of transcription-associated mutagenesis in highly expressed genes (Jinks-Robertson and Bhagwat, 2014; Park et al., 2012). The A-to-G transition mutation type has the most evident TCD-induced mutation rate increase (Figure 5D), and similarly, a strong TCD-induced effect was readily observed in somatic A-to-G mutations in liver cancer samples (Haradhvala et al., 2016). Together, the TCD-induced effect in the very highly-expressed spermatogenesis genes is consistent across all mutation types, supporting a general TCD effect (Figure 5D–E).
Figure 5. Transcriptional scanning-induced mutation reduction is tuned by gene-expression levels.

(A) Schematic of transcriptional scanning of DNA damage in male germ cells. (B) Genes were binned to nine expression level groups, from unexpressed (Unexp) to highly expressed (High-exp) (Table S6 and see STAR Methods). (C) Intronic SNV rates across gene expression level categories (Mann-Whitney test). (D) Intronic SNV rate distributions of the indicated germline mutation types across gene expression level categories, and distinguished by coding and template strands (paired-sample t-test). (E) Distribution of asymmetry scores between coding and template strands for the mutation types indicated in (D) (Mann-Whitney test). (F) Expression level tuning of germline mutation rates following additive contributions by transcription-coupled repair (TCR-reduced) and transcription-coupled damage-induced (TCD-induced) effects. The observed germline mutation rate distribution represents average mutation rates across 100 evenly-binned expression levels, with background shadow indicating 99% confidence intervals. Significance p-values were adjusted for multiple tests with Bonferroni method. *, P<0.01; **, P<1.0e−6; n.s., not significant. See also Table S6.
Overall, this analysis suggests that spermatogenesis gene expression level tunes germline mutation rates by transcriptional scanning. Increasing gene expression levels during spermatogenesis are correlated with mutation rate reduction on the template strand (Figure 5D), but only to a point, while on the coding strand, increasing gene expression levels lead to increased mutation rates (Figure 5D). In the very highly expressed genes, TCD overwhelms the TCR-induced reductions, and produces an overall higher germline mutation rate than genes expressed at moderate levels (Figure 5C).
De novo germline mutational signatures
While our analysis into the germline mutational signatures thus far was based on population-wide SNVs, we sought to further test our model using de novo germline mutations (DNMs), since these constitute a set of variants that have only recently entered the human population, and consequently are less influenced by natural selection (Acuna-Hidalgo et al., 2016). We collected two public-available DNM datasets from large-scale healthy trio-WGS studies (An et al., 2018; Jónsson et al., 2017), generating a total of 214,728 single nucleotide DNMs for testing our transcriptional scanning model. Analyzing DNM rates across our gene clusters defined from spermatogenesis expression pattern (Figure 1D–E) or expression level (Figure 5B), we again found that spermatogenesis-expressed genes exhibit a lower level of mutation rates, tuned by their expression level (Figure 6A–B). Additionally, we considered the local sequence contexts of these DNMs and calculated their mutation rates on both coding strand and template strand (Figure 6C). We found that the mutation rates calculated from population-wide SNVs and that from the DNMs are highly correlated in both coding and template strands (Figure 6E–F), supporting our earlier analysis into the germline mutational signatures using SNVs. Finally, we compared the asymmetry scores computed from population-wide SNVs and that from DNMs, and again we observe consistent results (Figure 6G). Collectively, the de novo mutation datasets clearly recapitulate our observation of transcription-dependent mutational signatures and the effect of transcriptional-scanning, derived from analyzing the population-wide SNVs.
Figure 6. De novo germline mutations exhibit spermatogenesis expression-dependent mutational signatures.

(A) DNM rates across the spermatogenesis gene clusters, as determined in Figure 1D. (B) DNM rates across spermatogenesis gene expression level categories, as determined in Figure 5B. (C-D) DNM rates (C) and asymmetry scores (D) regarding to local sequence contexts and coding/template strands in the spermatogenesis-expressed genes. (E-F) Correlations between the SNV rates and scaled DNM rates on the coding strand (E) and on the template strand (F), respectively. (G) Correlation between the asymmetry scores defined from SNVs and from DNMs. Each dot in E-G represents a mutation subtype which considers 5’- and 3’-adjacent bases referring to the reference base. We excluded the dots representing C-to-T mutating rates in the CpG contexts in (E) and (F), though including such outlier dots would further increase the correlation coefficients. Significance in A-B was computed by the Mann-Whitney test with Bonferroni method correction for multiple tests.
Transcriptional scanning over evolutionary time-scales
To study the evolutionary aspects of transcriptional scanning we first studied the functional attributes of the unexpressed genes during spermatogenesis, which are the relative minority of genes that in our model would not benefit from transcriptional scanning. In this set of 1,890 genes we observed significant enrichment for fast evolving genes between human and apes (dN/dS values larger than 1.0, hypergeometric p-value: 1.0e-15, see STAR Methods). These genes are enriched for functions related to environmental sensing, immune systems, defense responses, and signaling transduction (Figure 7A, S7A and Table S7). These functions are known to have evolved faster in the human genome (Boehm, 2012; Flajnik and Kasahara, 2010; Singh et al., 2012), and this link to lack of expression in the testes provides a possible contribution to their unique mode of evolution. Consistently, we detected the highest rates of sequence divergence across ape genomes among our category of unexpressed genes (hypergeometric p-value of enrichment in the top 10% highly-divergent genes: 8.8e-10, see STAR Methods) (Figure 7B). While selection is typically invoked to account for the fast evolution of genes (Figure S7B–C), biased germline mutation rates may also contribute according to the neutral theory of gene evolution (Boehm, 2012; Flajnik and Kasahara, 2010; Nei et al., 2010). To test this, we studied the synonymous substitution rates (dS, generally assumed to be neutral) as a proxy for the germline mutation rates and used this measure to compare between the spermatogenesis expressed and unexpressed genes. Interestingly, we found that the spermatogenesis-expressed genes have lower dS values (Figure 7C), consistent with our analysis of SNV rates in the intron regions (Figure S3J–K). We further found that the very highly expressed genes in spermatogenesis have increased rates of divergence (Figure S7F-I). As expected from their high expression, we found that this set of genes is mainly enriched for roles in male reproduction (Figure S7J and Table S7). Together, our analyses into human-ape gene divergence provide evidence that widespread gene expression during spermatogenesis may have shaped gene evolution rates.
Figure 7. Evolutionary consequences of transcriptional scanning in male germ cells.

(A) Gene ontology terms enriched in the set of genes unexpressed during spermatogenesis. (B-C) DNA divergence levels (B) and dS scores (C) of human genes with their orthologous in the indicated apes, according to gene expression-pattern clusters. Gray dashed box highlights the male germ cell-unexpressed gene cluster. (D) Schematic of transcriptional scanning in biasing germline mutation rates and its evolutionary impact. (E) A revised model for generating biased DNA sequence variation and gene evolution. See also Figure S7 and Table S7.
DISCUSSION
Our findings led us to propose the ‘transcriptional scanning’ model (Figure 7D), whereby widespread transcription during spermatogenesis systematically reduces germline mutations in the expressed genes by transcription-coupled repair (TCR), thereby safeguarding the germ cell genome sequence integrity. Given that this process is carried out in the germline, the variable mutation rates have important implications. Combined with natural selection, this process may contribute to the relatively slower evolution of the bulk of spermatogenesis-expressed genes (Figure 7D, middle). The small group of unexpressed genes during spermatogenesis is enriched for sensory and immune/defense system genes (Figure 7A) and our transcriptional scanning model provides insight into how variation is preferentially retained in this class of genes. The biased germline mutation rates provide increased population-wide genetic diversity which may be under strong selective biases for adaptation at the population-level in rapidly changing environments. Genes with very high germline expression form a third class, and these exhibit higher germline mutation rates which our model explains in terms of transcription-coupled DNA damage (TCD) obscuring the effect of TCR (Figure 5F and 7D right). The model thus provides a comprehensive view of the combined effects of TCR and TCD in spermatogenic cells (Figure 5F), and refines previous observations that germline mutation rates increase with expression levels while highly expressed genes evolve more slowly (Chen et al., 2017; Drummond et al., 2005; Good and Nachman, 2005; Pál et al., 2001; Park et al., 2012). While the observed mutational bias does not alone direct evolution according to our model – since genetic diversity in the population is also influenced by genetic drift and natural selection – we propose that it contributes to global gene evolution rates.
Gene evolution at the sequence level involves (1) the generation of novel DNA variants, stemming from DNA damage-induced mutagenesis, replication errors and/or recombination, and (2) natural selection and/or drift on the novel variants (Nei, 2005; Nei et al., 2010). Our results suggest that a DNA-repair mechanism contributes to the biased production of germline variants throughout the genome, and we propose that this represents a hitherto under-appreciated aspect in the establishment of differential gene evolution rates. Thus, DNA repair pathways act to constrain mutagenic DNA damage in a biased manner, analogous to the effects of selection and drift in the population (Figure 7E). By understanding these patterns of uneven germline mutations and the intrinsic removal mechanism of germline DNA damage, our model provides insight into mutation-driven genome evolution (Nei, 2013), such that transcriptional scanning in spermatogenesis imposes an additional bias in modulating rates of gene evolution.
Beyond modulating germline mutation rates and evolution rates, widespread gene expression during spermatogenesis generates a unique pattern of transcription-dependent germline mutational signatures (Figure 3–5). Our analysis into context-specific germline mutation rates allowed us to identify a new mutational signature induced by TCR, termed as “3’-pyrimidine rule”, suggesting that TCR functions more efficiently at the XpY sites, where X and Y stand for the damaged base and pyrimidine, respectively. . The results are also consistent with a model whereby TCR-recognizable DNA damages occur more frequently at the XpY sites, but with no frequency bias between the coding and template strand. RNA polymerase would then recruit TCR machinery to the template strand for DNA damage repair, generating a coding-template asymmetric mutation rates. Future work is required to understand which mechanism (or both) leads to the “3’-pyrimidine rule” of the transcription-dependent germline mutational signatures.
While transcriptional scanning is proposed to systematically detect and remove bulky germline DNA damages, male germ cells are still expected to retain damages that cannot be repaired by the TCR machinery, resulting in germline mutations (Barnes and Lindahl, 2004; Vermeulen and Fousteri, 2013). These male germline mutations likely originate from DNA replication errors, accumulating with paternal age (Kong et al., 2012), or less bulky DNA damages like base deamination (Krokan and Bjørås, 2013). Recombination-induced double-strand breaks in the germ cell genome are also frequent, affecting mutation rates near crossover hotspots (Arbeithuber et al., 2015). Thus, beyond TCR, it will be of interest to analyze the germline mutation pattern with respect to other DNA repair pathways, such as mismatch repair following germ cell-specific genome replication (Yehuda et al., 2018), and distinct chromatin states which may affect transcription-independent DNA repair (Gonzalez-Perez et al., 2019; Krokan and Bjørås, 2013; Supek and Lehner, 2017).
Our model leads to important testable predictions and may provide deeper insights into human genetics and diseases. First, the same process should also hold in other species which have similar widespread transcription in male germ cells (Soumillon et al., 2013), and we also provide evidence for conserved transcriptional scanning in mouse (Figure 4 and S2, S4, S6). Interestingly, a recent study on Drosophila testis gene expression using scRNA-seq also revealed widespread transcription, and that the mutation rate of germ cells decreases with the progression of spermatogenesis (Witt et al., 2019). This observation is consistent with our model that transcription-coupled DNA repair during spermatogenesis removes existing germline DNA damages. Second, we expect that TCR-deficient animals should produce offspring with an increase in the number of de novo mutations in the germline expressed genes and that they would not show the characteristic lower mutation rates in the template – versus the coding – strand. For patients with TCR gene-associated mutations, such as Cockayne syndrome and xeroderma pigmentosum (Cleaver, 2017), our model predicts overall higher germline mutation rates. Lastly, embryonic stem cells (ESCs) share similar patterns of widespread transcription (Efroni et al., 2008), leading us to speculate that systematic scanning and removal of DNA damage also functions in ESCs. If so, beyond spermatogenesis, transcriptional scanning may be deployed to achieve lower mutation rates in ESCs and in the early developing embryos (Cervantes et al., 2002; Efroni et al., 2008).
STAR Methods
LEAD CONTACT AND MATERIALS AVAILABILITY
This study did not generate new unique reagents. Further information and requests for resources should be directed to, and will be fulfilled, by the Lead Contact, Itai Yanai (Itai.Yanai@nyulangone.org).
EXPERIMENTAL MODELS AND SUBJECT DETAILS
Human testicular tissue
Human testicular tissue was obtained from New York University Langone Health (NYULH) Fertility Center; this was approved by the NYULH Institutional Review Board (IRB). Fresh seminiferous tubules were collected from testicular sperm extraction (TESE) surgery of two healthy donors (one was 40-year old and the other was 45-year old) with an obstructive etiology for infertility. The tissues were collected and processed in different time (with a time interval of one year). There was no drug or hormonal treatments prior to the TESE surgery in both cases. The donors were fully informed before signing consent to donating excess tissue for research use. This was again done in fashion consistent with the IRB (including tissue sample de-identification).
Mouse testicular tissue
C57BL/6J mice (4-month old) were bought from the Jackson Laboratory through the New York University Langone Health (NYULH) Rodent Genetic Engineering Laboratory. Mice were anesthetized before sacrificing for testicular tissue collection following the NYULH IRB requirements for experimental animal operation.
METHOD DETAILS
Human testicular single cell suspension preparation
Human testicular tissues were kept in cell culture grade PBS buffer and transported to the research lab on ice within 1h post TESE surgery for single-cell preparation. Testicular single-cell suspension was prepared by adapting existing protocols (Valli et al., 2014). Specifically, samples from TESE surgery was washed once with PBS and resuspended in 5mL PBS. Seminiferous tubules were minced quickly in a cell culture dish and spun down at 100g for 0.5min to remove supernatants. The minced tissue was resuspended in 8mL of 37°C pre-warmed tissue dissociation enzyme mix (See below). Tissue dissociation was done by incubating at 37°C for 20min with mechanical dissociation with pipetter every 5min. After digestion, the reaction was quenched by adding 2mL of 100% FBS (Gibco, Cat. 16000044) to a final concentration of 10%. Dissociation mix was filtered through a 100um strainer to remove remaining seminiferous tubule chunks. Cells were washed once with DMEM medium (Gibco, Cat. 11965092) with 10% of FBS and twice with PBS to remove residual EDTA in the cell suspension. Cell viability was checked with Trypan-blue staining (with expectation of over 85% viable cells) before moving to the inDrop microfluidics platform. The tissue dissociation enzyme mix (8mL) was composed of 7.56mL of 0.25% Trypsin-EDTA (Gibco, Cat. 25200056), 400uL of 20mg/mL type IV Collagenase (Gibco, Cat. 17104019) and 40uL of 2U/uL TURBO DNase (Invitrogen, Cat. AM2238).
Mouse testicular single cell preparation
C57BL/6J mice (4-month old) were bought from the Jackson Laboratory through the New York University Langone Health (NYULH) Rodent Genetic Engineering Laboratory. Mice were anesthetized before sacrificing for testicular tissue collection following the NYULH IRB requirements for experimental animal operation. Together, two mice were collected and processed separately as biological replicates, with a time interval of two months. The dissociated testicular tissue was kept in the PBS buffer and then transported to the research lab on ice immediately for single-cell dissociation. The tissue dissociation protocol is slightly different from the human testicular tissue dissociation. The whole testis was decapsulated in PBS buffer to collect the seminiferous tubules. The seminiferous tubules were quickly minced into small pieces of ~2-5mm and then washed once with PBS buffer. The minced tissue was resuspended in 8mL of 37°C pre-warmed tissue dissociation buffer 1 (1mg/mL type IV Collagenase in DMEM medium) and incubate at 37°C for 5min. This pre-dissociation step removes majority of the interstitial cells. The tissue was then spun down at 100g for 1min to remove supernatants. The tissue was resuspended by 8mL tissue dissociation buffer 2 (7.96mL of 0.25% Trypsin-EDTA and 40uL of 2U/uL TURBO DNase). The second tissue dissociation was done by incubating at 37°C for 15min with mechanical dissociation with pipette every 5min. The dissociation was quenched by adding 2mL of 100% FBS to a final concentration of 10%. Dissociation mix was filtered through a 100um strainer to remove any remaining tissue chunks. Cells were washed once with DMEM medium and twice with PBS to remove residual EDTA. Cell viability was checked with Trypan-blue staining (both replicates have over 95% viable cells) before moving to the inDrop microfluidics platform.
Single-cell RNA-Seq
Single-cell barcoding was carried out with the inDrop™ Single Cell RNA Seq Kit (1CellBio, Cat. 10196) on the inDrop microfluidics system (1CellBio, Cat. 10256-01) as instructed by the manufacturer and by its original developers (Klein et al., 2015). Briefly, the microfluidic chip and barcoded hydrogel beads were primed ahead of single cell preparation. The ready-to-use single-cell suspension in PBS (after two times wash with PBS buffer) was adjusted to 0.1 million/mL by counting with hemocytometer. Next, the prepared cells, reverse transcription reagents (SuperScript III Reverse Transcriptase, Invitrogen, Cat. 18080085), barcoded hydrogel beads and droplet-making oil were loaded onto the microfluidic chip sequentially. Encapsulation was done by adjusting microfluidic flow rates as instructed. Single-cell barcoding and reverse transcription in the droplets were done by incubating at 50°C for 2h followed by heat inactivation at 70°C for 15min. Then the droplets containing barcoded single-cells were aliquoted aiming for 1000-2000 cells per aliquot and then decapsulated by adding demulsifying agent.
Sequencing library preparation
Single-cell RNA-Seq library preparation after inDrop single-cell capturing was carried out as instructed by the manufacturer (1CellBio) and similar to the CEL-Seq2 method (Hashimshony et al., 2016). Basically, barcoded single-cell cDNA was purified with Agencourt RNAClean XP magnetic beads (Beckman Coulter, Cat. A63987) followed by second-strand synthesis reaction with NEBNext mRNA Second Strand Synthesis Kit (New England Biolabs, Cat. E6111S). Then linear amplification of cDNA was carried out through in vitro transcription (IVT) using HiScribe T7 High Yield RNA Synthesis Kit (New England Biolabs, Cat. E2040S). IVT-amplified RNA was fragmented and purified again with Agencourt RNAClean XP magnetic beads. The second reverse transcription was done with PrimeScriptTM Reverse Transcriptase (Takara Clonetech, Cat. 2680A) followed with cDNA purification with Agencourt AMPure XP magnetic beads (Beckman Coulter, Cat.A63881). Quantity of cDNA was determined by qPCR on a fraction (5%) of purified cDNA. Final PCR amplification was done according to qPCR results and purified with Agencourt AMPure XP magnetic beads. Library concentration was determined by Qubit dsDNA HS Assay Kit (Invitrogen, Cat. Q32851). Library size was determined by Bioanalyzer High Sensitivity DNA Analysis Kit (Agilent, Cat. 5067-4626).
Sequencing
Single-cell RNA-Seq library sequencing was carried out with Illumina NextSeq 500/550 75 cycles High Output v2 kit (Cat. FC-404-2005). Custom sequencing primers were used for NextSeq sequencing as instructed and provided by the manufacturer (1CellBio, Cat. 10196) (Klein et al., 2015). In addition, 5% of PhiX Control v3 (Illumina, Cat. FC-110-3001) library was added to give more complexity to scRNA-Seq libraries. Pair-end sequencing was carried out with read1 (barcodes) for 34bp, index read for 6bp and read2 (transcripts) for 50bp. We processed and sequenced two technical replicates for each human testicular sample and one technical replicate for each mouse testicular sample, together generating 6 scRNA-seq datasets for downstream analysis.
QUANTIFICATION AND STATISTICAL ANALYSIS
Sequencing data processing
Raw sequencing data obtained from the inDrop method were processed using a custom-built pipeline, available at https://github.com/flo-compbio/singlecell. Briefly, the “W1” adapter sequence of the inDrop RT primer was located in the barcode read (the second read of each fragment), by comparing the 22-mer sequences starting at positions 9-12 of the read with the known W1 sequence (“GAGTGATTGCTTGTGACGCCTT”), allowing at most two mismatches. Reads for which the W1 sequence could not be located in this way were discarded. The start position of the W1 sequence was then used to infer the length of the first part of the inDrop cell barcode in each read, which can range from 8-11 bp, as well as the start position of the second part of the inDrop cell barcode, which always consists of 8 bp. Cell barcode sequences were mapped to the known list of 384 barcode sequences for each read, allowing at most one mismatch. The resulting barcode combination was used to identify the cell from which the fragment originated. Finally, the UMI sequence was extracted, and reads with low-confidence base calls for the six bases comprising the UMI sequence (minimal PHRED score less than 20) were discarded. The reads containing the mRNA sequence (the first read of each fragment) were mapped to the references genomes (here human GRCh38 and mouse GRCm38) by STAR 2.5.3a with parameter ‘—outSAMmultNmax 1’ and default settings otherwise (Dobin et al., 2013). Mapped reads were split according to their cell barcode and assigned to genes by testing for overlap with exons of protein-coding genes and long non-coding RNA genes, based on genome annotations from Ensembl release 90. For each gene, the number of unique UMIs across all reads assigned to that gene was determined (UMI filtering), corresponding to the number of transcripts expressed and captured.
Quality filtering of the scRNA-seq data
Single cells with less than 1,000 expressed genes or contain more than 20% of transcripts from either mitochondrial genes (i.e., genes that are part of the mitochondrial genome) or ribosomal protein genes were removed from downstream analysis. After filtering, the single cells from different biological or technical replicate were merged together for downstream analysis. In total, we have 2554 cell from human, with an average of 6499 UMI counts and 2495 expressed protein-coding genes in the raw data. From mouse testes, we obtained 1593 cells after quality filtering, with an average of 8998 UMI counts and 2601expressed protein-coding genes in the raw data. The more detailed cell information from each sample is provided in the Table S1.
Testicular cell clustering and cell type identification
Following quality cell filtering, clustering was done by k-means on the principal component analysis scores, with k determined by ‘elbow-method’(Kodinariya and Makwana, 2013). To increase the performance of cell clustering step, the raw UMI counts of testicular single cells were pre-processed through the kNN-smoothing method, with k=3 which indicates a smoothing step involving the nearest 3 single cell transcriptomes. The smoothing step greatly reduces the noise in scRNA-seq data while retaining the variance between single cells (Wagner et al., 2017). Following kNN-smoothing, the principal component analysis used for cell clustering was performed on the smoothed UMI expression matrix of all testicular cells. The pre-processed expression matrices were first normalized to 100,000 transcripts per cell, followed by calculating the Fano factor (or variance-to-mean ratio, VMR) for each gene (Baron et al., 2016). Genes with a Fano factor larger than 1.5 folds of the mean values were defined as dynamically expressed genes. In total, 3615 dynamically expressed genes were selected from the human datasets for downstream PCA visualization and cell clustering. PCA was then performed on the normalized and log2 transformed expression matrix using the dynamically expressed genes. Cell clustering was done by k-means clustering with elbow-methods determined k. Following first rounds of cell clustering (k=24), several marker genes were used to determine spermatogenic cell types/states versus somatic cells. DDX4 (also called VASA) was used as a pan-germ cell marker to distinguish the spermatogenic cell lineage from the somatic cells. FGFR3 and DMRT1 (Kanatsu-Shinohara and Shinohara, 2013; von Kopylow and Spiess, 2017) were used to determine spermatogonia. SYCP3 and TEX101(Chang et al., 2011; Djureinovic et al., 2014) were used to determine spermatocytes. ACRV1 and ACTL7B (Chang et al., 2011; Djureinovic et al., 2014) were used to determine round spermatids. TNP1, PRM1, PRM2, YBX1, YBX2 and HILS1 (Djureinovic et al., 2014; Mali et al., 1989; Rathke et al., 2014; Yan et al., 2003) were used collectively to determine elongating spermatid states. Together, we identified 14 human spermatogenic cell clusters with at least 50 cells in each cluster (min value as 69 cells, corresponding to spermatocyte-1). Seven cell clusters which overlapped with each other were identified as somatic cells (as shown in Figure 1B). These cells were isolated for an additional k-means clustering algorithm (k=5) and visualized through the t-distributed stochastic neighbor embedding (tSNE) algorithm, as shown in Figure 1B and Figure S1D. In summary, CYP11A1, CSF1, and IGF1 (Chang et al., 2011; Potter and DeFalco, 2017; Ye et al., 2017) genes were used to identify Leydig cells; WT1 and SOX9(Buganim et al., 2012; Chang et al., 2011) were used to identify Sertoli cells; MYH11 and ACTA2 were used to identify peritubular myoid cells (Chen et al., 2016); CD68 and CD163 were used to identify macrophages (DeFalco et al., 2015); PECAM1 and VWF were used to identify endothelia cells (Rebourcet et al., 2016). Three small clusters with mixed expression profiles and/or bad quality were labeled as “other” and discarded as potential contaminants and/or doublets. Mouse testicular cells were analyzed in the same process. In brief, 1915 dynamically expressed genes were selected from the mouse datasets for PCA and cell clustering. Cell clustering with k-means algorithm generated 16 clusters (optimum k defined by elbow-method), out of which 13 clusters were kept as mouse spermatogenic cell clusters, and 3 clusters with few cells were discarded for downstream analysis.
Pseudotime analysis with Monocle2
We used the R package Monocle2 (version 2.6.1) (Qiu et al., 2017) to infer pseudotime tracks for both human and mouse testicular germ cells. The raw UMI counts of the isolated spermatogenic cells were pre-processed through the kNN-smoothing method (k=3) before performing pseudotime inference. We found that smoothing process greatly increased the resolution of pseudotime tracks as compared to the ones directly inferred from the raw UMI counts (data not shown). Pseudotime inference was performed with default parameters according to the user manual (http://cole-trapnell-lab.github.io/monocle-release/docs/): 1) Set “negbinomial.size()” for expression distribution, and estimated size factors and dispersions. 2) Select genes detected among at least 5% of input cells to project cells to 2D space using “DDRTree” method. 3) Order cells and visualize pseudotime tracks as shown in Figure S1F and S2F. The ascending order of pseudotime values was consistent to the pattern of marker genes during spermatogenesis for both human and mouse (data not shown).
Cell fate prediction with “RNA velocity”
We used the R package ‘velocyto.R’ (version 0.6) to estimate RNA velocity according to the standard procedures suggested by the developers (La Manno et al., 2018). The RNA velocity estimation involves three separate UMI count matrices: intronic UMIs (nmat), exonic UMIs (emat), and the optional intron-exon spanning matrix (spmat). These matrices were generated by the ‘dropEst’ pipeline (version 0.7.1, https://github.com/hms-dbmi/dropEst) (Petukhov et al., 2018). Briefly, 1) raw sequencing reads were tagged by ‘droptag’ with the default ‘inDrop v1&v2’ configuration file except here that the ‘r1_rc_length’ was set as 3. 2) The tagged reads were mapped to the reference genomes (here human GRCh38 and mouse GRCm38) using STAR (version 2.5.3a) with default settings. 3) The alignments were processed by ‘dropEst’ with gene annotation GTF file (Ensembl release 90) and the default settings except here the ‘--merge-barcodes’ option was additionally called as suggested in the standard procedure. We followed the velocyto.R manual (https://github.com/velocyto-team/velocyto.R) which used emat and nmat to estimate and visualize RNA velocity. With predefined cell stage, we performed gene filtering with the parameter “min.max.cluster.average” set to 0.1 and 0.03 for emat and nmat, respectively. RNA velocity was estimated with the default settings except the parameters ‘kCells’ and ‘fit.quantile’ which were set as 3 and 0.05, respectively. RNA velocity field was visualized on a separate PCA embedding as shown in Figure 1C for human testicular germ cells, and in Figure S2A for mouse testicular germ cells, respectively.
Conservation and divergence analysis of human-mouse spermatogenesis
Following identifying the human and mouse spermatogenic cells separately, human-mouse spermatogenesis comparison was performed on genes which have one-to-one orthologues between human and mouse. Human-mouse one-to-one orthologous gene pair list was downloaded from Mouse Genome Informatics (MGI)-Vertebrate Homology (http://www.informatics.jax.org/homology.shtml). After filtering, 17,012 one-to-one orthologous genes were selected for integrating the human and mouse spermatogenic cells. Joint PCA was performed by selecting dynamically expressed genes using integrated gene expression matrix. In total, 1,124 genes were selected to perform joint PCA, as the results shown in Figure S2G–H. Top 20 genes contributing to PC2 from both ends, separating human and mouse species-specific signature, were selected and plotted in Figure S2I.
Gene clustering
Gene clustering was performed on a collapsed expression matrix of genes-by-spermatogenic clusters across all testicular germ cells. First, we defined the set of unexpressed genes by having expression (minimum of 1 UMI count per cell) in at least 5 single cells from the kNN-smoothing method (k=3) smoothed scRNA-seq data. The genes pass such criteria were defined as expressed genes, leading to the estimation of expressing ~90.5% of human genes (Figure 1D–E) and ~80.4% of mouse genes (Figure S2C–D). We also tested the sensitivity to different parameters for determining expression or unexpression status. Specifically, we included the criterion of minimal expression level (>0.1 mean UMI count in at least one cell cluster) or changing the criterion of minimal expressed cell number to 10 cells. Following determining expression or unexpression of genes, the expressed genes were then clustered by k-means algorithm, with k varied from 2 to 10, as shown in Figure S3D. A combination of parameters for determining expression/unexpression and k-expressed gene clusters allowed us to test the sensitivity of the observed reduction of germline mutation rates in the expressed genes relative to the unexpressed genes. Through interpreting the results, minimal expression in 5 single cells was chosen as the optimal criterion for determining expression or unexpression; k=5 was chosen to display the expressed gene clusters as it best represents the overall gene expression dynamics during spermatogenesis. The determined gene clusters were used for downstream analysis into the mutation signatures. The gene names of each cluster were provided in the Table S3. We applied the same criteria to human germ cells from individual donor or independent dataset for sensitivity analysis as shown in Figure S3B–C. We also applied the same criteria to the mouse germ cells for determine gene clusters as shown in Figure S2C–D, and the corresponding gene lists were provided in the Table S4.
The human expressed genes were additionally clustered by their expression level, as used in the Figure 4B. The average expression level (UMI counts) across the spermatogenic cell clusters were used as input. To assign gene groups based on expression levels, we binned the genes by expression level into 9 groups:
Group 1: unexpressed;
Group 2: −inf < log2(UMImean) ≤ −8;
Group 3: −8 < log2(UMImean) ≤ −6;
Group 4: −6 < log2(UMImean) ≤ −4;
Group 5: −4 < log2(UMImean) ≤ −2;
Group 6: −2 < log2(UMImean) ≤ 0;
Group 7: 0 < log2(UMImean) ≤ 2;
Group 8: 2 < log2(UMImean) ≤ 4;
Group 9: 4 < log2(UMImean), highly expressed.
The gene names of each expression-level gene group were provided in the Table S6.
In addition, for modeling the germline variant levels versus expression level, the expression level was further binned into smaller groups. Specifically, log2(UMImean) expression level between −8 and 4 were evenly binned into 100 expression level stages, and the genes within each expression level stage were isolated for calculating the germline variants levels and confidence intervals.
Determine upstream-confounded gene list
As a control analysis in Figure S5E, the genes which have their upstream 5kb region overlapped with an inverse-oriented gene, together termed as upstream-confounded genes, were determined and removed from analyzing the mutation asymmetry scores. These upstream-confounded genes include those genes naturally formed into head-to-head pairs. We extracted the gene feature table from Ensembl 91 (being consistent with the germline variants database), containing chromosome, gene start position, gene end position and strand information for each gene. We sorted the genes by chromosome and then by the gene start sites considering the gene orientation. We then determined the natural bidirectional genes as head-to-head gene pairs with the gap between two gene start sites smaller than 5kb. In addition, we determined the genes which have their upstream 5kb region overlapped with an inverse-oriented gene as confounded genes. Together, we identified 2270 genes forming bidirectional gene pairs, which is ~11.4% of all protein-coding genes, consistent with previous study on bidirectional gene pairs (Trinklein et al., 2004). Together with other genes which have their upstream region overlapped, we identified 4094 upstream-confounded genes. The gene lists of bidirectional gene pairs and all upstream-confounded genes were provided in Table S5.
External scRNA-seq datasets
External scRNA-seq datasets were all downloaded from the public deposit according to the specific instruction from the original publication. Human adult testicular cell scRNA-seq dataset was downloaded from GEO: GSE112013, and the cell type annotation was extracted from the SI Table 1 of the original publication (Guo et al., 2018). Human adult bone marrow hematopoietic cell scRNA-seq datasets were downloaded from GEO: GSE117498 which comes with the cell type annotations (Pellin et al., 2019). Human embryonic midbrain scRNA-seq dataset was downloaded from GEO: GSE76381 which comes with the cell type annotations (La Manno et al., 2016). Human developing cortex scRNA-seq dataset was downloaded from the deposit website of the authors (https://cells.ucsc.edu/cortex-dev/exprMatrix.tsv.gz) and the cell type annotation from the SI Table 3 of the original publication (Nowakowski et al., 2017). Human embryonic kidney (week16) scRNA-seq dataset was downloaded from GEO: GSM3143601, and the cell type annotation comes from the deposit website of the authors (https://home.physics.leidenuniv.nl/~semrau/humanfetalkidneyatlas/) (Hochane et al., 2019).
To count the expressed protein-coding gene numbers of a corresponding cell cluster or scRNA-seq sample type, we used a bootstrap sampling strategy to overcome the technical variance of gene number estimates in different studies. We first binarized the gene expression in a single cell as expressed or unexpressed, defined as >0 or =0 UMI/TPM count. Gene expression in a cell cluster/sample was defined as having expression in at least 5 cells from a random sampling (with replacement) of 1000 cells. According to this definition, the presented numbers in Table S2 represent the average detected protein-coding gene number of bootstrap sampling (with replacement) of 1000 cells for 100 times. Such a strategy overcomes the variance of cell numbers, as well as minimizing the effects of differential sequencing depth between different studies, thus allowing an overall fair comparison of protein-coding gene numbers across different cell/sample types and across studies.
Human and mouse germline variants pre-processing
Human and mouse germline variations were downloaded from the Ensembl release 91 FTP site (ftp://ftp.ensembl.org/pub/release-91/variation/vcf/homo_sapiens/homo_sapiens.vcf.gz and ftp://ftp.ensembl.org/pub/release-91/variation/vcf/mus_musculus/mus_musculus.vcf.gz, respectively). VCF file containing the 1000Genome phase 3 germline variants was downloaded from the Ensembl release 91 FTP site (ftp://ftp.ensembl.org/pub/release-91/variation/vcf/homo_sapiens/1000GENOMES-phase_3.vcf.gz).
We pre-processed the human germline variants in the VCF file (homo_sapiens.vcf) with custom bash and Perl scripts. As a first step, we restricted the germline mutation records to only the source database of dbSNP (dbSNP150) and then restricted the mutation type as single nucleotide variation (TSV=SNV). Second, we removed any SNV records with a minor allele frequency (MAF) higher than 5% so that only to use the SNV records with MAF<0.05 for downstream analysis. This step allows minimizing the effect of positive selection on germline mutational signature analysis. Third, we checked the SNV record information by referring its genome reference allele (ref) to its ancestral allele (AA). Around ~97.7% (303,936,260/311,056,106) of the SNV records are annotated with an ancestral allele. If the annotated reference allele of an SNV record is inconsistent with its AA, we then assigned the ancestral allele as the reference allele of this SNV record while the other allele was assigned as the alternative allele. For example, if an SNV record is annotated as C (ref) to T (alt) but comes with an AA=T, we will then assign this SNV record as a T-to-C mutation instead of a C-to-T mutation. Such a replacement of the reference allele to its ancestral allele affects ~1.5% (4,710,352/311,056,106) of the total SNV records. Fourth, occasionally, an SNV was recorded incorrectly, with swapped reference and alternative bases. These SNVs mostly happen in the pan-telomere region and/or in sex chromosomes. We corrected such SNV records by swapping back the reference and alternative bases according to the human reference genome (hg38). Such incorrect recording affects ~0.067% (210,695/311,056,106) of the total SNV records. Lastly, we extracted the 5’- and 3’-adjacent bases of the reference of each SNV record, in order to generate the triple-base reference allele for each SNV record. Following these five steps, the final output of each SNV record was recorded to include key information of chromosome, location, reference, triple-base reference and mutant base. For example:
| CHR | LOCATION | REF_BASE | TRIPLE_BASE_REF | MUT_BASE |
|---|---|---|---|---|
| 1 | 10039 | A | AAC | C |
The output of 311,056,106 clean SNV records from homo_sapiens.vcf were used for counting SNVs according to gene loci, and the results were used as input for all downstream human germline variants analysis unless specifically stated.
Germline variants from 1000GENOMES-phase_3.vcf were processed in exactly the same way. In total, 1,916,266 out of 77,202,542 SNV records (~2.48%) were corrected according to the ancestral allele and 8 SNV records were corrected according to the hg38 reference genome. The output file containing 77,202,542 SNV records from 1000GENOMES-phase_3.vcf was used as the input data for control analysis as shown in Figure S3E.
In parallel, we applied the same pipelines for the mouse germline SNVs (mus_musculus.vcf). The correction step affected 51 out of the 73,077,311 mouse SNV records. The processed mouse germline SNV records were used for computing germline SNV rates in the downstream analysis.
Counting SNVs according to gene locus
We used a custom bash script and an R script to count the processed SNV records according to specific gene loci. We classified the variants into the six mutation types: (A>T/T>A; A>G/T>C; T>G/A>C; C>T/G>A; G>T/C>A; C>G/G>C). Each mutation type was further distinguished in terms of the coding and the template strands, as previously introduced (Haradhvala et al., 2016). Specifically, we first split the processed SNV records file into mutation type-specific files according to the reference base (single base and triple bases) and mutation base, generating X>Y mutation type files and NXN>Y mutation type files, respectively. Second, we used the “bedmap --count” option in the bedops tool (version 2.4.35) to count the number of SNVs of each mutation type according to specific gene loci. The gene loci used in the analysis include: (1) Gene body, defined as the genomic interval between the gene start site and gene end site as annotated in the GTF file (Ensembl release 91); (2) Upstream 5kb and downstream 5kb regions, each defined according to gene body region and with reference to gene orientation information, respectively; (3) Intron regions, defined as the noncoding regions between coding-exon regions and are not covered by any isoform mRNA. According to this definition, we did not consider introns located in the 5’ - or 3’-UTRs since these introns frequently have regulatory roles which are more likely under selection (Barrett et al., 2012). For intronic regions, we additionally removed the splicing donor/acceptor consensus sequences – 6 bases on the 5’ end (splicing donor region) and 3 bases on the 3’ end (splicing acceptor region) – according to the gene orientation (Matera and Wang, 2014). With these strategies, we selected the intron regions containing the least level of natural selection pressure.
Calculating mutation rates and asymmetry scores
The mutation rates used throughout the paper are generally defined as SNV counts per kilobases, calculated by dividing SNV counts by the reference base counts and then multiply by 1000. According to this definition, the actual number (y-axis in the plots) of the mutation rates would vary between the input file of the processed SNV records, since they have different total numbers of SNVs. Specifically, for germline mutations in total of a given gene locus, the mutation rates were calculated by dividing the sum of all SNVs (regardless of mutation types) by the count of all bases in the locus and then normalized to 1kb. The germline mutation rates of specific mutation type on the coding (Mutcoding) and on the template (Muttemplate) stands were calculated by dividing SNV count by specific reference base count according to the strand information of the gene locus, respectively. The Mutcoding and Muttemplate rates were all normalized to 1000 reference bases.
The asymmetry score of a specific mutation type between the coding strand and template strand of each gene was calculated as log2(Mutcoding/Muttemplate), where the Mutcoding and Muttemplate represents the mutation rates on the coding and template strand, respectively. In rate cases, the asymmetry scores being zero or infinity were removed, since these numbers indicate that Mutcoding or Muttemplate is zero, respectively. The same procedures were also performed on upstream and downstream genomic regions, with the strand specificity (coding strand versus template strand) being assigned in consistent with the corresponding genes.
Analyzing germline variants by gene family
Human gene family annotations were downloaded from the HUGO Gene Nomenclature Committee (https://www.genenames.org/data/genegroup/#!/). In total, 27 families contain more than 100 gene members. These families include: ‘Ankyrin repeat domain containing (ANKRD)’, ‘Armadillo-like helical domain containing (ARMH)’, ‘Basic helix-loop-helix proteins (BHLH)’, ‘BTB domain containing (BTBD)’, ‘Cadherins’, ‘CD molecules (CD)’, ‘EF-hand domain containing’, ‘Fibronectin type III domain containing’, ‘GPCR, Class A rhodopsin-like(excluding OR)’, ‘GPCR, Class A rhodopsin-like(Olfactory receptor)’, ‘Heat shock proteins’, ‘Helicases’, ‘Histones’, ‘Homeoboxes’, ‘Immunoglobulin superfamily domain containing’, channels’, ‘PDZ domain containing (PDZ)’, ‘PHD finger proteins’, ‘Pleckstrin homology domain containing (PLEKH)’, ‘Ras small GTPases superfamily’, ‘Ring finger proteins’, ‘RNA binding motif containing (RBM)’, ‘Solute carriers (SLC)’, ‘WD repeat domain containing (WDR)’, ‘Zinc fingers C2H2-type’, ‘Zinc fingers - other’, ‘T cell receptor gene’. We further selected these gene families by having at least 10 gene members in both expressed and unexpressed categories, as defined above. Additionally, we removed the ‘GPCR, Class A rhodopsin-like(Olfactory receptor)’ family because majority of the genes lack an intron region located between the coding sequences of the gene, preventing us from analyzing the neutral variants. Together these steps led to a list of 9 gene families as shown in Figure 2C and S3K. Germline SNV rates were calculated according to gene body regions (Figure 2C) or intron regions (Figure S3K) for each gene corresponding to a specific gene family.
Somatic cell gene expression analysis
We used the somatic cells determined from the current study to perform the control analysis of somatic cell expressed genes. Considering that the somatic cells are in a smaller fraction among all testicular cells and the cell number varies across somatic cell types, we restricted the set of expressed genes as being expressed in at least 5% of cells in each somatic cell type, or in all somatic cells.
Analyzing germline variants by GTEx expression profiles
The Genotype-Tissue Expression (GTEx, release V7) gene expression profiles used in Figure 2E and S1I across 53 tissue/organ/cell samples were downloaded from the GTEx Portal (https://gtexportal.org/home/datasets/). We used the expression profiles containing the median TPM by tissue (GTEx_Analysis_2016-01-15_v7_RNASeQCv1.1.8_gene_median_tpm.gct.gz ). We first only selected the protein coding genes in the GTEx expression matrix for downstream analysis. In Figure S3I, we used the cutoffs varied from 0.01 to 10 median TPM for counting the number of expressed protein-coding genes in each tissue/organ. To distinguish the expressed genes out of the unexpressed protein-coding genes for each tissue in Figure 2E, we set the cutoff as 0.1 median TPM value as given from the GTEx Portal. For each tissue, a gene was defined as expressed if the expression level was ≥ 0.1, otherwise it was defined as unexpressed. Average germline SNV rates associating with each gene category for each tissue was then calculated and the ratio was further calculated between the unexpressed gene category versus the expressed category. These ratios were plotted as shown in Figure 2E. Z-scores were calculated on these ratios and indicated in the plot.
De novo germline mutations
We selected the single nucleotide DNMs defined from large scale trio-WGS studies on healthy families for extracting the DNMs which do not contain disease-associated biases. The selected datasets come from two large scale WGS studies involving healthy trios: Jonsson et al, 2017 and An et al, 2018. The Jonsson et al, 2017 study included 1,548 trios from Iceland and detected 98,858 single nucleotide DNMs. The An et al, 2018 study included 1,902 trios assigned in the control group and detected 115,870 single nucleotide DNMs. Together, our DNM analysis incorporated 214,728 single nucleotide DNMs determined from the healthy trios. Following that, we applied the DNMs to the same pre-processing steps and counted the DNMs to the gene body of each gene. We then calculated the DNM rates at the gene level (Figure 6A–B) or considering the adjacent sequence contexts (Figure 6C–G). We also compared the mutation rates calculated from population-wide SNVs and DNMs by scaling the DNM rates. The scaling was calculated by multiplying the ratio of total SNV number divided by total DNM number on the coding (Figure 6E) or template (Figure 6F) strand, respectively.
Gene divergence datasets
The sequence divergence datasets of human to apes (chimpanzee, gorilla, bonobo, orangutan and gibbon) were downloaded from Ensembl release 91. Percent divergences in Figure 7 and S7 were calculated as: Divergence = 100% – Identity (human to other apes). dN and dS values were also retrieved from Ensembl and we excluded genes with dN or dS being zero, which would bias the dN/dS calculation. The mean values shown in Figure 7 and S7 were computed after excluding outlier values, where an outlier value was defined as more than three scaled median absolute deviations (MAD) away from the median. For a set of divergence or dN/dS values made up with N genes, MAD is defined as: MAD = median ( |Ai – median(A)| ), for i = 1,2,…,N.
Gene set enrichment analysis of unexpressed genes was done against the fast evolving genes or highly divergent genes. We first calculated the human-to-ape dN/dS values and divergence values, respectively, in a species-specific manner for each gene. Then the dN/dS value or divergence value for each gene was determined by averaging the values across the five ape species (NaN values were ignored in this step). Positive selection genes were determined by having an average dN/dS value > 1.0 across all five human-to-ape comparisons, generating a list of 864 genes. Highly divergent genes were determined as ranking in top 10% of divergence scores across all protein-coding genes, generating a list of 1975 genes.
Gene Ontology analysis
Gene ontology (GO) term analysis were done with GOrilla (Gene Ontology enRIchment anaLysis and visuaLizAtion) online tool (http://cbl-gorilla.cs.technion.ac.il/) (Eden et al., 2009). Target gene lists and background gene lists were provided for performing GO term analysis on Biological Processes. The GOrilla program searches for GO terms enriched in the target gene list compared to the background set using standard hyper geometric statistics. The output GO terms were selected by setting p-value cutoff as <10e-5, generating the lists of GO terms in the Table S7.
Statistical Analysis
Statistical significance was computed by the Mann-Whitney U test (also called rank-sum test) to test whether two groups of genes have distinct value distributions. The significance p-values of multiple tests were adjusted by Bonferroni method accordingly. Error bars in the plots represent 99% percent confidence intervals, calculated by bootstrap method sampling with replacement for 10,000 times on the input values of mutation rates or asymmetry scores of genes. We used default settings of bootci function in MATLAB to calculate the bootstrap confidence interval with bias-corrected and accelerated percentile method. We set ‘alpha’ to 0.01 to calculate 99% bootstrap confidence intervals around the mean values. For coding-template strand mutation rates comparison, we used paired-sample t-test during which the outlier values were replaced with the previous non-outlier value to ensure an approximately normal distribution of the elements. Gene set enrichment p-values of unexpressed genes against the positive selection genes or highly divergent genes were done by hypergeometric test based on the cumulative distribution function (CDF) of the hypergeometric distribution.
DATA AND CODE AVAILABILITY
The single cell RNA-seq results were deposited to NCBI GEO database with the accession code GSE125372. The data analysis codes related to the project are available on Github through the following link: https://github.com/xiabo821/TS_related_scripts.
Supplementary Material
Highlights.
Genes expressed in the testis have reduced germline mutation rates
Germline mutational signature is tuned by spermatogenesis-gene expression levels
Genes not expressed during spermatogenesis are enriched for fast-evolving functions.
A germline mutational signature generated by TCR follows a “3’-pyrimidine rule”.
Acknowledgments
We thank Yael Kramer, Xavier Sanchez and Fang Wang for coordinating the human testicular tissue collection. We thank Molly Przeworski, Hannah Klein, Evgeny Nudler, Matthew Maurano, Jane Skok, Iannis Aifantis, Ziyue Gao, Huiyuan Zhang and the members of the Yanai lab for constructive comments and suggestions to the manuscript. We thank Megan Hogan, Raven Luther and Matthew Maurano for assistance with sequencing. We also thank the anonymous reviewers for providing constructive comments and suggestions. This work was supported by the NYU School of Medicine with funding to I.Y..
Footnotes
Publisher's Disclaimer: This is a PDF file of an unedited manuscript that has been accepted for publication. As a service to our customers we are providing this early version of the manuscript. The manuscript will undergo copyediting, typesetting, and review of the resulting proof before it is published in its final form. Please note that during the production process errors may be discovered which could affect the content, and all legal disclaimers that apply to the journal pertain.
Competing interests
J.D.B is a founder and Director of the following: Neochromosome, Inc., the Center of Excellence for Engineering Biology, and CDI Labs, Inc. and serves or has recently served on the Scientific Advisory Board of the following: Modern Meadow, Inc., Recombinetics, Inc., Sample6, Inc., and Sangamo, Inc. These arrangements are reviewed and managed by the committee on conflict of interest at NYULH. All other authors declare no competing interests.
References
- Acuna-Hidalgo R, Veltman JA, and Hoischen A (2016). New insights into the generation and role of de novo mutations in health and disease. Genome Biol. 17, 241. [DOI] [PMC free article] [PubMed] [Google Scholar]
- Alexandrov LB, Nik-Zainal S, Wedge DC, Aparicio SAJR, Behjati S, Biankin AV, Bignell GR, Bolli N, Borg A, Børresen-Dale A-L, et al. (2013). Signatures of mutational processes in human cancer. Nature 500, 415–421. [DOI] [PMC free article] [PubMed] [Google Scholar]
- An J-Y, Lin K, Zhu L, Werling DM, Dong S, Brand H, Wang HZ, Zhao X, Schwartz GB, Collins RL, et al. (2018). Genome-wide de novo risk score implicates promoter variation in autism spectrum disorder. Science (80−. ). 362. [DOI] [PMC free article] [PubMed] [Google Scholar]
- Arbeithuber B, Betancourt AJ, Ebner T, and Tiemann-Boege I (2015). Crossovers are associated with mutation and biased gene conversion at recombination hotspots. Proc. Natl. Acad. Sci. USA 112, 2109–2114. [DOI] [PMC free article] [PubMed] [Google Scholar]
- Barnes DE, and Lindahl T (2004). Repair and genetic consequences of endogenous DNA base damage in mammalian cells. Annu. Rev. Genet. 38, 445–476. [DOI] [PubMed] [Google Scholar]
- Baron M, Veres A, Wolock SL, Faust AL, Gaujoux R, Vetere A, Ryu JH, Wagner BK, Shen-Orr SS, Klein AM, et al. (2016). A Single-Cell Transcriptomic Map of the Human and Mouse Pancreas Reveals Inter- and Intra-cell Population Structure. Cell Syst. 3, 346–360.e4. [DOI] [PMC free article] [PubMed] [Google Scholar]
- Barrett LW, Fletcher S, and Wilton SD (2012). Regulation of eukaryotic gene expression by the untranslated gene regions and other non-coding elements. Cell Mol. Life Sci. 69, 3613–3634. [DOI] [PMC free article] [PubMed] [Google Scholar]
- Benjamini Y, and Hochberg Y Controlling the False Discovery Rate: A Practical and Powerful Approach to Multiple Testing. [Google Scholar]
- Boehm T (2012). Evolution of vertebrate immunity. Curr. Biol. 22, R722–32. [DOI] [PubMed] [Google Scholar]
- Brawand D, Soumillon M, Necsulea A, Julien P, Csárdi G, Harrigan P, Weier M, Liechti A, Aximu-Petri A, Kircher M, et al. (2011). The evolution of gene expression levels in mammalian organs. Nature 478, 343–348. [DOI] [PubMed] [Google Scholar]
- Buenrostro JD, Giresi PG, Zaba LC, Chang HY, and Greenleaf WJ (2013). Transposition of native chromatin for fast and sensitive epigenomic profiling of open chromatin, DNA-binding proteins and nucleosome position. Nat. Methods 10, 1213–1218. [DOI] [PMC free article] [PubMed] [Google Scholar]
- Buganim Y, Itskovich E, Hu Y-C, Cheng AW, Ganz K, Sarkar S, Fu D, Welstead GG, Page DC, and Jaenisch R (2012). Direct reprogramming of fibroblasts into embryonic Sertoli-like cells by defined factors. Cell Stem Cell 11, 373–386. [DOI] [PMC free article] [PubMed] [Google Scholar]
- Campbell CD, and Eichler EE (2013). Properties and rates of germline mutations in humans. Trends Genet. 29, 575–584. [DOI] [PMC free article] [PubMed] [Google Scholar]
- Cervantes RB, Stringer JR, Shao C, Tischfield JA, and Stambrook PJ (2002). Embryonic stem cells and somatic cells differ in mutation frequency and type. Proc. Natl. Acad. Sci. USA 99, 3586–3590. [DOI] [PMC free article] [PubMed] [Google Scholar]
- Chang Y-F, Lee-Chang JS, Panneerdoss S, MacLean JA, and Rao MK (2011). Isolation of Sertoli, Leydig, and spermatogenic cells from the mouse testis. BioTechniques 51, , 344. [DOI] [PMC free article] [PubMed] [Google Scholar]
- Chen C, Qi H, Shen Y, Pickrell J, and Przeworski M (2017). Contrasting determinants of mutation rates in germline and soma. Genetics 207, 255–267. [DOI] [PMC free article] [PubMed] [Google Scholar]
- Chen L-Y, Willis WD, and Eddy EM (2016). Targeting the Gdnf Gene in peritubular myoid cells disrupts undifferentiated spermatogonial cell development. Proc. Natl. Acad. Sci. USA 113, 1829–1834. [DOI] [PMC free article] [PubMed] [Google Scholar]
- Cleaver JE (2017). Transcription coupled repair deficiency protects against human mutagenesis and carcinogenesis: Personal Reflections on the 50th anniversary of the discovery of xeroderma pigmentosum. DNA Repair (Amst) 58, 21–28. [DOI] [PubMed] [Google Scholar]
- Core LJ, Waterfall JJ, and Lis JT (2008). Nascent RNA sequencing reveals widespread pausing and divergent initiation at human promoters. Science(80-. ). 322, 1845–1848. [DOI] [PMC free article] [PubMed] [Google Scholar]
- DeFalco T, Potter SJ, Williams AV, Waller B, Kan MJ, and Capel B (2015). Macrophages contribute to the spermatogonial niche in the adult testis. Cell Rep. 12, 1107–1119. [DOI] [PMC free article] [PubMed] [Google Scholar]
- Djureinovic D, Fagerberg L, Hallström B, Danielsson A, Lindskog C, Uhlén M, and Pontén F (2014). The human testis-specific proteome defined by transcriptomics and antibody-based profiling. Mol. Hum. Reprod 20, 476–488. [DOI] [PubMed] [Google Scholar]
- Dobin A, Davis CA, Schlesinger F, Drenkow J, Zaleski C, Jha S, Batut P, Chaisson M, and Gingeras TR (2013). STAR: ultrafast universal RNA-seq aligner. Bioinformatics 29, 15–21. [DOI] [PMC free article] [PubMed] [Google Scholar]
- Drummond DA, Bloom JD, Adami C, Wilke CO, and Arnold FH (2005). Why highly expressed proteins evolve slowly. Proc. Natl. Acad. Sci. USA 102, 14338–14343. [DOI] [PMC free article] [PubMed] [Google Scholar]
- Duncan BK, and Miller JH (1980). Mutagenic deamination of cytosine residues in DNA. Nature 287, 560–561. [DOI] [PubMed] [Google Scholar]
- Duttke SHC, Lacadie SA, Ibrahim MM, Glass CK, Corcoran DL, Benner C, Heinz S, Kadonaga JT, and Ohler U (2015). Human promoters are intrinsically directional. Mol. Cell 57, 674–684. [DOI] [PMC free article] [PubMed] [Google Scholar]
- Eden E, Navon R, Steinfeld I, Lipson D, and Yakhini Z (2009). GOrilla: a tool for discovery and visualization of enriched GO terms in ranked gene lists. BMC Bioinformatics 10, 48. [DOI] [PMC free article] [PubMed] [Google Scholar]
- Efroni S, Duttagupta R, Cheng J, Dehghani H, Hoeppner DJ, Dash C, Bazett-Jones DP, Le Grice S, McKay RDG, Buetow KH, et al. (2008). Global transcription in pluripotent embryonic stem cells. Cell Stem Cell 2, 437–447. [DOI] [PMC free article] [PubMed] [Google Scholar]
- Flajnik MF, and Kasahara M (2010). Origin and evolution of the adaptive immune system: genetic events and selective pressures. Nat. Rev. Genet. 11, 47–59. [DOI] [PMC free article] [PubMed] [Google Scholar]
- Frenette G, Thabet M, and Sullivan R (2006). Polyol pathway in human epididymis and semen. J Androl 27, 233–239. [DOI] [PubMed] [Google Scholar]
- Frumkin I, Schirman D, Rotman A, Li F, Zahavi L, Mordret E, Asraf O, Wu S, Levy SF, and Pilpel Y (2017). Gene Architectures that Minimize Cost of Gene Expression. Mol. Cell 65, 142–153. [DOI] [PMC free article] [PubMed] [Google Scholar]
- Gonzalez-Perez A, Sabarinathan R, and Lopez-Bigas N (2019). Local determinants of the mutational landscape of the human genome. Cell 177, 101–114. [DOI] [PubMed] [Google Scholar]
- Good JM, and Nachman MW (2005). Rates of protein evolution are positively correlated with developmental timing of expression during mouse spermatogenesis. Mol. Biol. Evol 22, 1044–1052. [DOI] [PubMed] [Google Scholar]
- Gray KA, Seal RL, Tweedie S, Wright MW, and Bruford EA (2016). A review of the new HGNC gene family resource. Hum. Genomics 10, 6. [DOI] [PMC free article] [PubMed] [Google Scholar]
- Consortium GTEx (2015). Human genomics. The Genotype-Tissue Expression (GTEx) pilot analysis: multitissue gene regulation in humans. Science(80-. ). 348, 648–660. [DOI] [PMC free article] [PubMed] [Google Scholar]
- Guo J, Grow EJ, Mlcochova H, Maher GJ, Lindskog C, Nie X, Guo Y, Takei Y, Yun J, Cai L, et al. (2018). The adult human testis transcriptional cell atlas. Cell Res. 28, 1141–1157. [DOI] [PMC free article] [PubMed] [Google Scholar]
- Hammoud SS, Low DHP, Yi C, Carrell DT, Guccione E, and Cairns BR (2014). Chromatin and transcription transitions of mammalian adult germline stem cells and spermatogenesis. Cell Stem Cell 15, 239–253. [DOI] [PubMed] [Google Scholar]
- Hanawalt PC, and Spivak G (2008). Transcription-coupled DNA repair: two decades of progress and surprises. Nat. Rev. Mol. Cell Biol. 9, 958–970. [DOI] [PubMed] [Google Scholar]
- Haradhvala NJ, Polak P, Stojanov P, Covington KR, Shinbrot E, Hess JM, Rheinbay E, Kim J, Maruvka YE, Braunstein LZ, et al. (2016). Mutational strand asymmetries in cancer genomes reveal mechanisms of DNA damage and repair. Cell 164, 538–549. [DOI] [PMC free article] [PubMed] [Google Scholar]
- Hashimshony T, Senderovich N, Avital G, Klochendler A, de Leeuw Y, Anavy L, Gennert D, Li S, Livak KJ, Rozenblatt-Rosen O, et al. (2016). CEL-Seq2: sensitive highly-multiplexed single-cell RNA-Seq. Genome Biol. 17, 77. [DOI] [PMC free article] [PubMed] [Google Scholar]
- Helleday T, Eshtad S, and Nik-Zainal S (2014). Mechanisms underlying mutational signatures in human cancers. Nat. Rev. Genet 15, 585–598. [DOI] [PMC free article] [PubMed] [Google Scholar]
- Hermann BP, Cheng K, Singh A, Roa-De La Cruz L, Mutoji KN, Chen I-C, Gildersleeve H, Lehle JD, Mayo M, Westernströer B, et al. (2018). The Mammalian Spermatogenesis Single-Cell Transcriptome, from Spermatogonial Stem Cells to Spermatids. Cell Rep. 25, 1650–1667.e8. [DOI] [PMC free article] [PubMed] [Google Scholar]
- Hochane M, van den Berg PR, Fan X, Bérenger-Currias N, Adegeest E, Bialecka M, Nieveen M, Menschaart M, Chuva de Sousa Lopes SM, and Semrau S (2019). Single-cell transcriptomics reveals gene expression dynamics of human fetal kidney development. PLoS Biol. 17, e3000152. [DOI] [PMC free article] [PubMed] [Google Scholar]
- Huang L, Yuan Z, Yu J, and Zhou T (2015). Fundamental principles of energy consumption for gene expression. Chaos 25, 123101. [DOI] [PubMed] [Google Scholar]
- Jinks-Robertson S, and Bhagwat AS (2014). Transcription-associated mutagenesis. Annu. Rev. Genet. 48, 341–359. [DOI] [PMC free article] [PubMed] [Google Scholar]
- Johnston DS, Wright WW, Dicandeloro P, Wilson E, Kopf GS, and Jelinsky SA (2008). Stage-specific gene expression is a fundamental characteristic of rat spermatogenic cells and Sertoli cells. Proc. Natl. Acad. Sci. USA 105, 8315–8320. [DOI] [PMC free article] [PubMed] [Google Scholar]
- Jónsson H, Sulem P, Kehr B, Kristmundsdottir S, Zink F, Hjartarson E, Hardarson MT, Hjorleifsson KE, Eggertsson HP, Gudjonsson SA, et al. (2017). Parental influence on human germline de novo mutations in 1,548 trios from Iceland. Nature 549, 519–522. [DOI] [PubMed] [Google Scholar]
- Kanatsu-Shinohara M, and Shinohara T (2013). Spermatogonial stem cell self-renewal and development. Annu. Rev. Cell Dev. Biol. 29, 163–187. [DOI] [PubMed] [Google Scholar]
- Kleene KC (2001). A possible meiotic function of the peculiar patterns of gene expression in mammalian spermatogenic cells. Mech. Dev 106, 3–23. [DOI] [PubMed] [Google Scholar]
- Kleene KC (2003). Patterns, mechanisms, and functions of translation regulation in mammalian spermatogenic cells. Cytogenet Genome Res 103, 217–224. [DOI] [PubMed] [Google Scholar]
- Klein AM, Mazutis L, Akartuna I, Tallapragada N, Veres A, Li V, Peshkin L, Weitz DA, and Kirschner MW (2015). Droplet barcoding for single-cell transcriptomics applied to embryonic stem cells. Cell 161, 1187–1201. [DOI] [PMC free article] [PubMed] [Google Scholar]
- Kodinariya TM, and Makwana PR (2013). Review on determining number of Cluster in K-Means Clustering. International Journal. [Google Scholar]
- Kong A, Frigge ML, Masson G, Besenbacher S, Sulem P, Magnusson G, Gudjonsson SA, Sigurdsson A, Jonasdottir A, Jonasdottir A, et al. (2012). Rate of de novo mutations and the importance of father’s age to disease risk. Nature 488, 471–475. [DOI] [PMC free article] [PubMed] [Google Scholar]
- Von Kopylow K, and Spiess A-N (2017). Human spermatogonial markers. Stem Cell Res. 25, 300–309. [DOI] [PubMed] [Google Scholar]
- Krokan HE, and Bjørås M (2013). Base excision repair. Cold Spring Harb. Perspect. Biol. 5, a012583. [DOI] [PMC free article] [PubMed] [Google Scholar]
- Lynch M, and Marinov GK (2015). The bioenergetic costs of a gene. Proc. Natl. Acad. Sci. USA 112, 15690–15695. [DOI] [PMC free article] [PubMed] [Google Scholar]
- Makova KD, and Li W-H (2002). Strong male-driven evolution of DNA sequences in humans and apes. Nature 416, 624–626. [DOI] [PubMed] [Google Scholar]
- Mali P, Kaipia A, Kangasniemi M, Toppari J, Sandberg M, Hecht NB, and Parvinen M (1989). Stage-specific expression of nucleoprotein mRNAs during rat and mouse spermiogenesis. Reprod Fertil Dev 1,369–382. [DOI] [PubMed] [Google Scholar]
- La Manno G, Gyllborg D, Codeluppi S, Nishimura K, Salto C, Zeisel A, Borm LE, Stott SRW, Toledo EM, Villaescusa JC, et al. (2016). Molecular diversity of midbrain development in mouse, human, and stem cells. Cell 167, 566–580.e19. [DOI] [PMC free article] [PubMed] [Google Scholar]
- La Manno G, Soldatov R, Zeisel A, Braun E, Hochgemer H, Petukhov V, Lidschreiber K, Kastriti ME, Lönnerberg P, Furlan A, et al. (2018). RNA velocity of single cells. Nature 560, 494–498. [DOI] [PMC free article] [PubMed] [Google Scholar]
- Matera AG, and Wang Z (2014). A day in the life of the spliceosome. Nat. Rev. Mol. Cell Biol 15, 108–121. [DOI] [PMC free article] [PubMed] [Google Scholar]
- Melé M, Ferreira PG, Reverter F, DeLuca DS, Monlong J, Sammeth M, Young TR, Goldmann JM, Pervouchine DD, Sullivan TJ, et al. (2015). The human transcriptome across tissues and individuals. Science(80-. ). 348, 660–665. [DOI] [PMC free article] [PubMed] [Google Scholar]
- Menoni H, Wienholz F, Theil AF, Janssens RC, Lans H, Campalans A, Radicella JP, Marteijn JA, and Vermeulen W (2018). The transcription-coupled DNA repair-initiating protein CSB promotes XRCC1 recruitment to oxidative DNA damage. Nucleic Acids Res. 46, 7747–7756. [DOI] [PMC free article] [PubMed] [Google Scholar]
- Miyata H, Castaneda JM, Fujihara Y, Yu Z, Archambeault DR, Isotani A, Kiyozumi D, Kriseman ML, Mashiko D, Matsumura T, et al. (2016). Genome engineering uncovers 54 evolutionarily conserved and testis-enriched genes that are not required for male fertility in mice. Proc. Natl. Acad. Sci. USA 113, 7704–7710. [DOI] [PMC free article] [PubMed] [Google Scholar]
- Mugal CF, von Grünberg H-H, and Peifer M (2009). Transcription-induced mutational strand bias and its effect on substitution rates in human genes. Mol. Biol. Evol. 26, 131–142. [DOI] [PubMed] [Google Scholar]
- Nachman MW, and Crowell SL (2000). Estimate of the mutation rate per nucleotide in humans. Genetics 156, 297–304. [DOI] [PMC free article] [PubMed] [Google Scholar]
- Naro C, Jolly A, Di Persio S, Bielli P, Setterblad N, Alberdi AJ, Vicini E, Geremia R, De la Grange P, and Sette C (2017). An Orchestrated Intron Retention Program in Meiosis Controls Timely Usage of Transcripts during Germ Cell Differentiation. Dev. Cell 41, 82–93.e4. [DOI] [PMC free article] [PubMed] [Google Scholar]
- Necsulea A, and Kaessmann H (2014). Evolutionary dynamics of coding and non-coding transcriptomes. Nat. Rev. Genet. 15, 734–748. [DOI] [PubMed] [Google Scholar]
- Nei M (2005). Selectionism and neutralism in molecular evolution. Mol. Biol. Evol 22, 2318–2342. [DOI] [PMC free article] [PubMed] [Google Scholar]
- Nei M (2013). Mutation-driven evolution. Oxford University Press. [Google Scholar]
- Nei M, Suzuki Y, and Nozawa M (2010). The neutral theory of molecular evolution in the genomic era. Annu. Rev. Genomics. Hum. Genet. 11, 265–289. [DOI] [PubMed] [Google Scholar]
- Nowakowski TJ, Bhaduri A, Pollen AA, Alvarado B, Mostajo-Radji MA, Di Lullo E, Haeussler M, Sandoval-Espinosa C, Liu SJ, Velmeshev D, et al. (2017). Spatiotemporal gene expression trajectories reveal developmental hierarchies of the human cortex. Science [ISP CHECK](80-. ). 358, 1318–1323. [DOI] [PMC free article] [PubMed] [Google Scholar]
- Pál C, Papp B, and Hurst LD (2001). Highly expressed genes in yeast evolve slowly. Genetics 158, 927–931. [DOI] [PMC free article] [PubMed] [Google Scholar]
- Paoli D, Pelloni M, Gallo M, Coltrinari G, Lombardo F, Lenzi A, and Gandini L (2017). Sperm glyceraldehyde 3-phosphate dehydrogenase gene expression in asthenozoospermic spermatozoa. Asian J Androl 19, 409–413. [DOI] [PMC free article] [PubMed] [Google Scholar]
- Park C, Qian W, and Zhang J (2012). Genomic evidence for elevated mutation rates in highly expressed genes. EMBO Rep. 13, 1123–1129. [DOI] [PMC free article] [PubMed] [Google Scholar]
- Pelechano V, and Steinmetz LM (2013). Gene regulation by antisense transcription. Nat. Rev. Genet. 14, 880–893. [DOI] [PubMed] [Google Scholar]
- Pellin D, Loperfido M, Baricordi C, Wolock SL, Montepeloso A, Weinberg OK, Biffi A, Klein AM, and Biasco L (2019). A comprehensive single cell transcriptional landscape of human hematopoietic progenitors. Nat Commun 10, 2395. [DOI] [PMC free article] [PubMed] [Google Scholar]
- Petukhov V, Guo J, Baryawno N, Severe N, Scadden DT, Samsonova MG, and Kharchenko PV (2018). dropEst: pipeline for accurate estimation of molecular counts in droplet-based single-cell RNA-seq experiments. Genome Biol. 19, 78. [DOI] [PMC free article] [PubMed] [Google Scholar]
- Polak P, Karlić R, Koren A, Thurman R, Sandstrom R, Lawrence M, Reynolds A, Rynes E, Vlahoviček K, Stamatoyannopoulos JA, et al. (2015). Cell-of-origin chromatin organization shapes the mutational landscape of cancer. Nature 518, 360–364. [DOI] [PMC free article] [PubMed] [Google Scholar]
- Potter SJ, and DeFalco T (2017). Role of the testis interstitial compartment in spermatogonial stem cell function. Reproduction 153, R151–R162. [DOI] [PMC free article] [PubMed] [Google Scholar]
- Proudfoot NJ (2016). Transcriptional termination in mammals: Stopping the RNA polymerase II juggernaut. Science [ISP CHECK](80-. ). 352, aad9926. [DOI] [PMC free article] [PubMed] [Google Scholar]
- Qiu X, Mao Q, Tang Y, Wang L, Chawla R, Pliner HA, and Trapnell C (2017). Reversed graph embedding resolves complex single-cell trajectories. Nat. Methods 14, 979–982. [DOI] [PMC free article] [PubMed] [Google Scholar]
- Rathke C, Baarends WM, Awe S, and Renkawitz-Pohl R (2014). Chromatin dynamics during spermiogenesis. Biochim. Biophys. Acta 1839, 155–168. [DOI] [PubMed] [Google Scholar]
- Rebourcet D, Wu J, Cruickshanks L, Smith SE, Milne L, Fernando A, Wallace RJ, Gray CD, Hadoke PWF, Mitchell RT, et al. (2016). Sertoli cells modulate testicular vascular network development, structure, and function to influence circulating testosterone concentrations in adult male mice. Endocrinology 157, 2479–2488. [DOI] [PMC free article] [PubMed] [Google Scholar]
- Schmidt EE (1996). Transcriptional promiscuity in testes. Curr. Biol. 6, 768–769. [DOI] [PubMed] [Google Scholar]
- Schmidt EE, and Schibler U (1995). High accumulation of components of the RNA polymerase II transcription machinery in rodent spermatids. Development 121, 2373–2383. [DOI] [PubMed] [Google Scholar]
- Schuster-Böckler B, and Lehner B (2012). Chromatin organization is a major influence on regional mutation rates in human cancer cells. Nature 488, 504–507. [DOI] [PubMed] [Google Scholar]
- Ségurel L, Wyman MJ, and Przeworski M (2014). Determinants of mutation rate variation in the human germline. Annu. Rev. Genomics. Hum. Genet. 15, 47–70. [DOI] [PubMed] [Google Scholar]
- Selvaraj V, Asano A, Page JL, Nelson JL, Kothapalli KSD, Foster JA, Brenna JT, Weiss RS, and Travis AJ (2010). Mice lacking FABP9/PERF15 develop sperm head abnormalities but are fertile. Dev. Biol. 348, 177–189. [DOI] [PMC free article] [PubMed] [Google Scholar]
- Sharma R, and Agarwal A (2011). Spermatogenesis: An Overview In Sperm Chromatin, Zini A, and Agarwal A, eds. (New York, NY: Springer New York; ), pp. 19–44. [Google Scholar]
- Singh RS, Xu J, and Kulathinal RJ (2012). Rapidly evolving genes and genetic systems. Oxford University Press. [Google Scholar]
- Sohni A, Tan K, Song H-W, Burow D, de Rooij DG, Laurent L, Hsieh T-C, Rabah R, Hammoud SS, Vicini E, et al. (2019). The Neonatal and Adult Human Testis Defined at the Single-Cell Level. Cell Rep. 26, 1501–1517.e4. [DOI] [PMC free article] [PubMed] [Google Scholar]
- Soumillon M, Necsulea A, Weier M, Brawand D, Zhang X, Gu H, Barthés P, Kokkinaki M, Nef S, Gnirke A, et al. (2013). Cellular source and mechanisms of high transcriptome complexity in the mammalian testis. Cell Rep. 3, 2179–2190. [DOI] [PubMed] [Google Scholar]
- Supek F, and Lehner B (2017). Clustered Mutation Signatures Reveal that Error-Prone DNA Repair Targets Mutations to Active Genes. Cell 170, 534–547.e23. [DOI] [PubMed] [Google Scholar]
- Trinklein ND, Aldred SF, Hartman SJ, Schroeder DI, Otillar RP, and Myers RM (2004). An abundance of bidirectional promoters in the human genome. Genome Res. 14, 62–66. [DOI] [PMC free article] [PubMed] [Google Scholar]
- Tubbs A, and Nussenzweig A (2017). Endogenous DNA damage as a source of genomic instability in cancer. Cell 168, 644–656. [DOI] [PMC free article] [PubMed] [Google Scholar]
- Valli H, Sukhwani M, Dovey SL, Peters KA, Donohue J, Castro CA, Chu T, Marshall GR, and Orwig KE (2014). Fluorescence and magnetic-activated cell sorting strategies to isolate and enrich human spermatogonial stem cells. Fertil. Steril. 102, 566–580.e7. [DOI] [PMC free article] [PubMed] [Google Scholar]
- Vermeulen W, and Fousteri M (2013). Mammalian transcription-coupled excision repair. Cold Spring Harb. Perspect. Biol. 5, a012625. [DOI] [PMC free article] [PubMed] [Google Scholar]
- Wagner F, Yan Y, and Yanai I (2017). K-nearest neighbor smoothing for high-throughput single-cell RNA-Seq data. BioRxiv. [Google Scholar]
- Wang D, Eraslan B, Wieland T, Hallström B, Hopf T, Zolg DP, Zecha J, Asplund A, Li L-H, Meng C, et al. (2019). A deep proteome and transcriptome abundance atlas of 29 healthy human tissues. Mol. Syst. Biol. 15, e8503. [DOI] [PMC free article] [PubMed] [Google Scholar]
- Wang M, Liu X, Chang G, Chen Y, An G, Yan L, Gao S, Xu Y, Cui Y, Dong J, et al. (2018). Single-Cell RNA Sequencing Analysis Reveals Sequential Cell Fate Transition during Human Spermatogenesis. Cell Stem Cell 23, 599–614.e4. [DOI] [PubMed] [Google Scholar]
- Werner A, Piatek MJ, and Mattick JS (2015). Transpositional shuffling and quality control in male germ cells to enhance evolution of complex organisms. Ann. N. Y. Acad. Sci. 1341, 156–163. [DOI] [PMC free article] [PubMed] [Google Scholar]
- Witt E, Benjamin S, Svetec N, and Zhao L (2019). Testis single-cell RNA-seq reveals the dynamics of de novo gene transcription and germline mutational bias in Drosophila. Elife 8. [DOI] [PMC free article] [PubMed] [Google Scholar]
- Yan W, Ma L, Burns KH, and Matzuk MM (2003). HILS1 is a spermatid-specific linker histone H1-like protein implicated in chromatin remodeling during mammalian spermiogenesis. Proc. Natl. Acad. Sci. USA 100, 10546–10551. [DOI] [PMC free article] [PubMed] [Google Scholar]
- Ye L, Li X, Li L, Chen H, and Ge R-S (2017). Insights into the Development of the Adult Leydig Cell Lineage from Stem Leydig Cells. Front. Physiol. 8, 430. [DOI] [PMC free article] [PubMed] [Google Scholar]
- Yehuda Y, Blumenfeld B, Mayorek N, Makedonski K, Vardi O, Cohen-Daniel L, Mansour Y, Baror-Sebban S, Masika H, Farago M, et al. (2018). Germline DNA replication timing shapes mammalian genome composition. Nucleic Acids Res. 46, 8299–8310. [DOI] [PMC free article] [PubMed] [Google Scholar]
- Zerbino DR, Achuthan P, Akanni W, Amode MR, Barrell D, Bhai J, Billis K, Cummins C, Gall A, Girón CG, et al. (2018). Ensembl 2018. Nucleic Acids Res. 46, D754–D761. [DOI] [PMC free article] [PubMed] [Google Scholar]
Associated Data
This section collects any data citations, data availability statements, or supplementary materials included in this article.
Supplementary Materials
Data Availability Statement
The single cell RNA-seq results were deposited to NCBI GEO database with the accession code GSE125372. The data analysis codes related to the project are available on Github through the following link: https://github.com/xiabo821/TS_related_scripts.