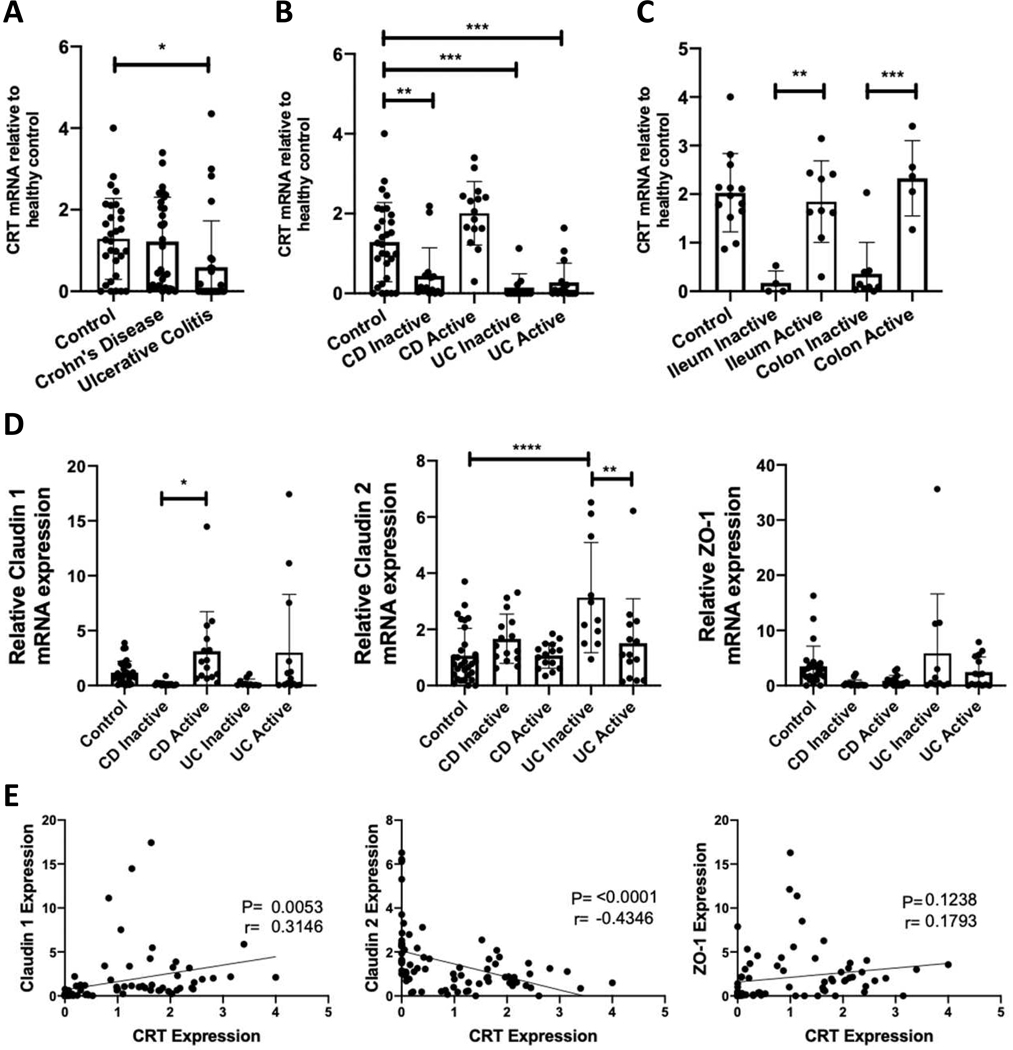
Figure 6. CRT and TJ expression profile in intestinal biopsies from IBD patients.
A. CRT expression was measured relative to actin by qPCR from patient biopsy samples obtained from the University of Colorado IBD biobank. B and C. The data from these samples were then sorted based on disease activity and biopsy location respectively. D. Evaluation of Claudin 1, Claudin 2 and ZO-1 by qPCR from the same patients was also conducted. E. Relative CRT expression was plotted vs relative TJ mRNA expression for each patient and a linear regression analysis was conducted. *p<0.05, **p<0.01, ***p<0.001, determined by one-way ANOVA and Pearson correlation.

