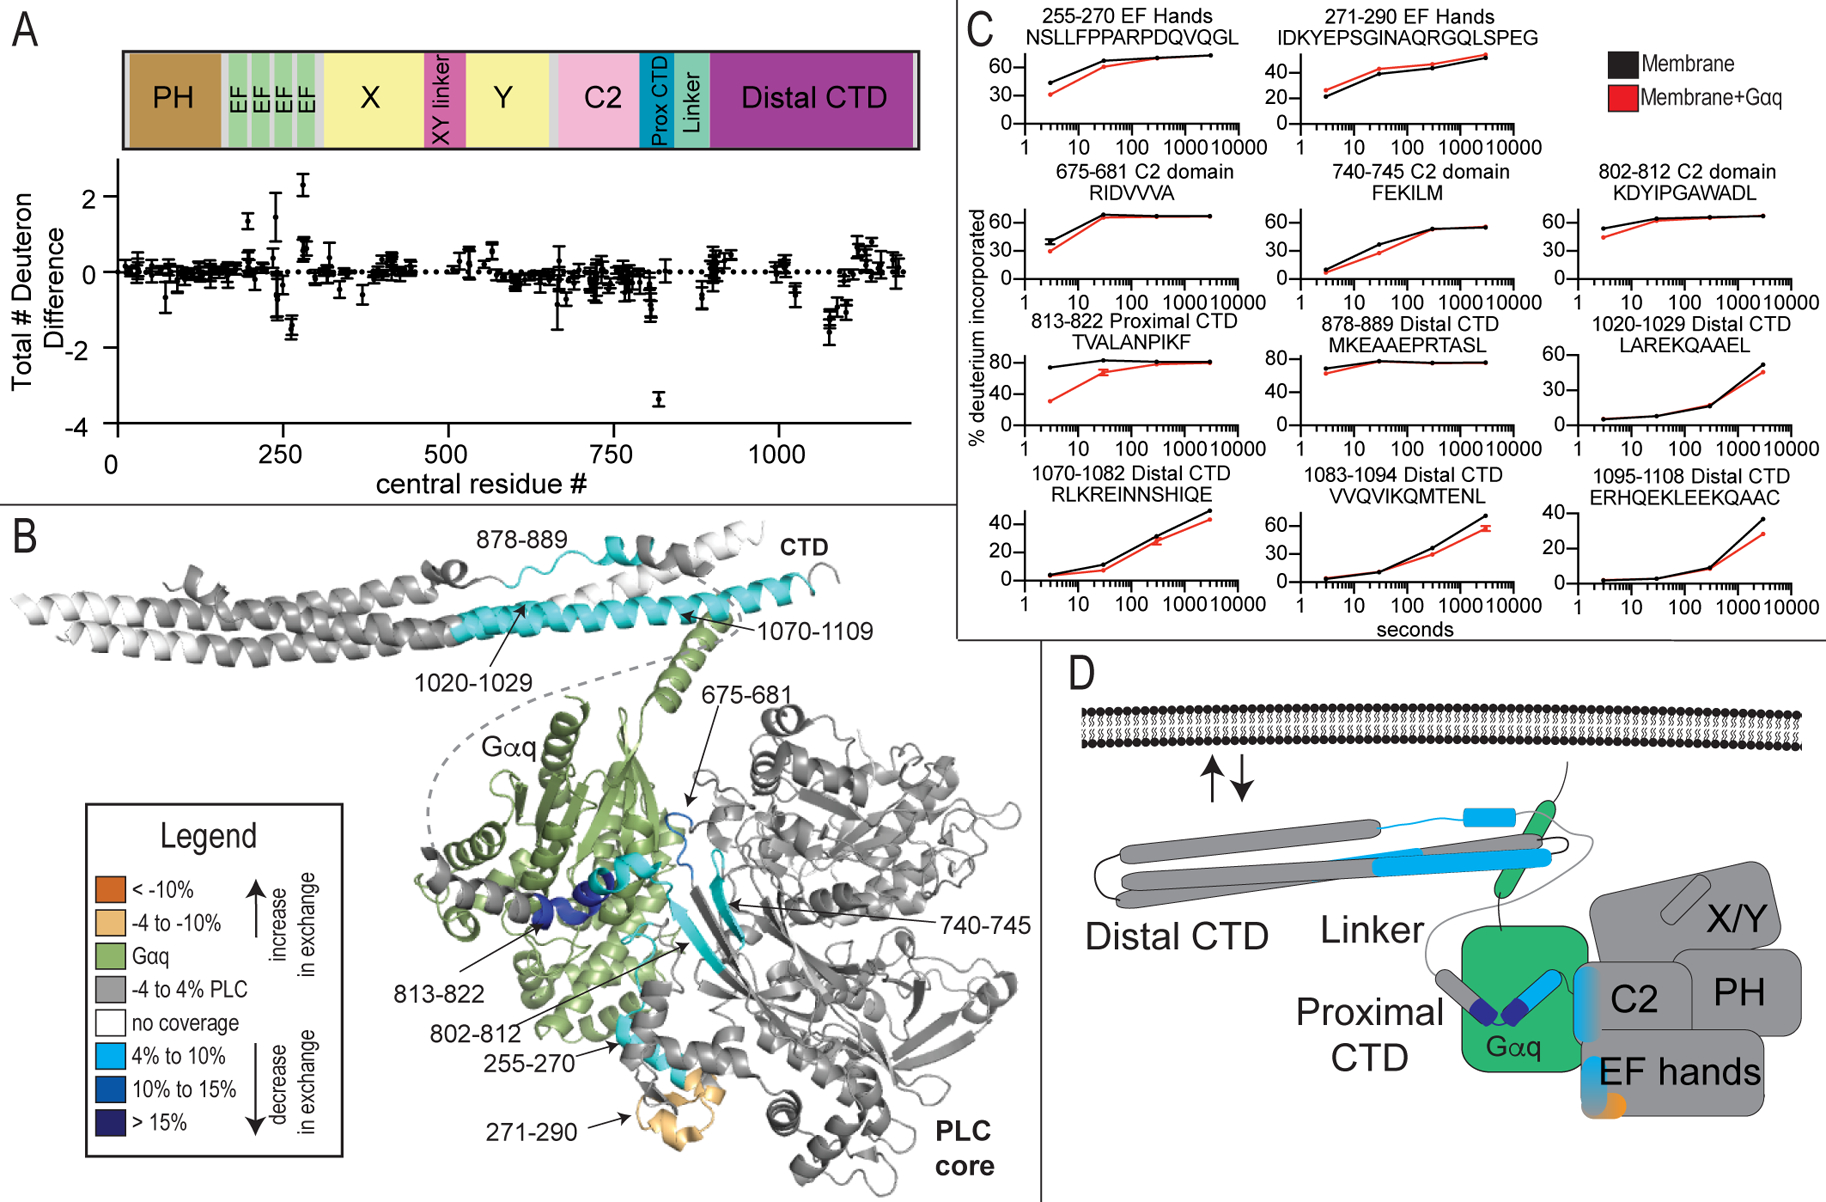
Figure 3. Gαq dependent changes in PLCβ2 dynamics.

(A) The total number of deuteron difference between membrane and membrane-Gαq states for all peptides analyzed over the entire deuterium exchange time course for PLCβ2. Every point represents the centroid of an individual peptide. Error bars represent S.D. (n=3).
(B) Peptides with significant changes in deuterium incorporation (both >0.4 Da and >4% and T-test p < 0.05 at time point) in the presence of Gαq are mapped on a structural model of PLCβ2 as described in Fig. 1. Differences are mapped according to the legend.
(C) Representative PLCβ2 peptides displaying significant increases or decreases in exchange in the presence of Gαq are shown. For all peptides, error bars show SD (n=3), with most smaller than the size of the point. The full list of all peptides and their deuterium incorporation is shown in Data S1.
(D) Cartoon schematic displaying deuterium exchange differences on a model of Gαq binding.
